Daily technical analysis and forecast for 17 December 2025
Here is a detailed daily technical analysis and forecast for EURUSD, USDJPY, GBPUSD, AUDUSD, USDCAD, XAUUSD and Brent for 17 December 2025.
EURUSD forecast
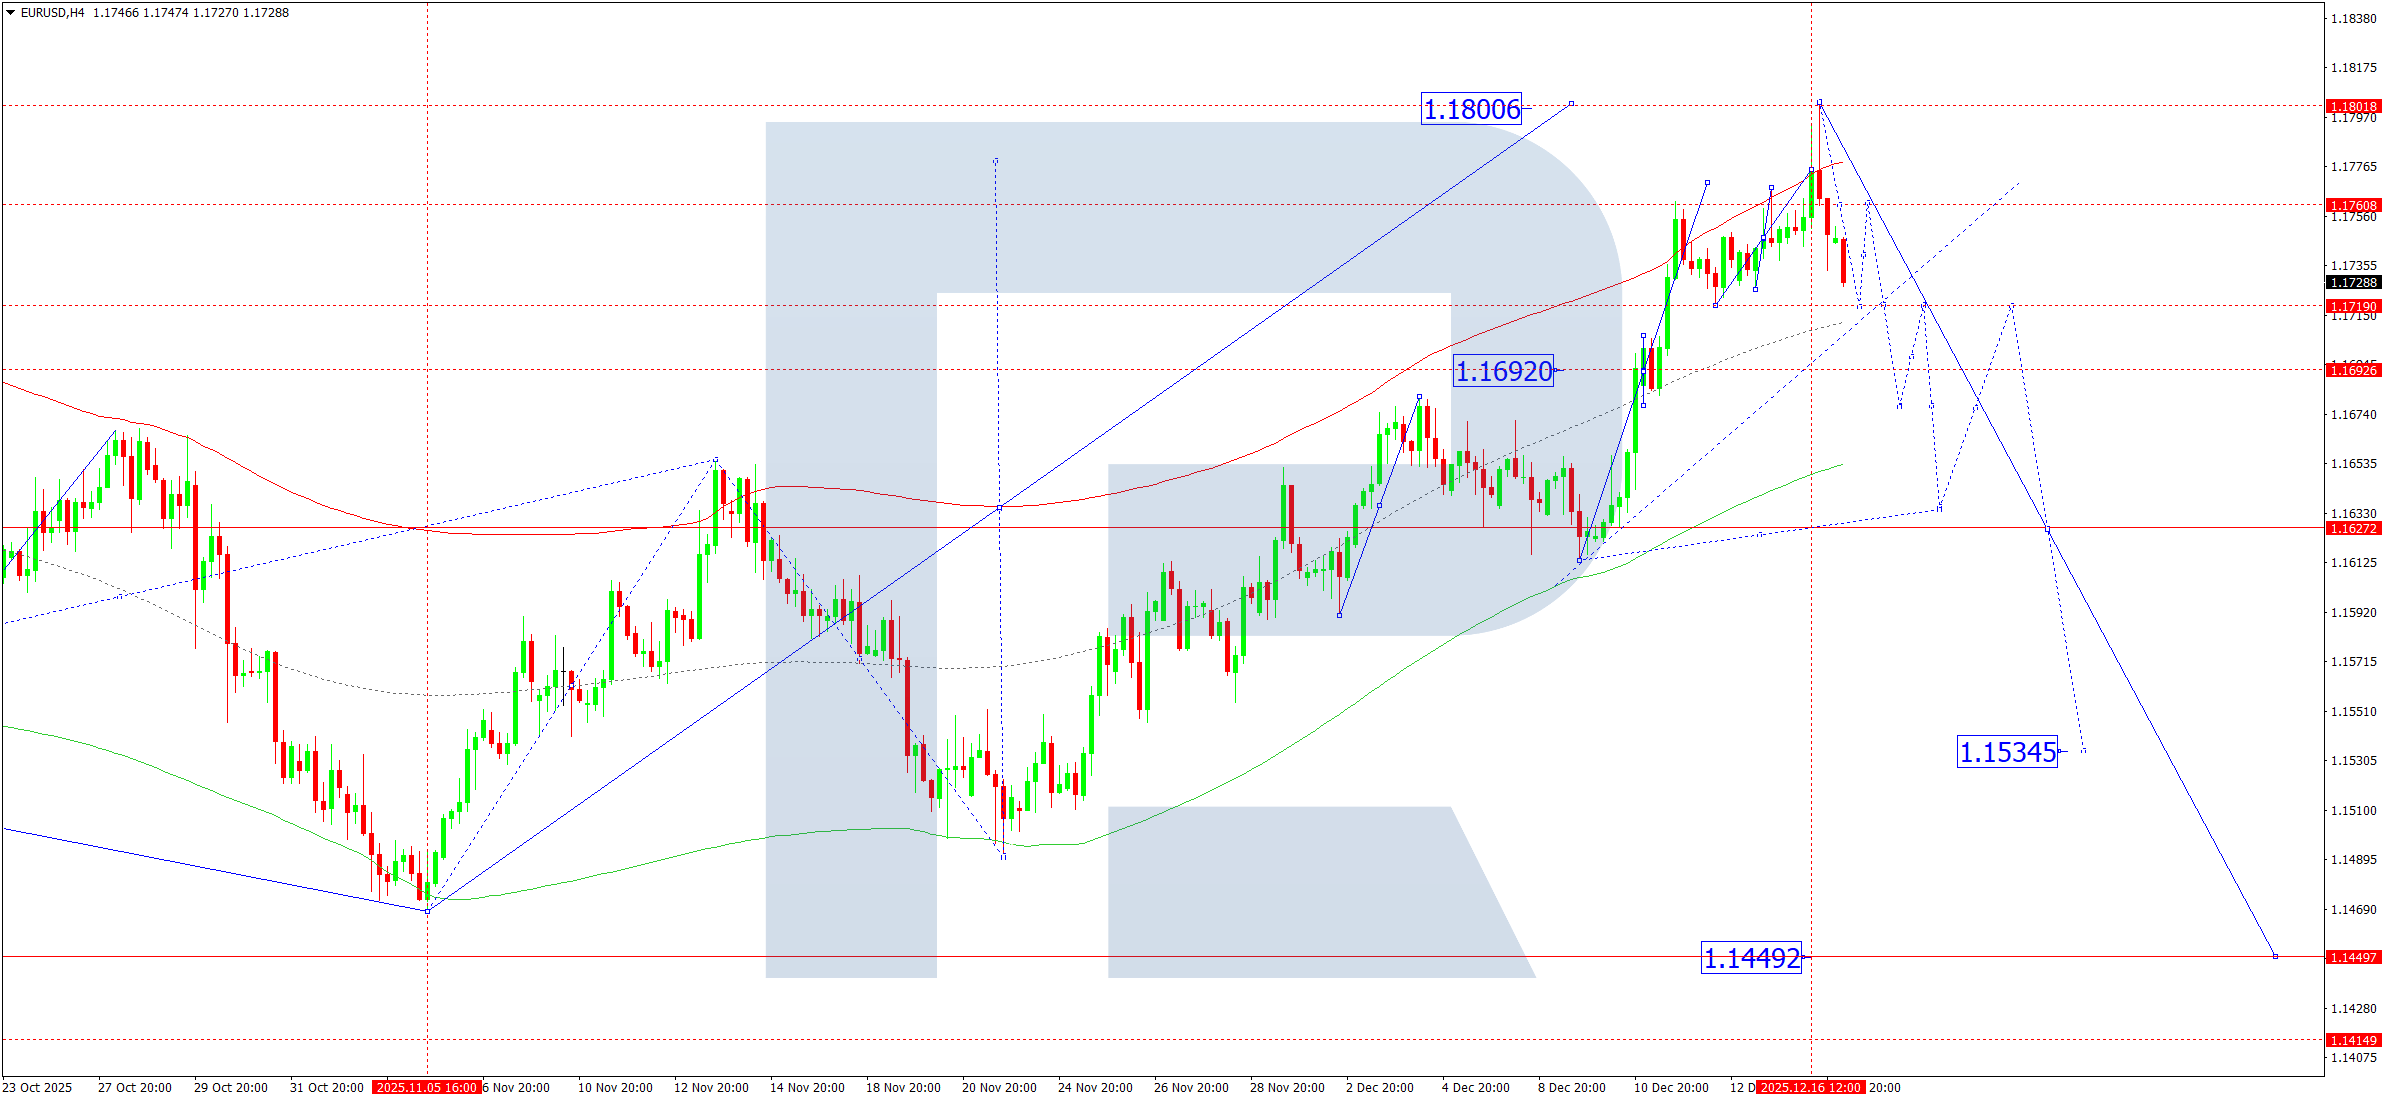
On the H4 chart of EURUSD, the market has expanded the consolidation range upwards to the 1.1800 level. Today, 17 December 2025, we consider the probability of a decline towards the lower boundary of the range at 1.1717. If this level is broken, it will open the potential for the wave to continue towards 1.1636, which represents the first target. Later, a corrective rebound towards 1.1717 cannot be ruled out.
Technically, this scenario is confirmed by the Elliott wave structure and the Matrix of the upward wave with a rotation centre at 1.1636. This structure is considered key for EURUSD. At the moment, the market has completed a rising wave to the upper boundary of the Price Envelope at 1.1800. Today, it is relevant to consider the development of a downward wave towards its central line at 1.1717. The wave may also extend towards the lower boundary at 1.1636.
Technical indicators for today’s EURUSD forecast suggest considering a decline towards 1.1717 and 1.1636.
USDJPY forecast
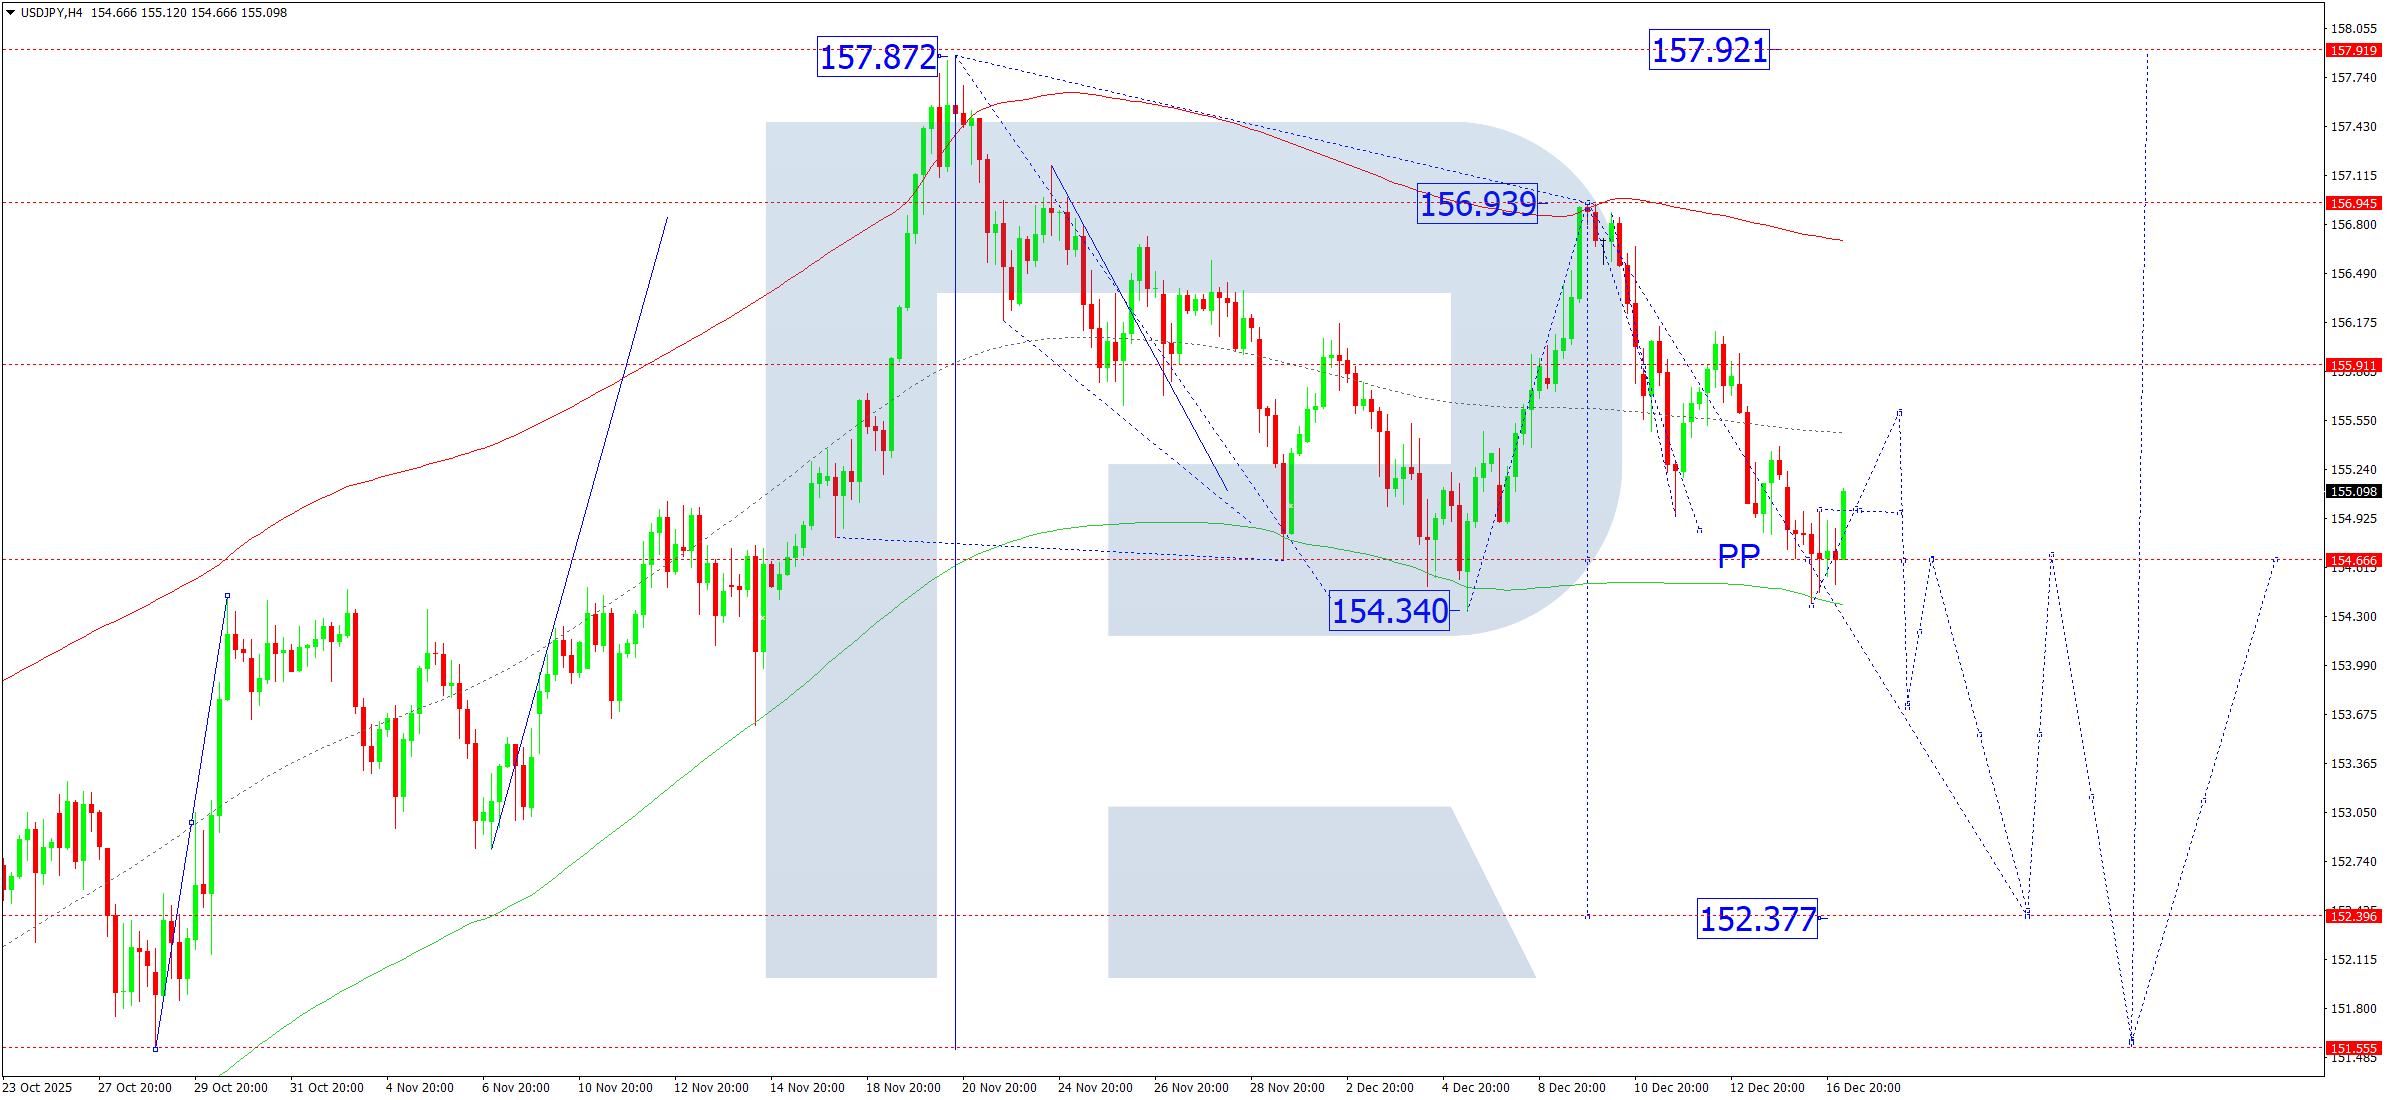
On the H4 chart of USDJPY, the market has formed a consolidation range around the 154.66 level. Today, 17 December 2025, we consider the probability of a breakout from this range to the upside towards 155.55. Later, a decline towards 153.53 is possible. This remains a local target.
Technically, this scenario is confirmed by the Elliott wave structure and the Matrix of the upward wave with a rotation centre at 152.90. This structure is considered key for USDJPY. At the moment, the market has completed a corrective wave to the lower boundary of the Price Envelope at 154.40. Later, we will consider the probability of growth towards its central line at 155.55.
Technical indicators for today’s USDJPY forecast suggest considering growth towards 155.55 and a decline towards 153.53.
GBPUSD forecast
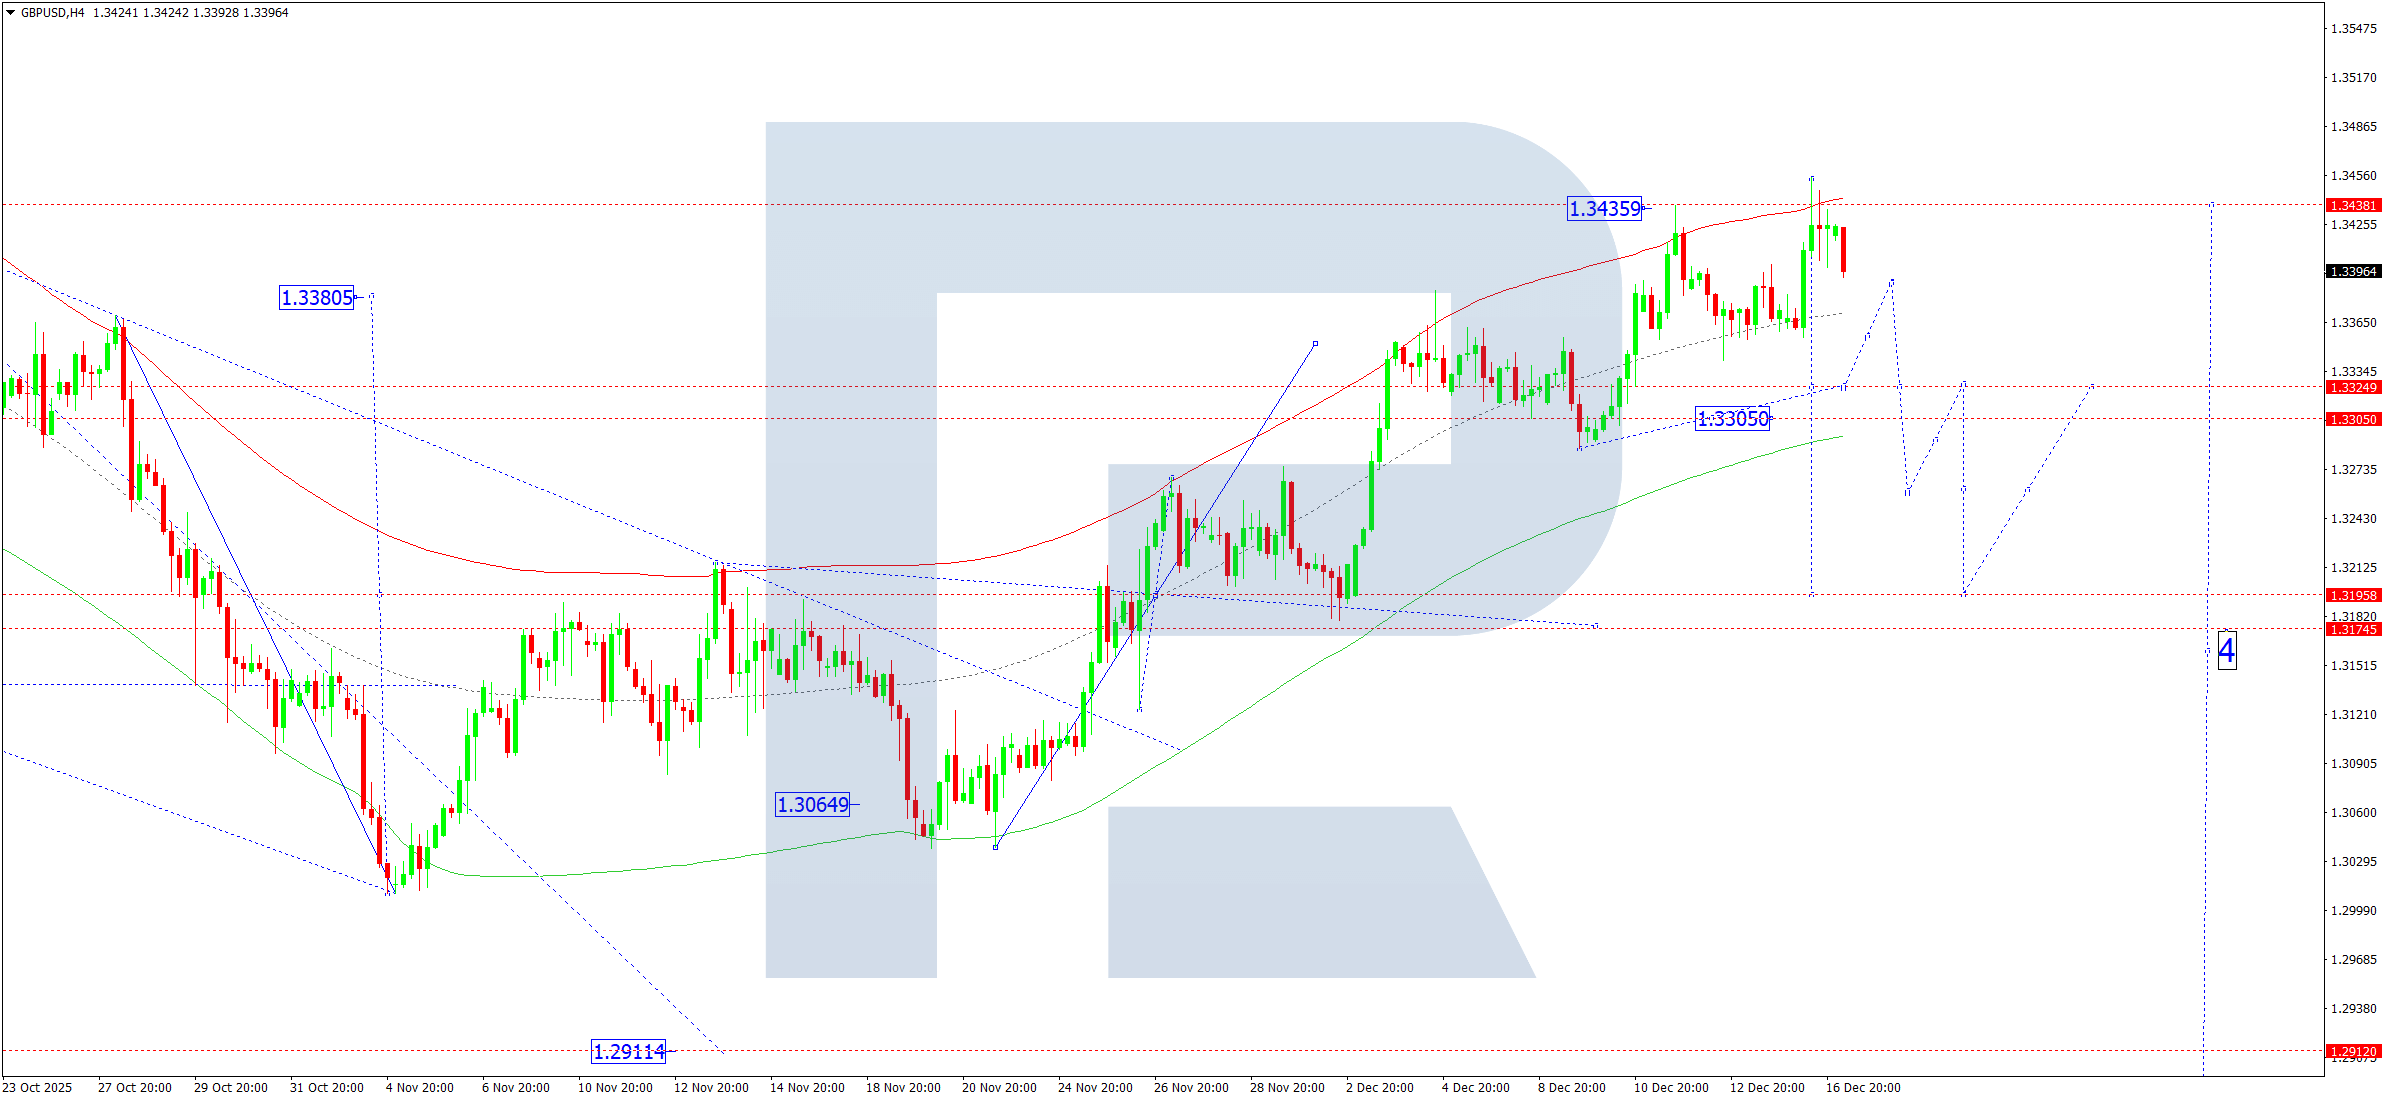
On the H4 chart of GBPUSD, the market has expanded the consolidation range upwards to the 1.3454 level. Today, 17 December 2025, we expect a downward wave towards the lower boundary of the range at 1.3333. If this level is broken, it will open the potential for the wave to continue towards 1.3190, which is the first target.
Technically, this scenario is confirmed by the Elliott wave structure and the Matrix of the downward wave with a rotation centre at 1.3190. This structure is considered key for GBPUSD. Today, we consider the probability of the corrective wave continuing towards the lower boundary of the Price Envelope at 1.3333. After this wave completes, a corrective rebound towards its central line at 1.3390 cannot be ruled out.
Technical indicators for today’s GBPUSD forecast suggest considering a continuation of the decline towards 1.3333.
AUDUSD forecast
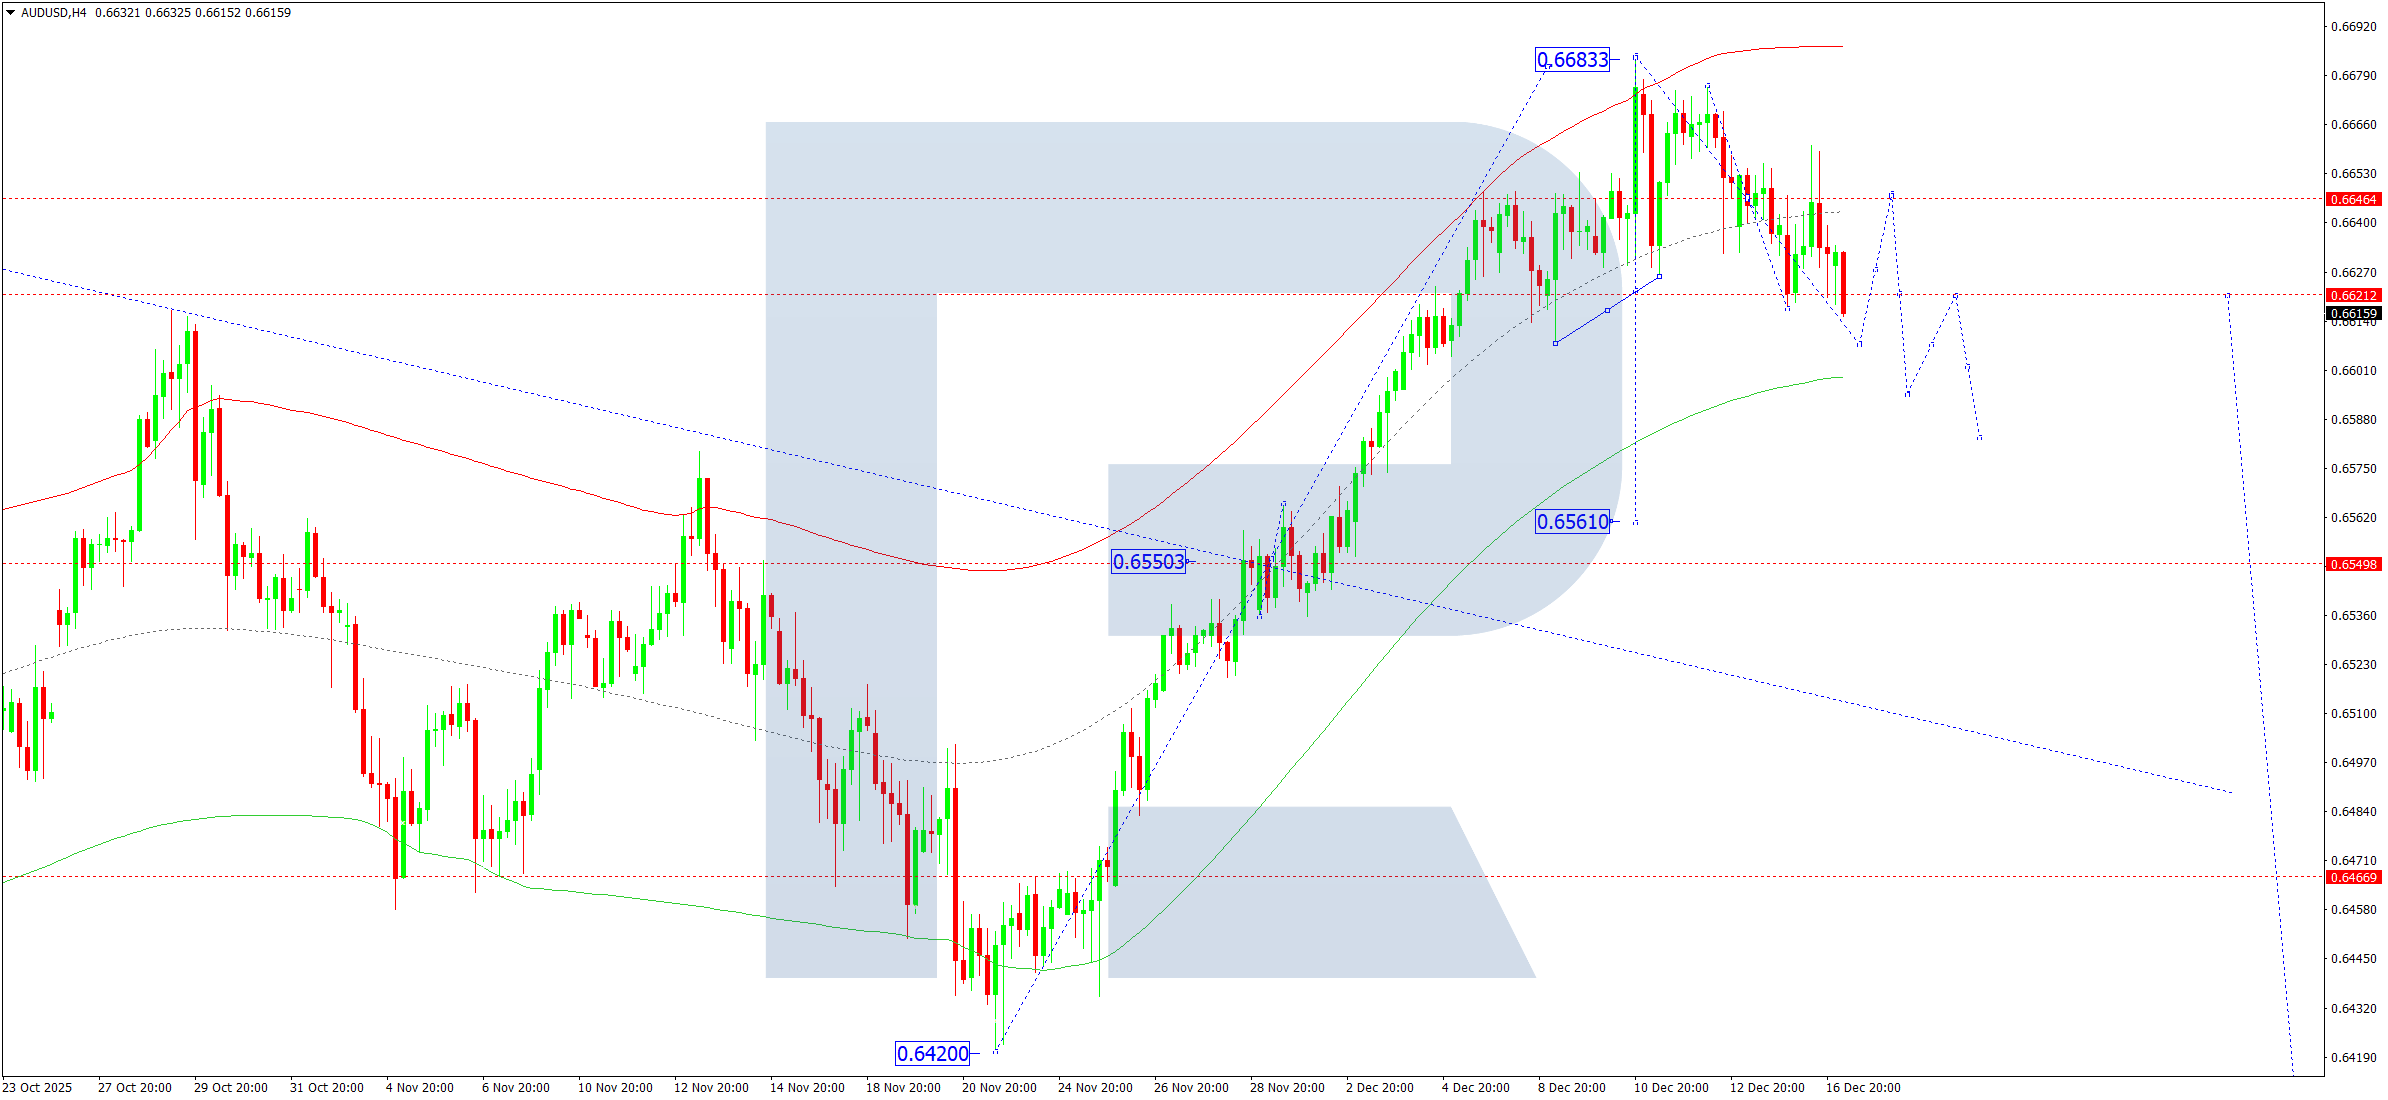
On the H4 chart of AUDUSD, the market has completed a rising leg to the 0.6656 level. Today, 17 December 2025, we expect a decline towards 0.6600. If this level is broken, it will open the potential for the wave to continue towards 0.6561, which represents the first target.
Technically, this scenario is confirmed by the Elliott wave structure and the Matrix of the upward wave for AUDUSD with a rotation centre at 0.6555. This structure is considered key. At the moment, the market has completed a corrective wave to the upper boundary of the Price Envelope at 0.6683. Today, we expect a decline towards its lower boundary at 0.6600.
Technical indicators for today’s AUDUSD forecast suggest considering a decline towards 0.6600.
USDCAD forecast
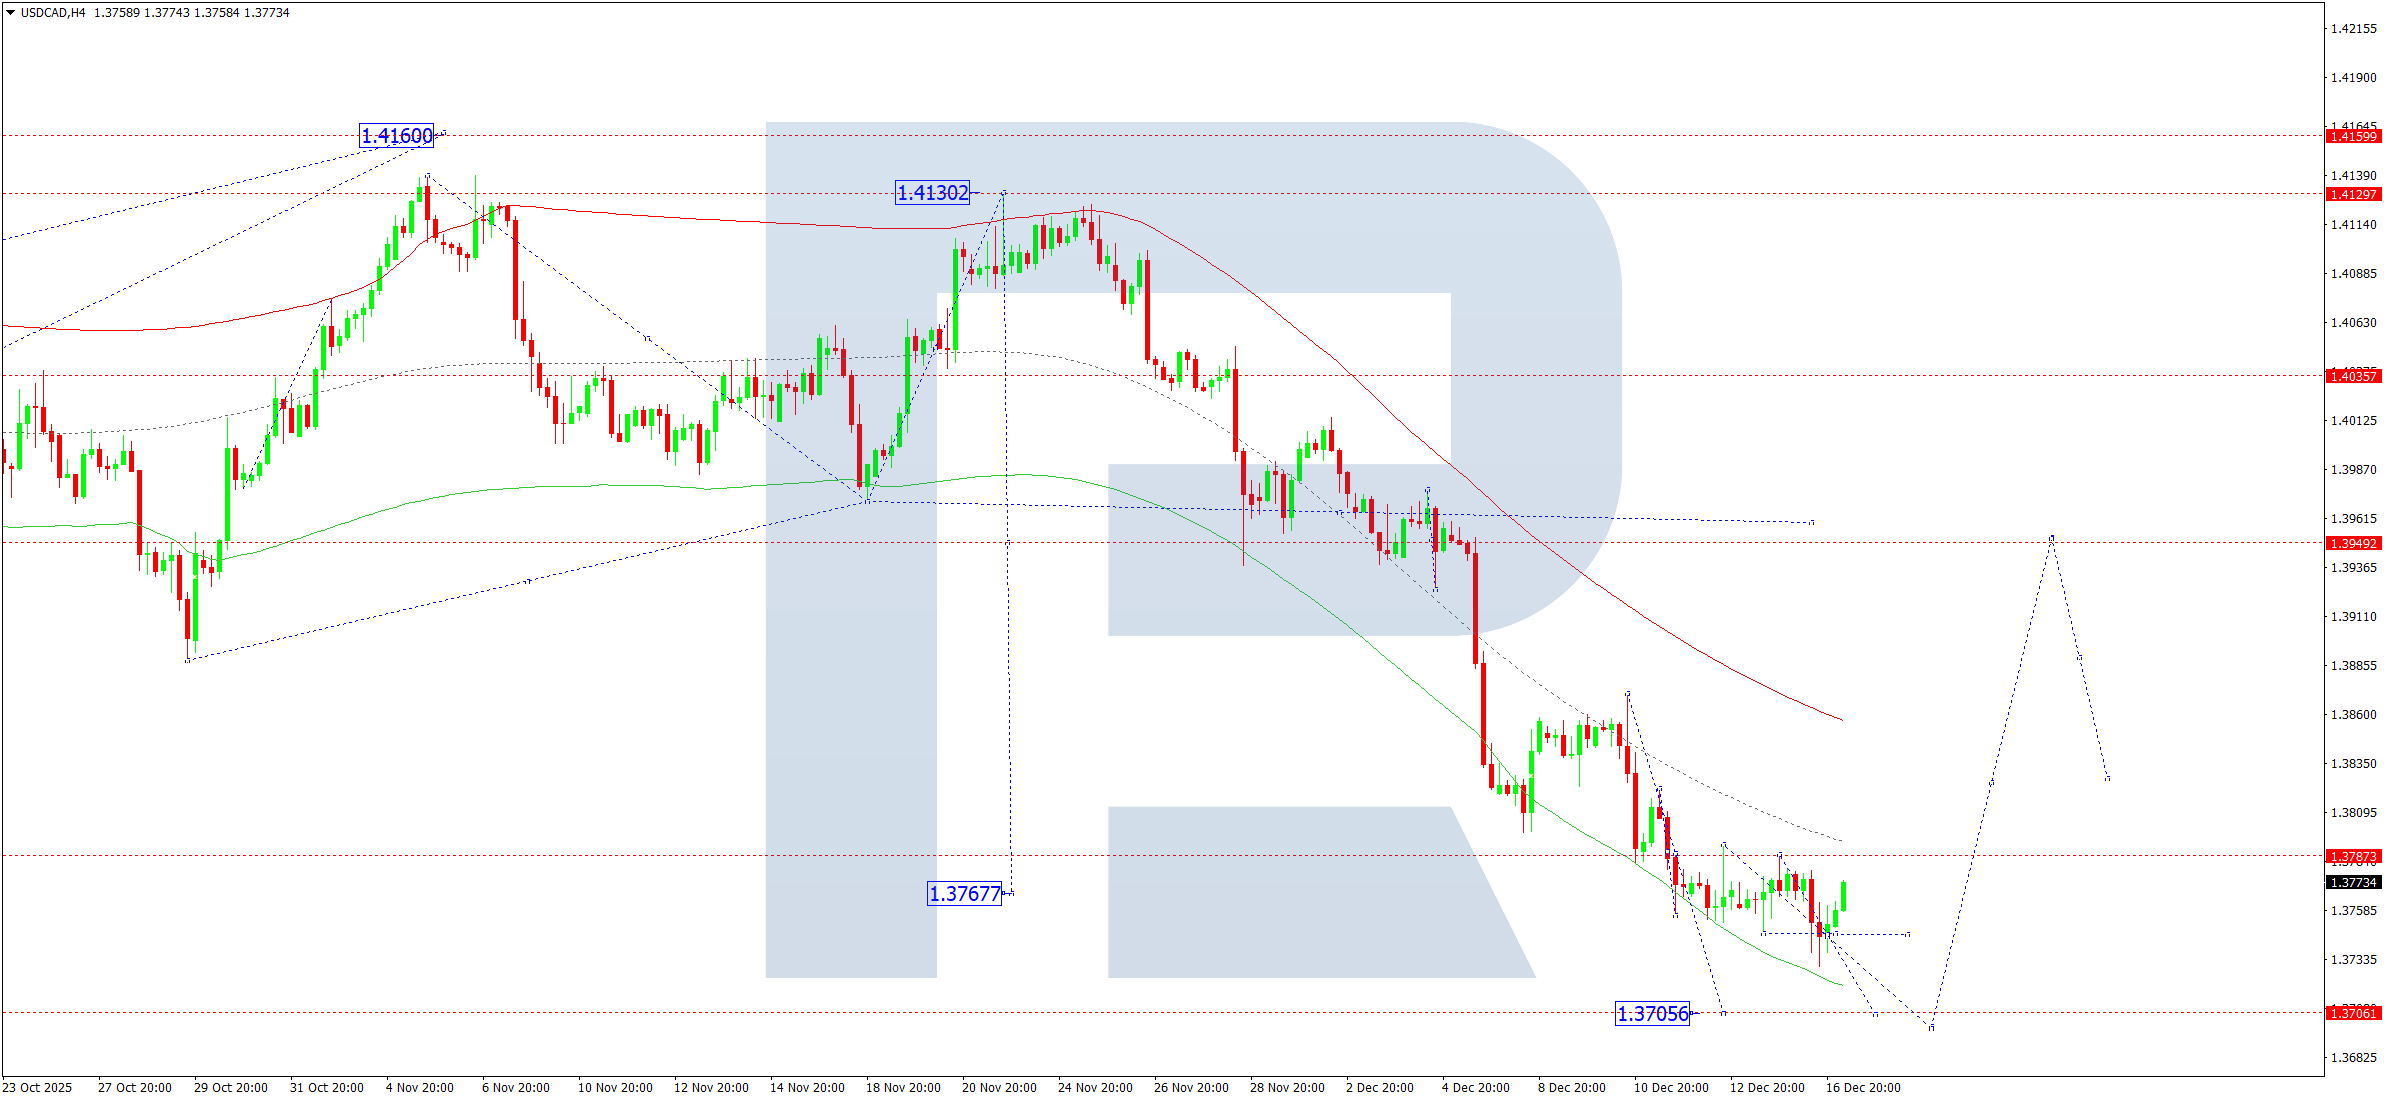
On the H4 chart of USDCAD, the market has formed a compact consolidation range around the 1.3787 level. Today, 17 December 2025, the range has expanded downwards to 1.3737. Later, we expect growth back towards 1.3787. If the price breaks below this range, the structure may extend towards 1.3700. If the price breaks upwards, we will consider the probability of a rising wave towards 1.3939.
Technically, this scenario is confirmed by the Elliott wave structure and the Matrix of the downward wave with a rotation centre at 1.3939. This structure is considered key for USDCAD. At the moment, the market is developing a corrective wave towards the lower boundary of the Price Envelope at 1.3767. After the correction completes, we will consider the probability of starting a new upward wave towards its upper boundary at 1.3939.
Technical indicators for today’s USDCAD forecast suggest considering the probability of a correction towards 1.3939.
XAUUSD forecast
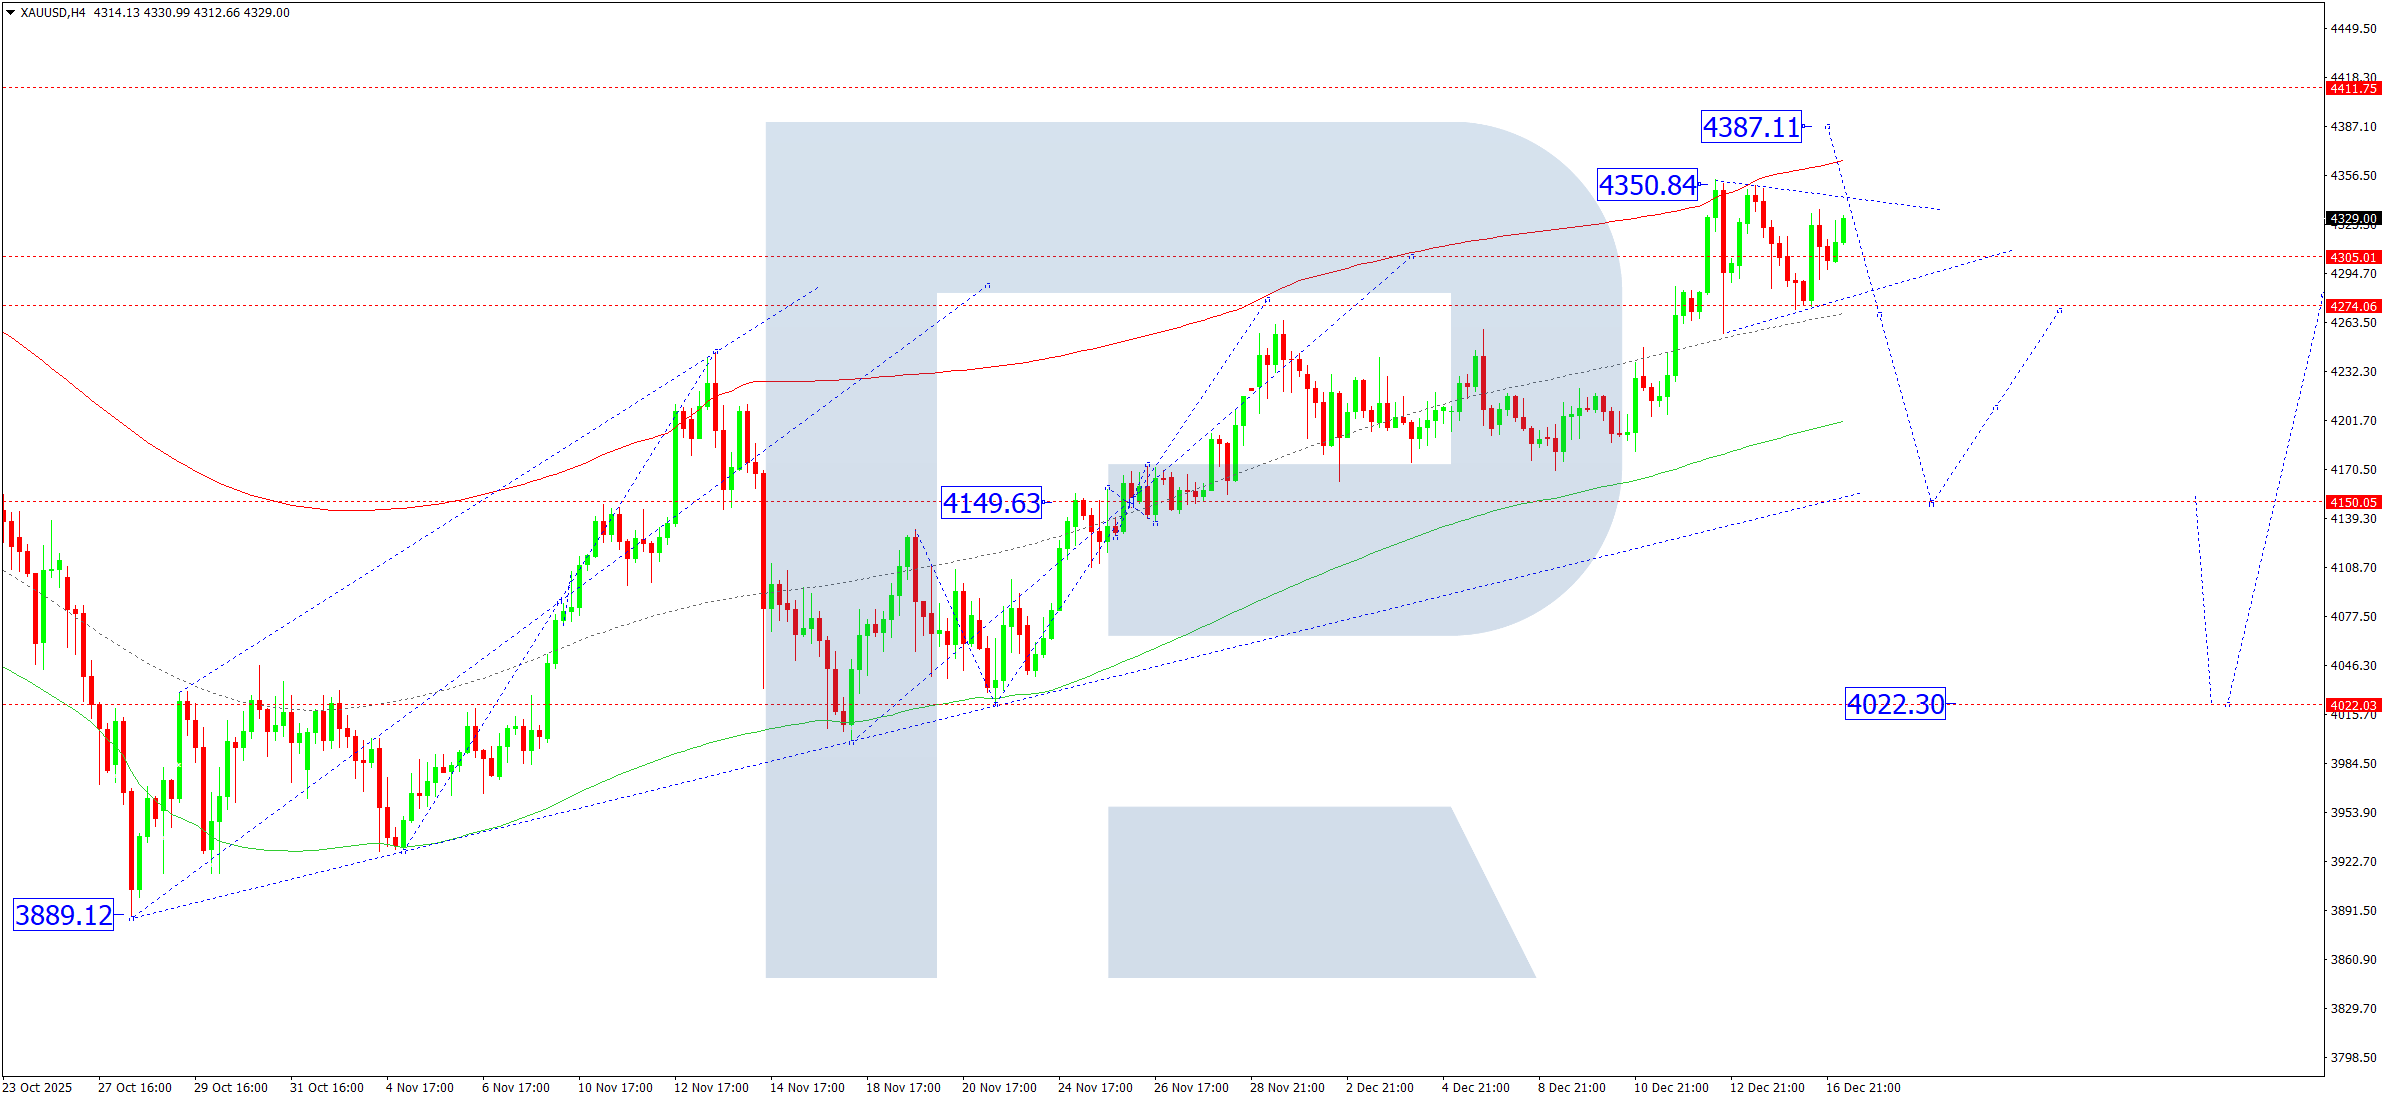
On the H4 chart of XAUUSD, the market continues developing a consolidation range around the 4,300 level. Today, 17 December 2025, if the price breaks upwards from this range, we will consider the probability of a rising wave towards 4,400. If the price breaks downwards, it will open the potential for a correction towards 4,150.
Technically, this scenario is confirmed by the Elliott wave structure and the Matrix of the upward wave with a rotation centre at 4,150. This structure is considered key for XAUUSD. At the moment, the market continues developing the fifth rising wave towards the upper boundary of the Price Envelope at 4,400. After reaching this level, we will consider the probability of a correction towards its central line at 4,150.
Technical indicators for today’s XAUUSD forecast indicate the probability of a decline towards 4,150 and growth towards 4,400.
Brent forecast
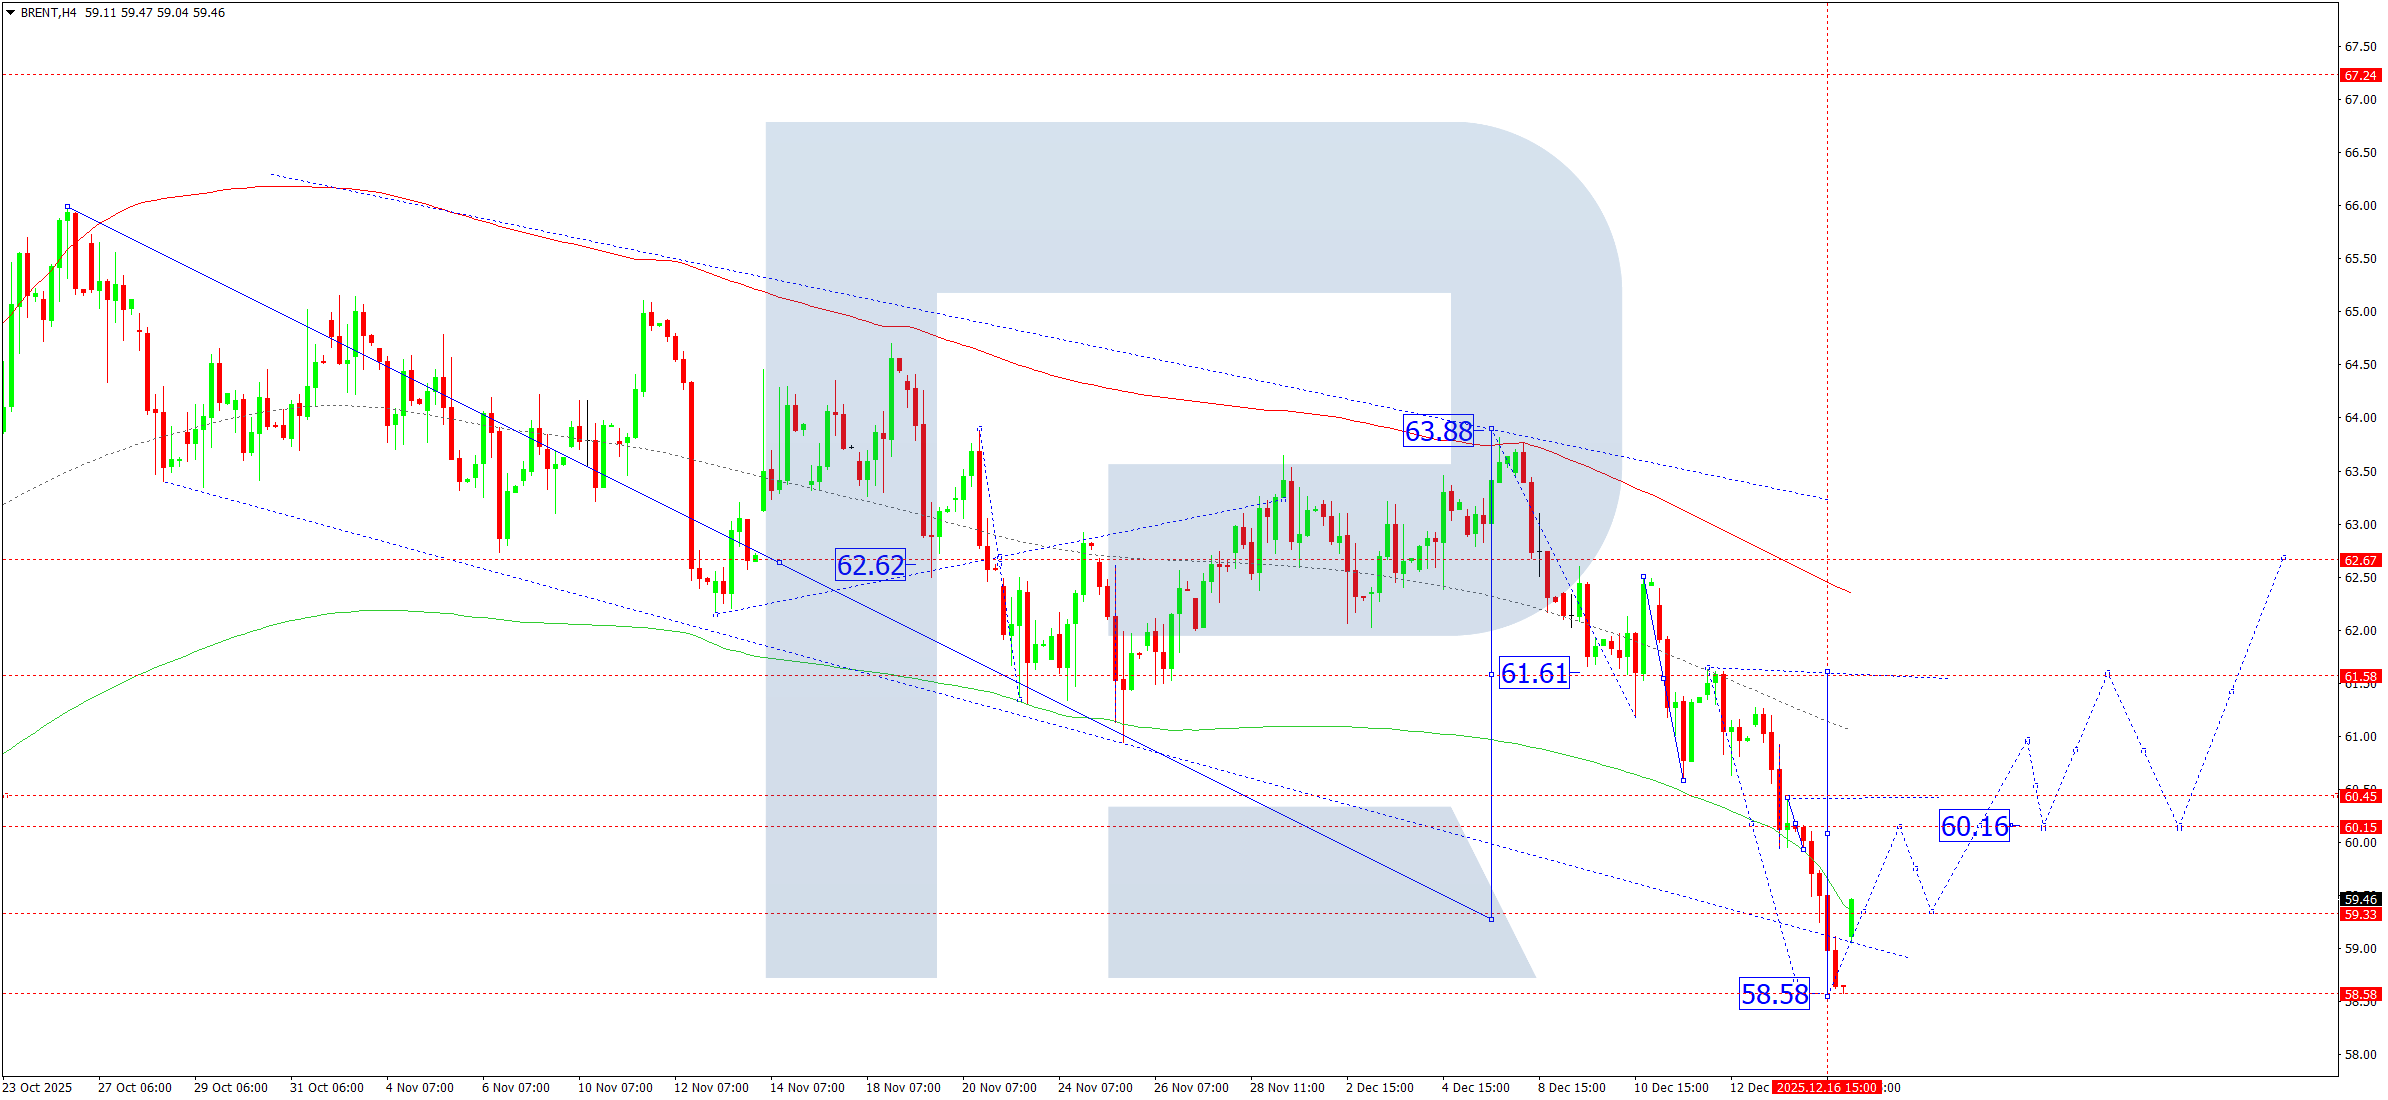
On the H4 chart of Brent crude, the market has completed a downward wave to the 58.58 level. Today, 17 December 2025, an upward impulse is forming towards 60.16. Later, we will consider the probability of a decline towards 59.40. After that, we expect growth towards 61.00 with the potential for the trend to continue towards 61.61. This is the first target.
Technically, this scenario is confirmed by the Elliott wave structure and the Matrix of the downward wave with a rotation centre at 62.62. This structure is considered key for Brent. At the moment, the market is forming an upward impulse towards the central line of the Price Envelope at 60.16. If this level is broken upwards, it will open the potential for growth towards its upper boundary at 61.61.
Technical indicators for today’s Brent forecast suggest considering growth towards 60.16 and 61.61.
Editors’ picks
 EURUSD 2026-2027 forecast: key market trends and future predictions
This article provides the EURUSD forecast for 2026 and 2027 and highlights the main factors determining the direction of the pair’s movements. We will apply technical analysis, take into account the opinions of leading experts, large banks, and financial institutions, and study AI-based forecasts. This comprehensive insight into EURUSD predictions should help investors and traders make informed decisions.
 Gold (XAUUSD) forecast 2026 and beyond: expert insights, price predictions, and analysis
Dive deep into the Gold (XAUUSD) price outlook for 2026 and beyond, combining technical analysis, expert forecasts, and key macroeconomic factors. It explains the drivers behind gold’s recent surge, explores potential scenarios including a move toward 4,500 to 5,000 USD per ounce, and highlights why the metal remains a strong hedge during global uncertainty.
Forecasts presented in this section only reflect the author’s private opinion and should not be considered as guidance for trading. RoboForex bears no responsibility for trading results based on trading recommendations described in these analytical reviews.