Daily technical analysis and forecast for 28 January 2026
Here is a detailed daily technical analysis and forecast for EURUSD, USDJPY, GBPUSD, AUDUSD, USDCAD, XAUUSD, and Brent for 28 January 2026.
EURUSD forecast
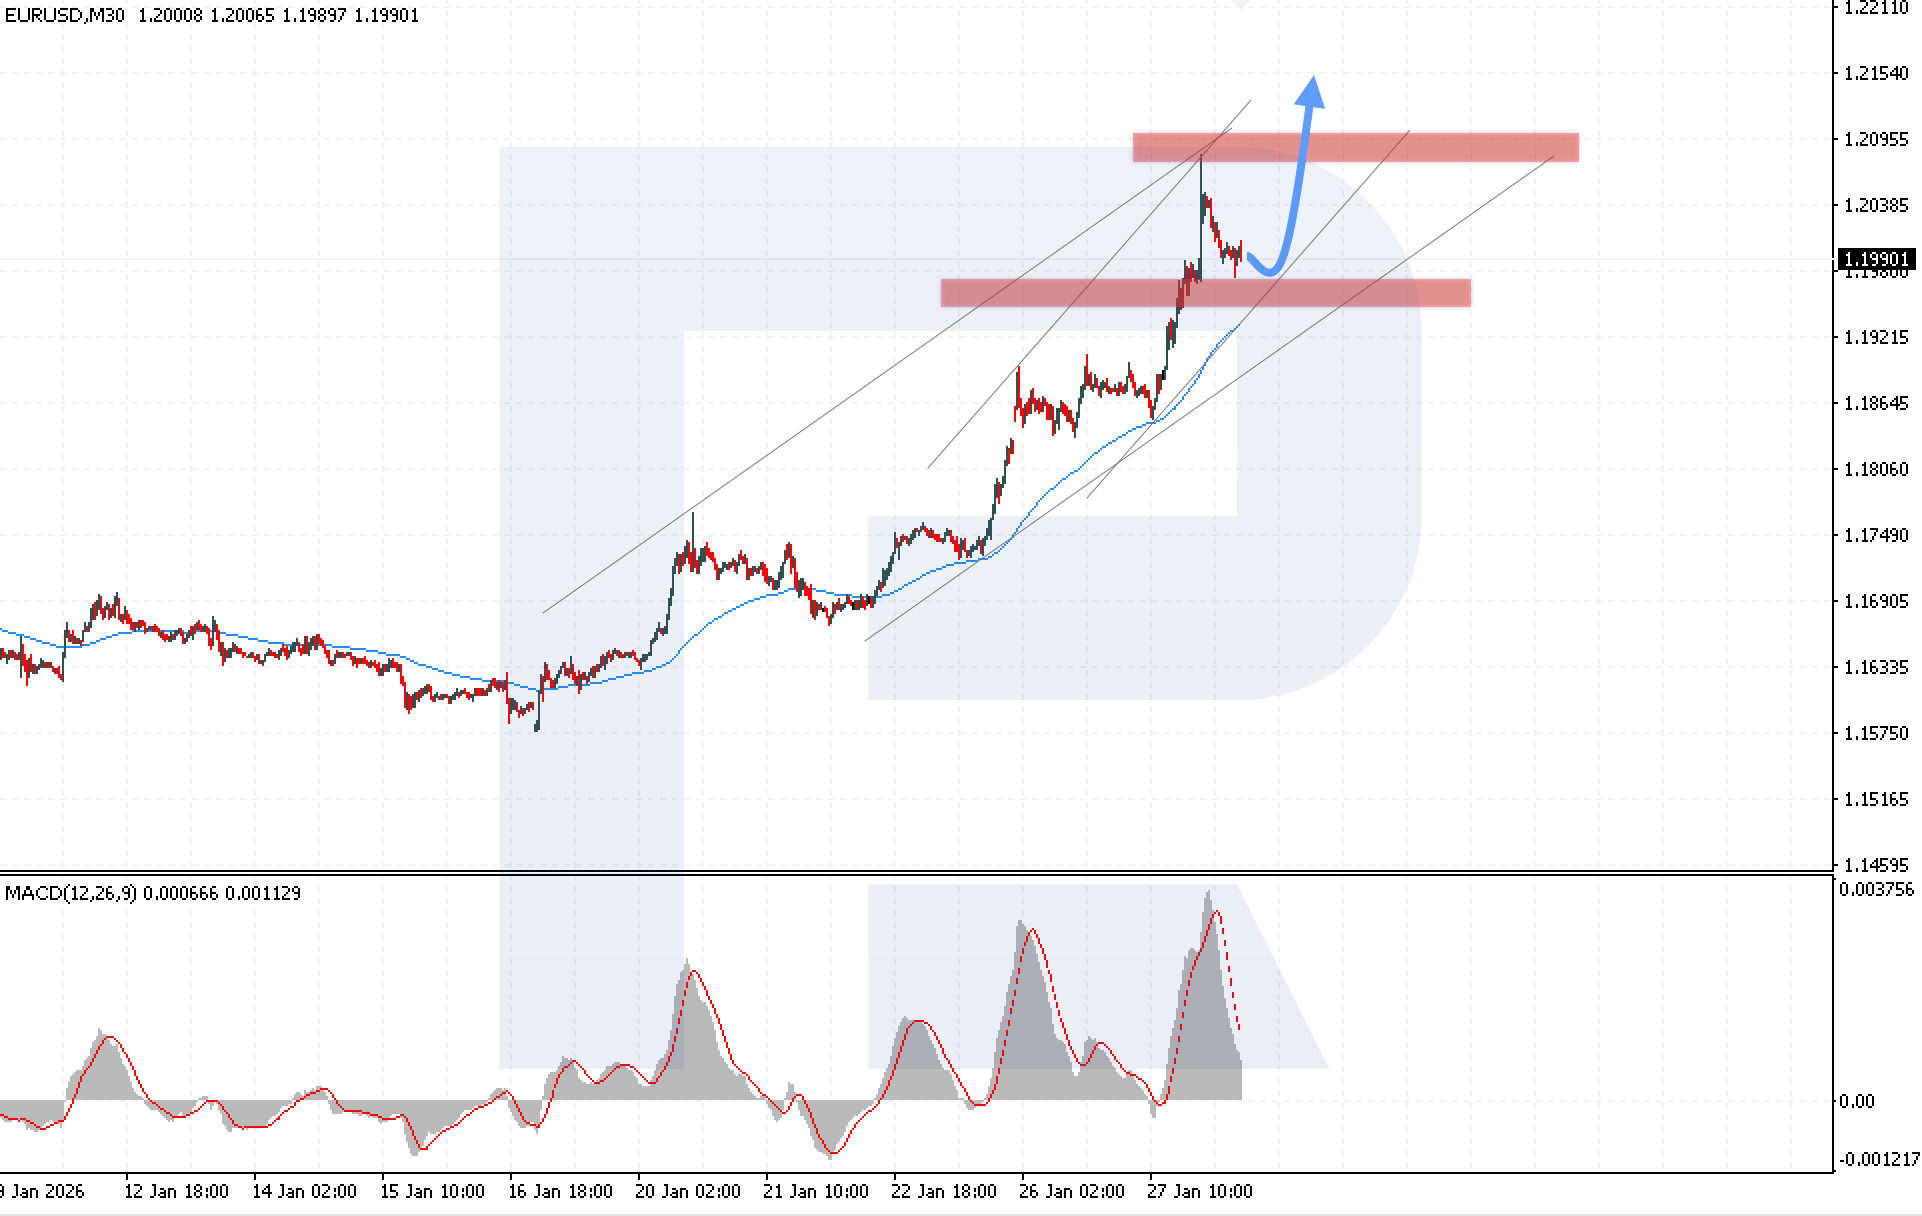
On the M30 chart of the EURUSD currency pair, the market is undergoing a correction after rebounding from the 1.2090 resistance level. Despite the decline, buying pressure remains. The nearest support for EURUSD is located around 1.1990. Today, 28 January 2026, a moderate bearish correction towards the 1.1985 level is possible. After the consolidation is completed, growth is expected to resume with a target at 1.2155.
The technical picture supports this scenario: quotes continue to move within an ascending channel, buyers are holding prices above the EMA-85, and the MACD indicator analysis shows a decline in the histogram, confirming a consolidation phase. A key condition for the bullish EURUSD scenario will be a confident price consolidation above the 1.2035 level.
An alternative scenario will become relevant if the price breaks below the lower boundary of the ascending channel and falls below the 1.1935 level, which could trigger a deeper corrective wave.
USDJPY forecast
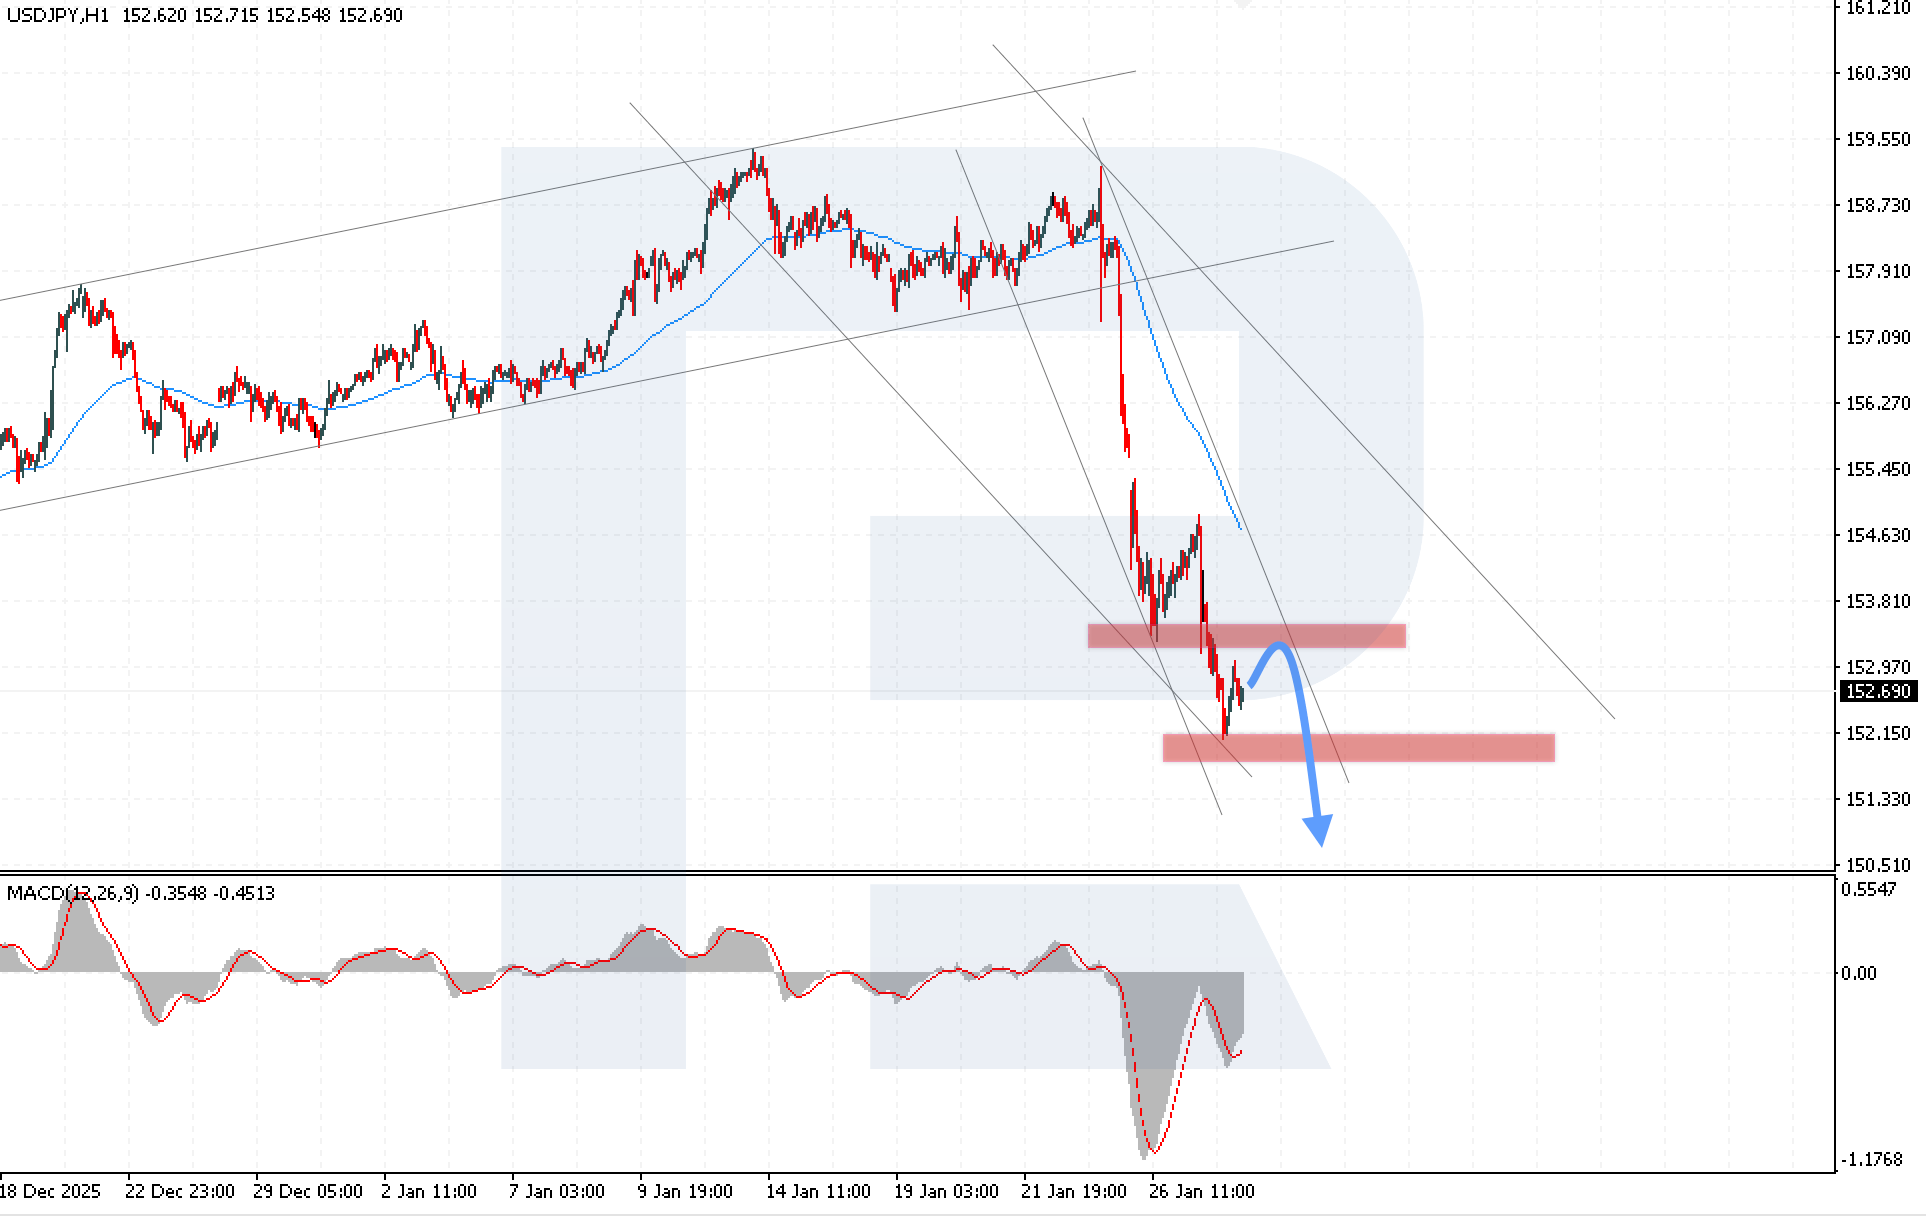
On the H1 chart of the USDJPY currency pair, the market is attempting to recover after an aggressive bearish impulse. The nearest resistance level for USDJPY is located at 153.55. Today, 28 January 2026, a moderate corrective move towards this level is likely. After the recovery is completed, the decline is expected to resume with a target at 150.65.
The technical picture supports this scenario: quotes continue to move within a descending channel, bears are holding prices below the EMA-85, the MACD indicator analysis shows an increase in the histogram, and a bullish divergence is forming, confirming a corrective phase before a further decline. A key condition for the bearish USDJPY scenario will be confident price consolidation below the 152.05 level.
An alternative scenario will become relevant if the upper boundary of the bearish channel is broken and prices consolidate above the 1.1935 level, which may trigger another attempt at USDJPY recovery.
GBPUSD forecast
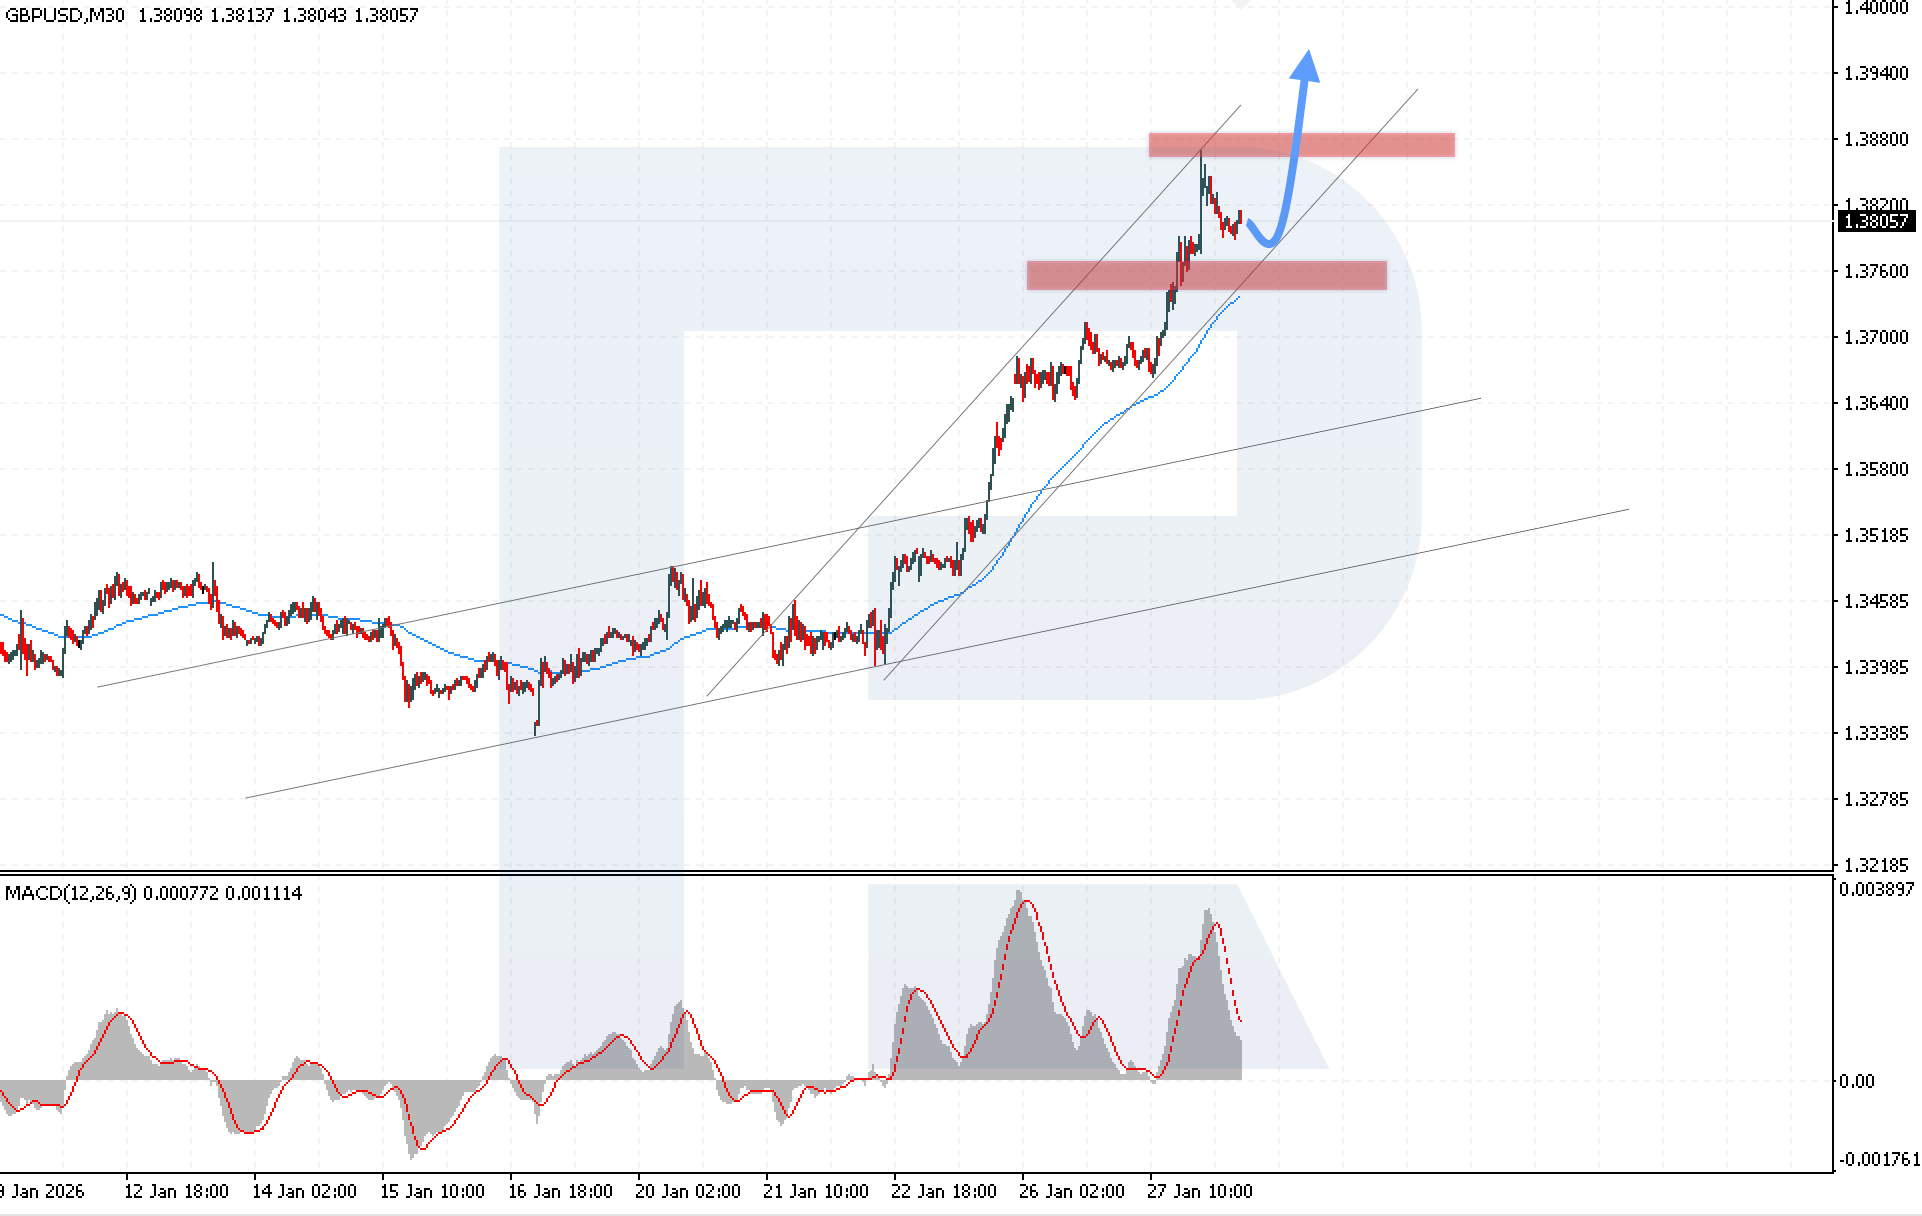
On the M30 chart of the GBPUSD currency pair, the market is declining after rebounding from the upper boundary of the bullish channel, where buyers met resistance at the 1.3880 level. The nearest support level for GBPUSD is located at 1.3765. Today, 28 January 2026, a decline towards the 1.3780 level is possible. After the correction is complete, bullish momentum is expected to resume with a target at the 1.3965 level.
The technical picture supports this scenario: quotes continue to move within an ascending channel, the MACD indicator analysis shows a decline in the histogram and its approach to the zero level, which suggests an imminent end to consolidation. A key condition for the bullish GBPUSD scenario will be confident price consolidation above the 1.3855 level.
An alternative scenario will become relevant if the lower boundary of the ascending channel is broken and prices consolidate below the 1.3735 level, which could trigger a more aggressive bearish correction in GBPUSD.
AUDUSD forecast
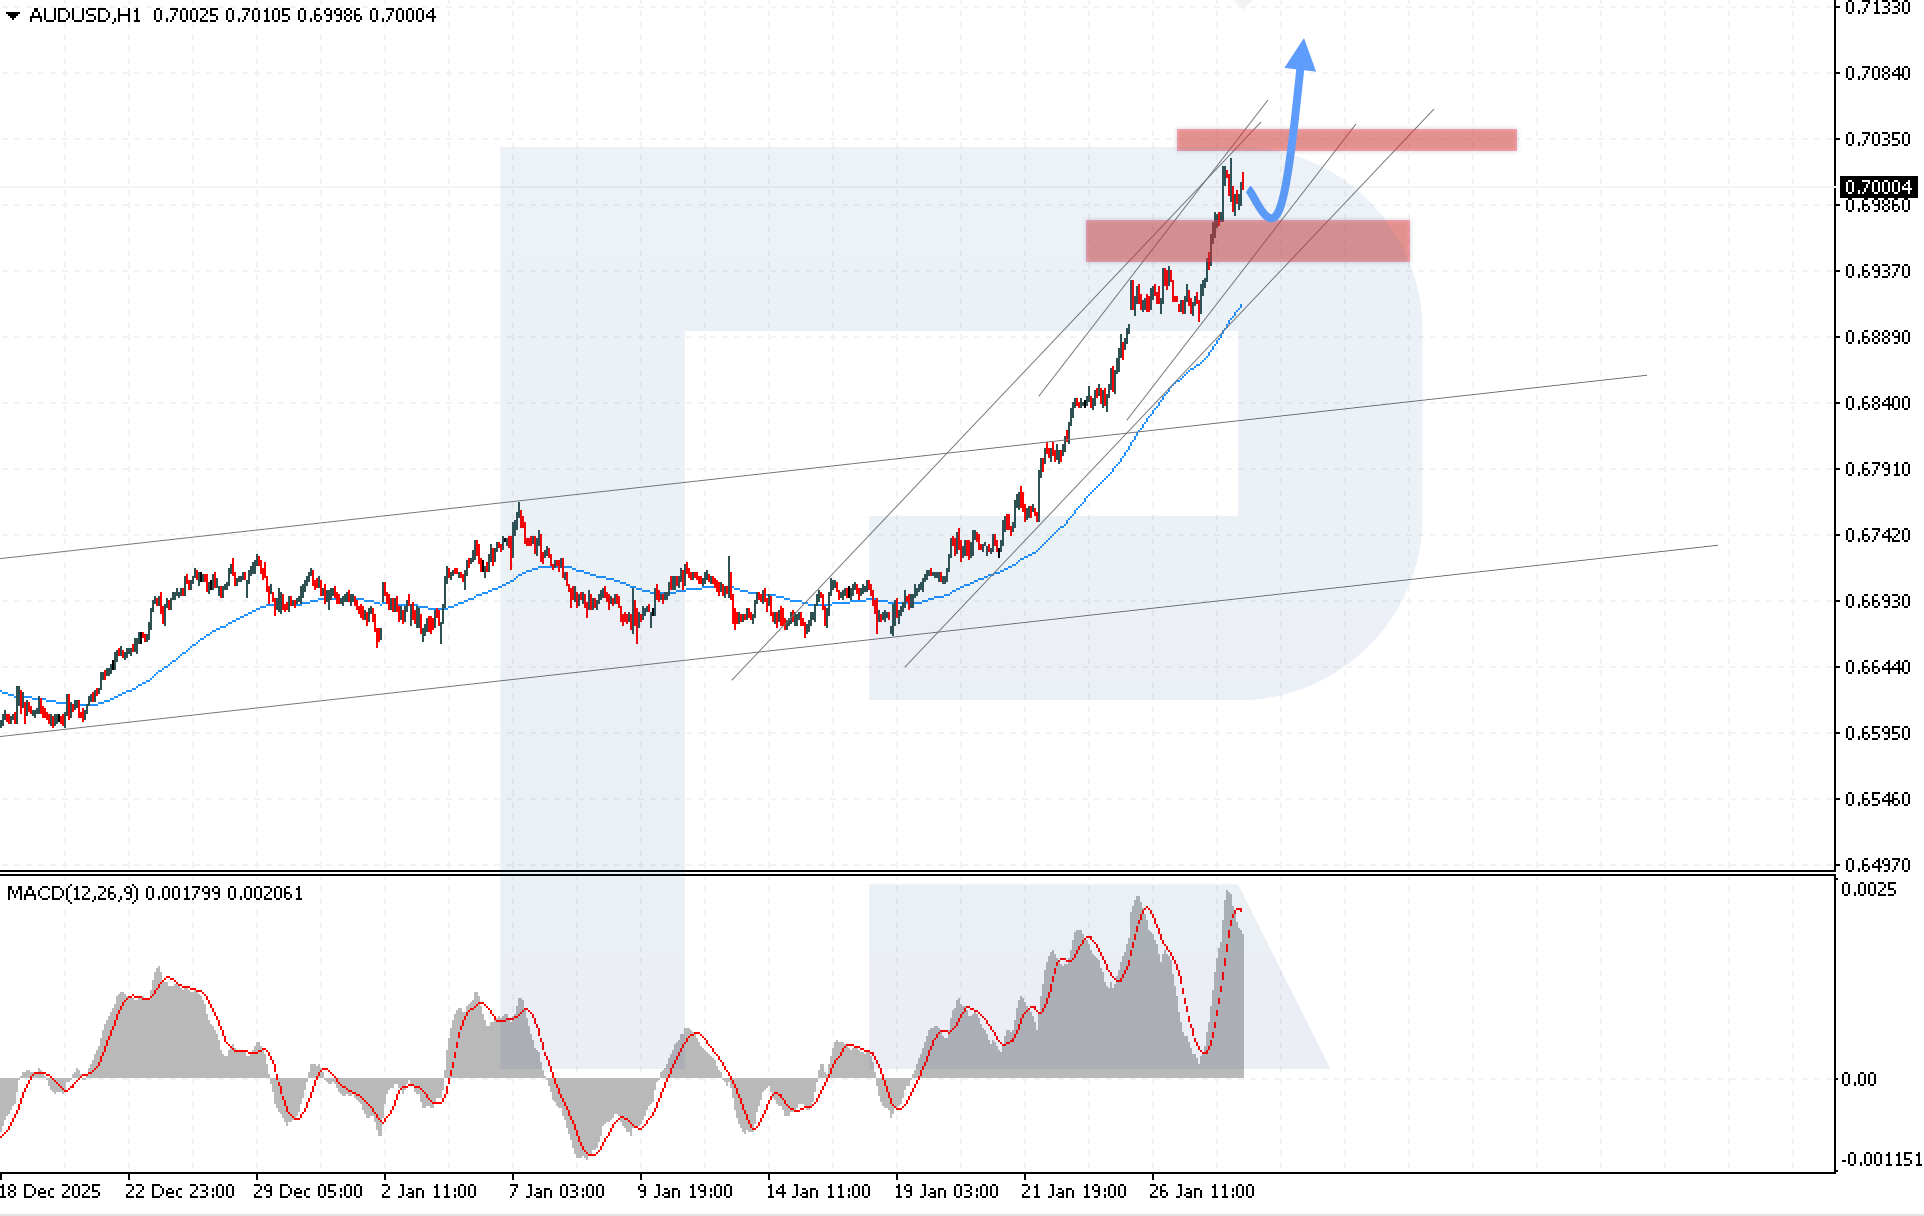
On the H1 chart of the AUDUSD currency pair, the market is rising after rebounding from the local support level at 0.6975. The nearest resistance for AUDUSD is located at 0.7035. Today, 28 January 2026, the correction is expected to continue towards the 0.6980 level. After the correction and consolidation are complete, the pair is expected to gain upward momentum with a target at 0.7145.
The technical picture supports this scenario: quotes continue to move within an ascending channel, and the MACD indicator analysis shows recovery of the histogram after a short-term decline, suggesting an imminent resumption of the bullish momentum. A key condition for the bullish AUDUSD scenario will be confident price consolidation above the 0.7035 level.
An alternative scenario will become relevant if the lower boundary of the channel is broken and prices consolidate below the 1.3735 level, which could trigger a more bearish correction in AUDUSD towards the next support level at 0.6885.
USDCAD forecast
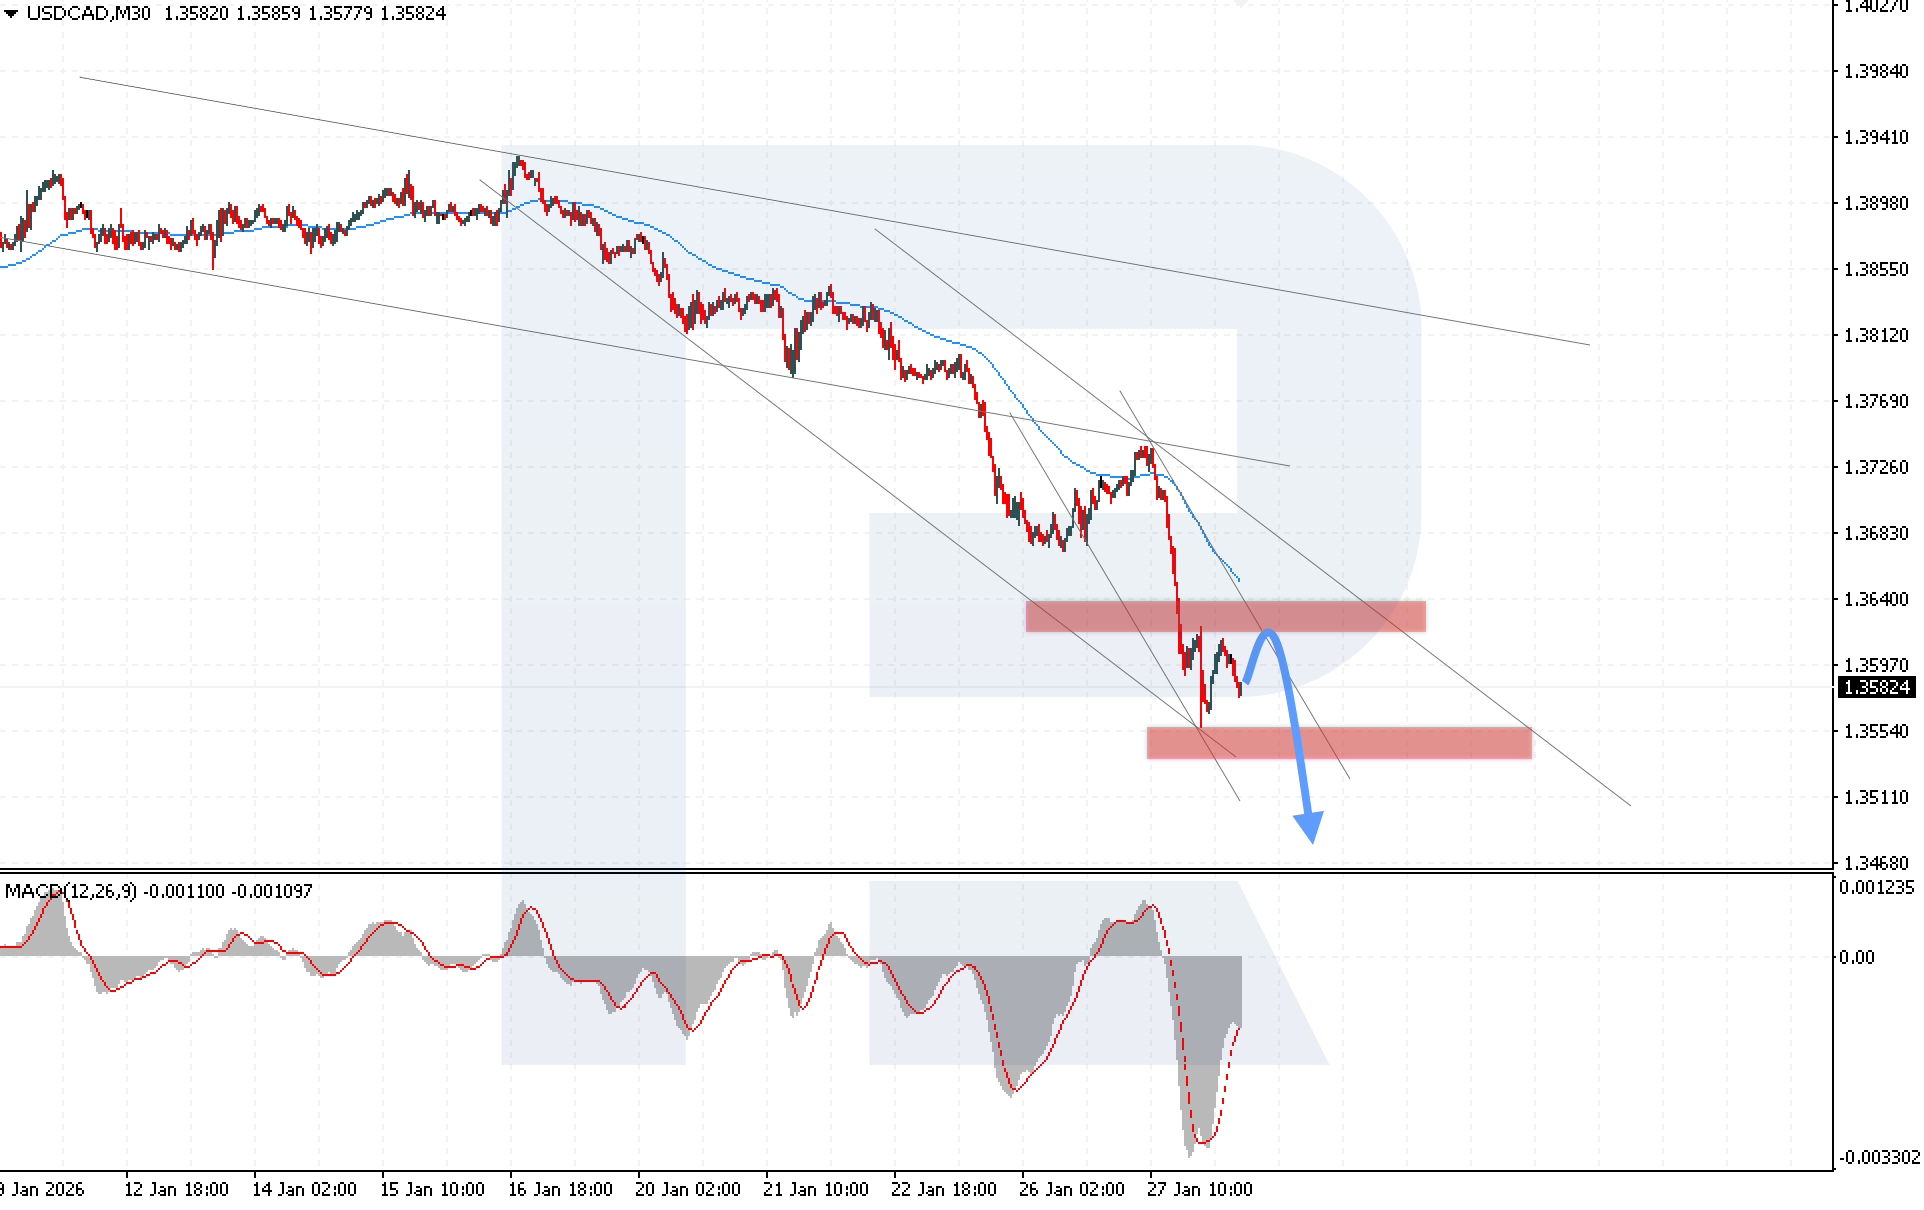
On the M30 chart of the USDCAD currency pair, the market is actively declining after rebounding from the local resistance level at 1.3635. The nearest support for USDCAD is located at 1.3550. Today, 28 January 2026, a corrective move towards the 1.3630 level is likely. After the correction is complete, bearish momentum is expected to resume, targeting the 1.3425 level.
The technical picture supports this scenario: quotes continue to move within a bearish channel, and the MACD indicator analysis shows a renewed decline in the histogram after a rise, suggesting an imminent resumption of the downward momentum. A key condition for the USDCAD downside scenario will be confident price consolidation below the 1.3535 level.
An alternative scenario will become relevant if the upper boundary of the bearish channel is broken and prices consolidate above the 1.3665 level, which could push the USDCAD rate higher towards the next resistance level at 1.3685.
XAUUSD forecast
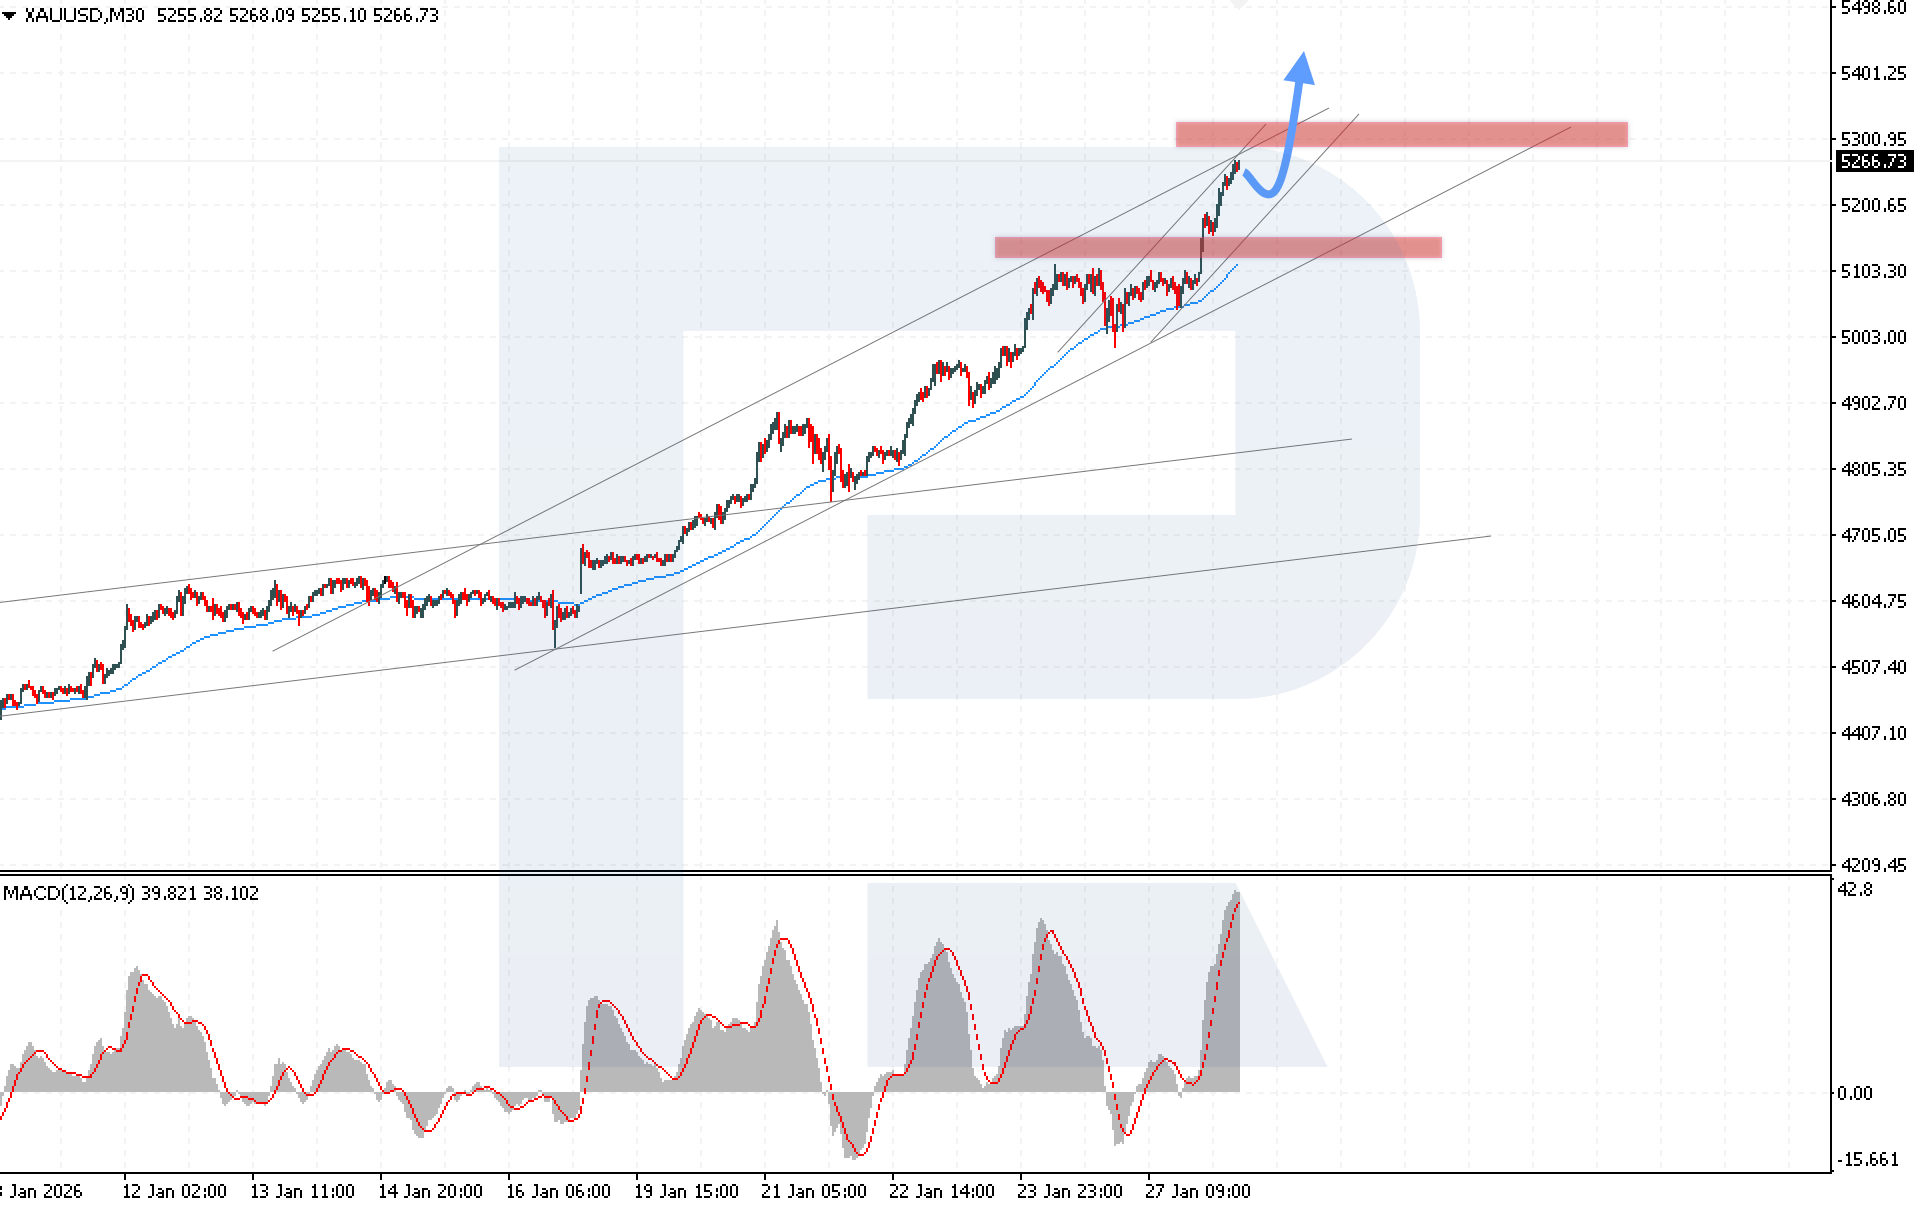
On the M30 chart of the XAUUSD currency pair, the market is rising rapidly after breaking out of the consolidation zone, while buyers are facing resistance in the form of the channel’s upper boundary. The nearest support for XAUUSD is located at the 5,205 level. Today, 28 January 2026, a corrective move towards the lower boundary of the channel at the 5,215 level is possible. After a minor correction is completed, a resumption of an aggressive bullish impulse is expected with a target at the 5,405 level.
The technical picture supports this scenario: quotes continue to move within an ascending channel, and the MACD indicator analysis shows strong growth of the histogram, indicating active development of the upward impulse. A key condition for the XAUUSD growth scenario will be confident price consolidation above the 5,305 level.
An alternative scenario will become relevant if the lower boundary of the bullish channel is broken and prices consolidate below the 5.190 level, which could trigger a decline in XAUUSD towards the next support level at 5,105.
Brent forecast
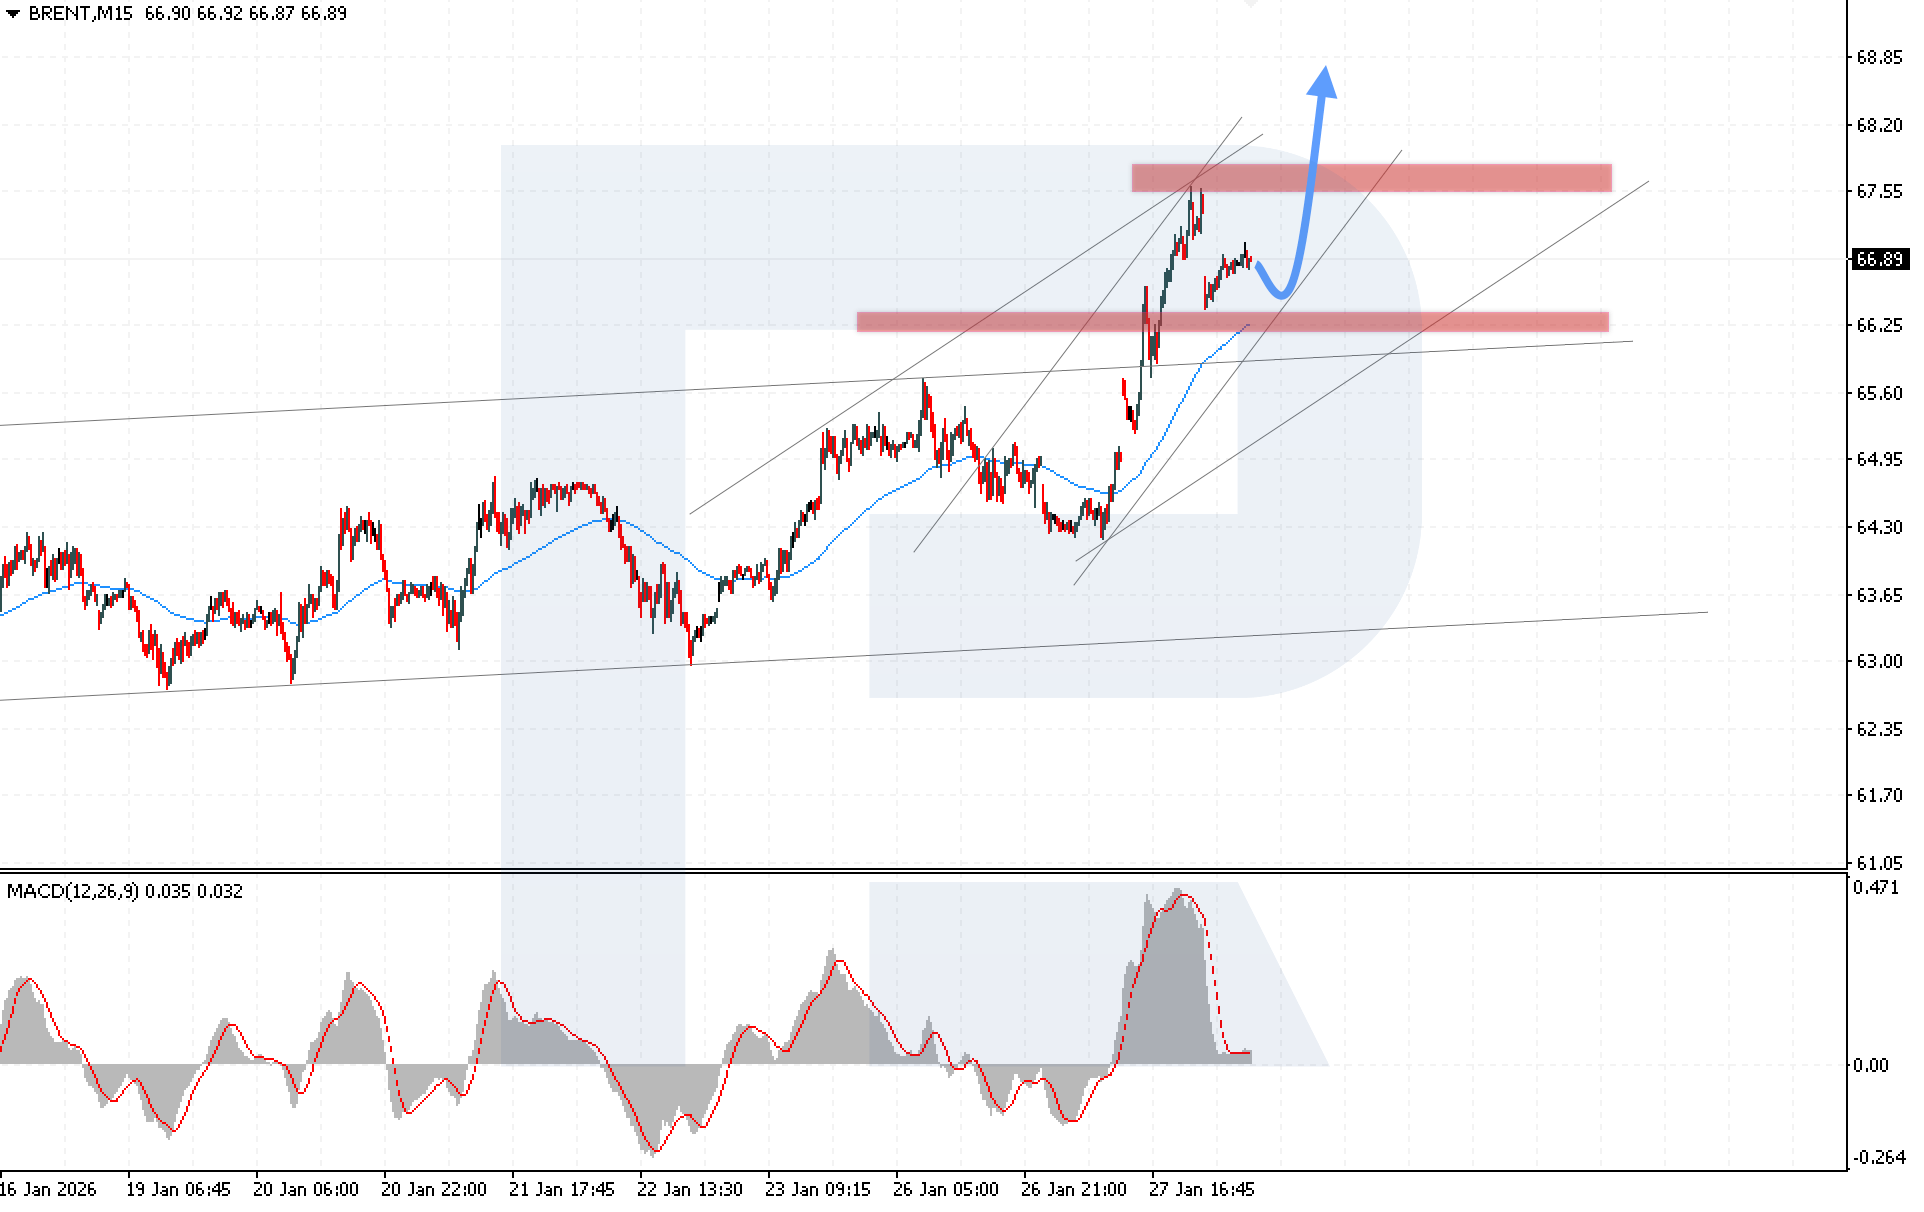
On the M15 chart of Brent crude oil, the market is rising after breaking above the upper boundary of the bullish channel. The nearest support for Brent is located at the 66.25 level. Today, 28 January 2026, the probability of a corrective move towards the lower boundary of the channel at the 66.35 level is considered. After the correction is completed, a resumption of the bullish impulse is expected with a target at the 68.85 level.
The technical picture supports the bullish scenario: quotes are holding above the EMA-85 line, and the MACD indicator analysis points to renewed growth of the histogram after a decline, indicating increasing buying pressure. A key condition for the Brent growth scenario will be confident price consolidation above the 67.55 level.
An alternative scenario will become relevant if the lower boundary of the bullish channel is broken and prices consolidate below the 66.25 level, which could trigger a return of Brent prices back into the ascending channel and a weakening of bullish pressure.
Editors’ picks
 EURUSD 2026-2027 forecast: key market trends and future predictions
This article provides the EURUSD forecast for 2026 and 2027 and highlights the main factors determining the direction of the pair’s movements. We will apply technical analysis, take into account the opinions of leading experts, large banks, and financial institutions, and study AI-based forecasts. This comprehensive insight into EURUSD predictions should help investors and traders make informed decisions.
 Gold (XAUUSD) forecast 2026 and beyond: expert insights, price predictions, and analysis
Dive deep into the Gold (XAUUSD) price outlook for 2026 and beyond, combining technical analysis, expert forecasts, and key macroeconomic factors. It explains the drivers behind gold’s recent surge, explores potential scenarios including a move toward 4,500 to 5,000 USD per ounce, and highlights why the metal remains a strong hedge during global uncertainty.
Forecasts presented in this section only reflect the author’s private opinion and should not be considered as guidance for trading. RoboForex bears no responsibility for trading results based on trading recommendations described in these analytical reviews.