Daily technical analysis and forecast for 29 January 2026
Here is a detailed daily technical analysis and forecast for EURUSD, USDJPY, GBPUSD, AUDUSD, USDCAD, XAUUSD, and Brent for 29 January 2026.
EURUSD forecast
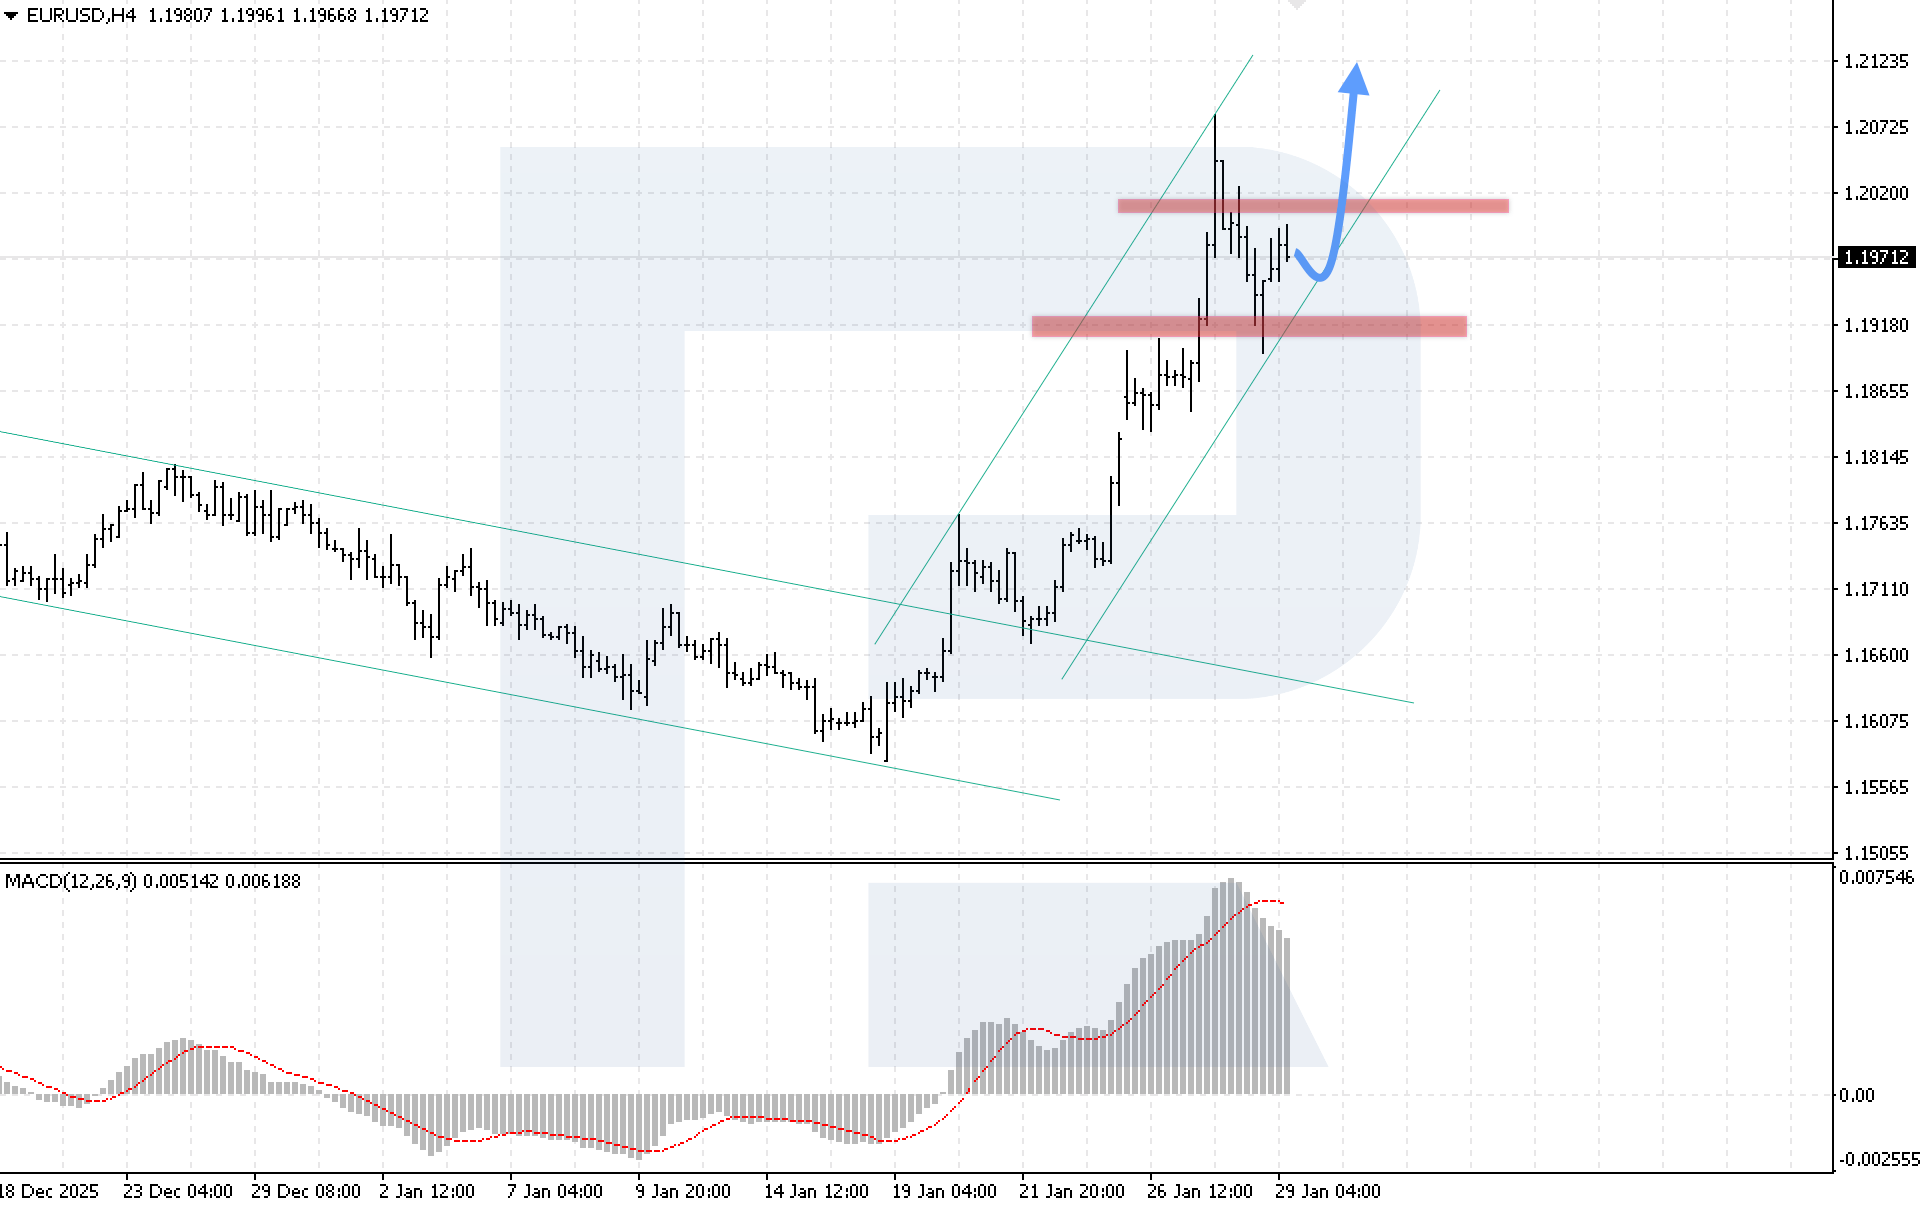
On the H4 chart of the EURUSD currency pair, the market has completed a corrective move, testing the lower boundary of the bullish channel. Buyers are now attempting to regain control, with the key support level located at 1.1915. Today, 29 January 2026, the bearish correction could be complete, with growth continuing towards the 1.2125 level.
The technical picture supports this scenario: prices remain within the ascending channel, while the MACD indicator analysis shows a decline in the histogram, confirming a consolidation phase. A key condition for the bullish EURUSD scenario will be a confident price consolidation above the nearest resistance level at 1.2020.
An alternative scenario will become relevant if the lower boundary of the ascending channel is broken and prices fall below the 1.1915 level, which may trigger a deeper corrective wave.
USDJPY forecast
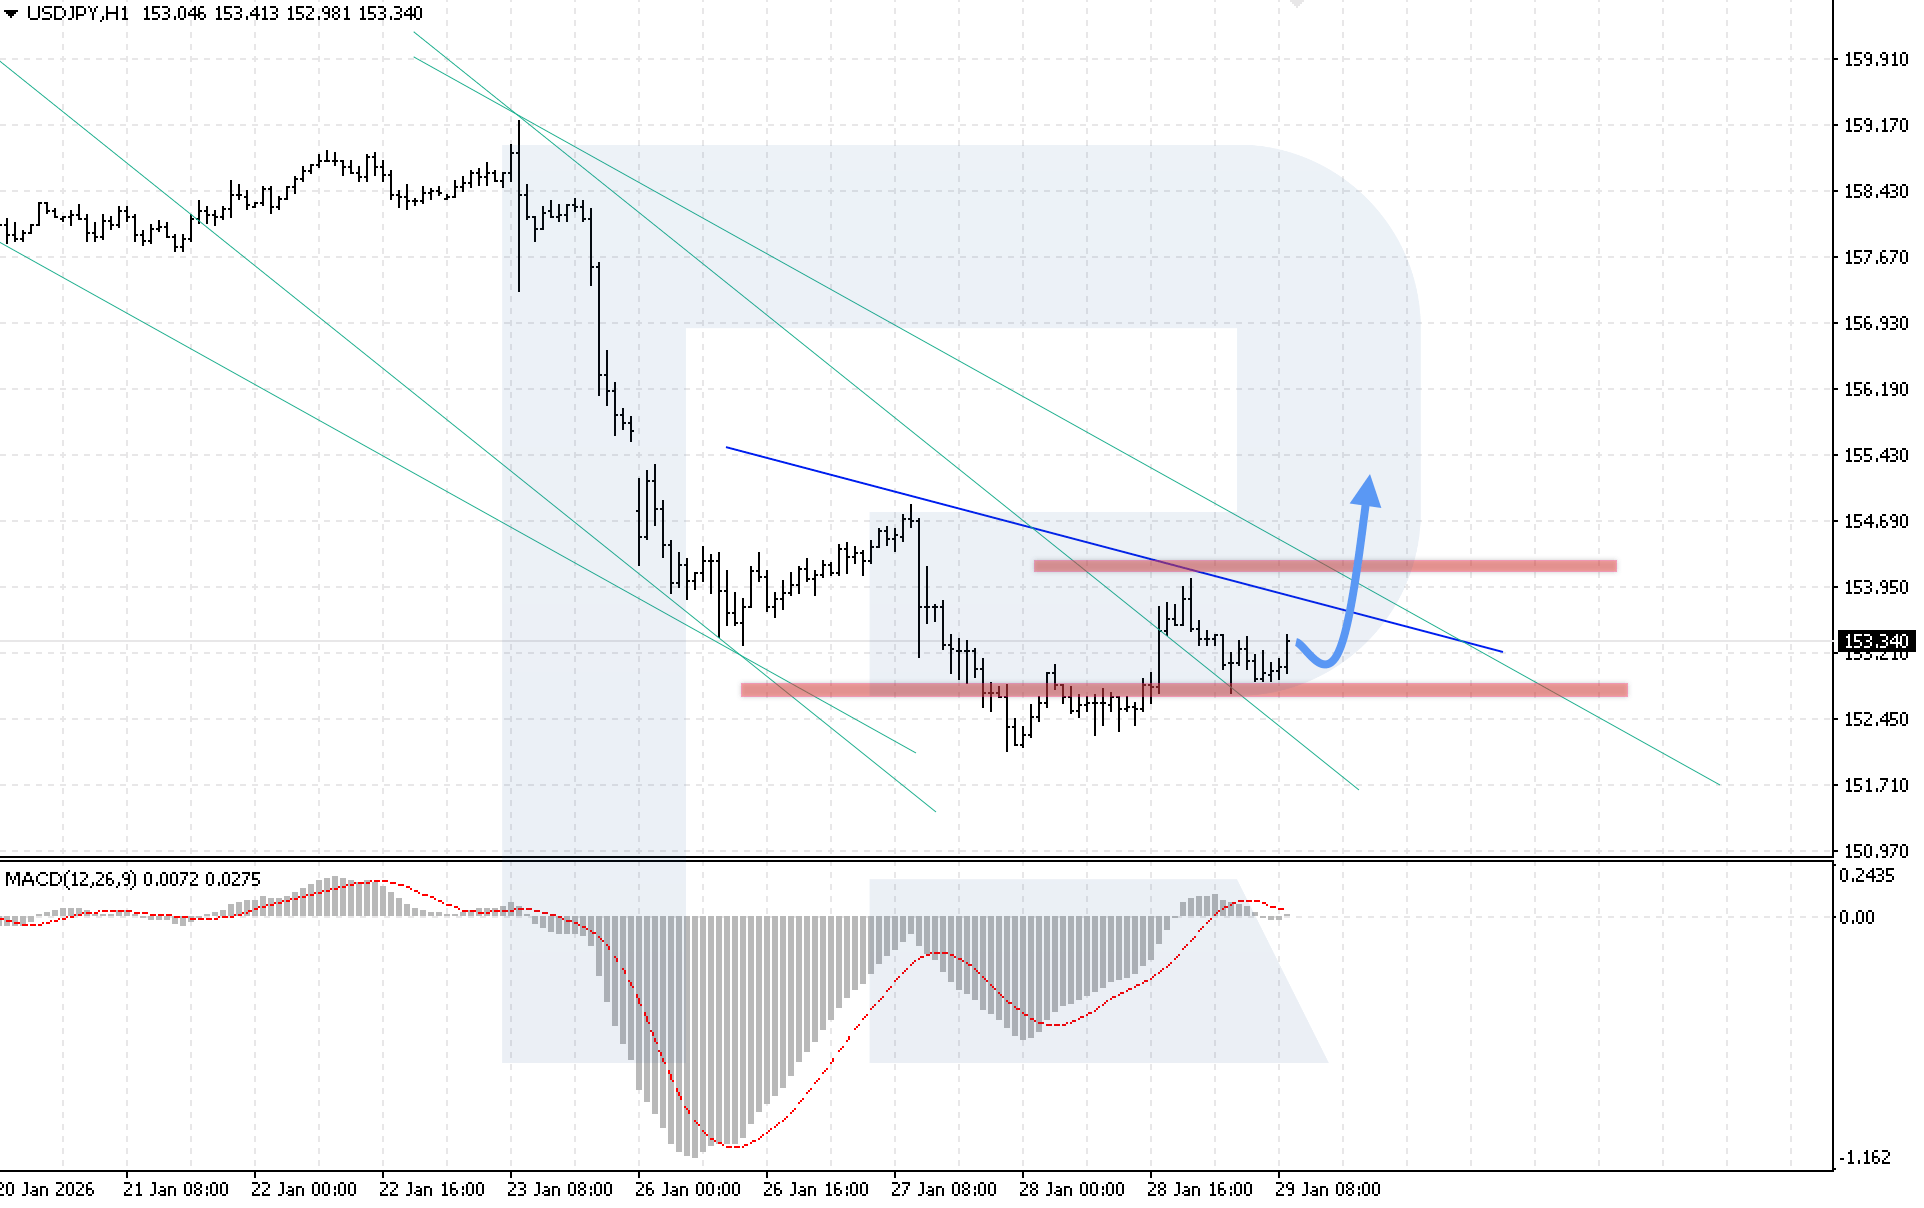
On the H1 chart of the USDJPY currency pair, the market is rising after rebounding from the key support level at 152.70. The nearest resistance level for USDJPY is located at 154.05. Today, 29 January 2026, the pair could gain bullish momentum towards the 154.65 level as a Head and Shoulders reversal pattern plays out.
The technical picture supports this scenario: the reversal pattern is nearing completion, the MACD indicator analysis shows the histogram rising and holding above the zero line, suggesting renewed buying pressure. A key condition for the bullish USDJPY scenario will be a confident price consolidation above the 154.05 level.
An alternative scenario will become relevant if the lower boundary of the reversal pattern is broken and prices consolidate below the 152.40 level, which may trigger a more aggressive decline in USDJPY.
GBPUSD forecast
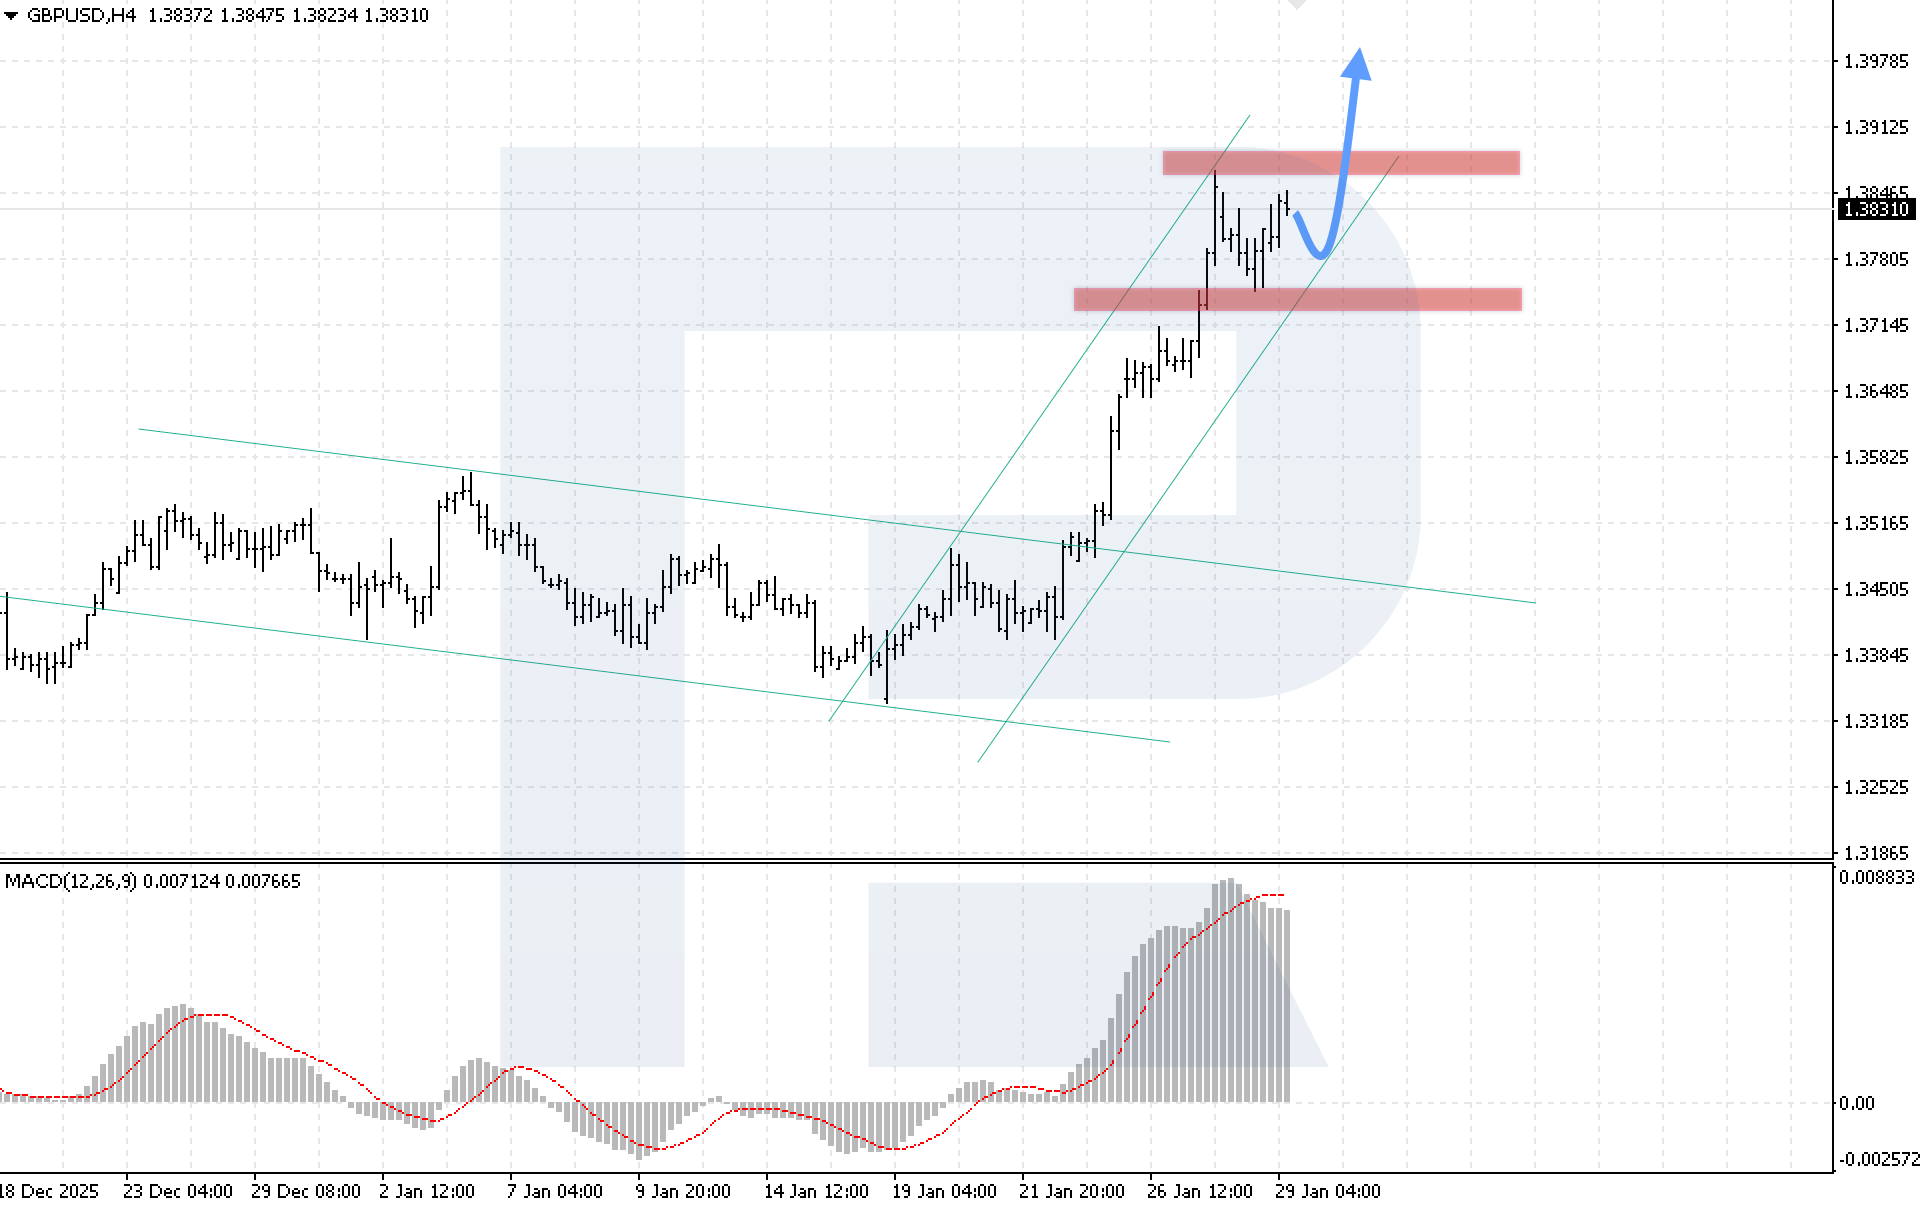
On the H4 chart of the GBPUSD currency pair, the market is rising after rebounding from a support level. The nearest resistance level for GBPUSD is located at 1.3855. Today, 29 January 2026, the bearish correction could be complete, with growth continuing towards the 1.3975 level.
The technical picture supports this scenario: prices remain within an ascending channel, while the MACD indicator analysis shows a slowdown in the decline of the histogram, indicating a likely resumption of the bullish momentum. A key condition for the bullish GBPUSD scenario will be a confident price consolidation above the 1.3855 level.
An alternative scenario will become relevant if the lower boundary of the ascending channel is broken and prices consolidate below the 1.3705 level, which may trigger the activation of a Double Top reversal pattern on GBPUSD.
AUDUSD forecast
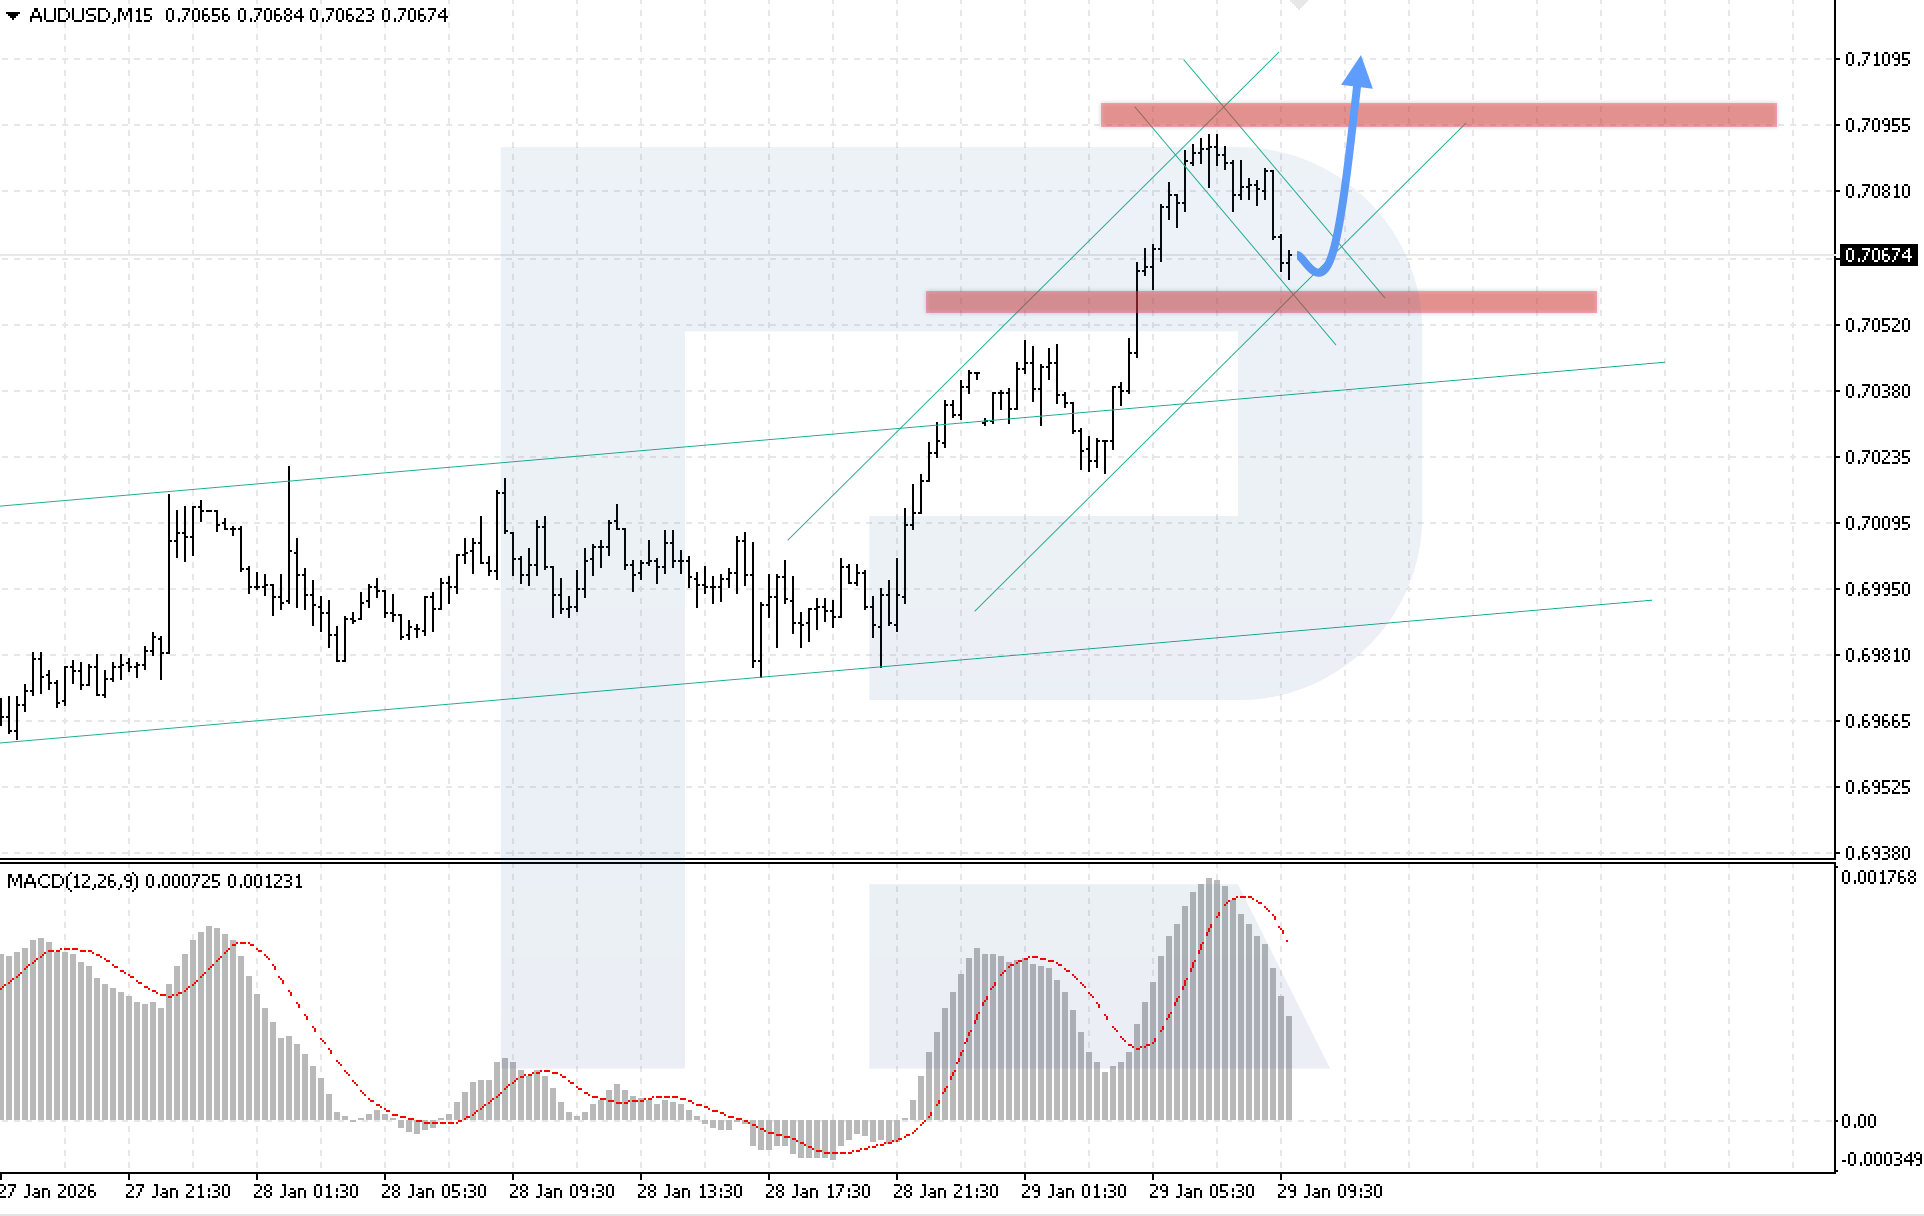
On the M15 chart of the AUDUSD currency pair, the market is moving within a correction phase, approaching the lower boundary of the bullish channel. The nearest resistance level for AUDUSD is located at the 0.7095 level. Today, 29 January 2026, corrective movement could continue towards the 0.7055 level. After the decline is completed, the bullish momentum is expected to resume, with a target at 0.7110.
The technical picture supports this scenario: prices remain within the ascending channel, while MACD indicator analysis indicates a continued decline in the histogram, suggesting a minor extension of the correction. A key condition for the upside AUDUSD scenario will be a confident price consolidation above the 0.7080 level, which would signal a breakout from the corrective channel.
An alternative scenario will become relevant if the lower boundary of the channel is broken and prices consolidate below the 0.7045 level, which may trigger a bearish correction in AUDUSD.
USDCAD forecast
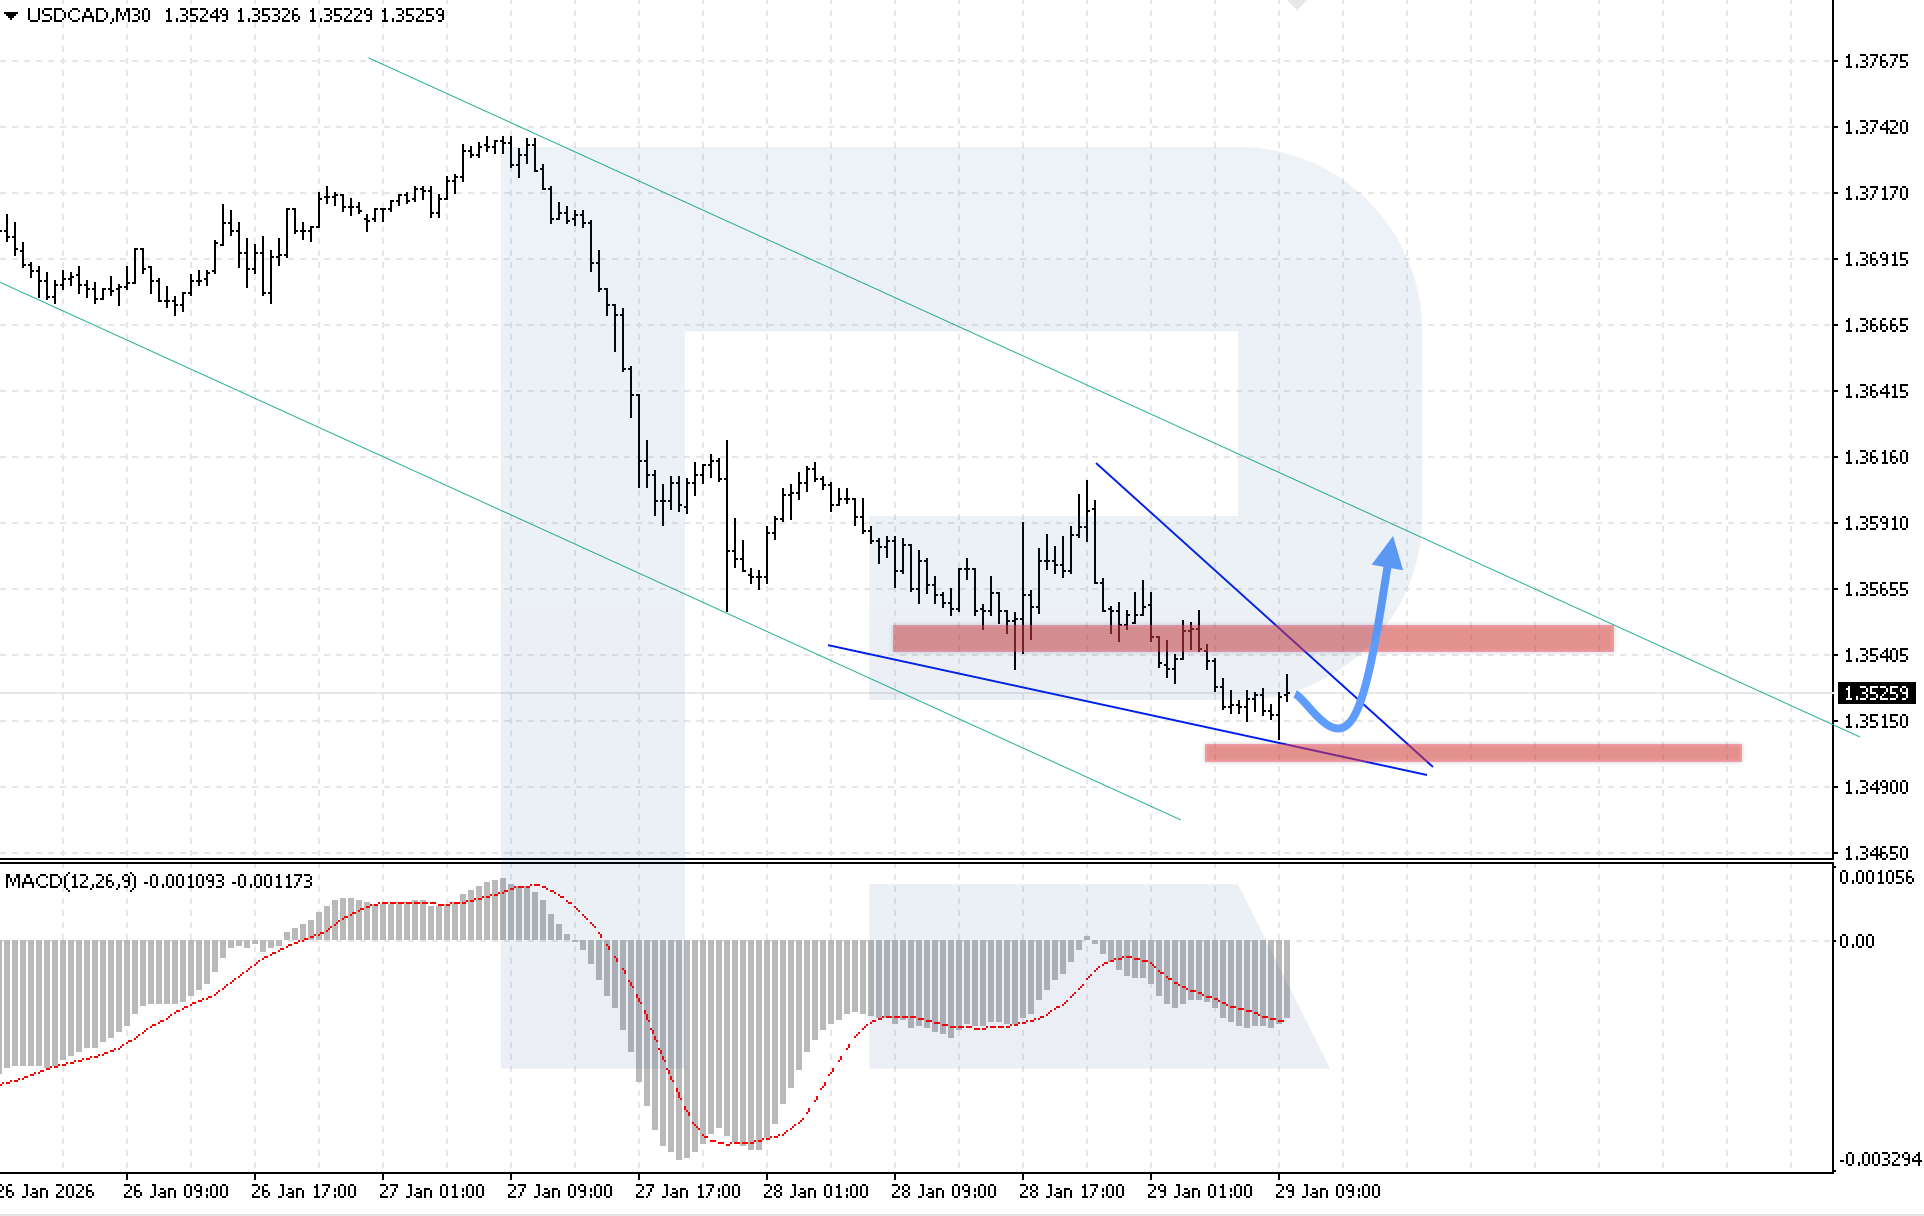
On the M30 chart of the USDCAD currency pair, the market has slowed its decline and shows potential for forming a Wedge reversal pattern. The nearest support level for USDCAD is located at the 1.3495 level. Today, 29 January 2026, a corrective move towards the 1.3515 level is possible. After consolidation is completed, the bullish momentum is expected to resume, with a target at 1.3585.
The technical picture supports this scenario: the decline has significantly slowed near the lower boundary of the reversal pattern, while MACD indicator analysis shows renewed growth in the histogram after a decline, suggesting the potential start of an upward move. A key condition for the USDCAD recovery scenario will be a confident price consolidation above the 1.3545 level, which would confirm activation of the Wedge pattern.
An alternative scenario will become relevant if the lower boundary of the pattern is broken and prices consolidate below the 1.3495 level.
XAUUSD forecast
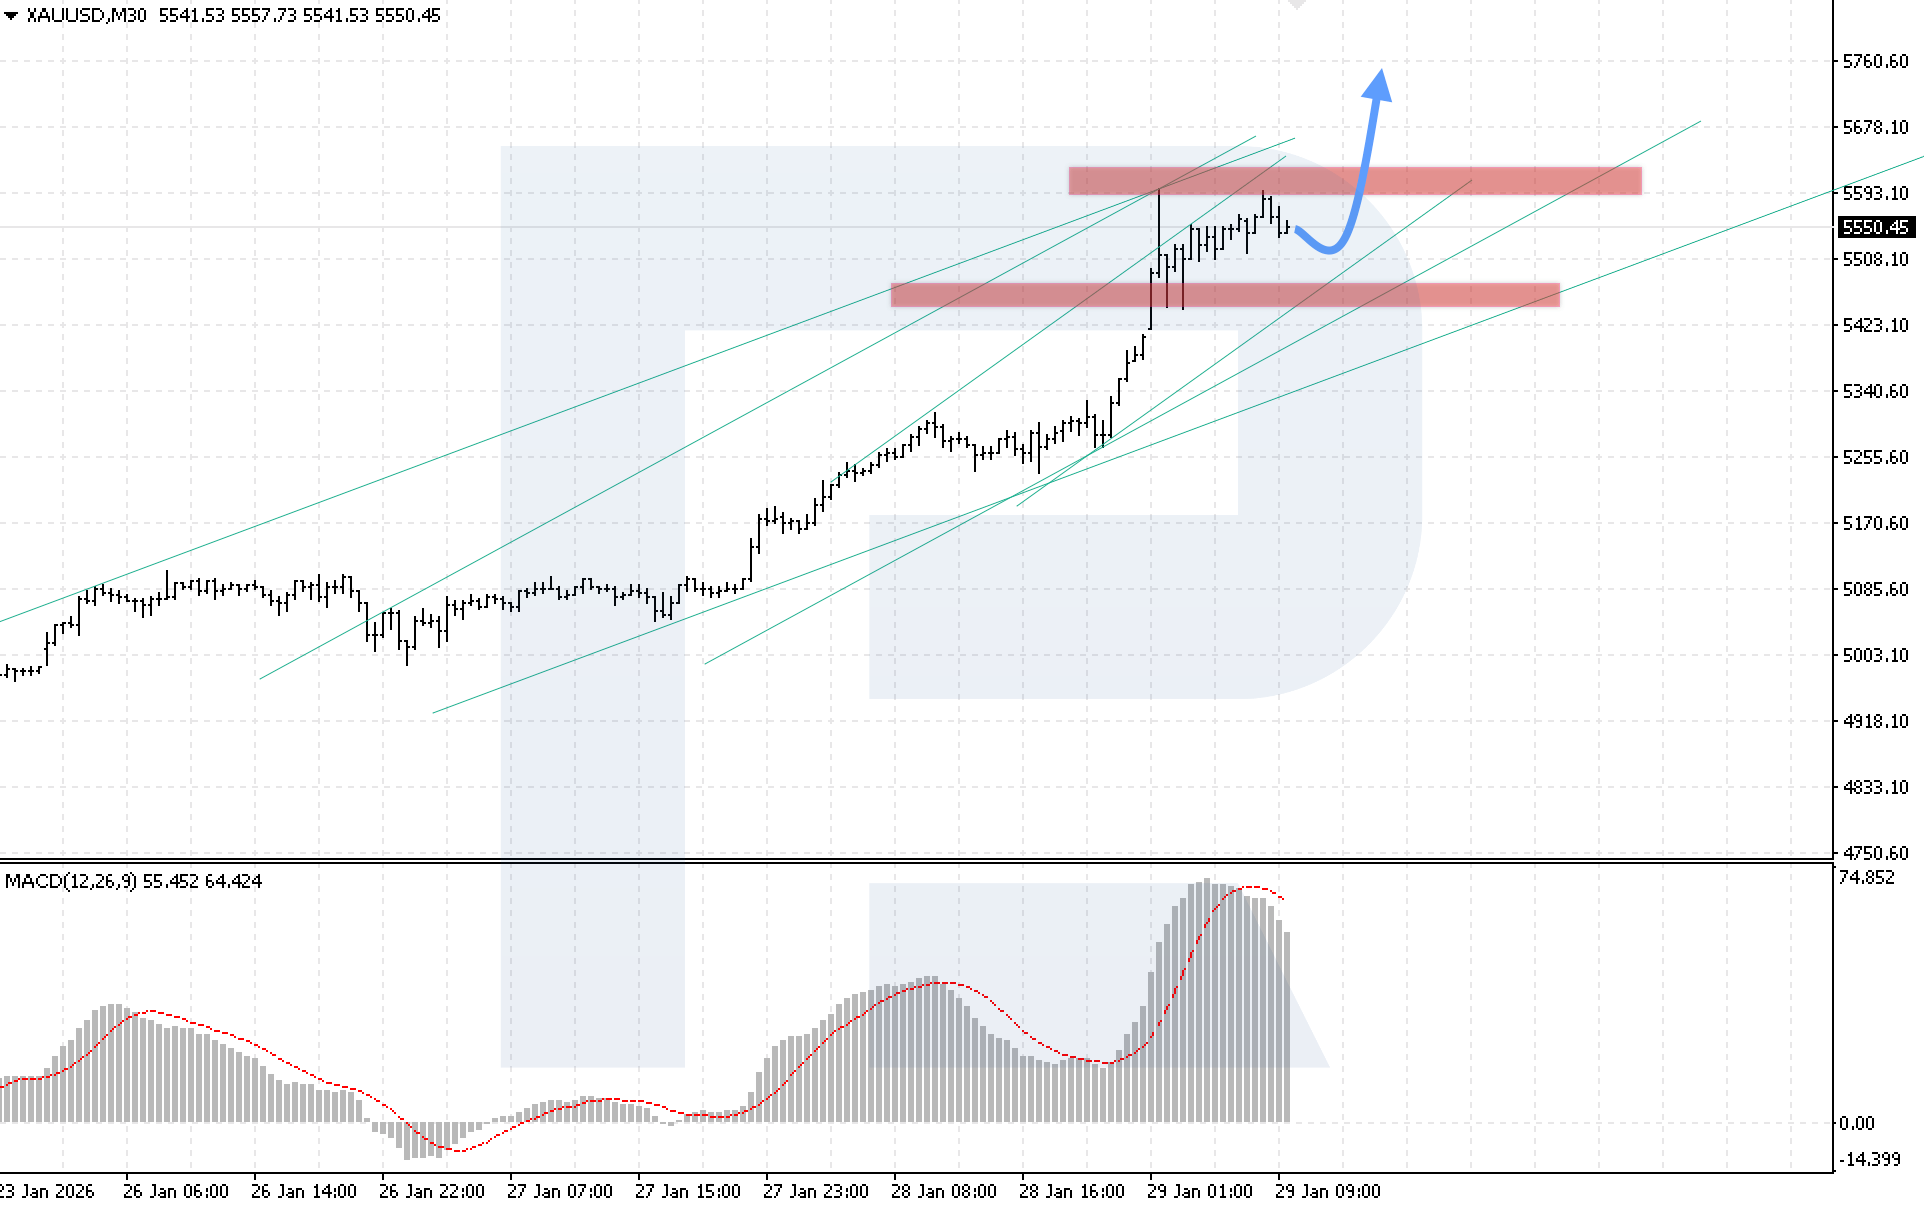
On the M30 chart of the XAUUSD currency pair, the market is rising actively, but buyers have encountered resistance at the 5,595 level. The nearest support level for XAUUSD is located at the 5,495 level. Today, 29 January 2026, a corrective move towards the lower boundary of the channel is likely. After the decline is completed, the pair is expected to regain bullish momentum, with a target at 5,765.
The technical picture supports this scenario: prices are holding near the upper boundary of the bullish channel, while the MACD indicator analysis shows a slowdown in histogram growth, indicating a potential correction phase before further upside. A key condition for the XAUUSD growth scenario will be a confident price consolidation above the 5,595 level.
An alternative scenario will become relevant if the lower boundary of the bullish channel is broken and prices consolidate below the 5,460 level, which may trigger a decline in XAUUSD towards the next support at 5,345.
Brent forecast
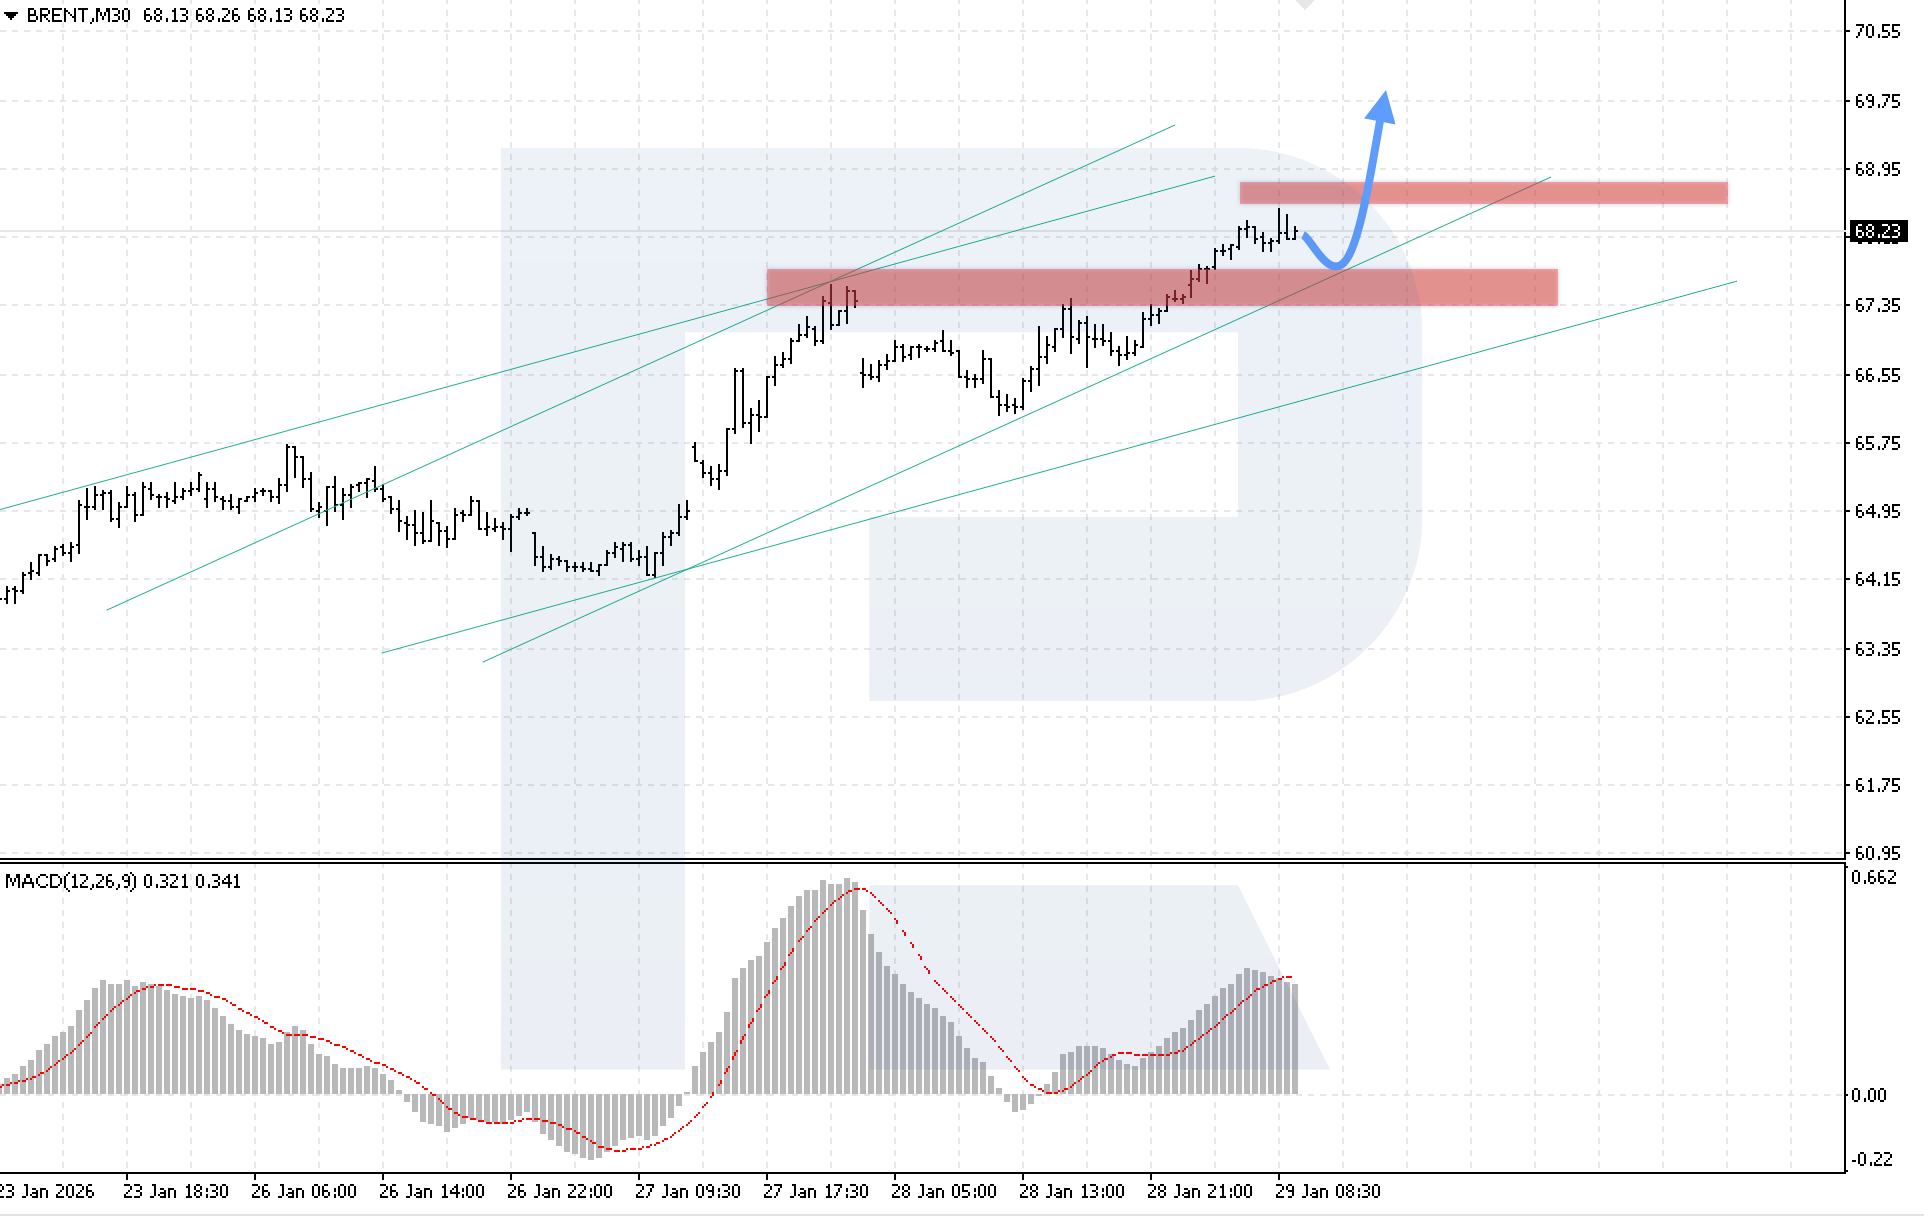
On the M30 chart of Brent crude oil, the market is rising after breaking above a local resistance level. The nearest support for Brent is located at 67.45. Today, 29 January 2026, a corrective move towards this support level is possible. After the decline is completed, the bullish momentum is expected to resume, with a target at 69.85.
The technical picture supports the bullish scenario: prices rebounded from the lower boundary of the channel and are moving towards the upper boundary, while the MACD indicator analysis points to renewed growth of the histogram, indicating increasing bullish pressure. A key condition for the upside Brent scenario will be a confident price consolidation above the 68.75 level.
An alternative scenario will become relevant if the lower boundary of the bullish channel is broken and prices consolidate below the 67.35 level, which may trigger a deeper bearish correction in Brent prices.
Editors’ picks
 EURUSD 2026-2027 forecast: key market trends and future predictions
This article provides the EURUSD forecast for 2026 and 2027 and highlights the main factors determining the direction of the pair’s movements. We will apply technical analysis, take into account the opinions of leading experts, large banks, and financial institutions, and study AI-based forecasts. This comprehensive insight into EURUSD predictions should help investors and traders make informed decisions.
 Gold (XAUUSD) forecast 2026 and beyond: expert insights, price predictions, and analysis
Dive deep into the Gold (XAUUSD) price outlook for 2026 and beyond, combining technical analysis, expert forecasts, and key macroeconomic factors. It explains the drivers behind gold’s recent surge, explores potential scenarios including a move toward 4,500 to 5,000 USD per ounce, and highlights why the metal remains a strong hedge during global uncertainty.
Forecasts presented in this section only reflect the author’s private opinion and should not be considered as guidance for trading. RoboForex bears no responsibility for trading results based on trading recommendations described in these analytical reviews.