Daily technical analysis and forecast for 30 January 2026
Here is a detailed daily technical analysis and forecast for EURUSD, USDJPY, GBPUSD, AUDUSD, USDCAD, XAUUSD, and Brent for 30 January 2026.
EURUSD forecast
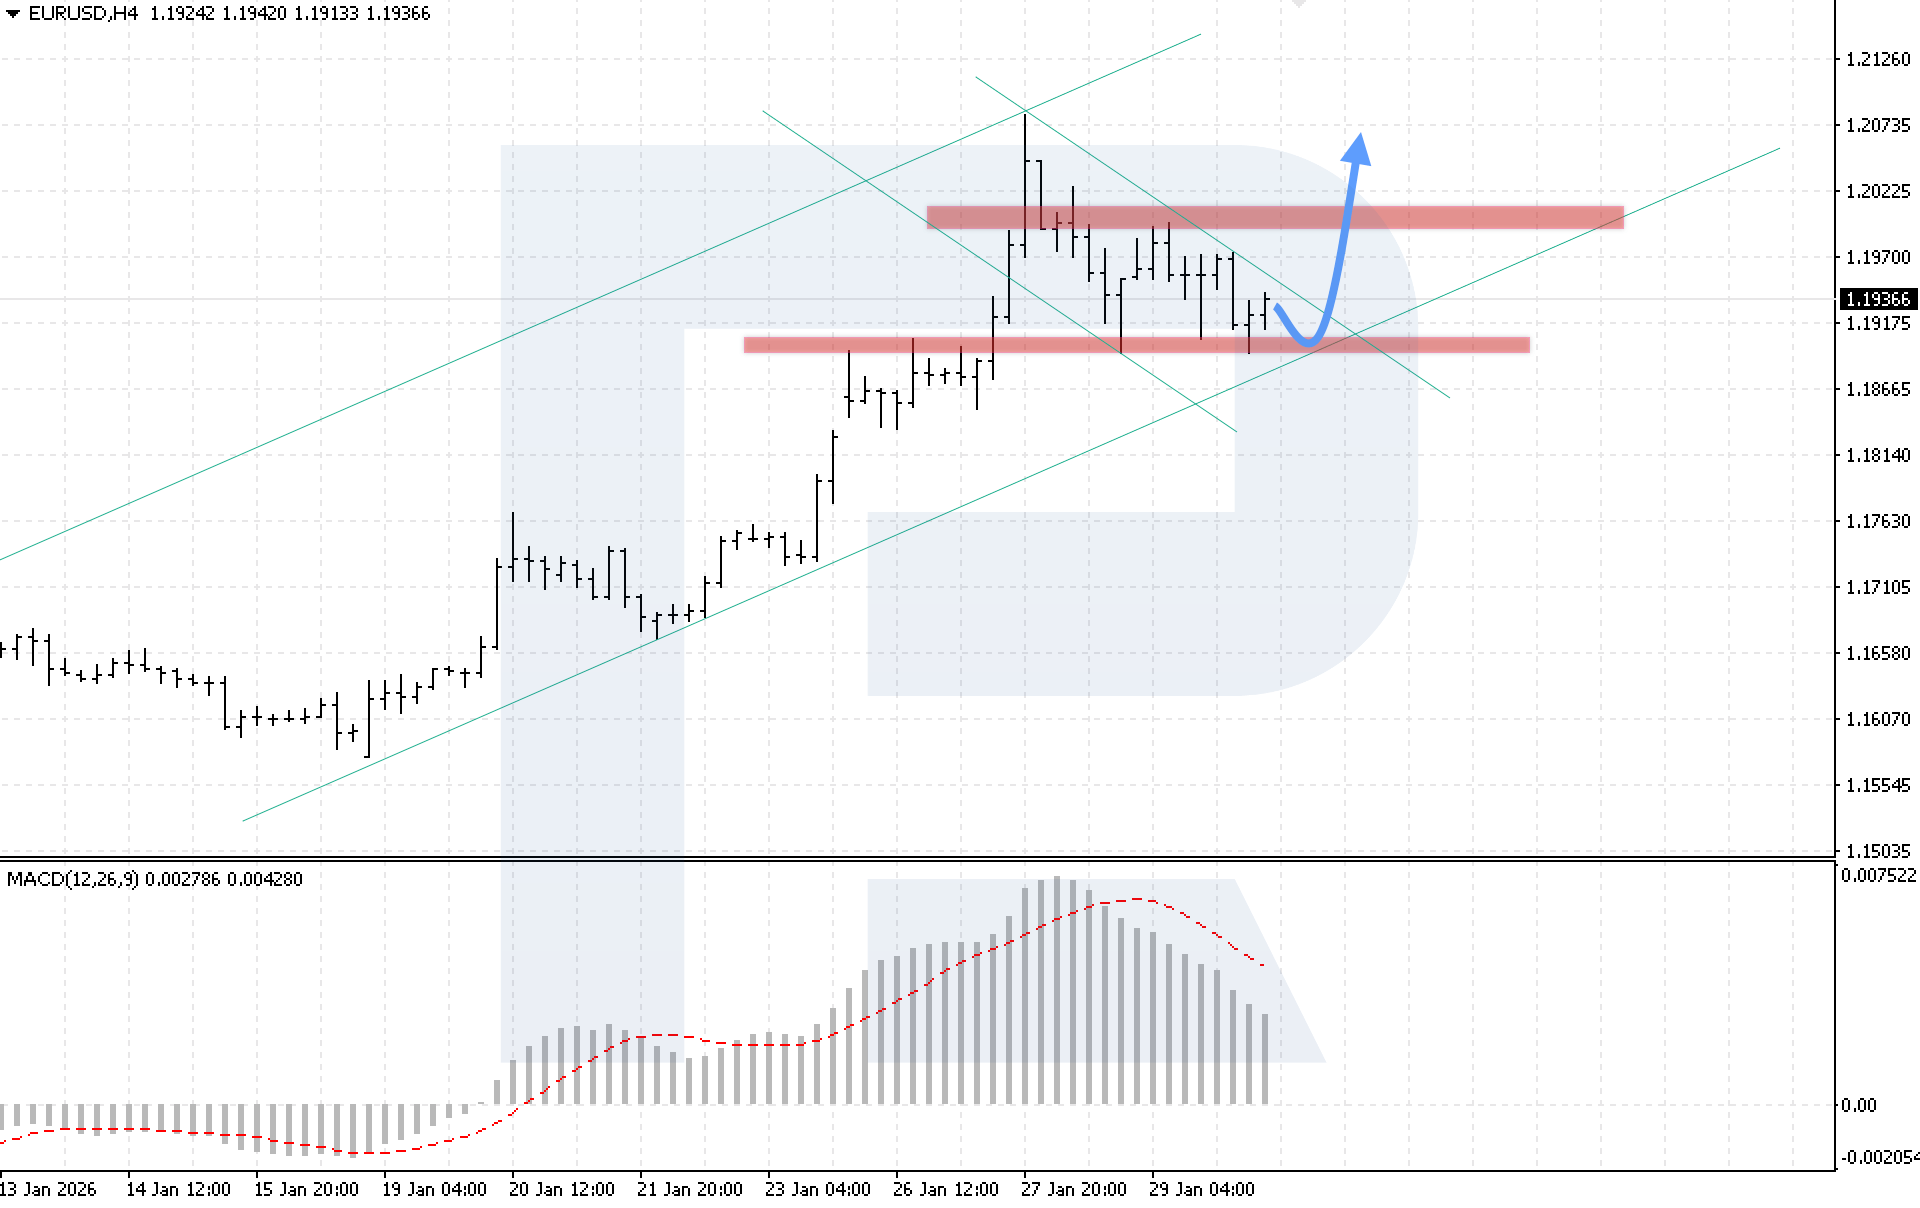
On the H4 chart of the EURUSD currency pair, the market continues to move within a corrective phase. Buyers are holding the key support level at 1.1895, preventing a breakout and showing repeated attempts to push prices higher after each test of this level. Today, 30 January 2026, bullish momentum could form, aiming for the 1.2075 level.
The technical picture confirms this scenario: prices remain within an ascending channel, while MACD indicator analysis shows a declining histogram, reflecting a consolidation phase. A key condition for the bullish scenario will be confident price consolidation above the 1.1965 resistance level, which would indicate a breakout of the descending corrective channel.
An alternative scenario will become relevant if the lower boundary of the ascending channel is broken and prices fall below the 1.1885 level, which may trigger a deeper corrective wave.
USDJPY forecast
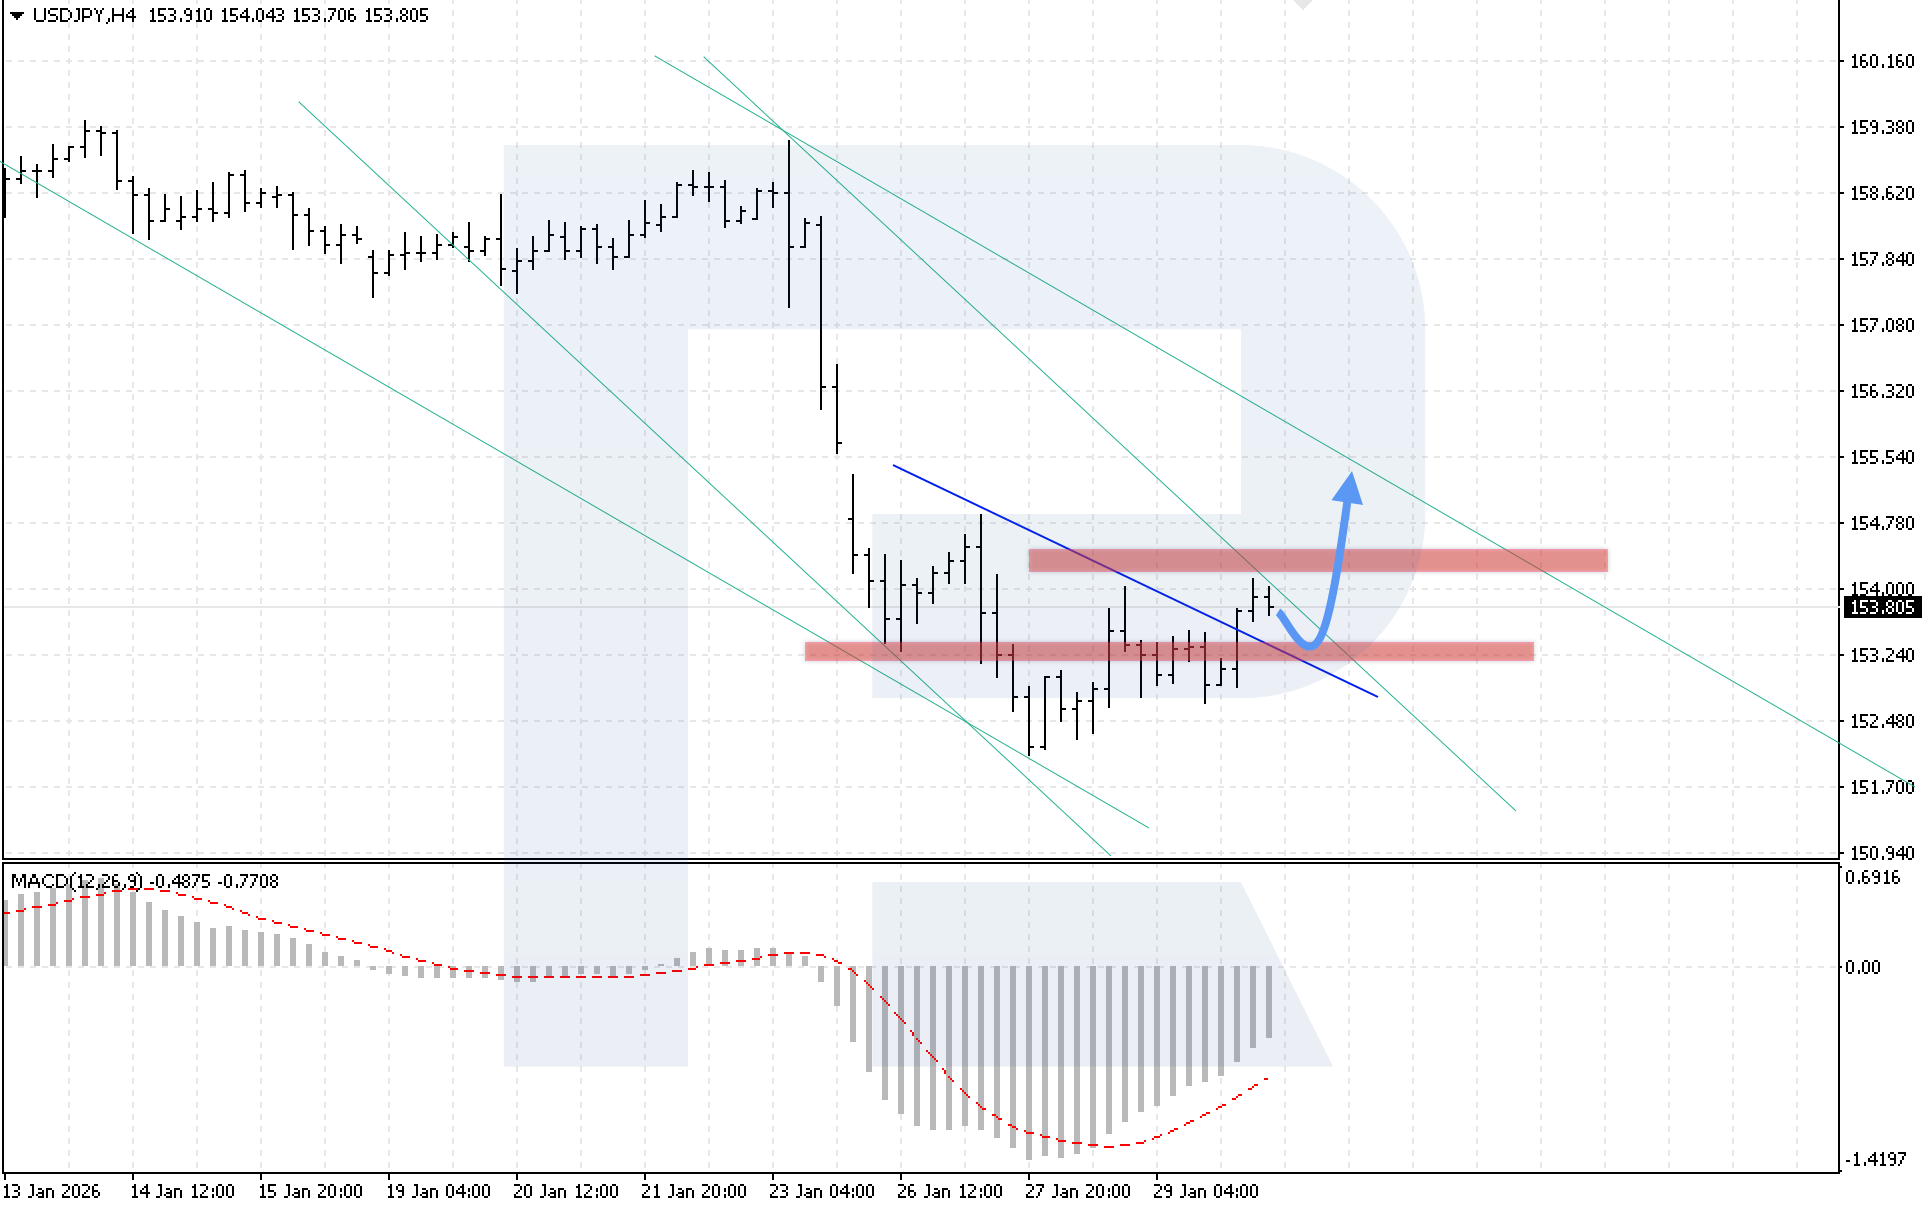
On the H4 chart of the USDJPY currency pair, the market continues to rise after breaking above the upper boundary of the Head and Shoulders reversal pattern. Buyers have encountered resistance at the upper boundary of the descending channel. The nearest support is located at the 153.25 level. Today, 30 January 2026, bullish momentum could develop, targeting the 155.45 level as part of the completion of the reversal pattern.
The technical picture confirms this scenario: MACD indicator analysis shows the histogram rising, indicating increasing buying pressure. A key condition for the bullish scenario will be confident price consolidation above the 154.45 level, which would signal a breakout above the upper boundary of the channel.
An alternative scenario becomes relevant if the lower boundary of the reversal pattern is broken, with prices consolidating below the 152.45 level, which may trigger a bearish impulse in USDJPY.
GBPUSD forecast
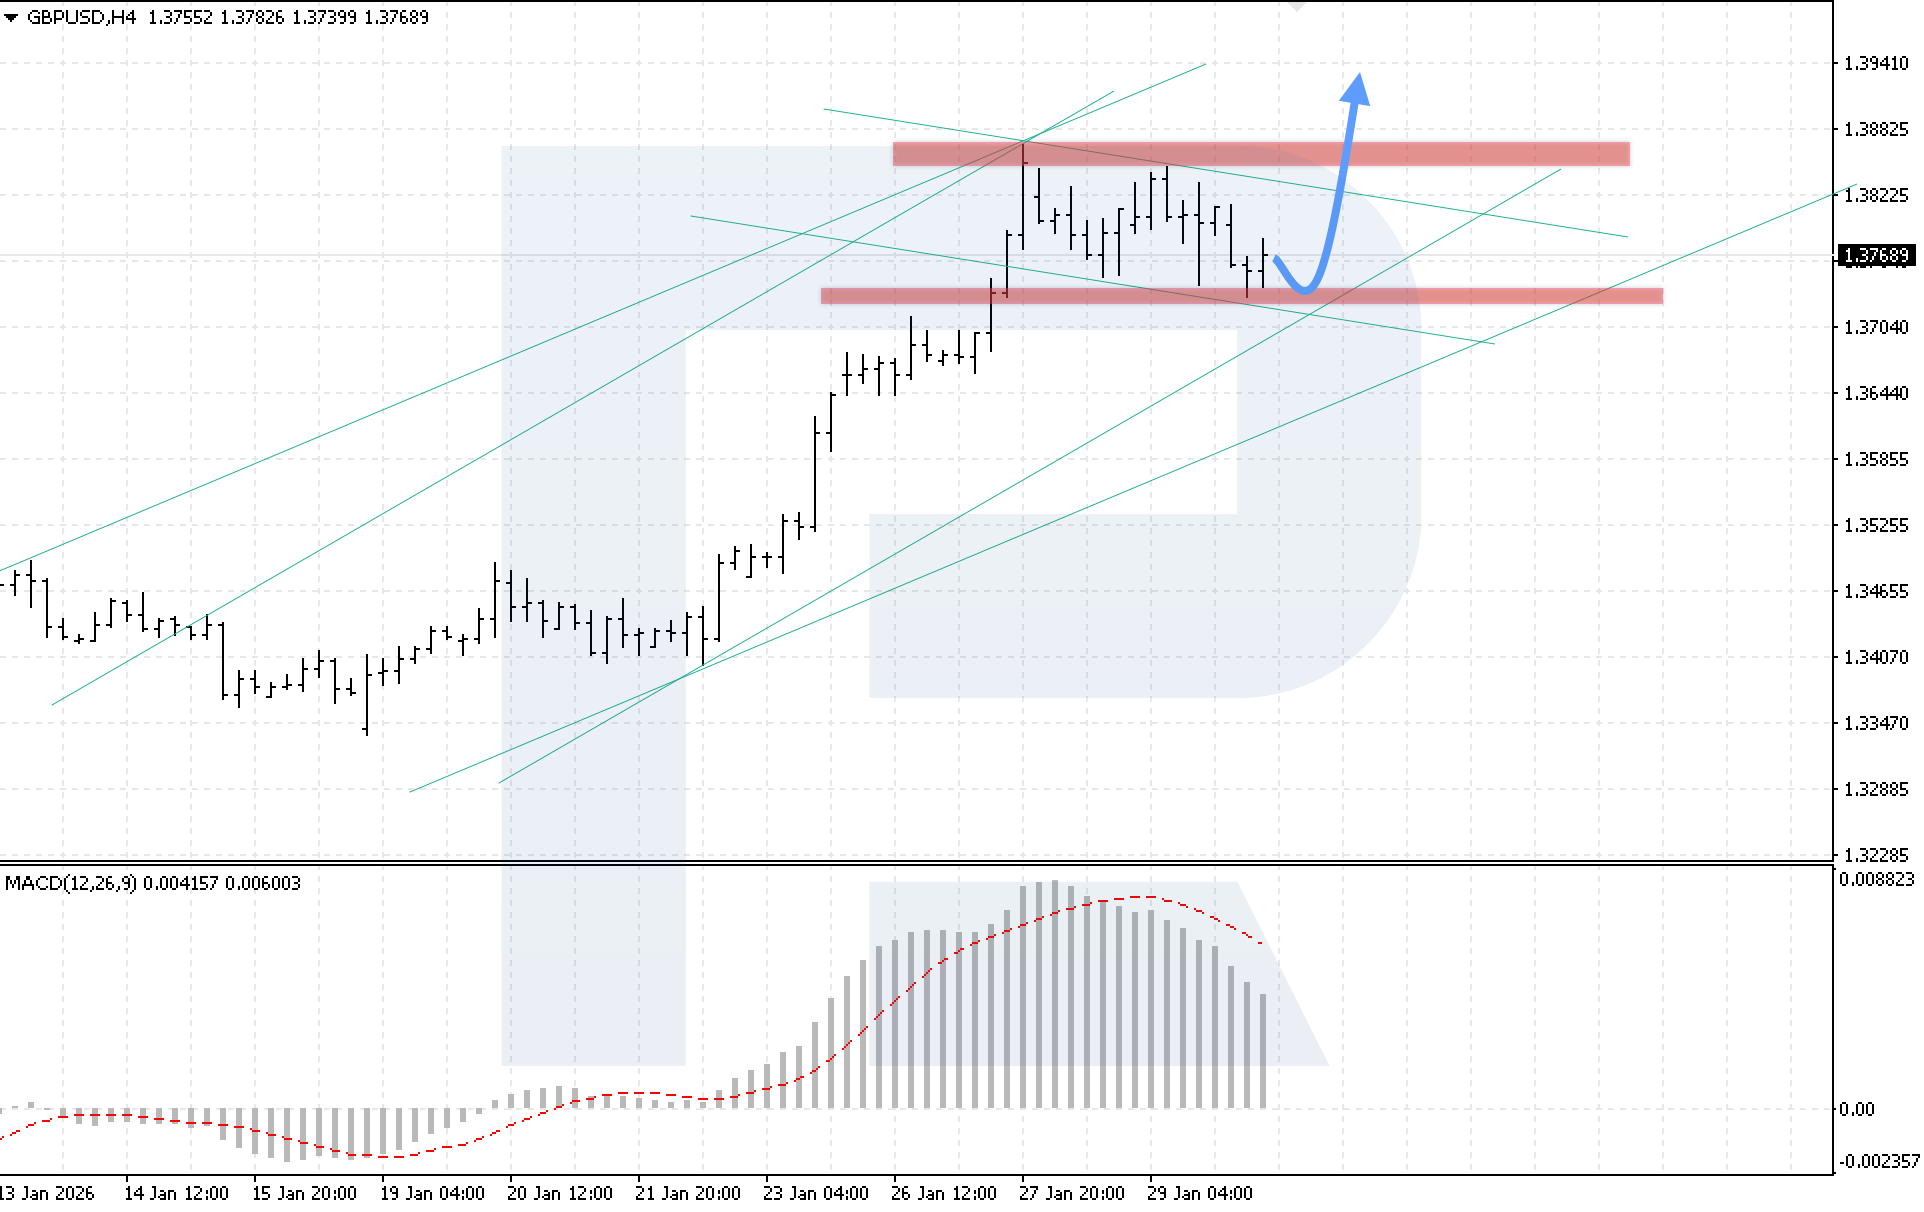
On the H4 chart of the GBPUSD currency pair, the market is rebounding from the support level at 1.3755. The nearest resistance level is located at 1.3845. Today, 30 January 2026, the correction could be complete, followed by renewed bullish momentum with a target at 1.3945.
The technical picture confirms this scenario: prices remain within the ascending channel and above key support, while MACD indicator analysis shows the histogram slowing, reflecting a consolidation phase. A key condition for the bullish scenario will be confident price consolidation above the 1.3845 level, indicating a breakout above the upper boundary of the corrective channel.
An alternative scenario will become relevant if the lower boundary of the ascending channel is broken and prices consolidate below the 1.3685 level, which may trigger a downward wave.
AUDUSD forecast
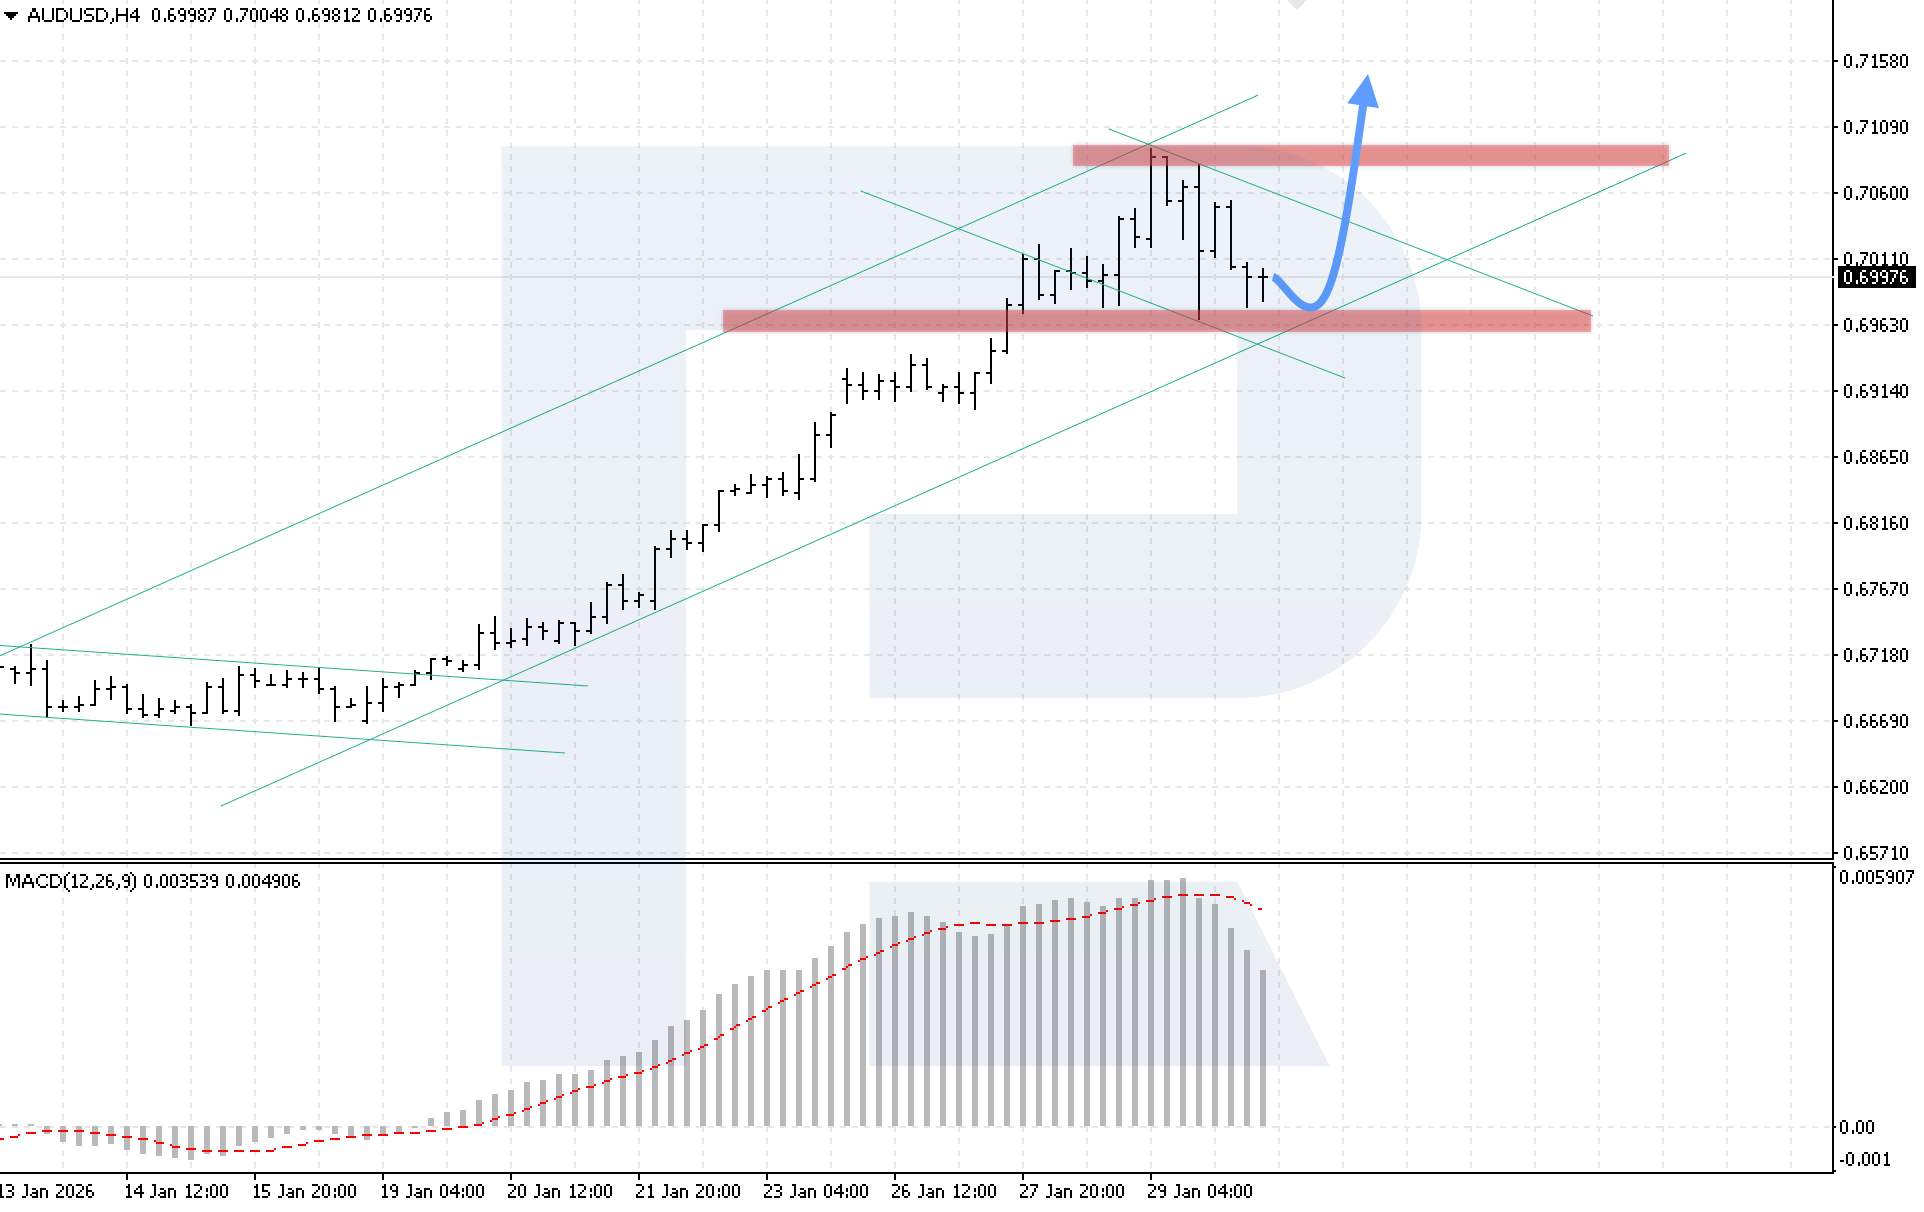
On the H4 chart of the AUDUSD currency pair, the market continues to move within a correction phase, rebounding from the key support level at 0.6965. The nearest resistance is located at the 0.7095 level. Today, 30 January 2026, the bearish correction could be complete, with the bullish momentum resuming towards 0.7145.
The technical picture confirms this scenario: prices remain within the ascending channel, while MACD indicator analysis shows a declining histogram, reflecting the continuation of the consolidation phase. A key condition for the upside scenario will be confident price consolidation above the 0.7065 level, which would signal a breakout of the upper boundary of the corrective channel.
An alternative scenario becomes relevant if the lower boundary of the channel is broken and prices consolidate below the 0.6940 level, which may trigger a deeper bearish correction in AUDUSD.
USDCAD forecast
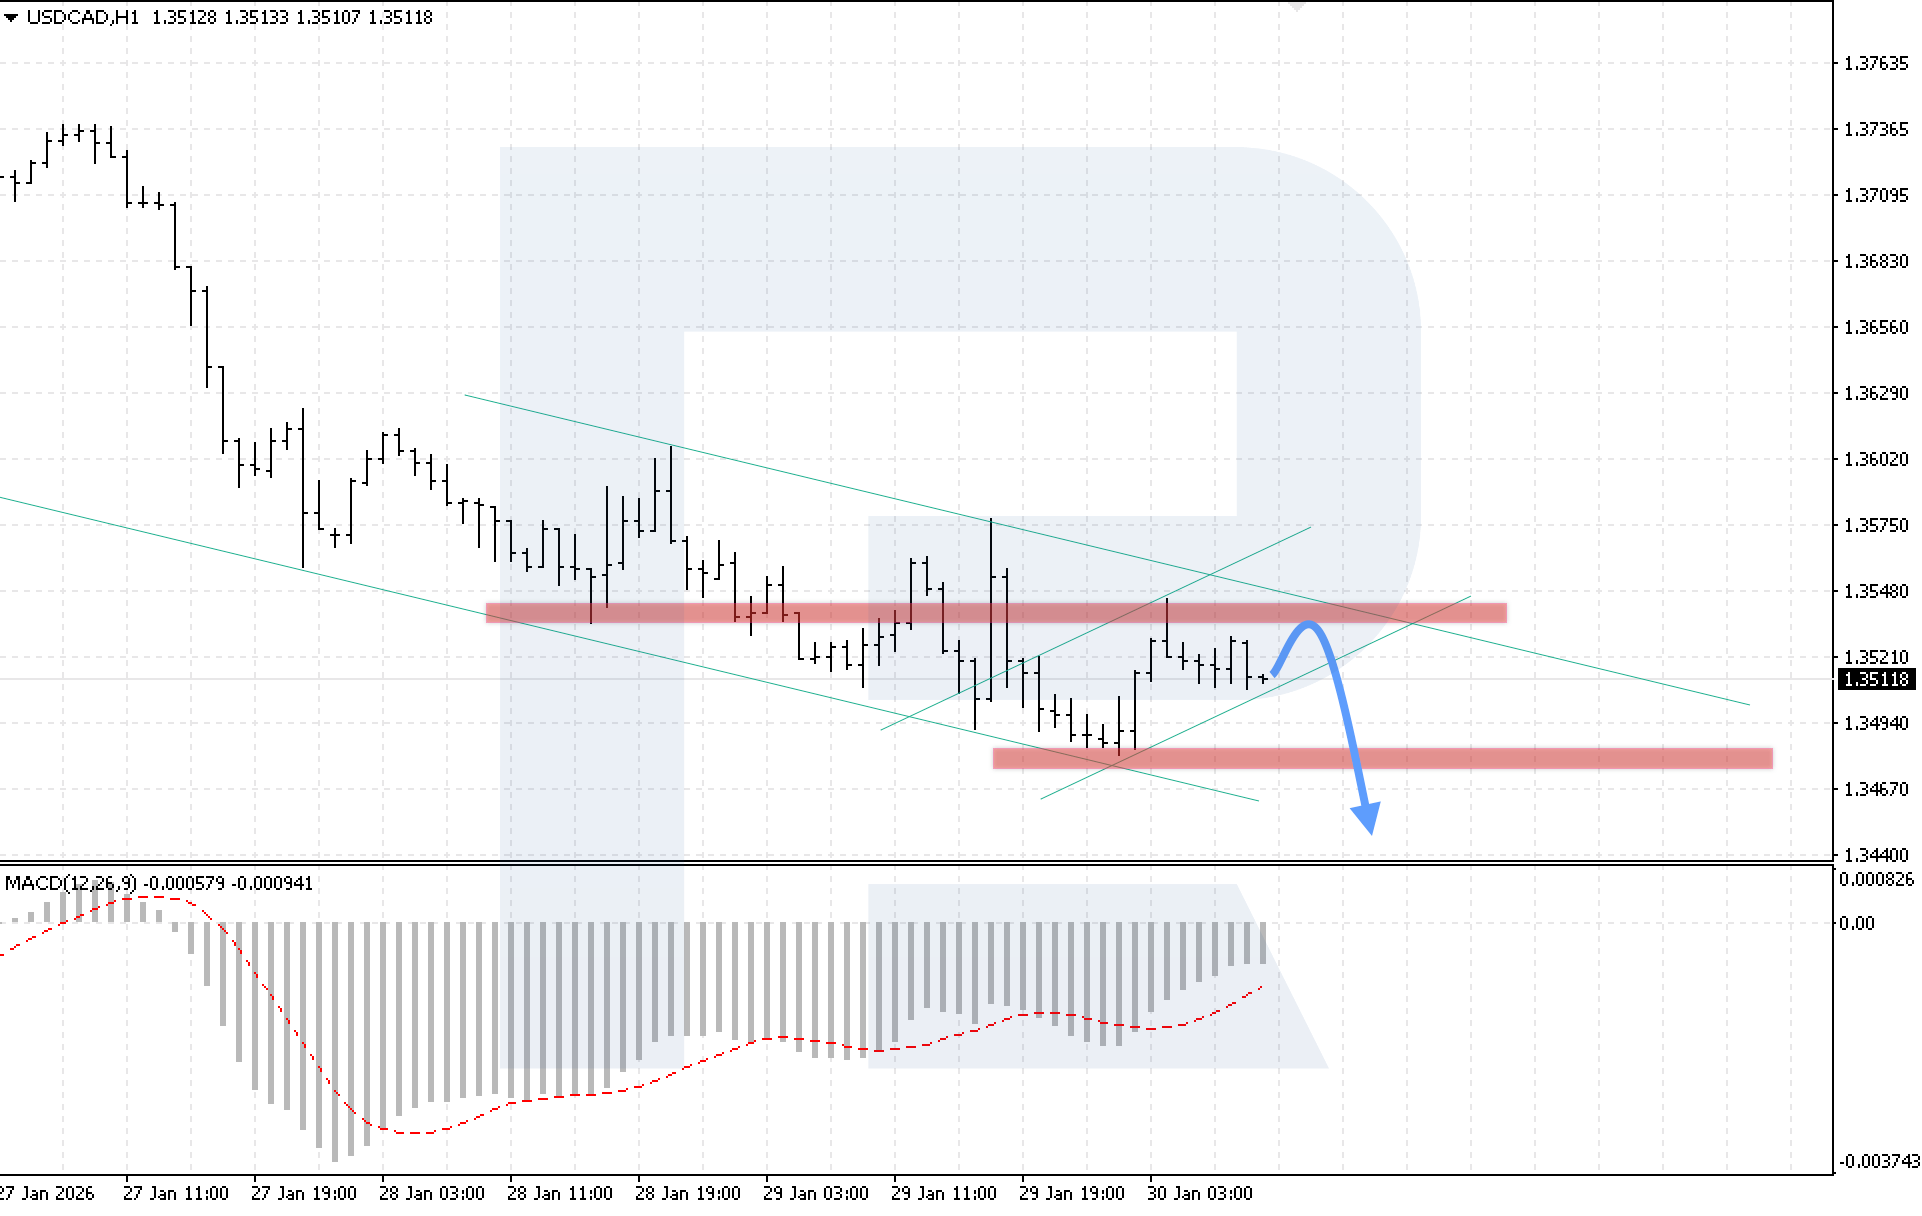
On the H1 chart of the USDCAD currency pair, the market failed to consolidate above the upper boundary of the descending channel and continued to decline. The nearest support level is located at 1.3480. Today, 30 January 2026, a short-term rise towards the 1.3515 level is possible, after which the bearish momentum could resume, aiming for 1.3435.
The technical picture confirms this scenario: buyers lacked the strength to consolidate above the nearest resistance, while MACD indicator analysis shows a renewed decline in the histogram, indicating the completion of the corrective phase and continuation of the downtrend. A key condition for implementing the bearish scenario will be confident price consolidation below the 1.3495 level.
An alternative scenario becomes relevant if the upper boundary of the channel is broken and prices consolidate above the 1.3565 level, which may initiate a more significant upward move.
XAUUSD forecast
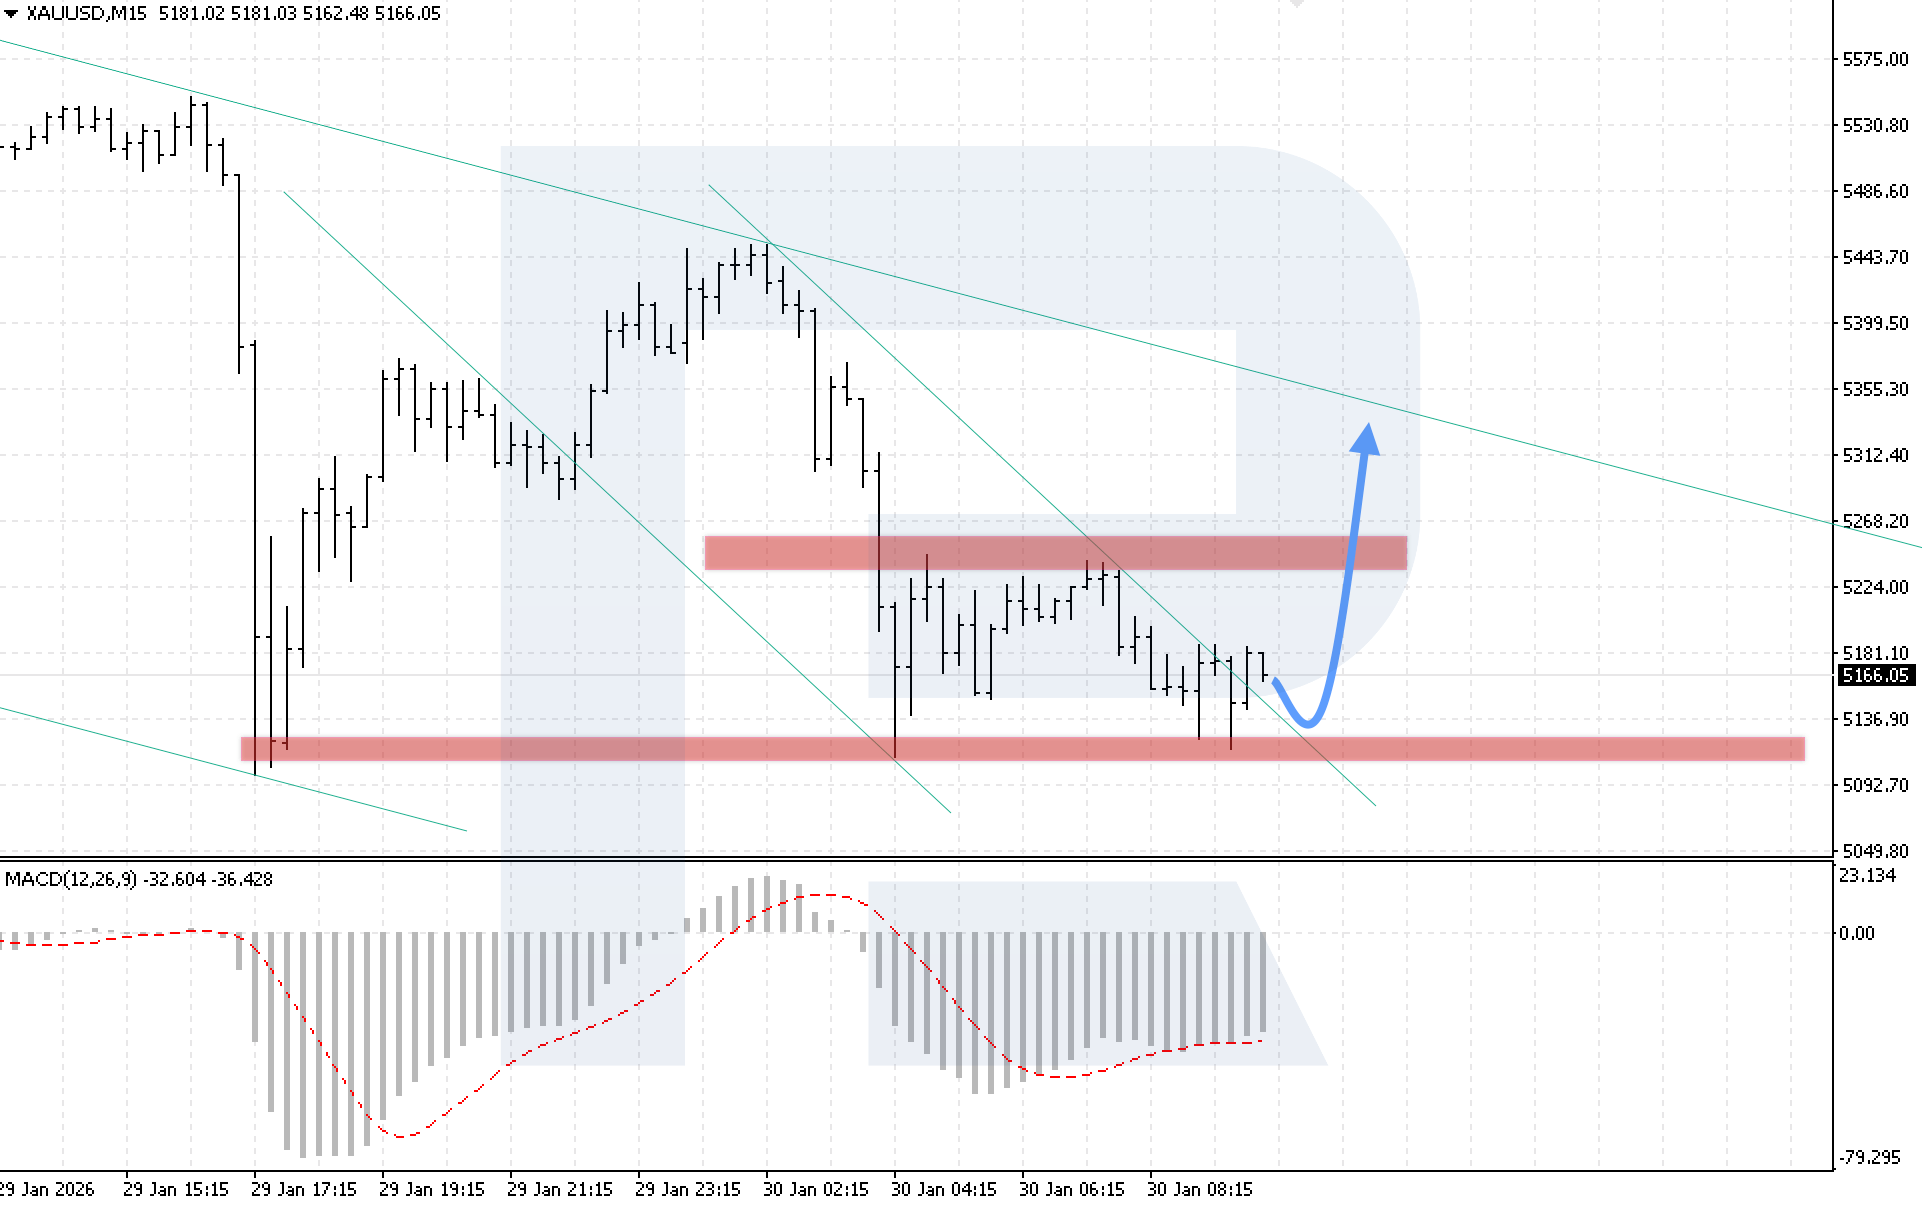
On the M15 chart of the XAUUSD pair, the market continues to decline, with sellers actively testing the key support level at 5,105. The nearest resistance is located at 5,240. Today, 30 January 2026, prices could rebound from the lower boundary of the Double Bottom reversal pattern. After the decline is completed, the bullish momentum might resume, with a target at the 5,315 level.
The technical picture confirms this scenario: prices have exited the descending channel, while MACD indicator analysis shows the formation of a bullish divergence, indicating a likely end to the decline. A key condition for the upside scenario will be confident price consolidation above the 5,240 level.
An alternative scenario becomes relevant if the lower boundary of the bullish channel is broken and prices consolidate below the 5,090 level, which may trigger a continuation of the decline in XAUUSD prices.
Brent forecast
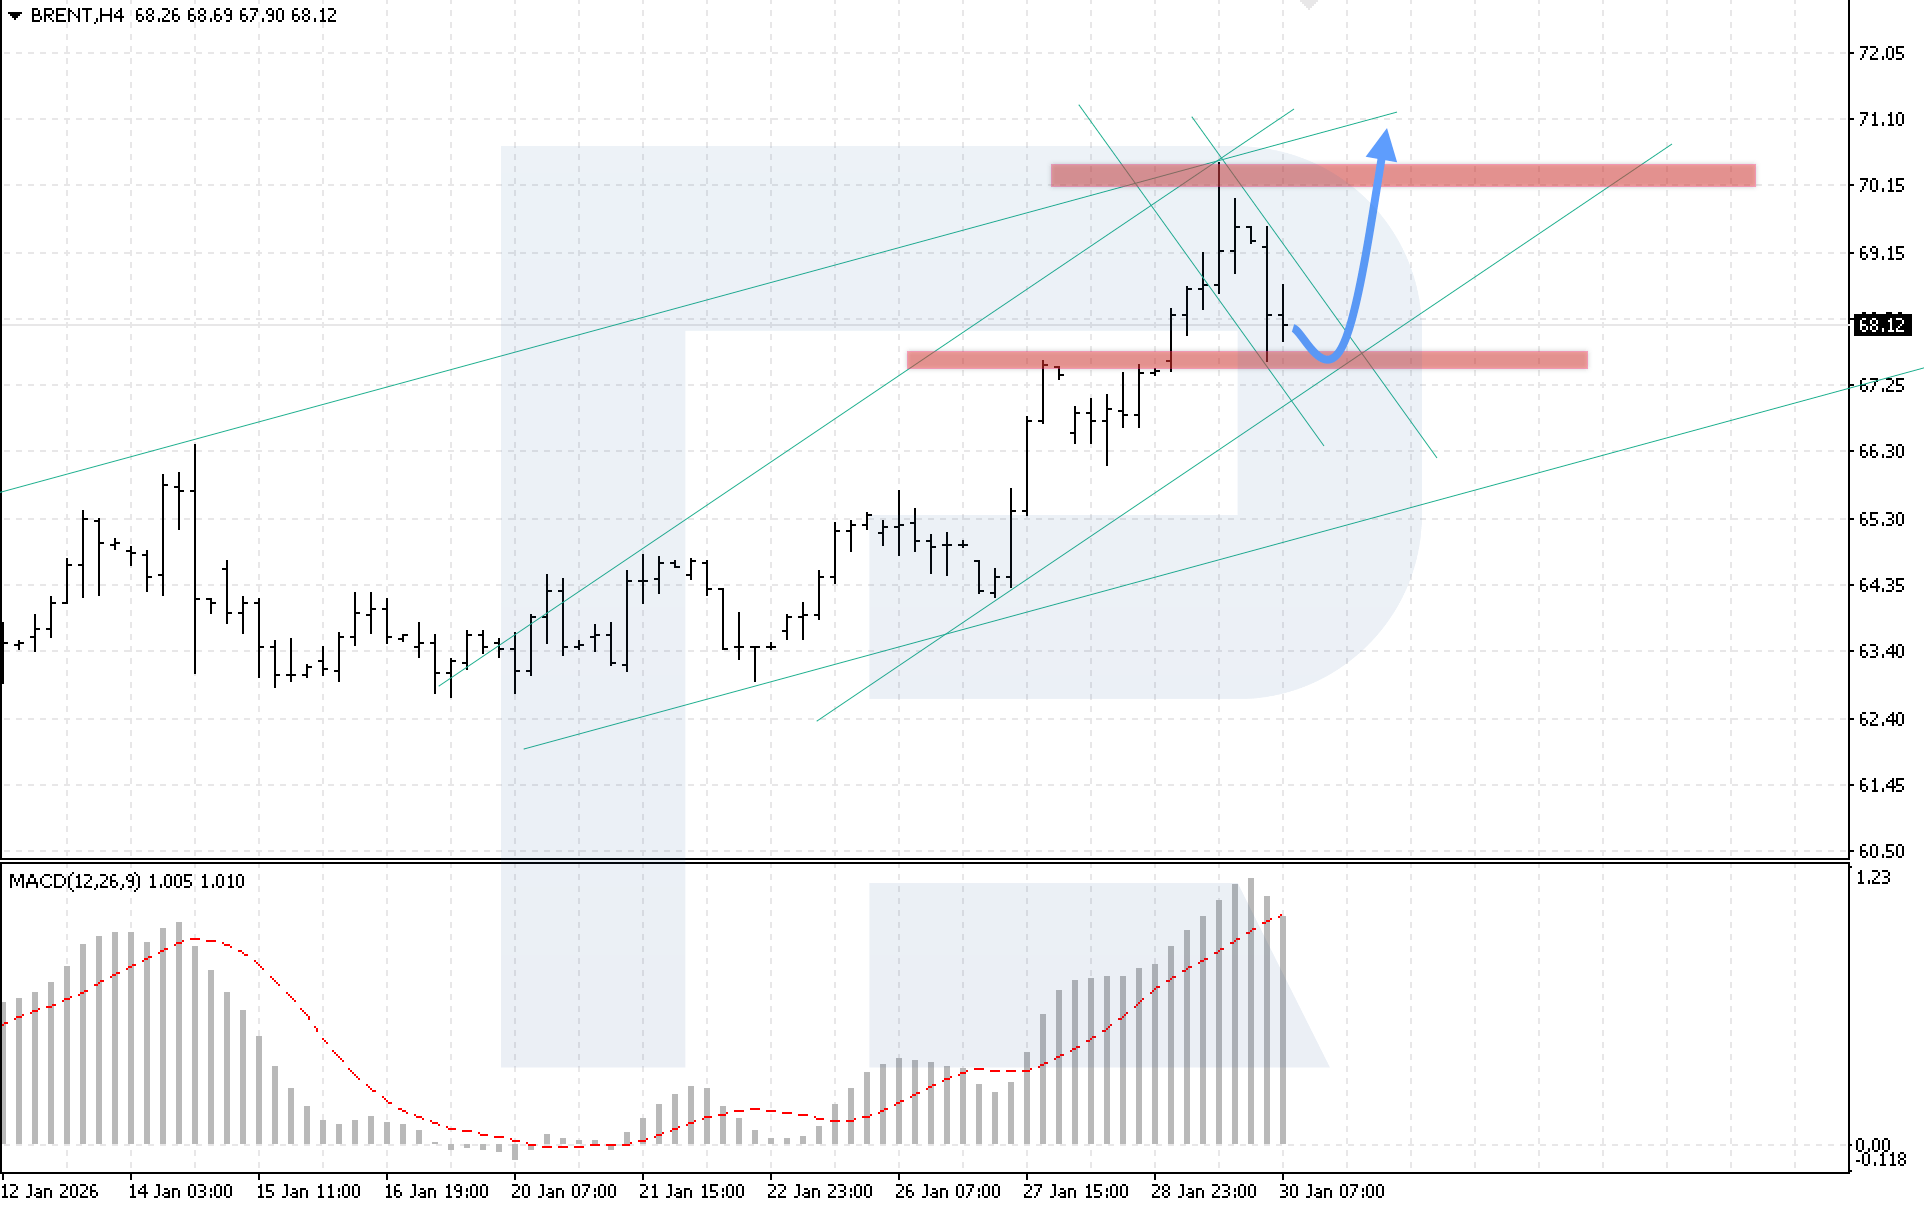
On the H4 chart of Brent crude oil, the market is correcting after rebounding from the upper boundary of the bullish channel. The nearest support level is located at 67.45, which buyers have managed to protect from a breakout. Today, 30 January 2026, the probability of a resumption of the bullish impulse with a target at the 71.10 level is considered.
The technical picture confirms the bullish scenario: prices remain within the boundaries of the bullish channel, while MACD indicator analysis shows the histogram slowing, reflecting a consolidation phase. A key condition for the growth scenario will be confident price consolidation above the 68.70 level, which would signal a breakout above the upper boundary of the corrective channel.
An alternative scenario becomes relevant if the lower boundary of the bullish channel is broken and prices consolidate below the 66.85 level, which may trigger a bearish correction in Brent prices.
Editors’ picks
 EURUSD 2026-2027 forecast: key market trends and future predictions
This article provides the EURUSD forecast for 2026 and 2027 and highlights the main factors determining the direction of the pair’s movements. We will apply technical analysis, take into account the opinions of leading experts, large banks, and financial institutions, and study AI-based forecasts. This comprehensive insight into EURUSD predictions should help investors and traders make informed decisions.
 Gold (XAUUSD) forecast 2026 and beyond: expert insights, price predictions, and analysis
Dive deep into the Gold (XAUUSD) price outlook for 2026 and beyond, combining technical analysis, expert forecasts, and key macroeconomic factors. It explains the drivers behind gold’s recent surge, explores potential scenarios including a move toward 4,500 to 5,000 USD per ounce, and highlights why the metal remains a strong hedge during global uncertainty.
Forecasts presented in this section only reflect the author’s private opinion and should not be considered as guidance for trading. RoboForex bears no responsibility for trading results based on trading recommendations described in these analytical reviews.