Daily technical analysis and forecast for 2 February 2026
Here is a detailed daily technical analysis and forecast for EURUSD, USDJPY, GBPUSD, AUDUSD, USDCAD, XAUUSD, and Brent for 2 February 2026.
EURUSD forecast
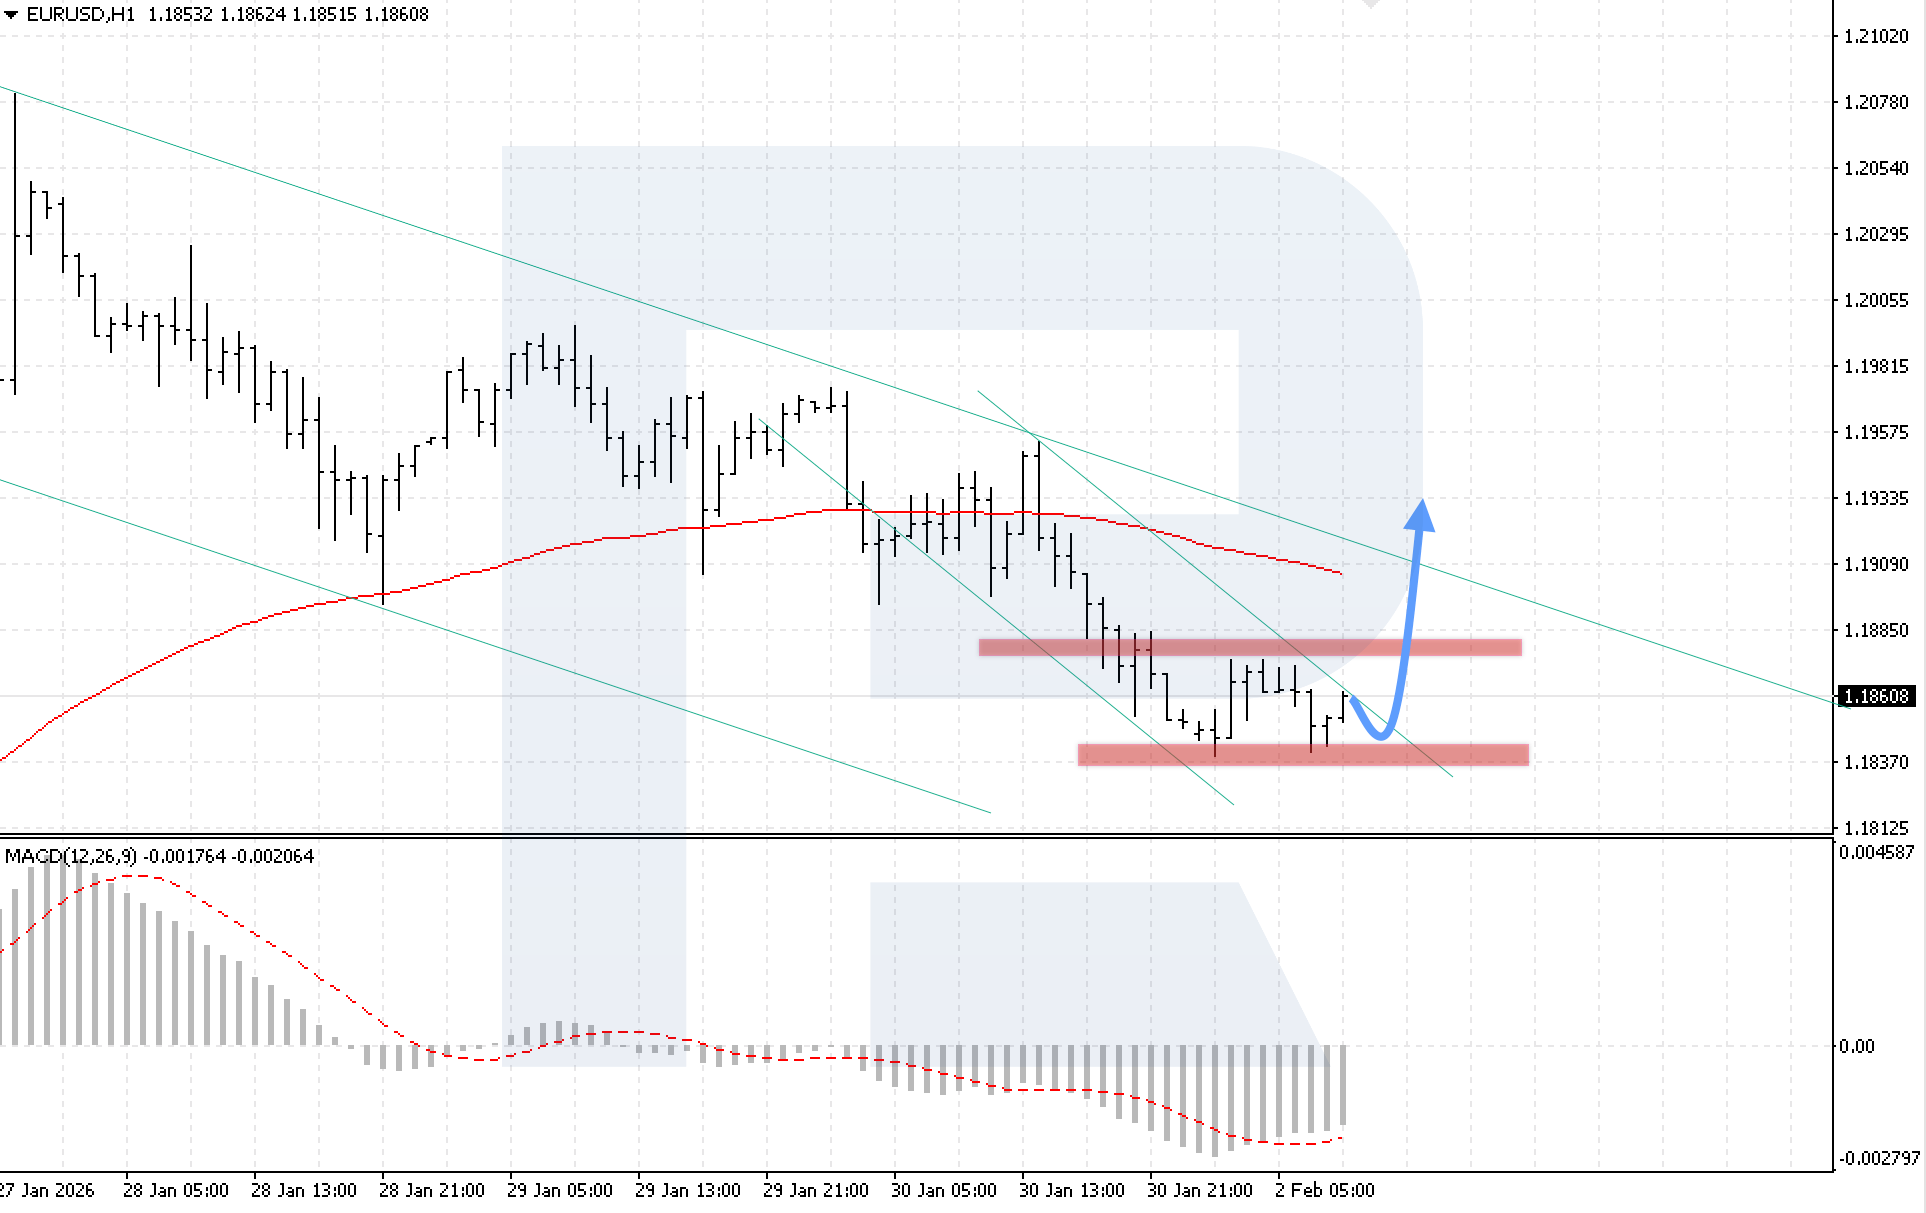
On the H1 chart of the EURUSD currency pair, the market continues to move within a downward correction phase. Buyers are holding the 1.1835 support level, preventing prices from breaking lower. There remains potential for the formation of a Double Bottom reversal pattern. Today, 2 February 2026, bullish momentum could develop, aiming for 1.1935 as a target.
The technical picture confirms this scenario: prices have rebounded twice from the support level, while MACD shows the formation of a bullish divergence, indicating that the correction is about to end. A key condition for the bullish scenario will be confident price consolidation above the 1.1890 resistance level, which would signal a breakout of the descending channel.
The alternative scenario will be activated if prices decline below the 1.1835 level, which may trigger a further downward correction.
USDJPY forecast
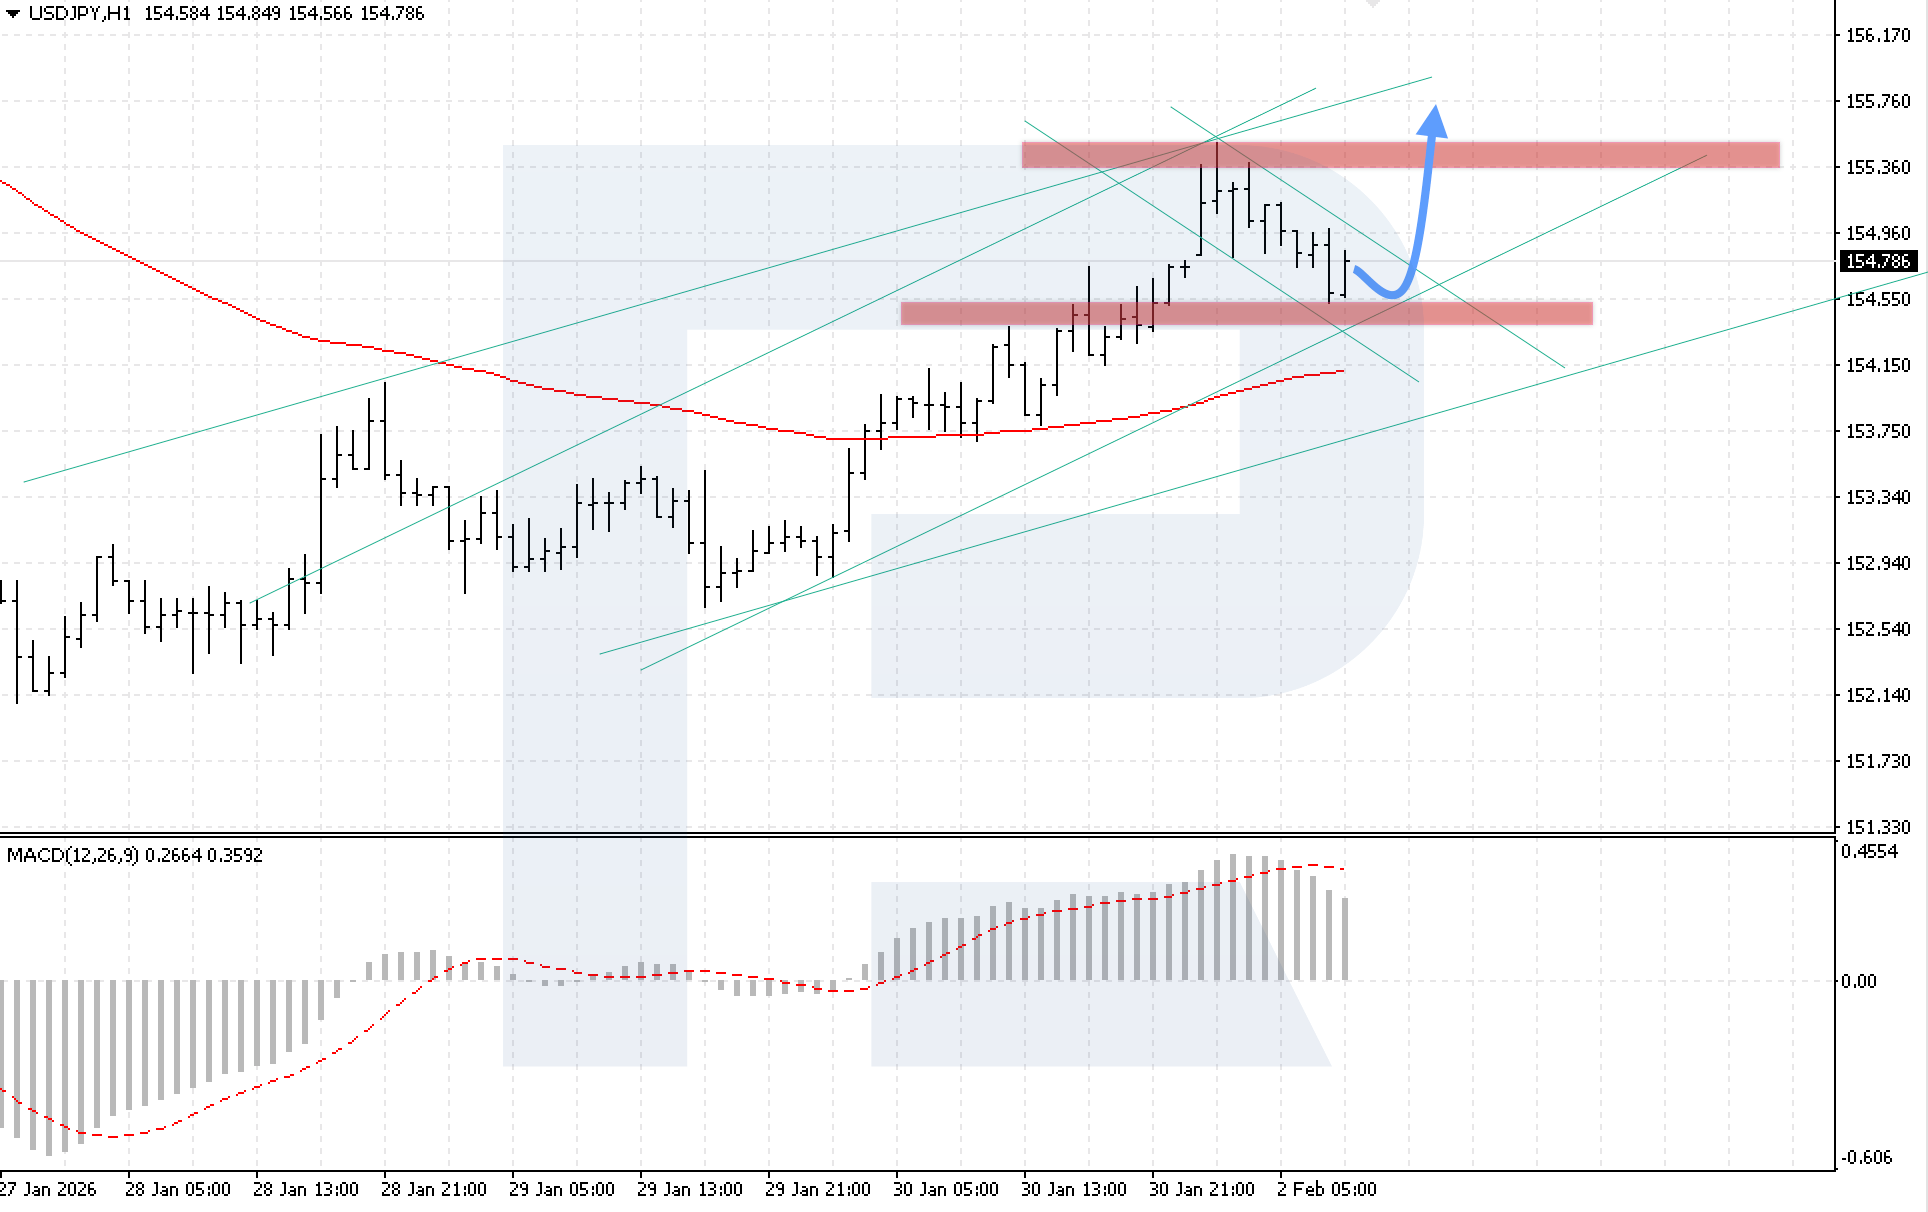
On the USDJPY H1 chart, the market is moving within a correction phase within an upward momentum. Buyers are holding the key support level at 154.50. The nearest resistance is located at 154.95. Today, 2 February 2026, the bullish momentum could continue, targeting the 155.75 level.
The technical picture confirms this scenario: MACD indicator analysis shows a slowdown in histogram growth, indicating increasing selling pressure and reflecting a consolidation phase. At the same time, prices remain above the EMA-85 line, which supports the bullish bias. A key condition for the bullish scenario will be confident price consolidation above the 155.05 level, which would signal a breakout above the upper boundary of the corrective channel.
The alternative scenario will be activated if prices break below the lower boundary of the bullish channel and consolidate below the 154.35 level, which may trigger a deeper correction in USDJPY.
GBPUSD forecast
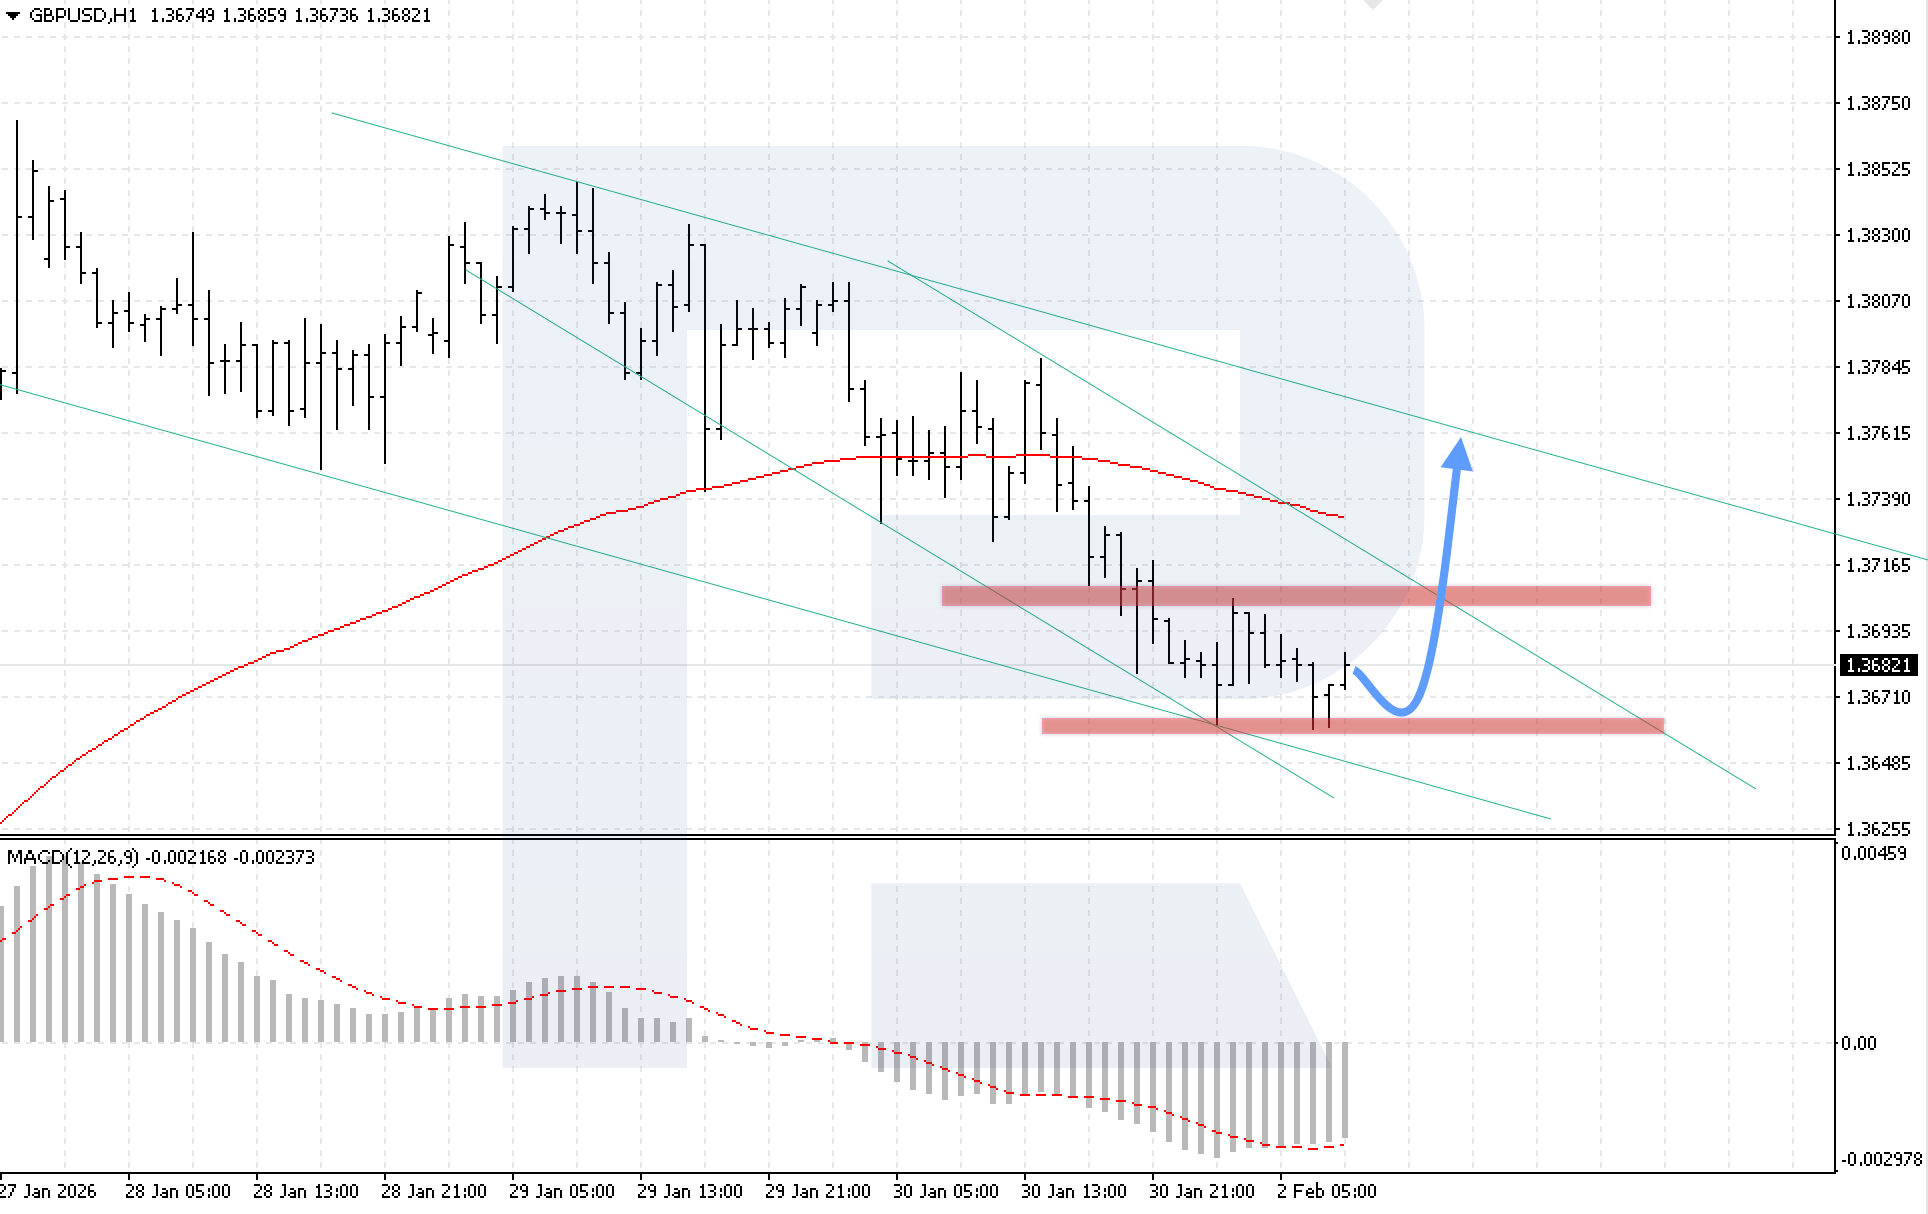
On the GBPUSD H1 chart, the market has tested the 1.3655 support level twice, indicating the formation of a Double Bottom reversal pattern. The nearest resistance level is located at 1.3705. Today, 2 February 2026, the bearish correction could be complete, followed by renewed bullish momentum, with a target at 1.3765.
The technical picture confirms this scenario: MACD indicator analysis shows the formation of a bullish divergence, indicating a likely end to the consolidation phase. A key condition for the bullish scenario will be confident price consolidation above the 1.3710 level, which would signal a breakout above the upper boundary of the Double Bottom reversal pattern.
The alternative scenario will be activated if the 1.3655 level is broken, which would invalidate the reversal pattern and signal a continued decline in GBPUSD prices.
AUDUSD forecast
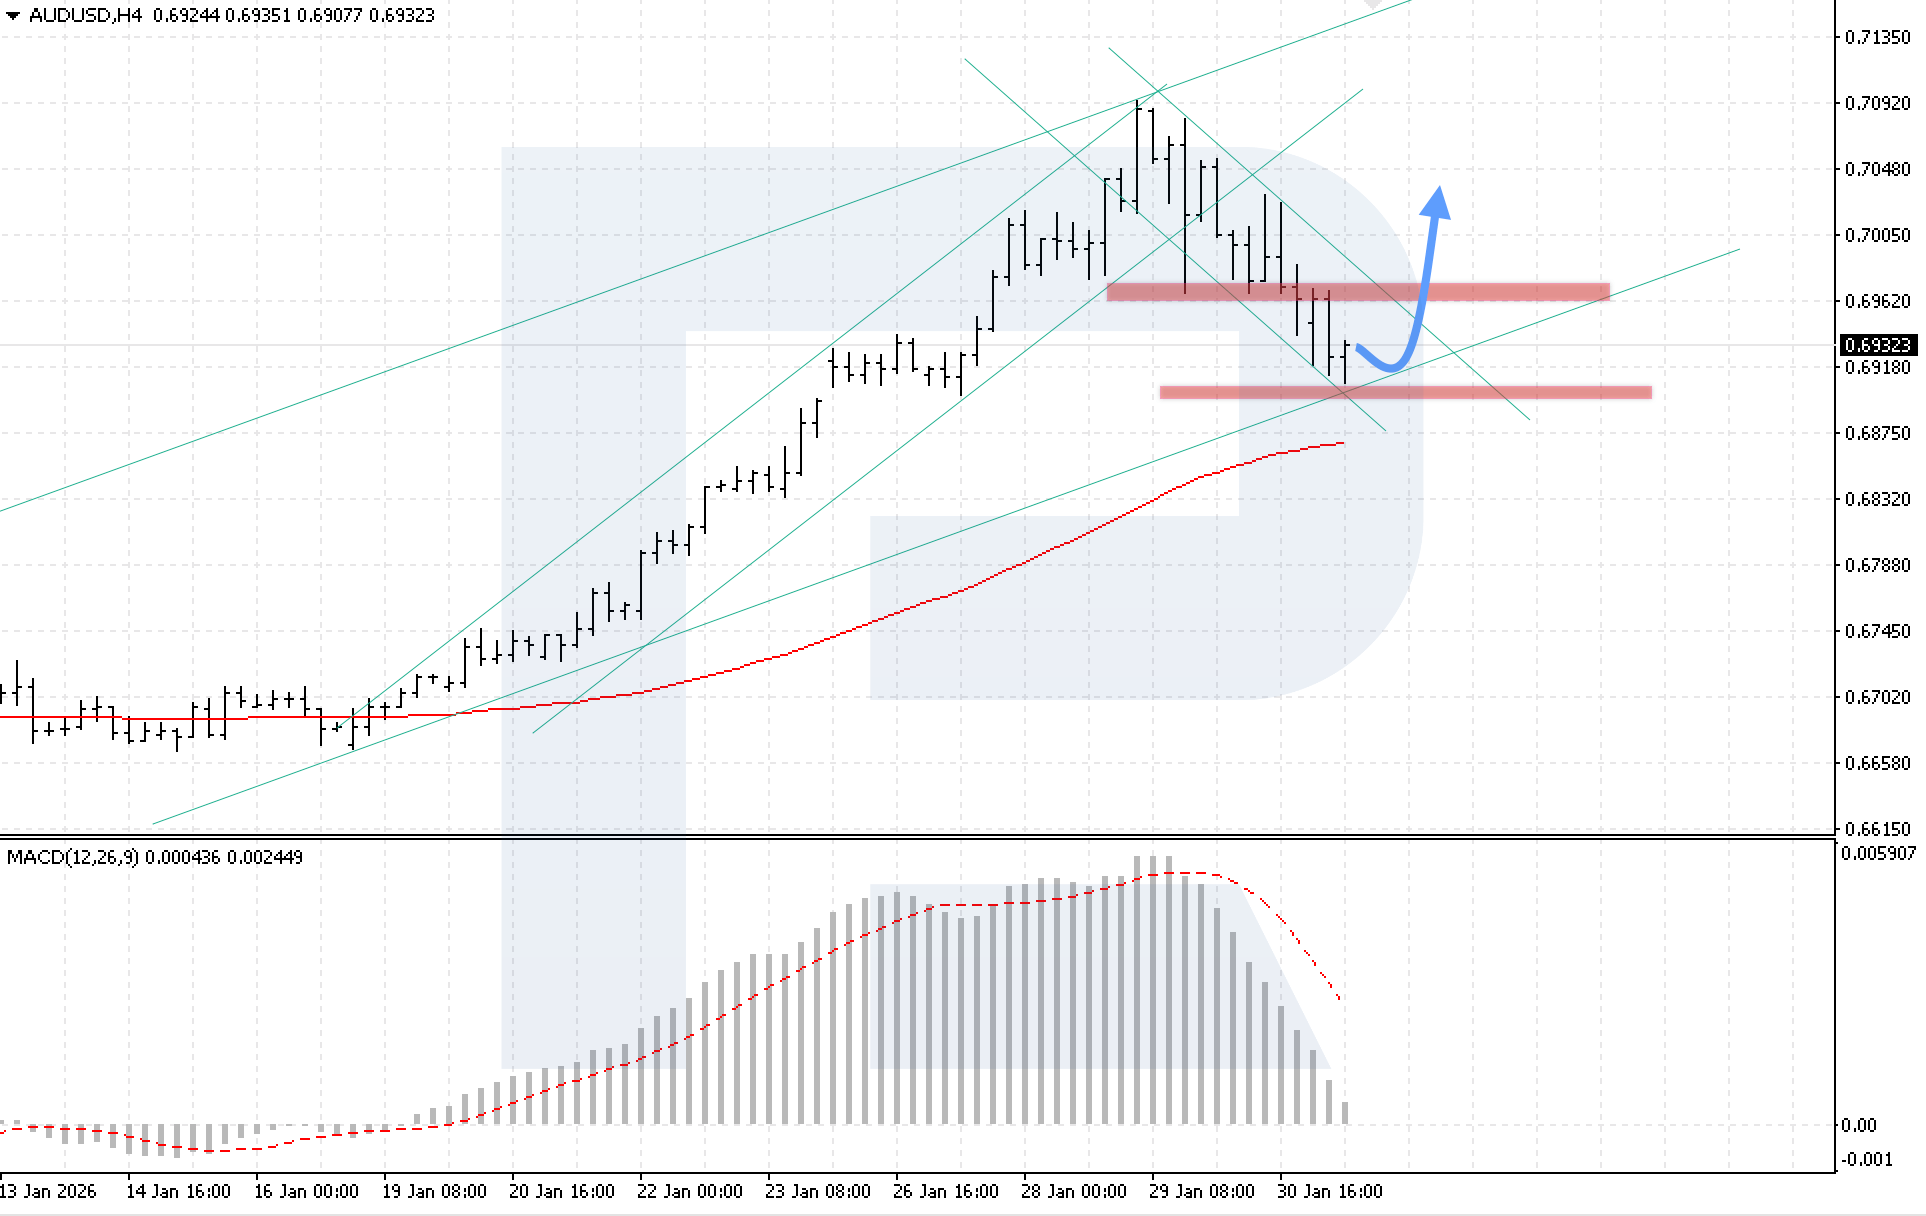
On the AUDUSD H4 chart, the market continues to move within a correction phase. Buyers are holding the 0.6920 support level. The nearest resistance is located at 0.6960. Today, 2 February 2026, the correction could end, and bullish momentum could resume, with a target at the 0.7045 level.
The technical picture confirms this scenario: prices remain above the EMA-85 line, while MACD indicator analysis shows a declining histogram, reflecting the continuation of the consolidation phase. A key condition for the bullish scenario will be price consolidation above the 0.6965 level, which would signal a breakout of the corrective channel.
The alternative scenario will be activated if the lower boundary of the long-term channel is broken with consolidation below the 0.6875 level, which may trigger further decline in the AUDUSD towards lower levels.
USDCAD forecast
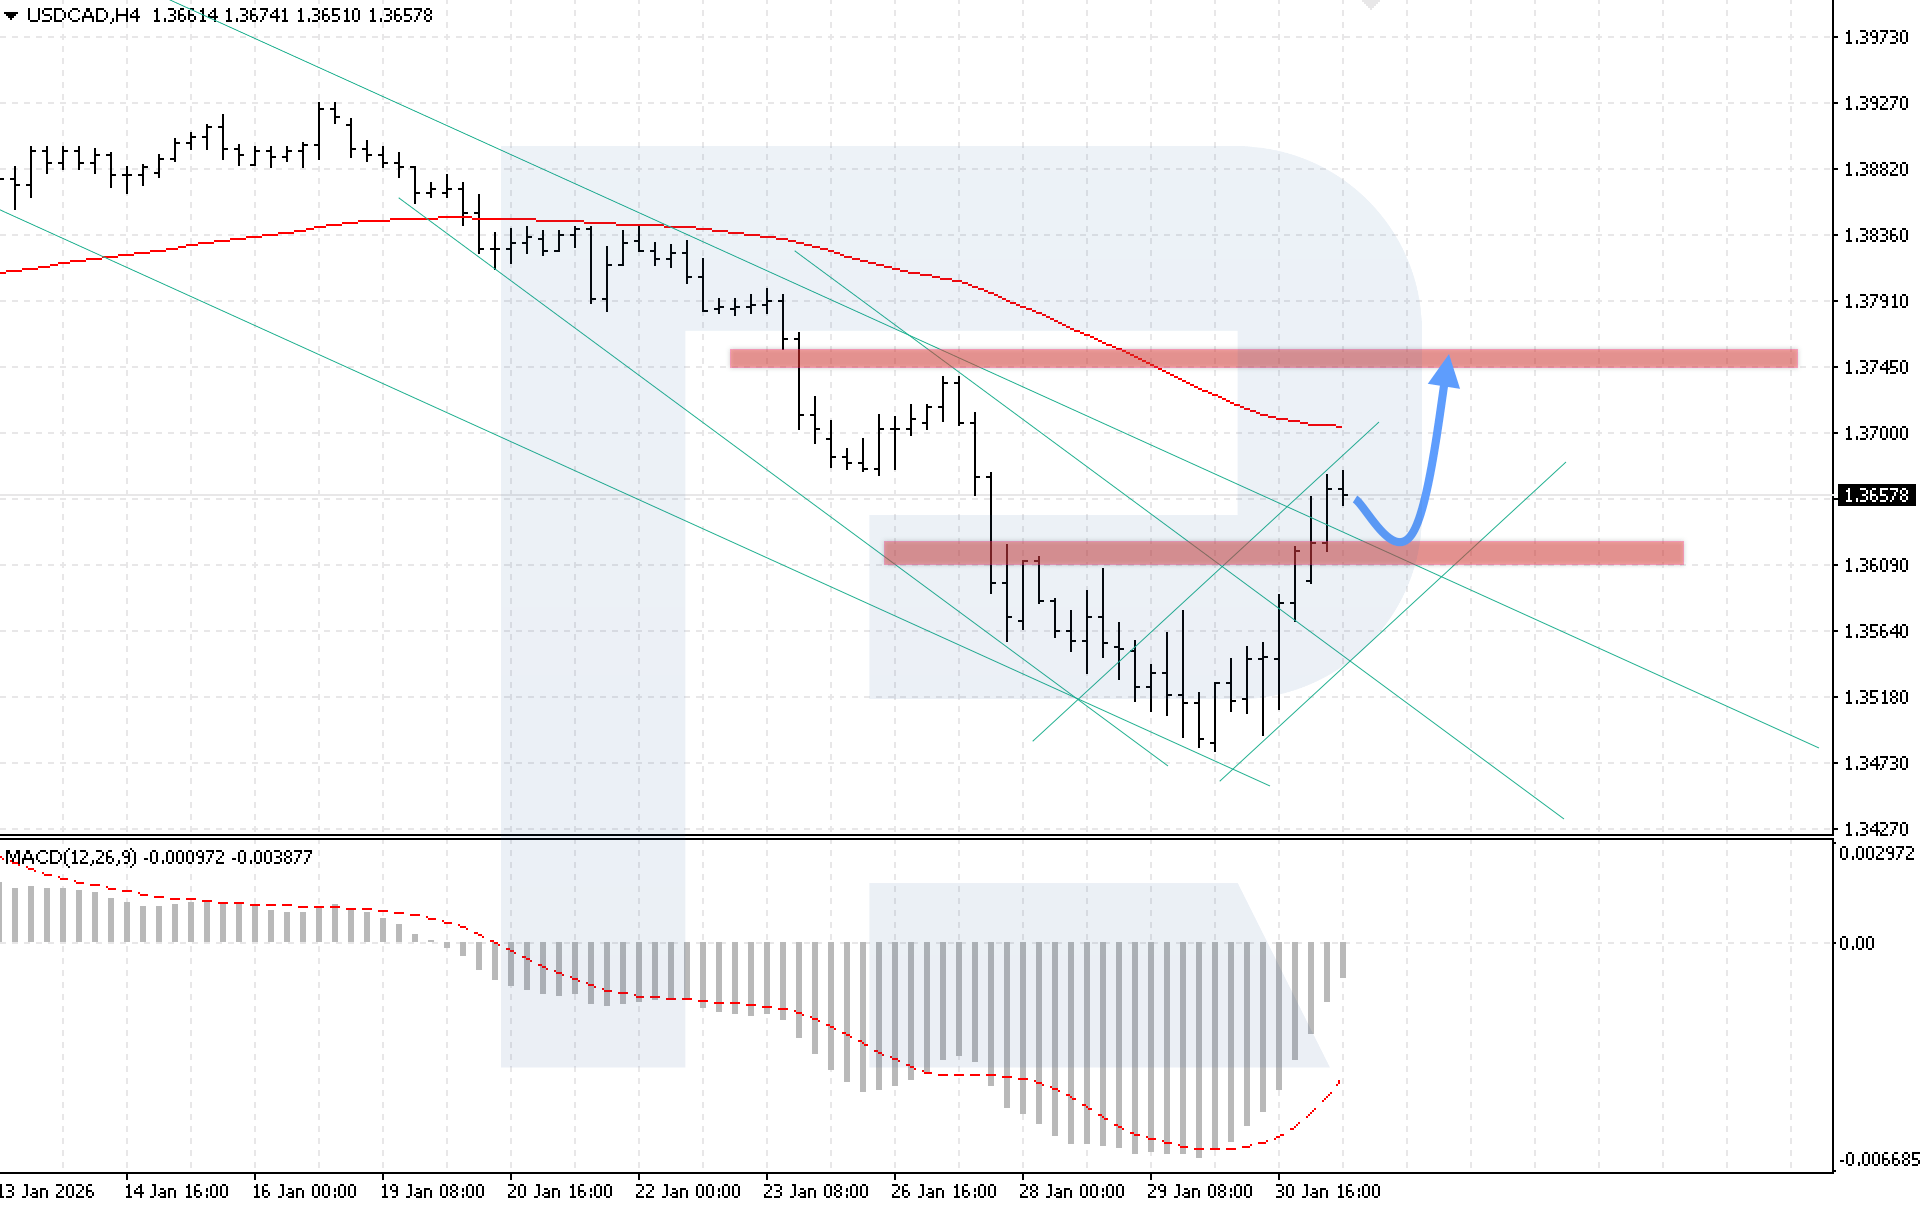
On the USDCAD H4 chart, the market has consolidated above the upper boundary of the descending channel. The nearest support level is located at 1.3610. Today, 2 February 2026, a corrective move back towards the channel boundary is possible, after which bullish momentum could resume, targeting the 1.3745 level.
The technical picture confirms this scenario: MACD indicator analysis shows strong growth of the histogram, indicating the formation of a full-scale bullish momentum. A key condition for the upside scenario will be confident price consolidation above the 1.3705 level.
The alternative scenario will be activated if prices break back below the channel boundary and consolidate under the 1.3600 level, which would signal a return to the channel and continued downward movement.
XAUUSD forecast
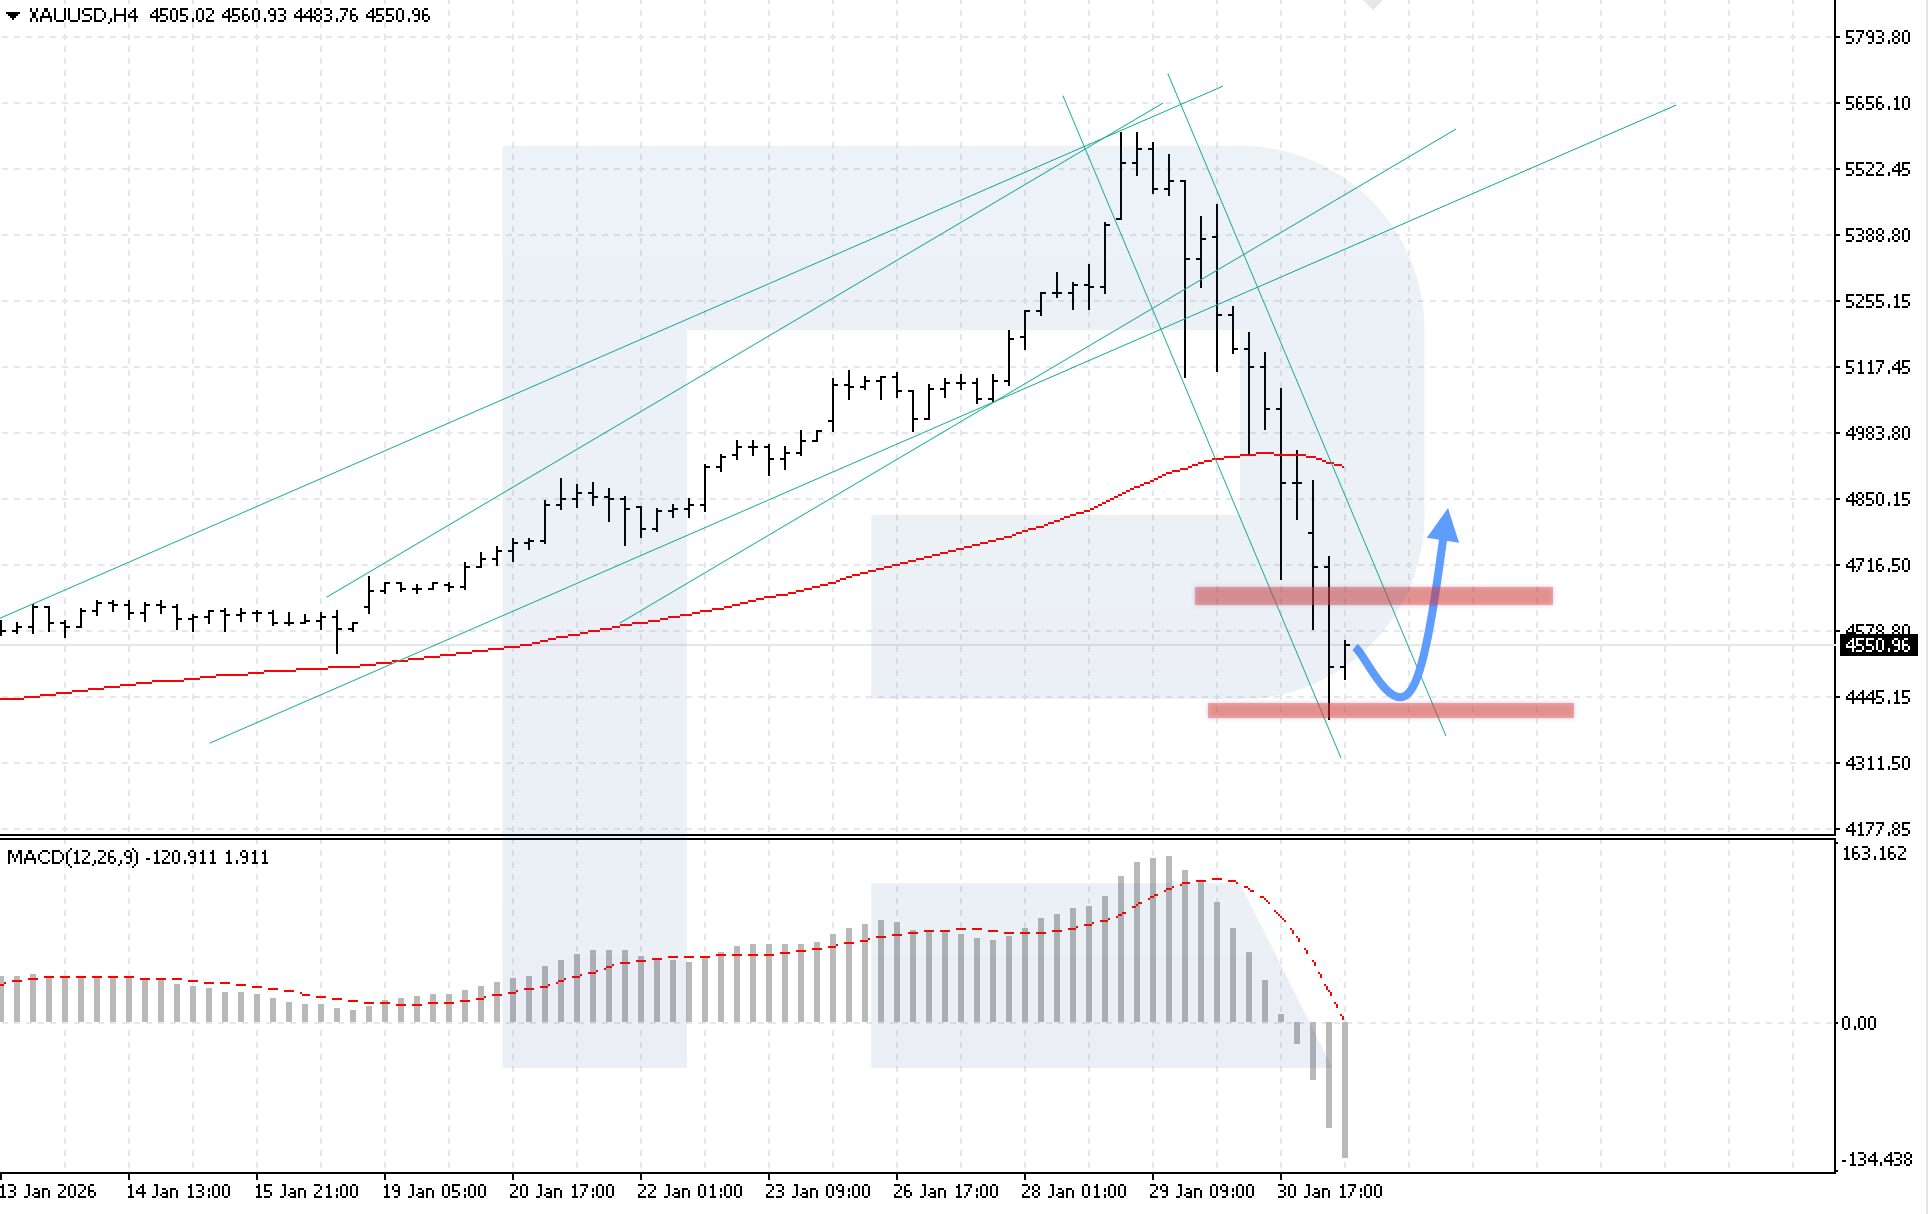
On the XAUUSD H4 chart, the market continues an active decline. Buyers have defended the 4,550 support level, preventing prices from breaking lower. The nearest resistance level is located at 4,685. Today, 2 February 2026, the correction could be complete, and a bullish move could start, with a target at the 4,850 level.
The technical picture confirms this scenario: there remains potential for the formation of a Double Bottom reversal pattern. MACD indicator analysis still shows a declining histogram; however, the slowdown in the decline suggests a possible end to the correction phase. A key condition for the upside scenario will be confident price consolidation above the 4,665 level.
The alternative scenario will be activated if the lower boundary of the pattern is broken with consolidation below the 4,440 level, which may trigger a deeper decline in XAUUSD prices.
Brent forecast
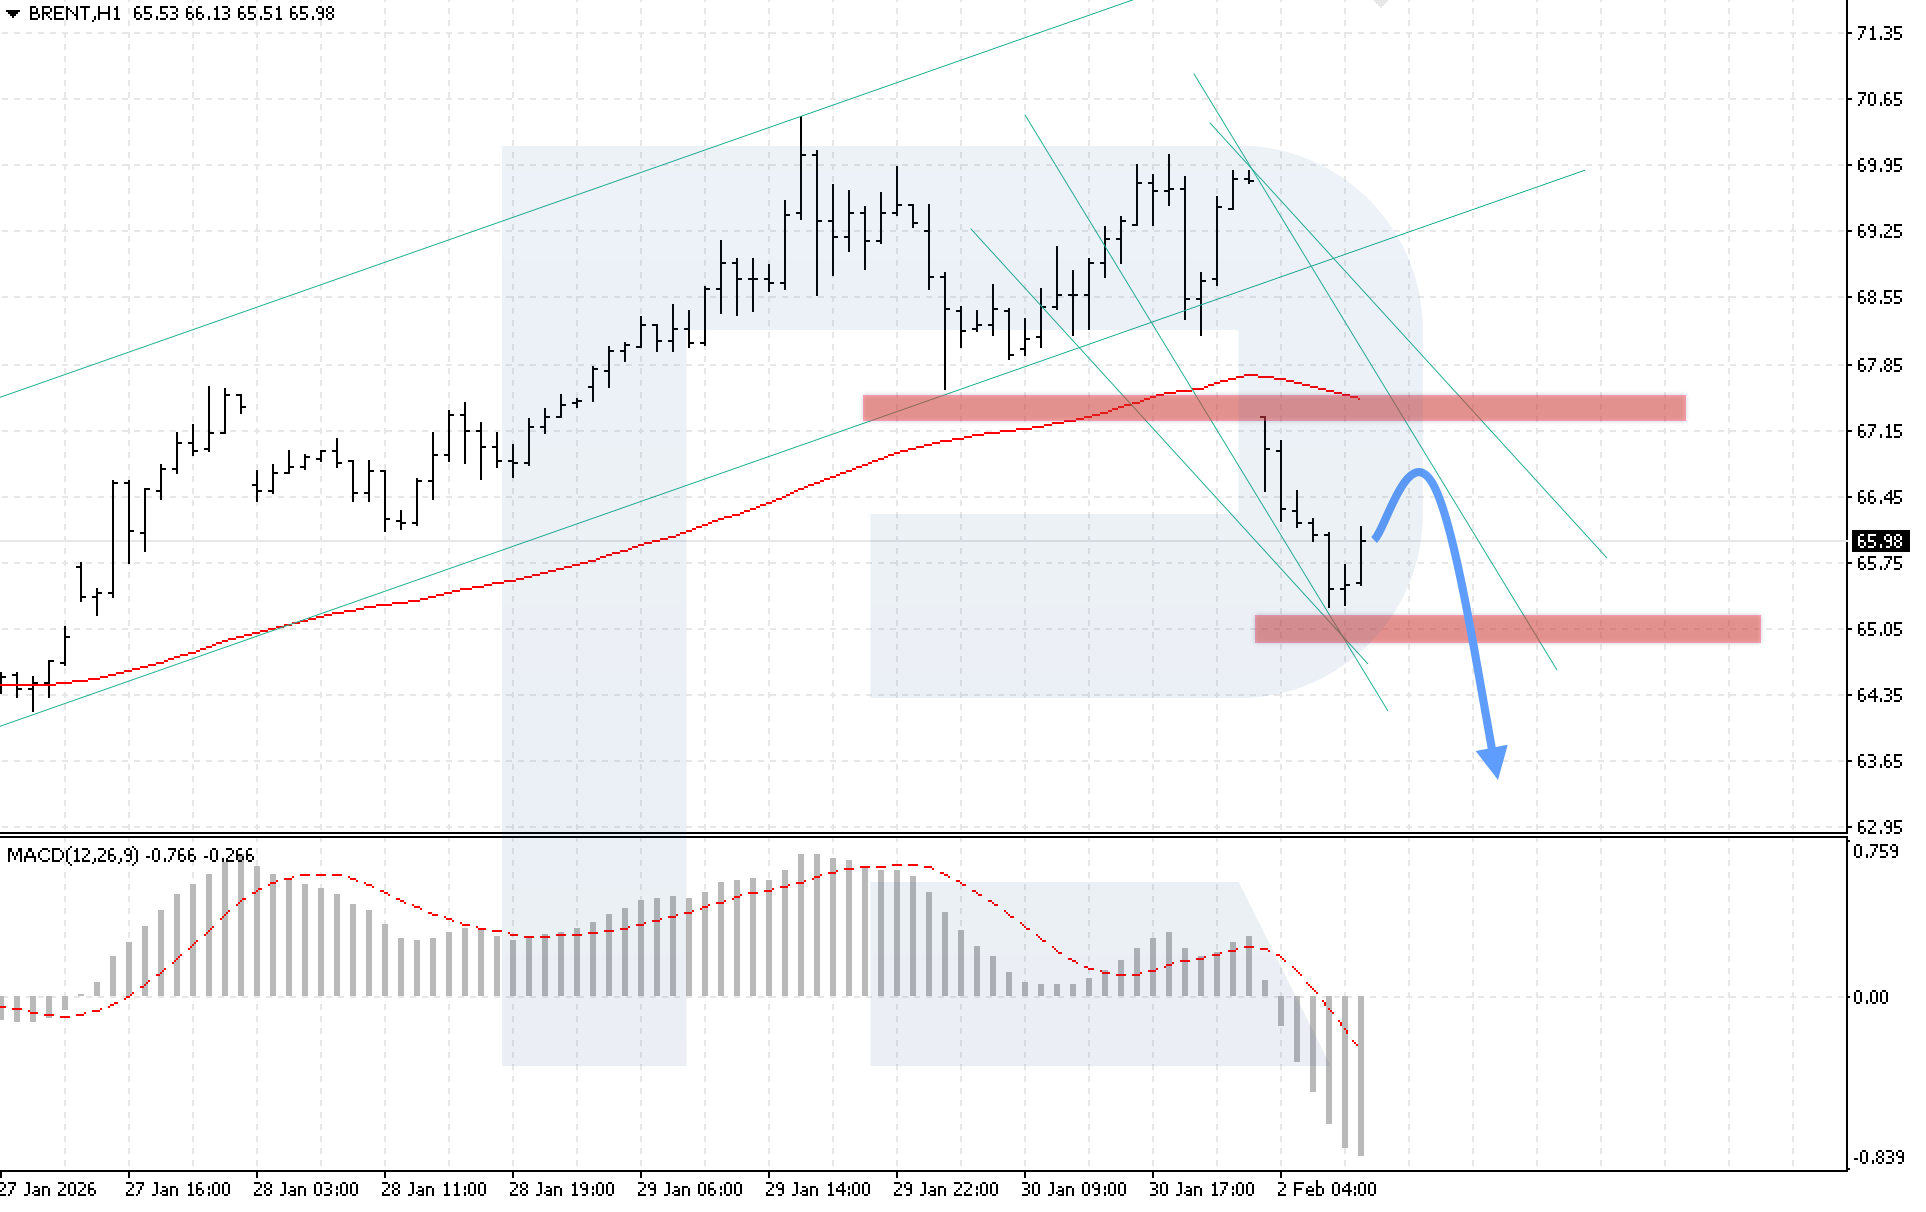
On the Brent H1 chart, the market is showing a sharp decline after breaking below the EMA-85, with selling pressure intensifying. The nearest support level is located at 65.05. Today, 2 February 2026, a corrective rebound towards the upper boundary of the channel at the 66.65 level is possible, after which the decline is expected to resume, aiming for 63.65.
The technical picture confirms the bearish scenario: MACD indicator analysis shows an active decline in the histogram, reflecting a strong downward momentum. A key condition for the bearish scenario will be confident price consolidation below the 65.05 level.
The alternative scenario will be activated if the upper boundary of the bearish channel is broken with consolidation above the 67.15 level, which may trigger a resumption of the bullish momentum in Brent prices.
Editors’ picks
 EURUSD 2026-2027 forecast: key market trends and future predictions
This article provides the EURUSD forecast for 2026 and 2027 and highlights the main factors determining the direction of the pair’s movements. We will apply technical analysis, take into account the opinions of leading experts, large banks, and financial institutions, and study AI-based forecasts. This comprehensive insight into EURUSD predictions should help investors and traders make informed decisions.
 Gold (XAUUSD) forecast 2026 and beyond: expert insights, price predictions, and analysis
Dive deep into the Gold (XAUUSD) price outlook for 2026 and beyond, combining technical analysis, expert forecasts, and key macroeconomic factors. It explains the drivers behind gold’s recent surge, explores potential scenarios including a move toward 4,500 to 5,000 USD per ounce, and highlights why the metal remains a strong hedge during global uncertainty.
Forecasts presented in this section only reflect the author’s private opinion and should not be considered as guidance for trading. RoboForex bears no responsibility for trading results based on trading recommendations described in these analytical reviews.