Daily technical analysis and forecast for 4 February 2026
Here is a detailed daily technical analysis and forecast for EURUSD, USDJPY, GBPUSD, AUDUSD, USDCAD, XAUUSD, and Brent for 4 February 2026.
EURUSD forecast
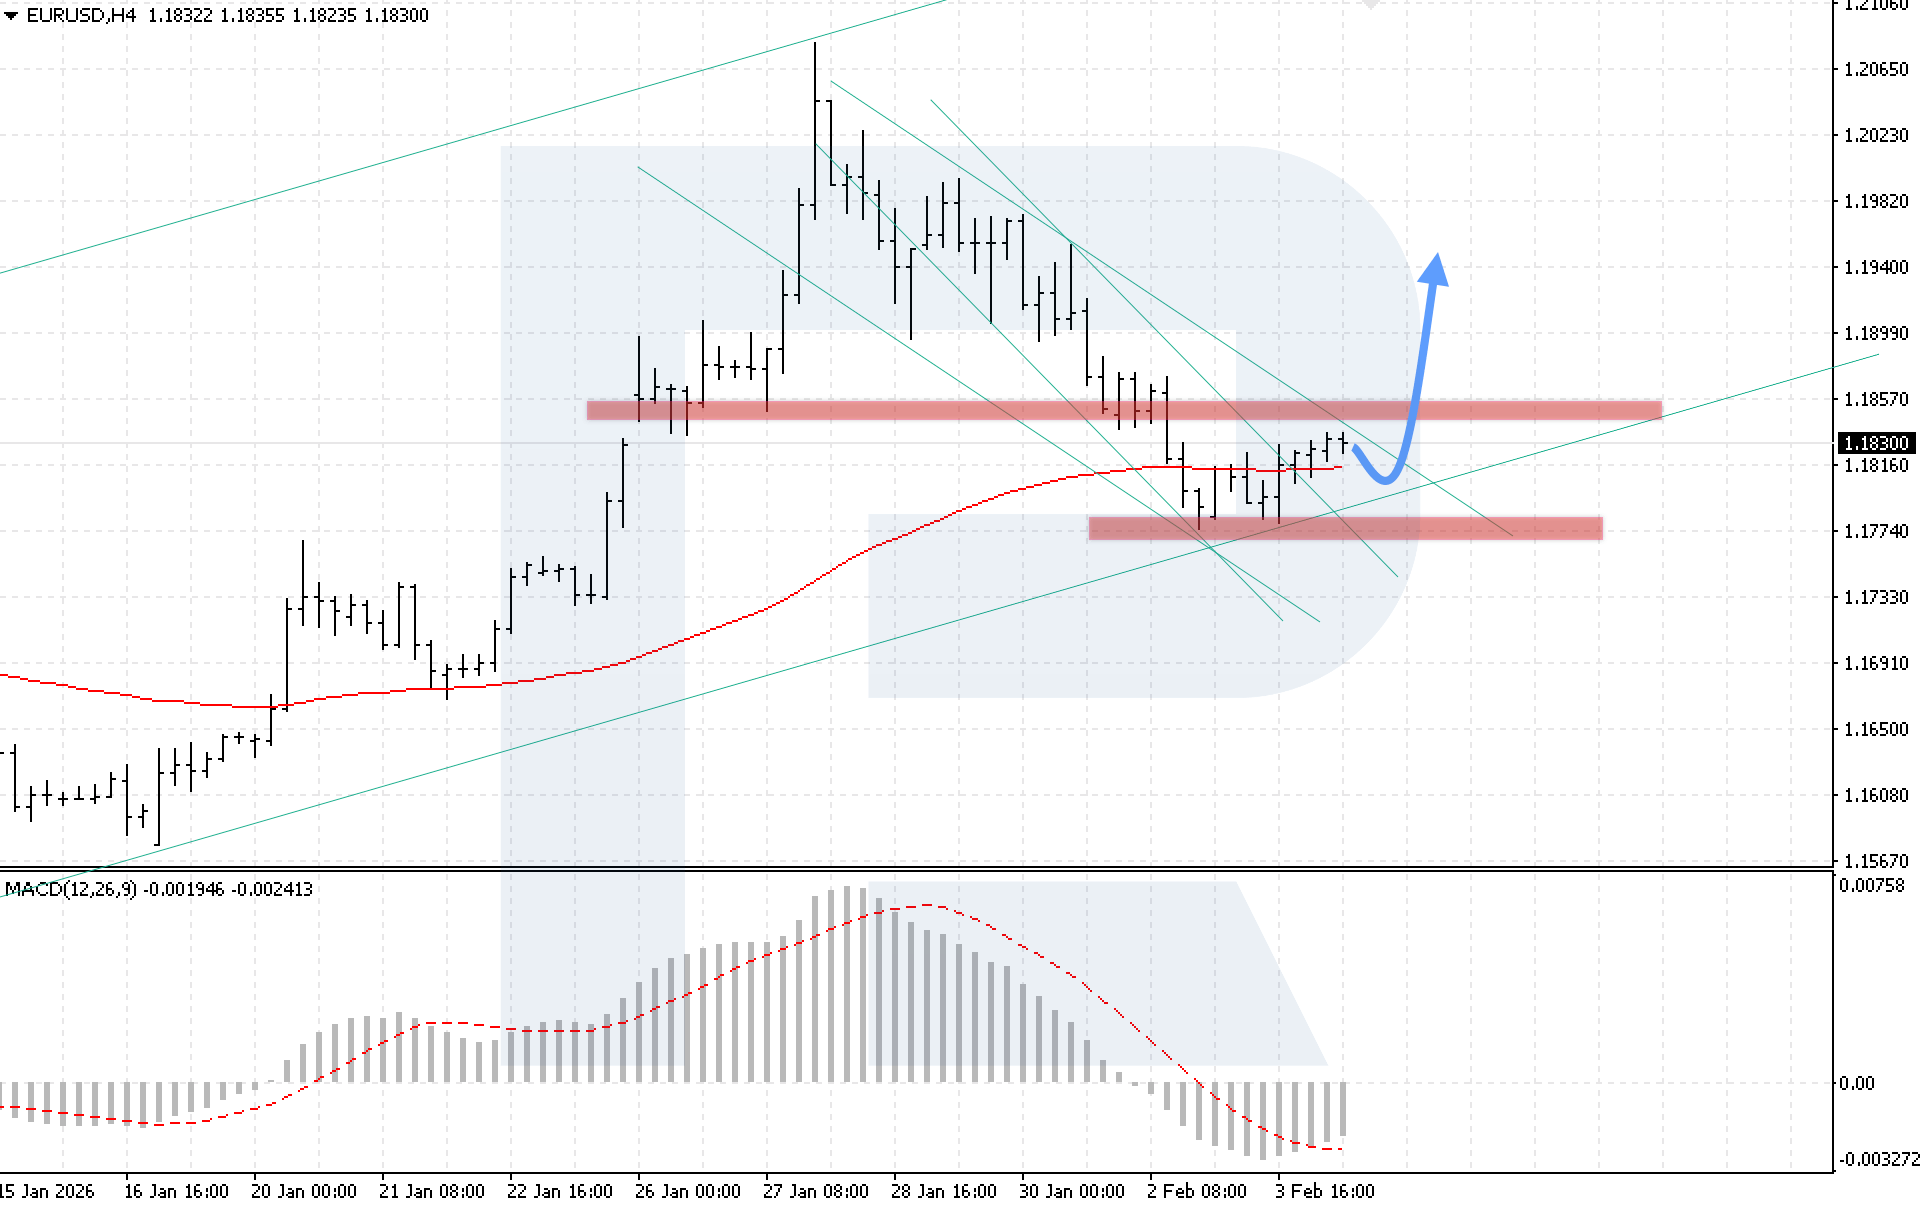
On the EURUSD H4 chart, the market continues to move within a correction phase. Buyers have managed to consolidate above the EMA-85, indicating weakening selling pressure and increasing the likelihood of renewed growth. Today, 4 February 2026, the correction could be complete and bullish momentum could form, with a target at the 1.1945 level.
The technical picture confirms this scenario: the MACD indicator shows growth of the histogram, while the signal line forms a bullish crossover. A key condition for the upside scenario will be confident price consolidation above the 1.1860 level, which would signal an upside breakout of the descending channel.
The alternative scenario will be activated if prices decline below the 1.1775 level, which may lead to renewed pressure from bears.
USDJPY forecast
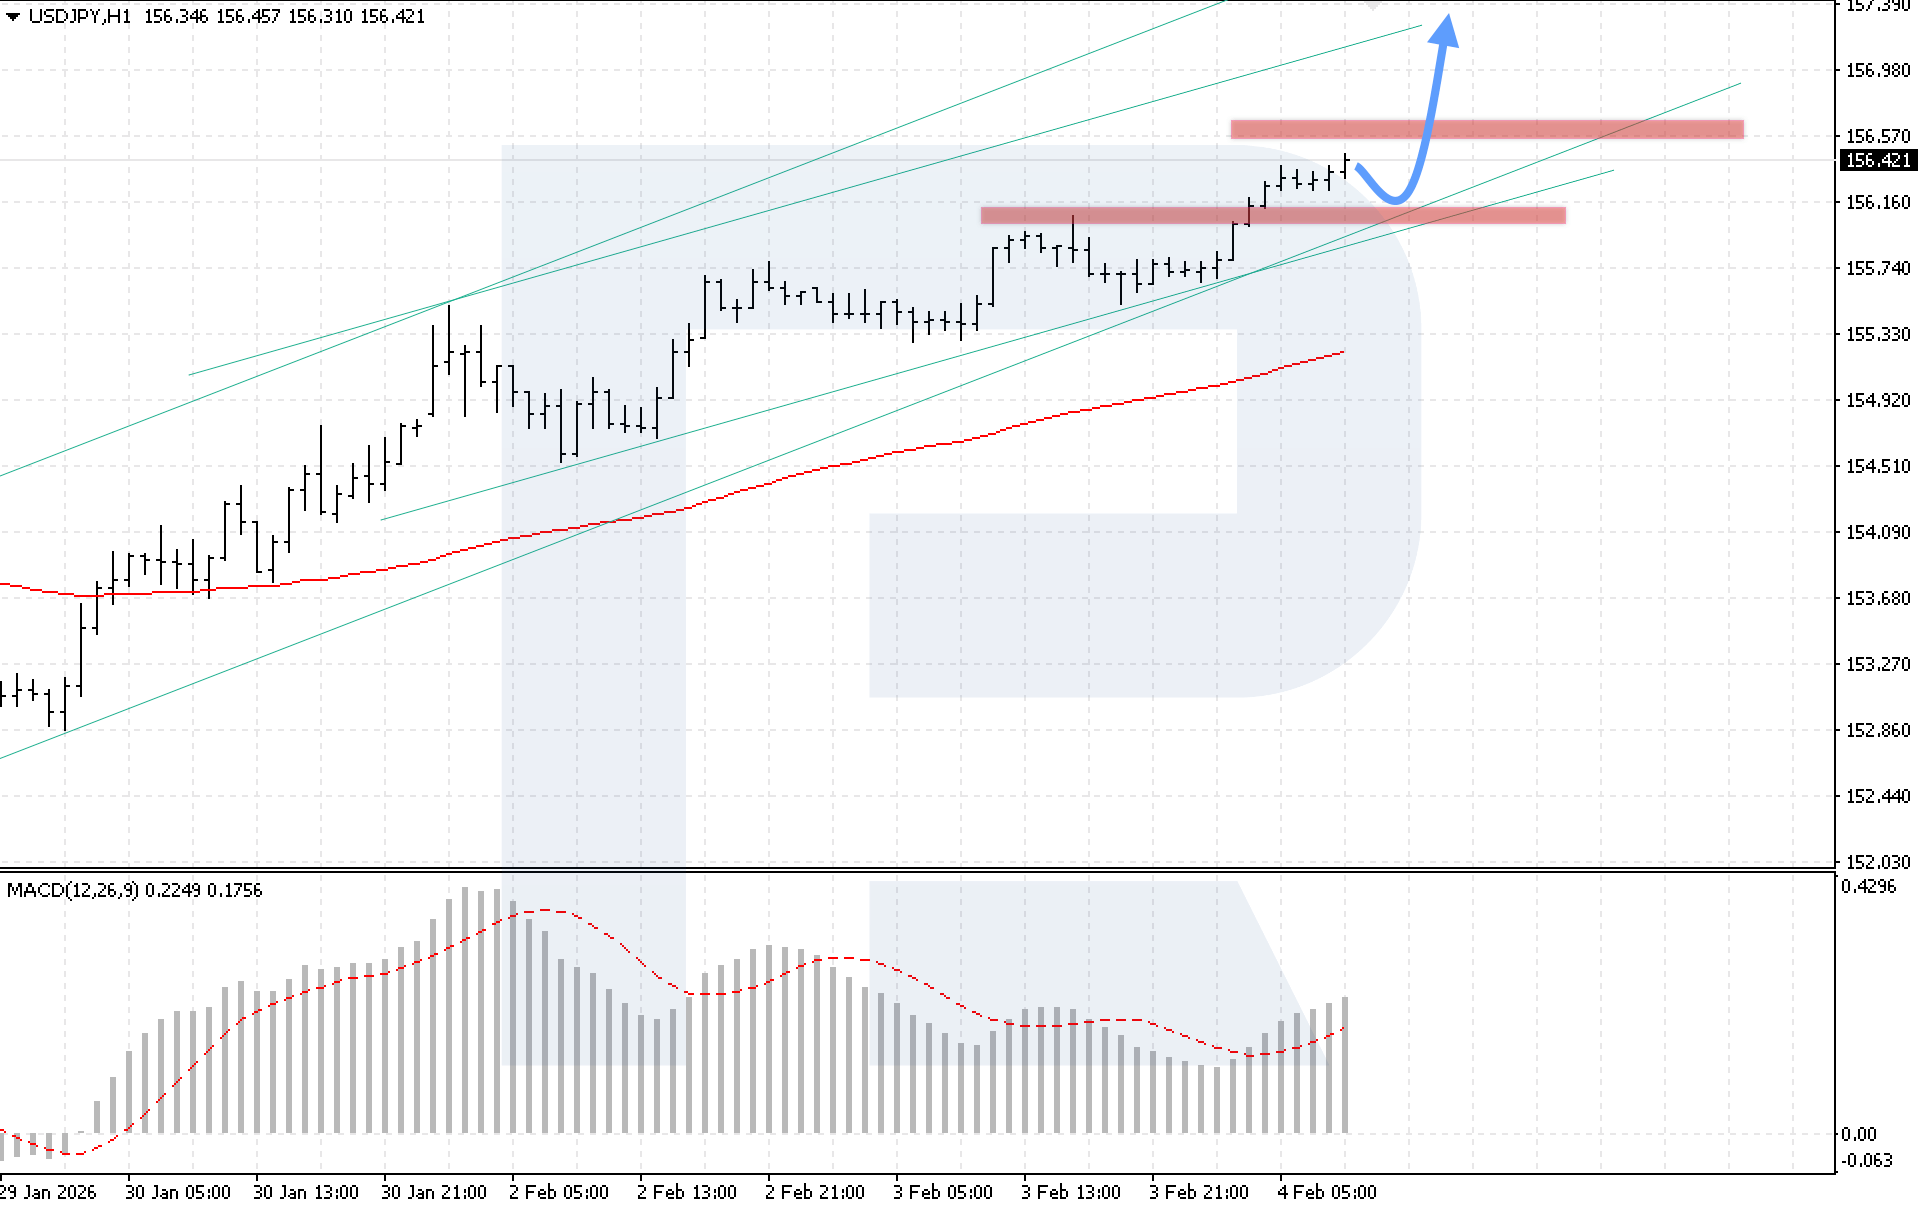
On the USDJPY H4 chart, the market continues to rise actively within a bullish channel. Buyers have consolidated above the key resistance level and are poised to break above the next mark at 156.55. Today, 4 February 2026, the pair could maintain its upward trajectory, aiming for 157.25.
The technical picture confirms this scenario: the MACD indicator shows strong growth of the histogram, indicating strengthening buying pressure. A key condition for the bullish scenario will be a confident rebound from the 156.20 support level, which would signal a potential reversal and resumption of the upward move.
The alternative scenario will be activated if the lower boundary of the bullish channel is broken with consolidation below the 155.75 level, which may lead to renewed decline in USDJPY prices.
GBPUSD forecast
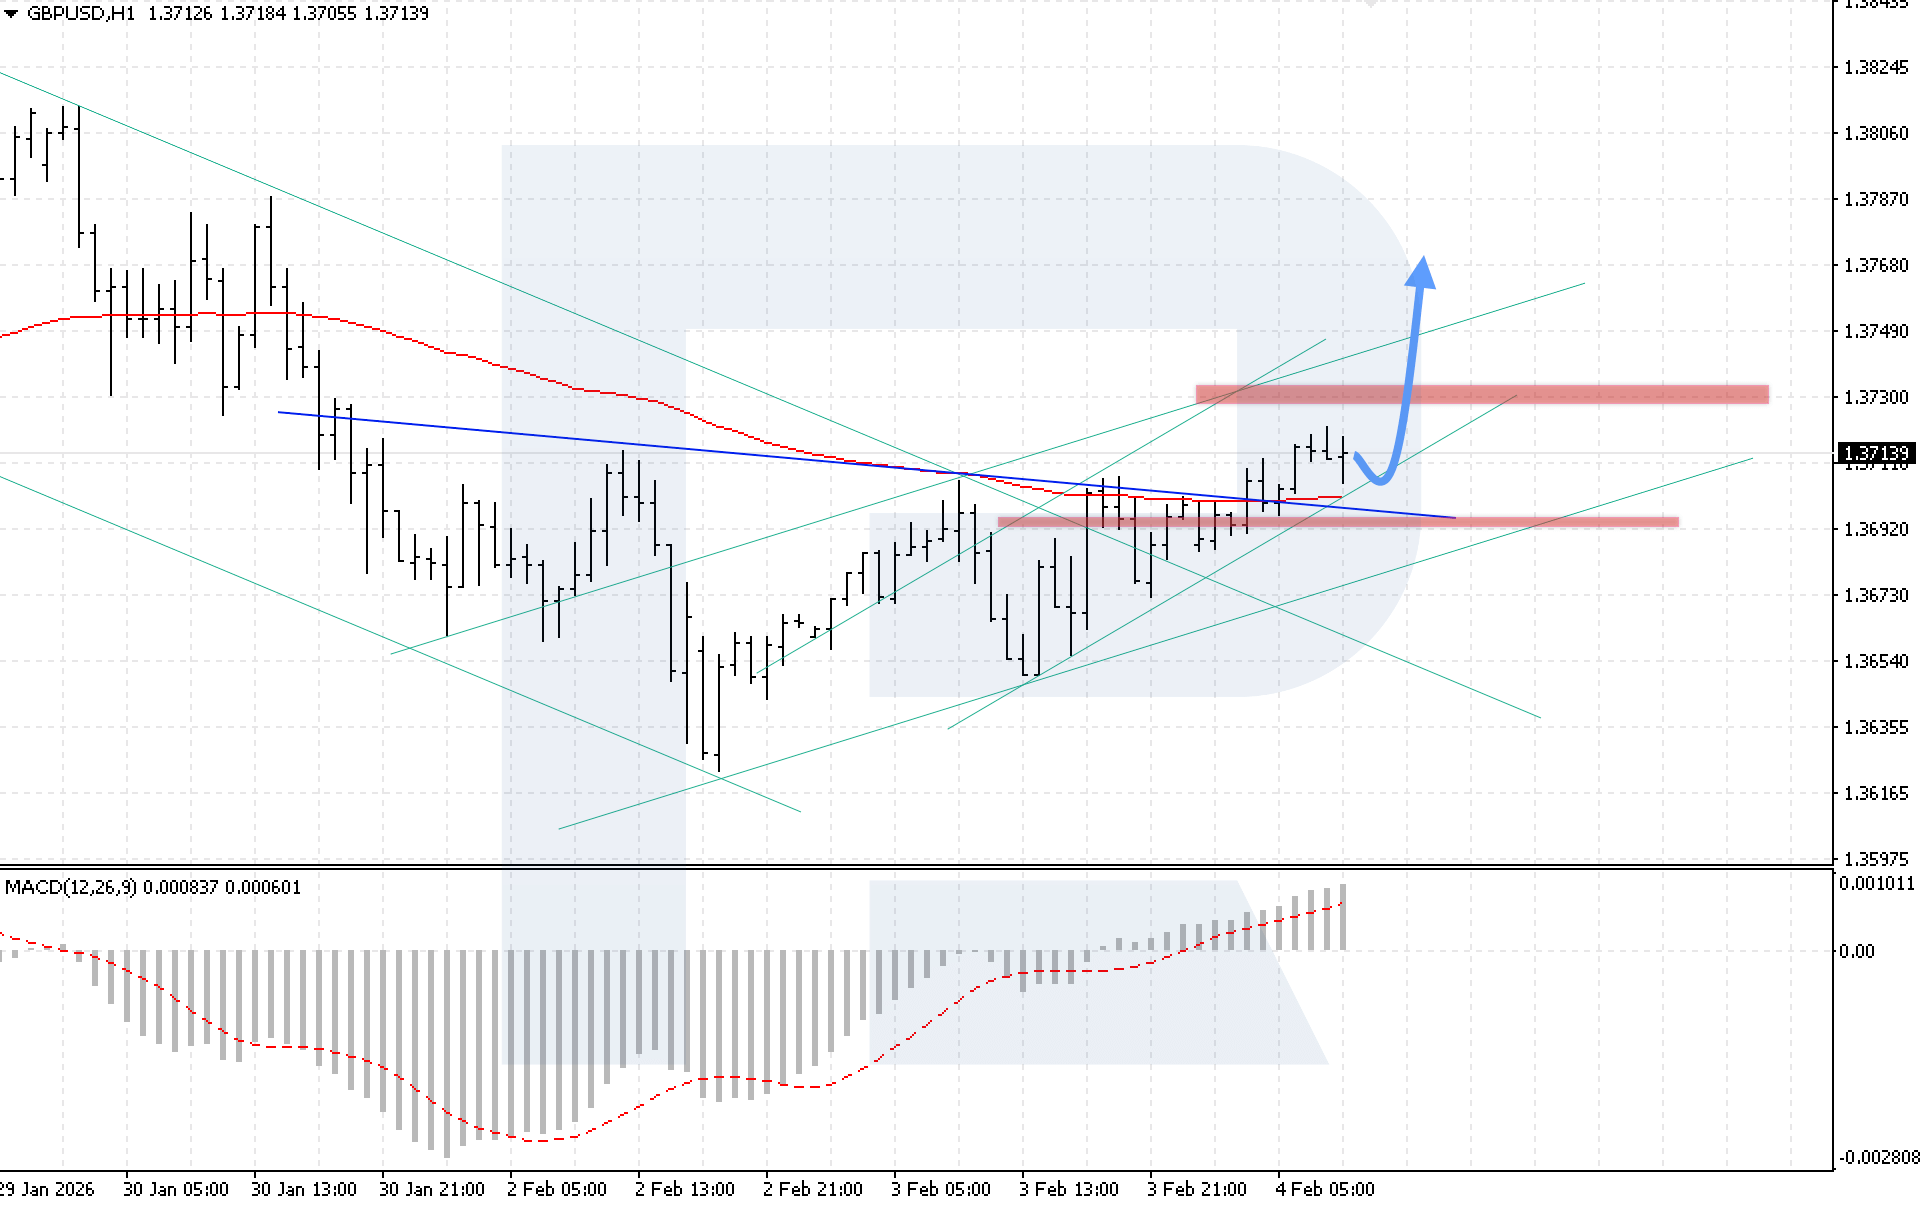
On the GBPUSD H4 chart, prices are rising confidently after breaking above the upper boundary of the Head and Shoulders reversal pattern. The nearest support level is located at 1.3695. Today, 4 February 2026, growth could continue towards the target of 1.3765.
The technical picture confirms this scenario: the MACD indicator shows growth of the histogram, signalling the formation of a full-fledged bullish momentum. A key condition for the bullish scenario will be price consolidation above 1.3730, which would indicate a breakout above the key resistance level.
The alternative scenario will be activated if the 1.3685 support level is broken, which may trigger a decline in GBPUSD with targets below 1.3605.
AUDUSD forecast
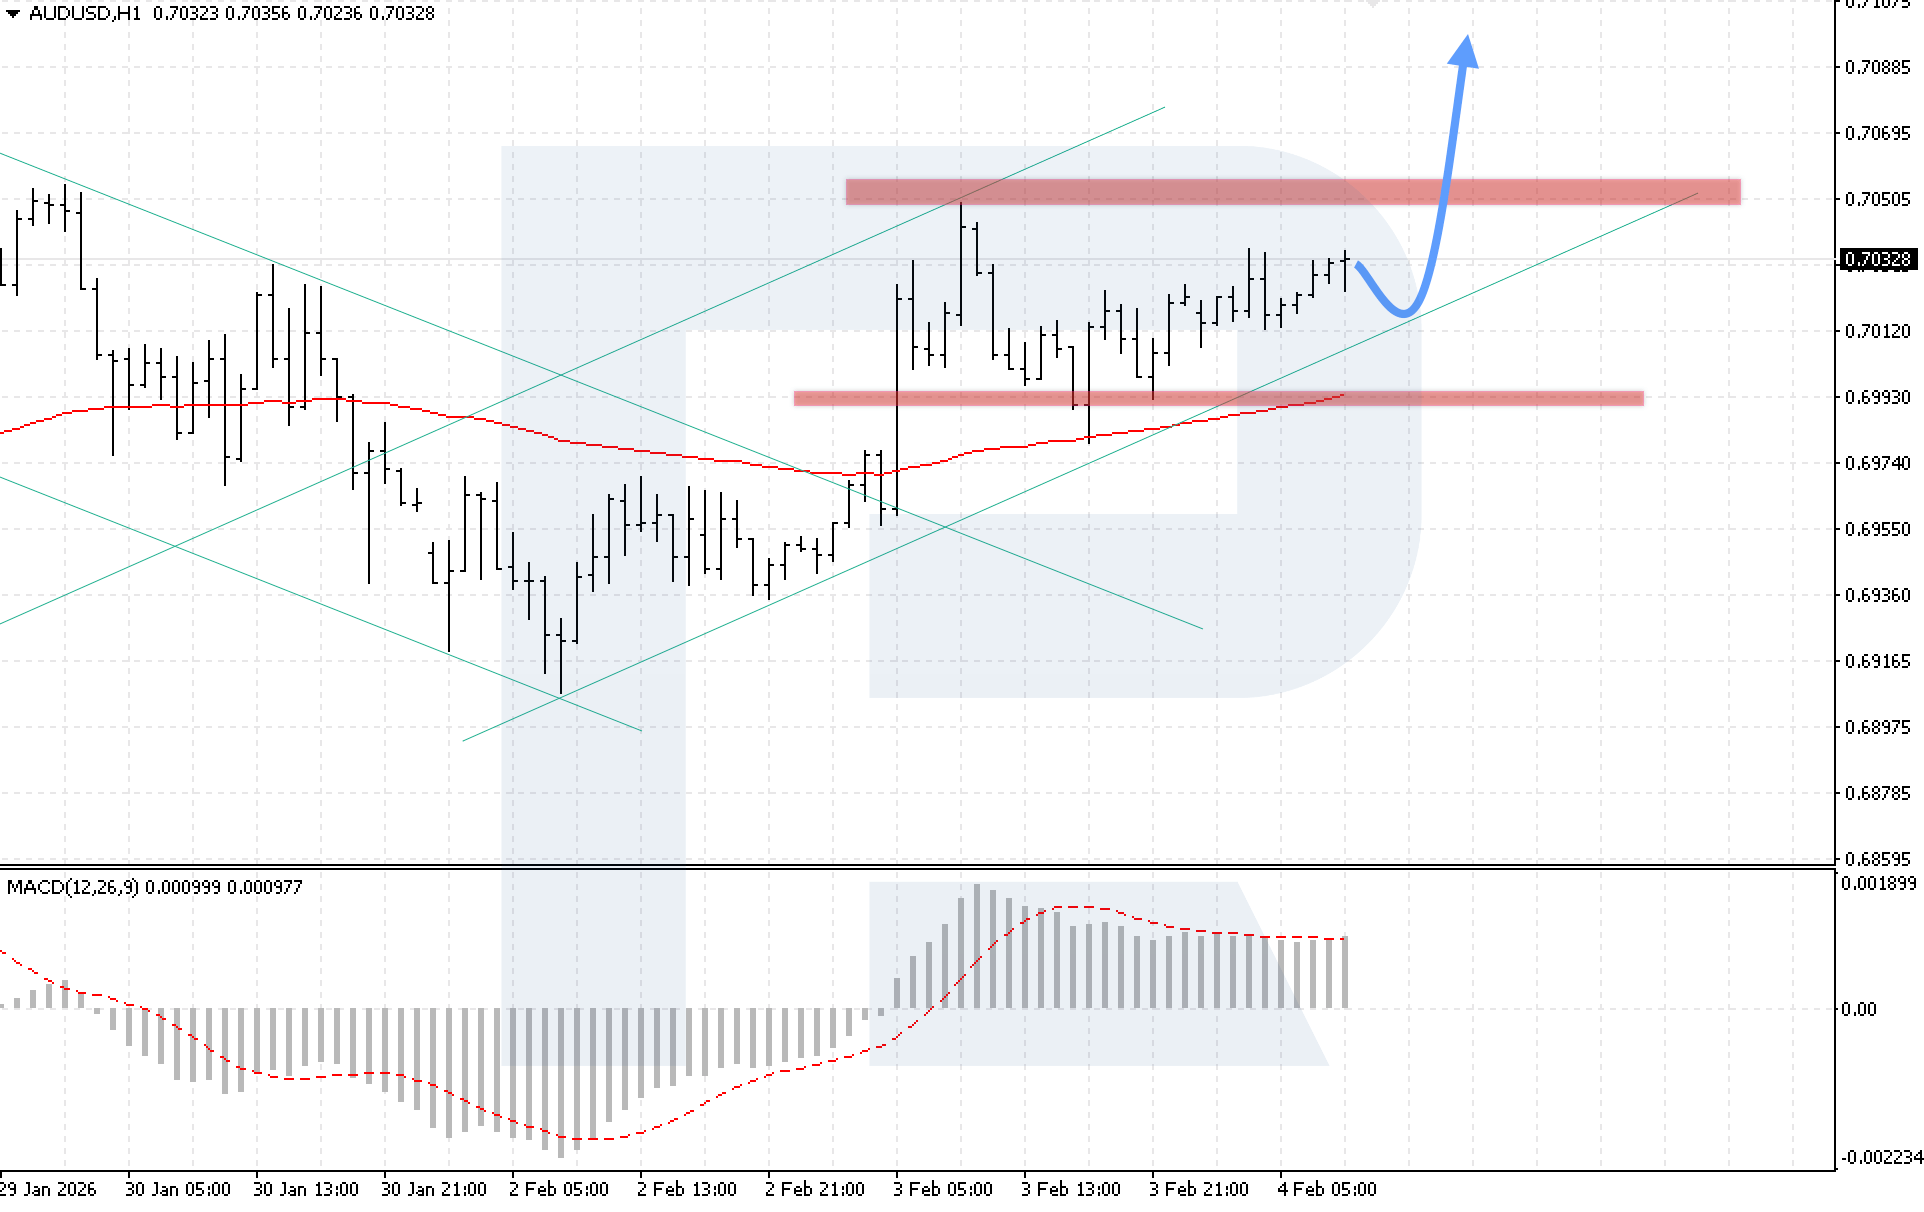
On the AUDUSD H4 chart, the market is in a correction phase; however, bullish pressure remains in place. The nearest support level is located at 0.6995. Today, 4 February 2026, the pair could gain bullish momentum, targeting the 0.7105 level.
The technical picture confirms this scenario: the MACD indicator shows growth of the histogram, reflecting the completion of the correction phase and the renewed bullish momentum. A key condition for the bullish scenario will be price consolidation above the 0.7065 level, which would confirm buyer strength.
The alternative scenario will be activated if the lower boundary of the channel is broken with consolidation below 0.6995, which may push the AUDUSD pair lower towards the 0.6925 level.
USDCAD forecast
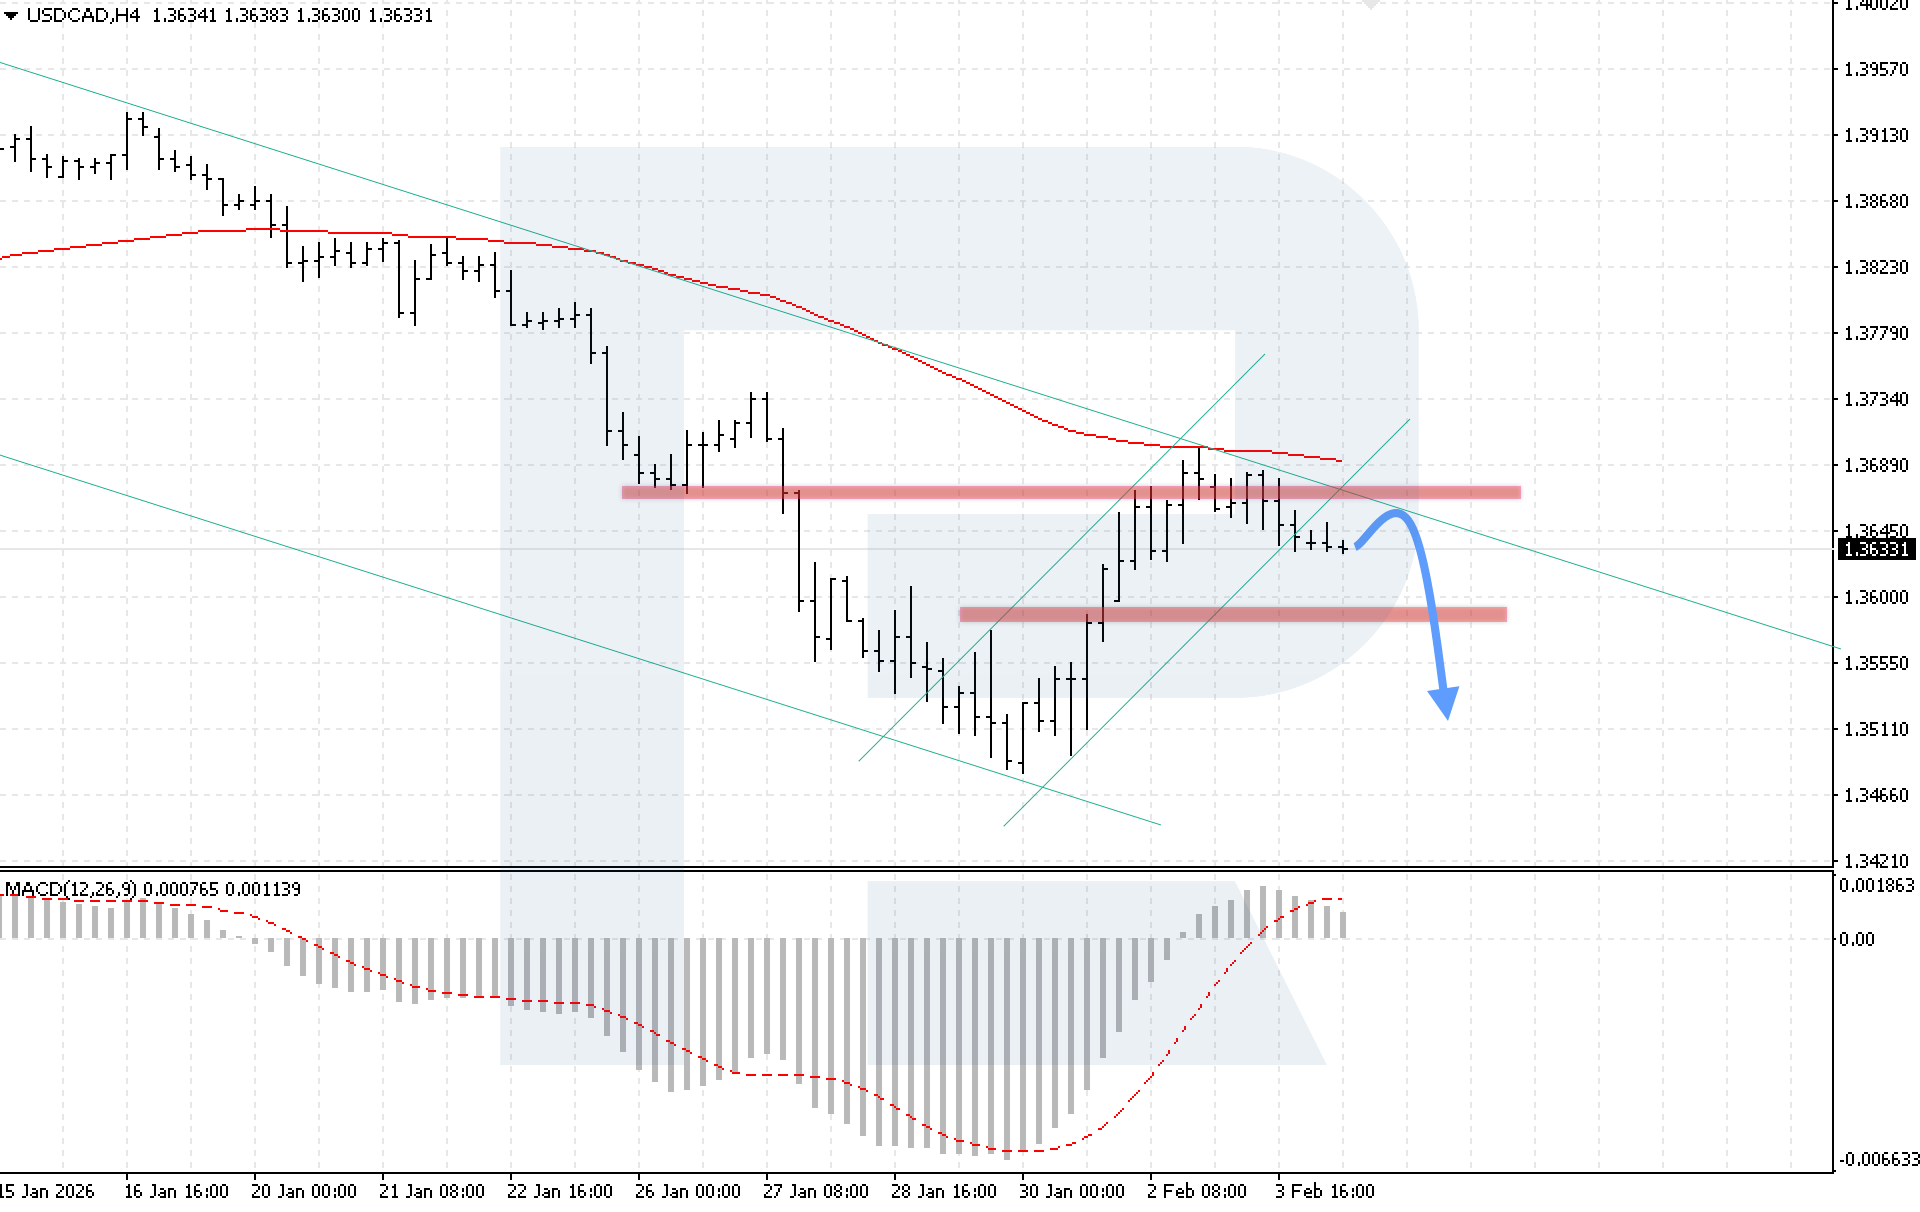
On the USDCAD H4 chart, the market continues to develop a downward move after breaking below the lower boundary of the bullish corrective channel. The nearest resistance level is located at 1.3645. Today, 4 February 2026, the bearish momentum could continue towards a potential target of 1.3515.
The technical picture confirms this scenario: the MACD indicator shows a decline in the histogram, while the signal line has formed a bearish crossover, indicating the completion of the previous growth wave. A key condition for the bearish scenario will be price consolidation below the 1.3585 level.
The alternative scenario will be activated if the upper boundary of the channel is broken with consolidation above the 1.3705 level, which would signal renewed bullish momentum in USDCAD.
XAUUSD forecast
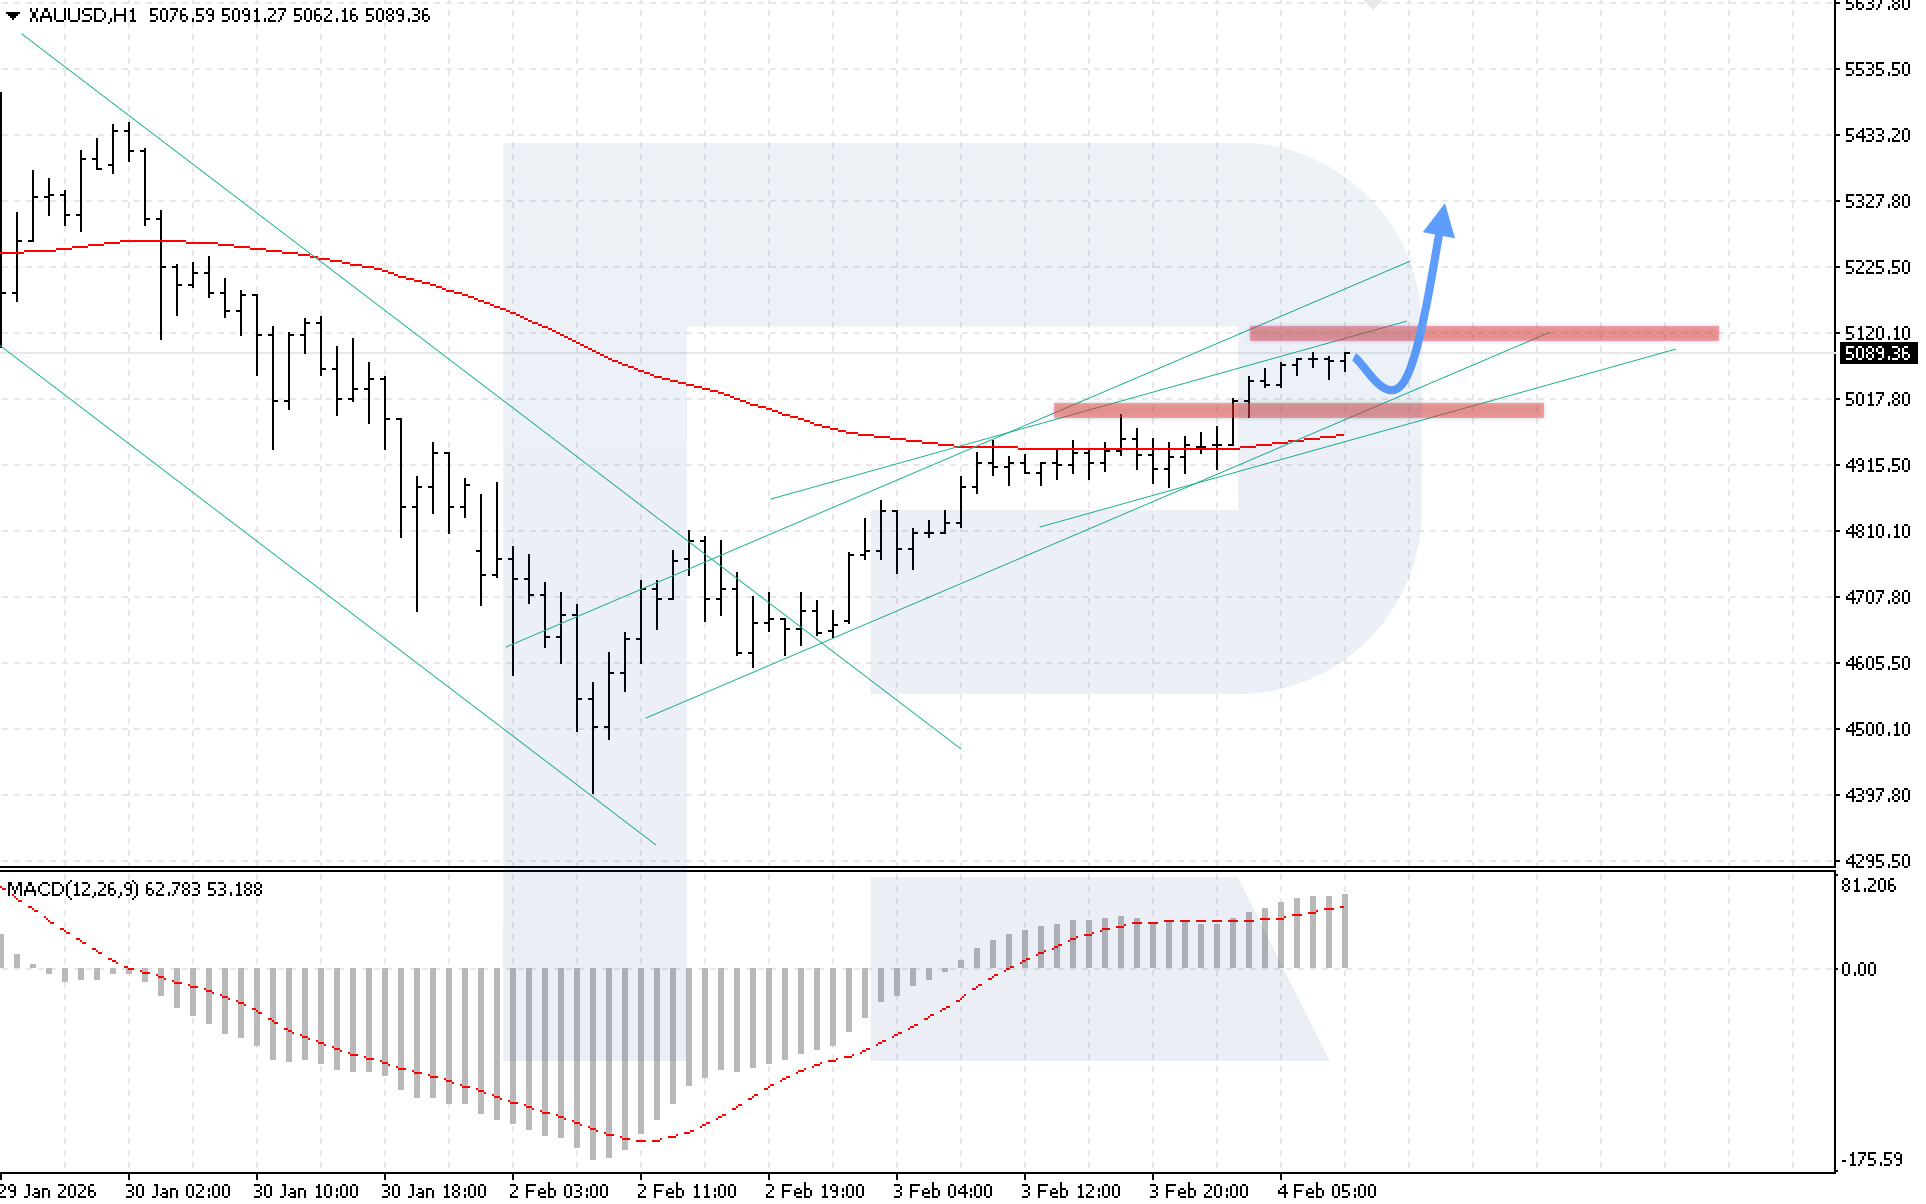
On the XAUUSD H4 chart, the market is rising actively, while buyers have encountered resistance near the upper boundary of the bullish channel. The nearest support level is located at 5,015. Today, 4 February 2026, a rebound from the lower boundary of the ascending channel could follow, with a target at the 5,325 level.
The technical picture confirms this scenario: the MACD indicator shows active growth of the histogram, indicating a new bullish impulse wave. A key condition for the scenario will be price consolidation above the 5,125 level, which would confirm buyer strength and open the path to the next level.
The alternative scenario will be activated if the lower boundary of the channel is broken with consolidation below the 4,925 level, which may trigger further decline in XAUUSD prices.
Brent forecast
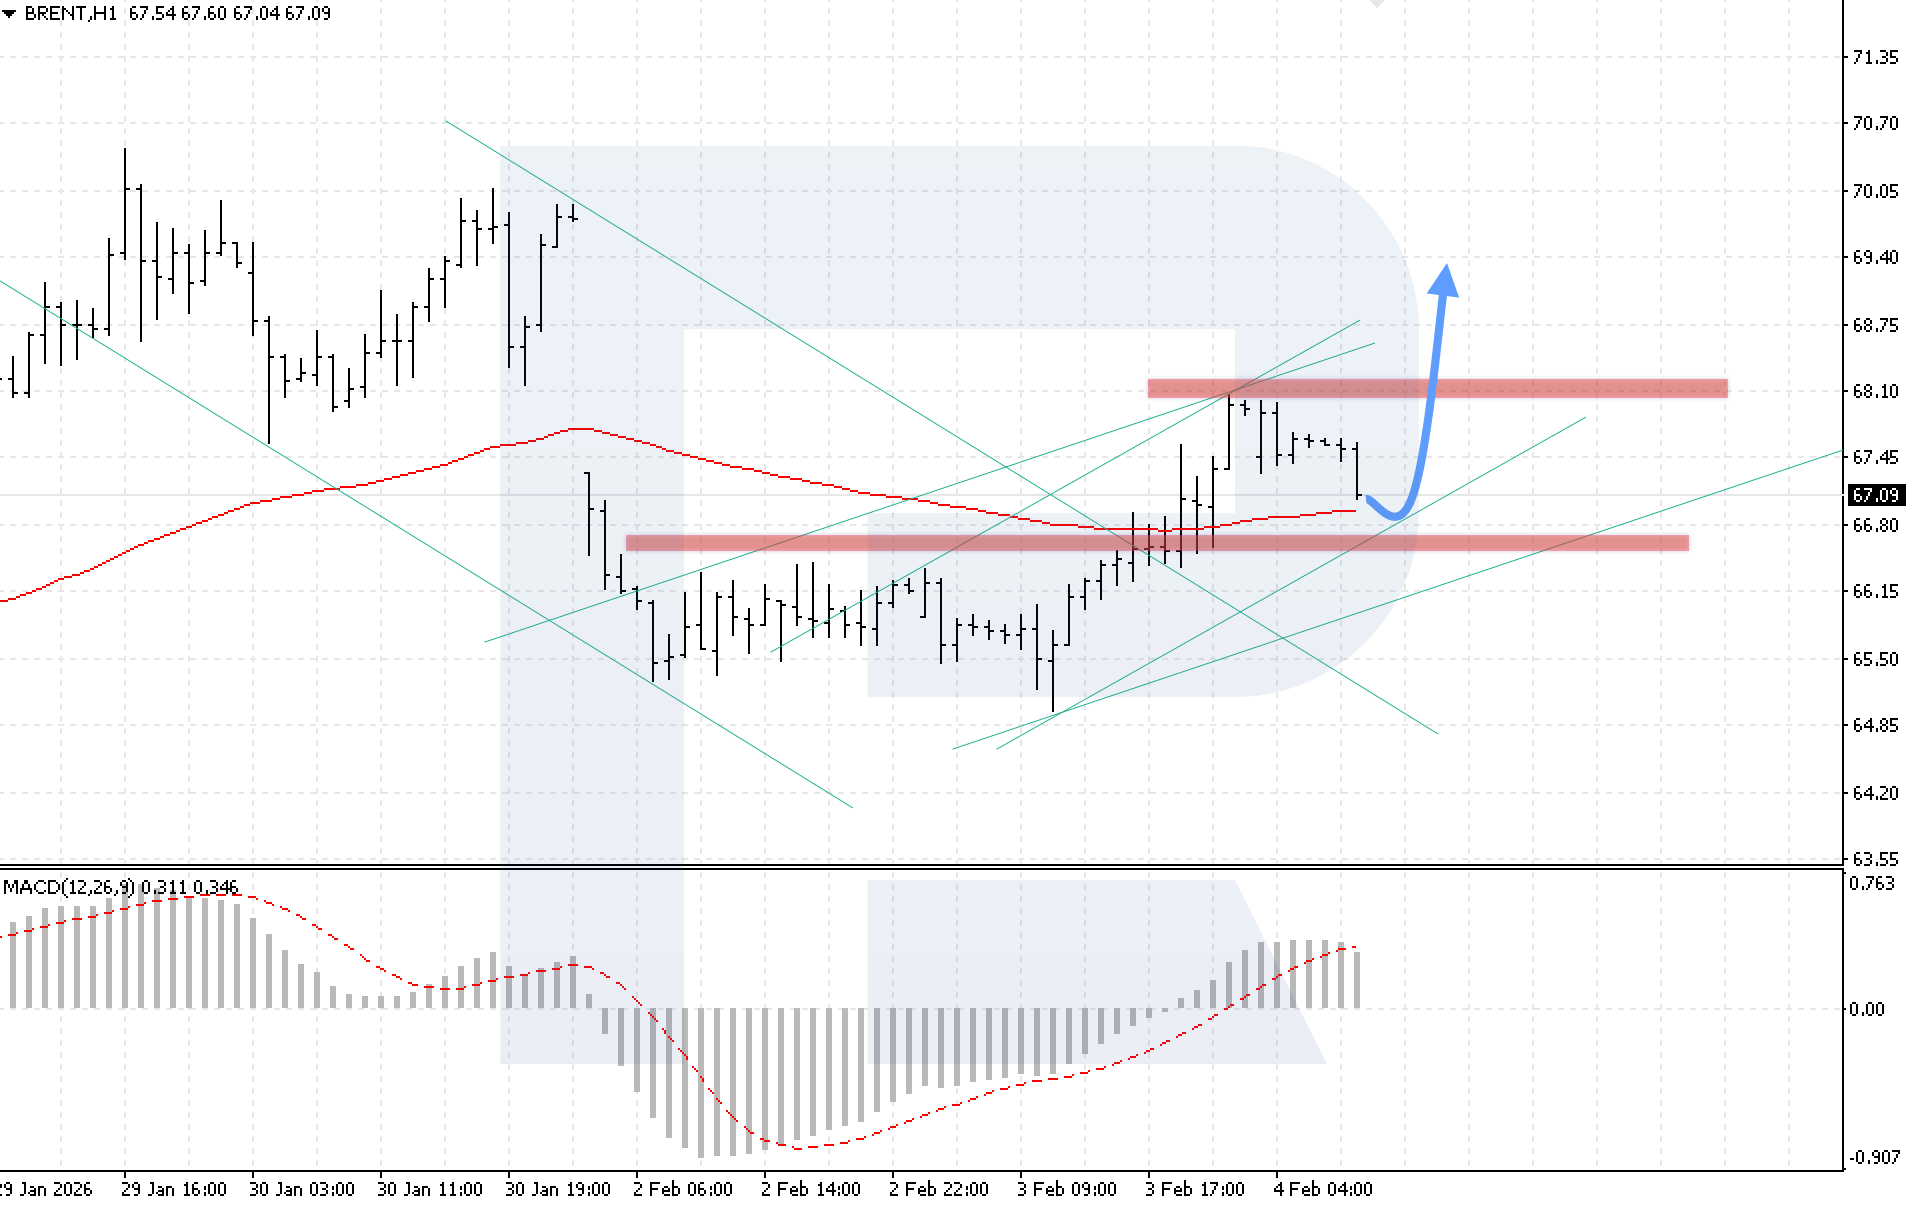
On the Brent H4 chart, the market is forming a corrective wave; however, buyers are holding prices above the EMA-85. The nearest support level is located at 66,85. Today, 4 February 2026, prices could resume growth towards the 69,40 level after rebounding from the lower boundary of the bullish channel.
The technical picture confirms the bullish scenario: the MACD indicator shows a slowdown in histogram growth, reflecting a phase of price consolidation. A key condition for the scenario will be price consolidation above the 68,10 level.
The alternative scenario will be activated if the lower boundary of the channel is broken with consolidation below the 66,75 level, which may trigger a continued decline in Brent prices.
Editors’ picks
 EURUSD 2026-2027 forecast: key market trends and future predictions
This article provides the EURUSD forecast for 2026 and 2027 and highlights the main factors determining the direction of the pair’s movements. We will apply technical analysis, take into account the opinions of leading experts, large banks, and financial institutions, and study AI-based forecasts. This comprehensive insight into EURUSD predictions should help investors and traders make informed decisions.
 Gold (XAUUSD) forecast 2026 and beyond: expert insights, price predictions, and analysis
Dive deep into the Gold (XAUUSD) price outlook for 2026 and beyond, combining technical analysis, expert forecasts, and key macroeconomic factors. It explains the drivers behind gold’s recent surge, explores potential scenarios including a move toward 4,500 to 5,000 USD per ounce, and highlights why the metal remains a strong hedge during global uncertainty.
Forecasts presented in this section only reflect the author’s private opinion and should not be considered as guidance for trading. RoboForex bears no responsibility for trading results based on trading recommendations described in these analytical reviews.