Daily technical analysis and forecast for 5 February 2026
Here is a detailed daily technical analysis and forecast for EURUSD, USDJPY, GBPUSD, AUDUSD, USDCAD, XAUUSD, and Brent for 5 February 2026.
EURUSD forecast
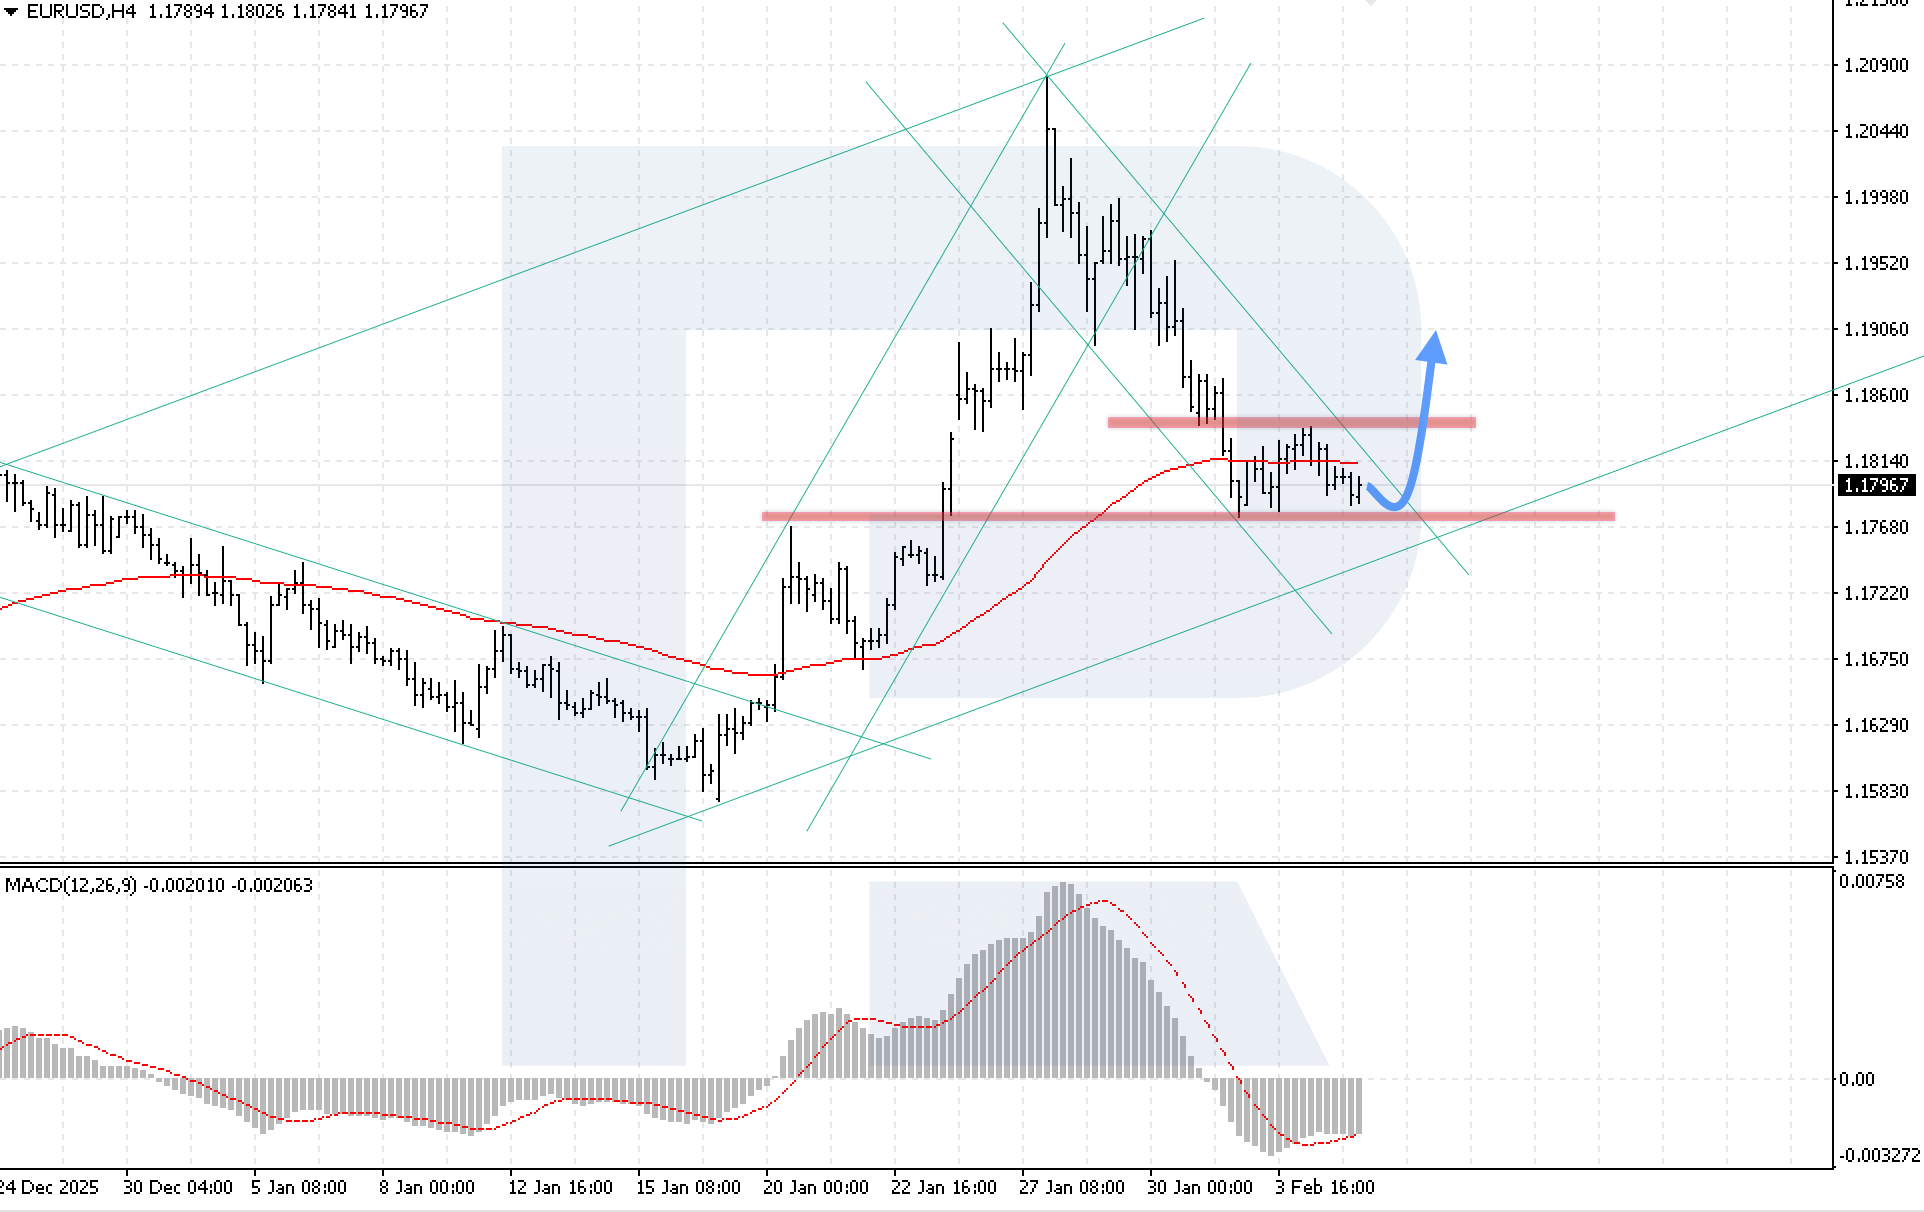
On the EURUSD H4 chart, the market is forming a correction within the Double Bottom pattern. Today, 5 February 2026, the consolidation phase could be complete, and bullish momentum could form, with a target at the 1.1905 level.
The technical picture confirms this scenario: the MACD indicator has been showing histogram growth for several consecutive trading sessions, while a decline in prices below current levels could trigger the formation of bullish divergence. A key condition for the upside scenario will be confident price consolidation above the 1.1860 level. This would signal a breakout above the upper boundary of the Double Bottom reversal model and the start of pattern implementation.
The alternative scenario will be activated if prices decline below the 1.1745 level, which could lead to renewed downward momentum.
USDJPY forecast
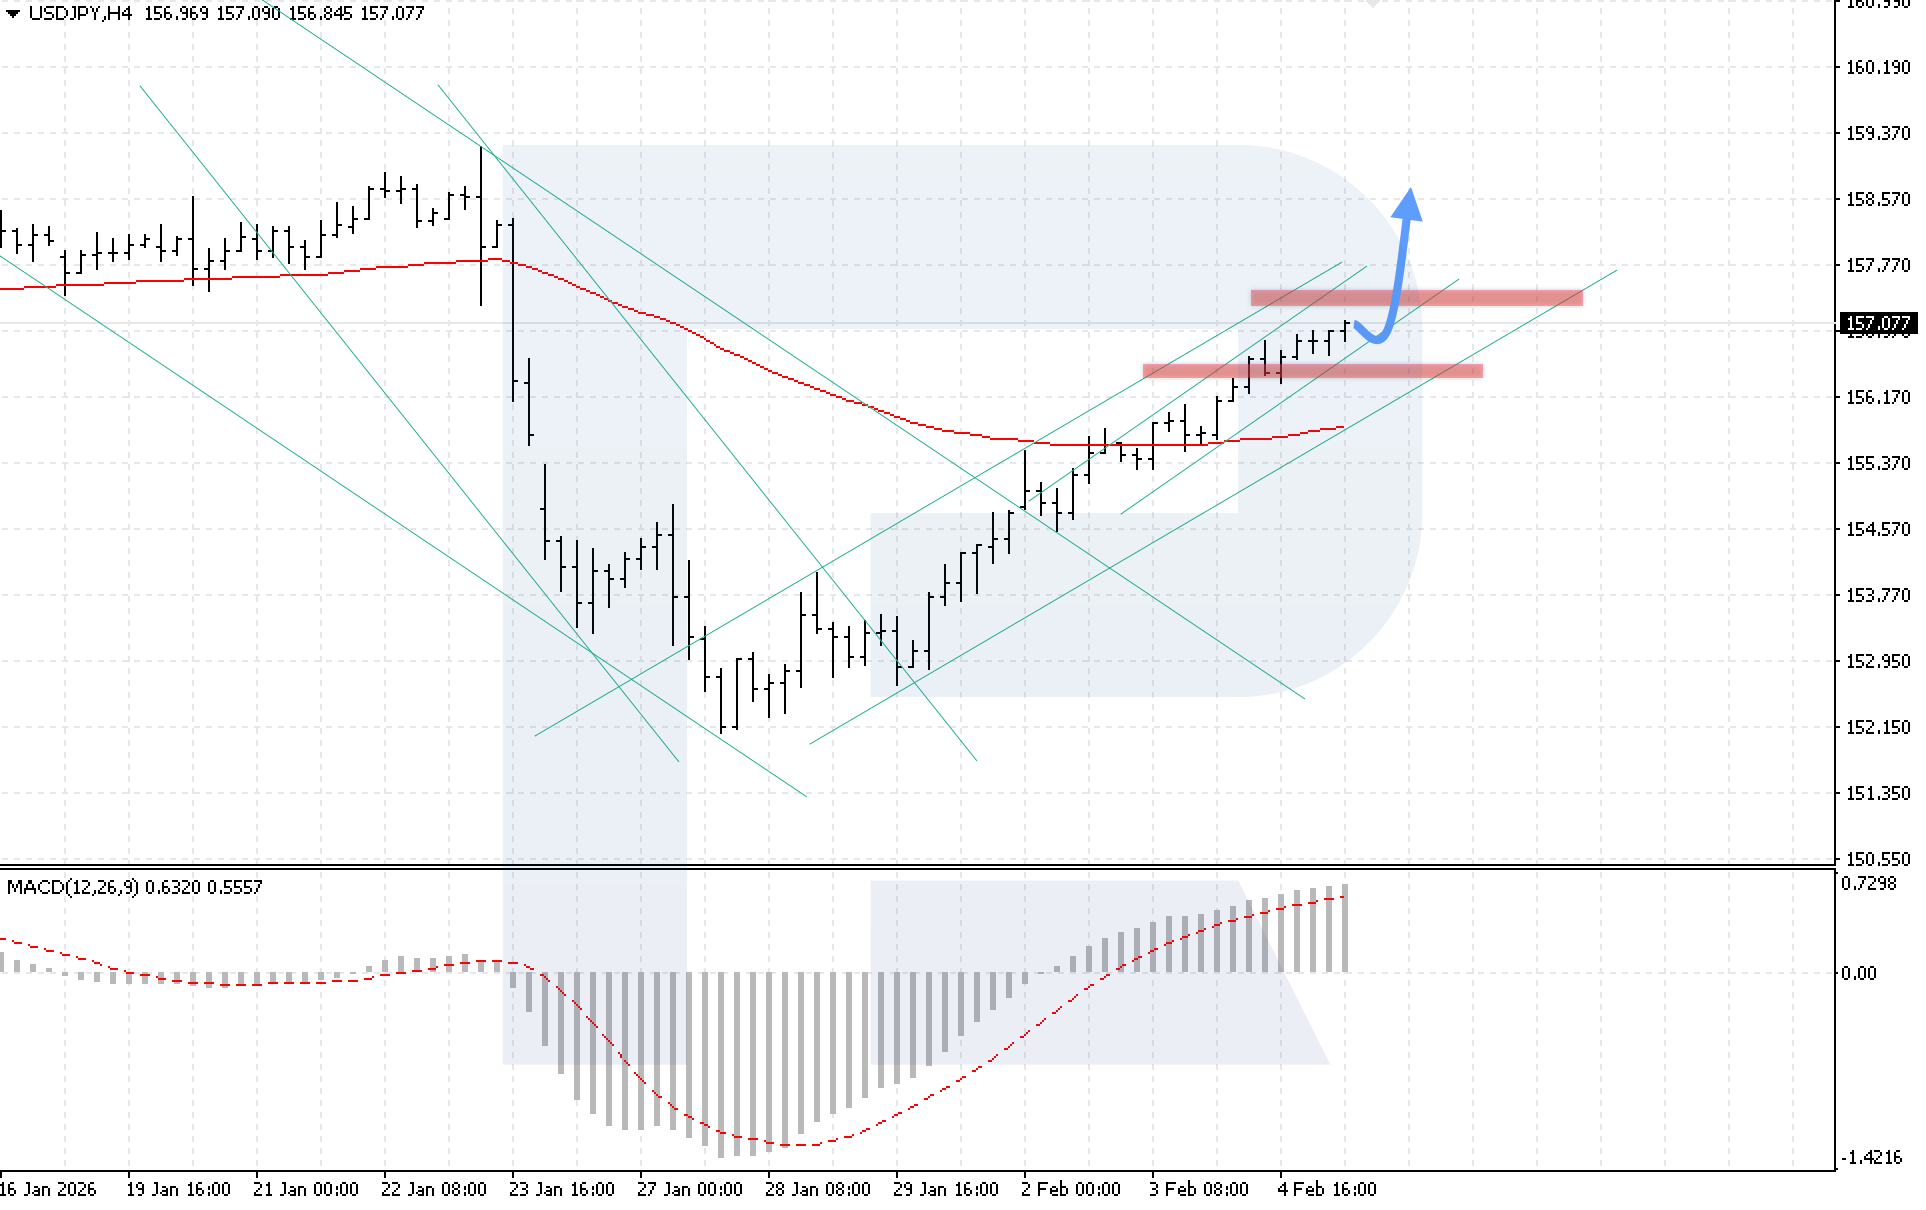
On the USDJPY H4 chart, the market demonstrates confident growth, breaking above resistance levels one after another, confirming the strength of the bullish momentum. The nearest support level is located at 156.35. Today, 5 February 2026, prices could continue their upward trajectory, with a target at the 158.55 level.
The technical picture confirms this scenario: the MACD indicator continues to show histogram growth, indicating bullish strength. A key condition for the upward scenario will be a rebound from the lower boundary of the bullish channel.
The alternative scenario will be activated if the lower boundary of the channel is broken with consolidation below the 156.35 level, which could lead to a resumption of downward movement in USDJPY.
GBPUSD forecast
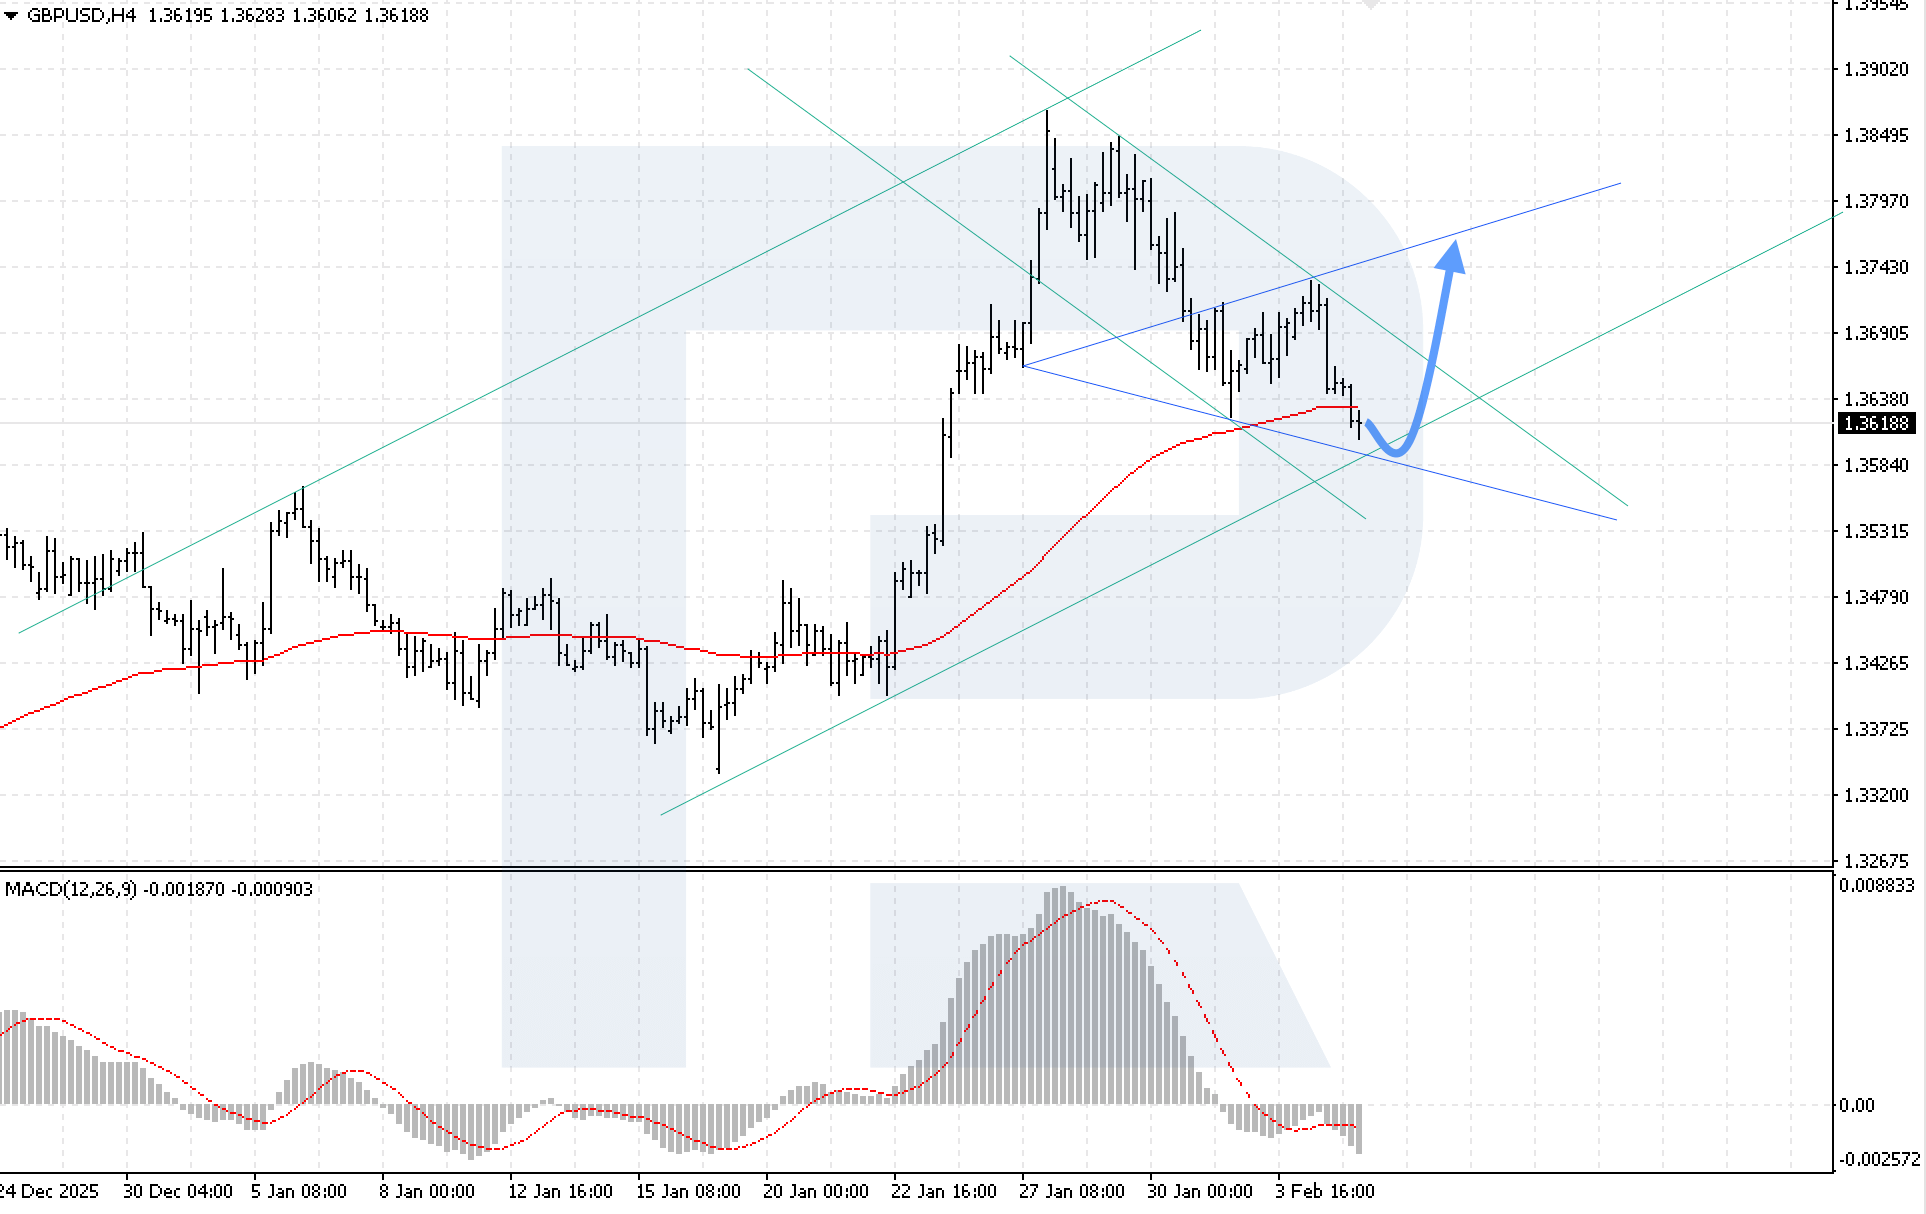
On the GBPUSD H4 chart, prices continue to decline; however, despite selling pressure, the potential for forming a bullish Wolfe Wave remains in place. The nearest support level is located at 1.3585. Today, 5 February 2026, the pair could dip towards 1.3590 before rising above 1.3745, following the bullish pattern signal with a target at 1.3765.
The technical picture confirms this scenario: the MACD indicator shows a decline, indicating selling pressure; however, the signal line is expected to exit the histogram range in the near term, which could signal a trend reversal. A key condition for the bullish scenario will be price consolidation above the 1.3690 level, which would indicate a breakout above the upper boundary of the bullish pattern.
The alternative scenario will be activated if the 1.3525 support level is broken, which could trigger further decline in GBPUSD prices with targets below 1.3435.
AUDUSD forecast
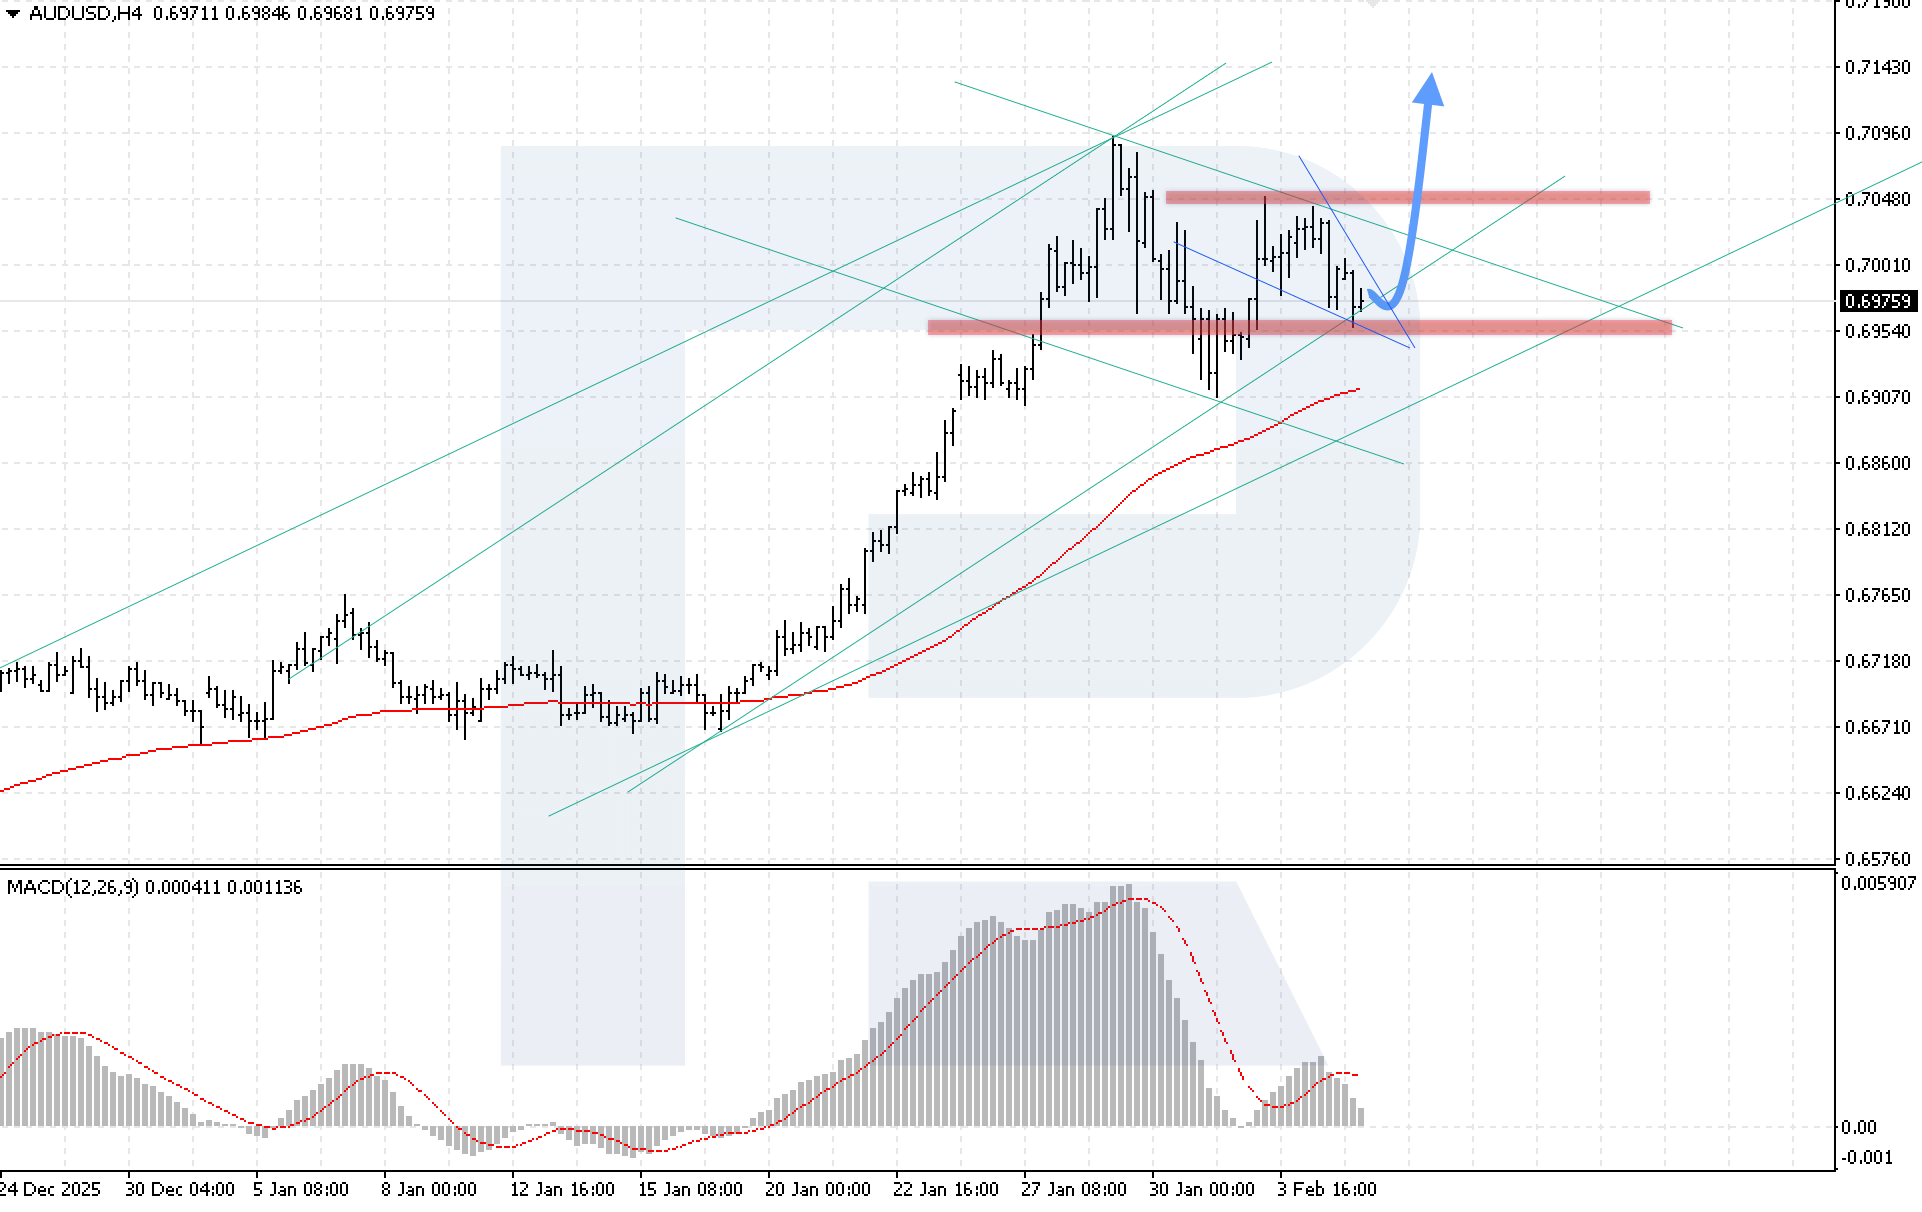
On the AUDUSD H4 chart, the market remains in a correction phase. Prices persistently test the lower boundary of the bullish channel and show potential for forming a Wedge reversal pattern. The nearest support level is located at 0.6955. Today, 5 February 2026, growth could resume, with a target at 0.7145.
The technical picture confirms this scenario: the MACD indicator shows a slowdown in histogram decline, reflecting the completion of the consolidation phase and the potential start of a bullish impulse. A key condition for the bullish scenario will be price consolidation above the 0.7005 level, which would indicate a breakout above the upper boundary of the Wedge reversal model.
The alternative scenario will be activated if the lower boundary of the bullish channel is broken with consolidation below the 0.69335 level, which could push the AUDUSD pair lower towards 0.6875.
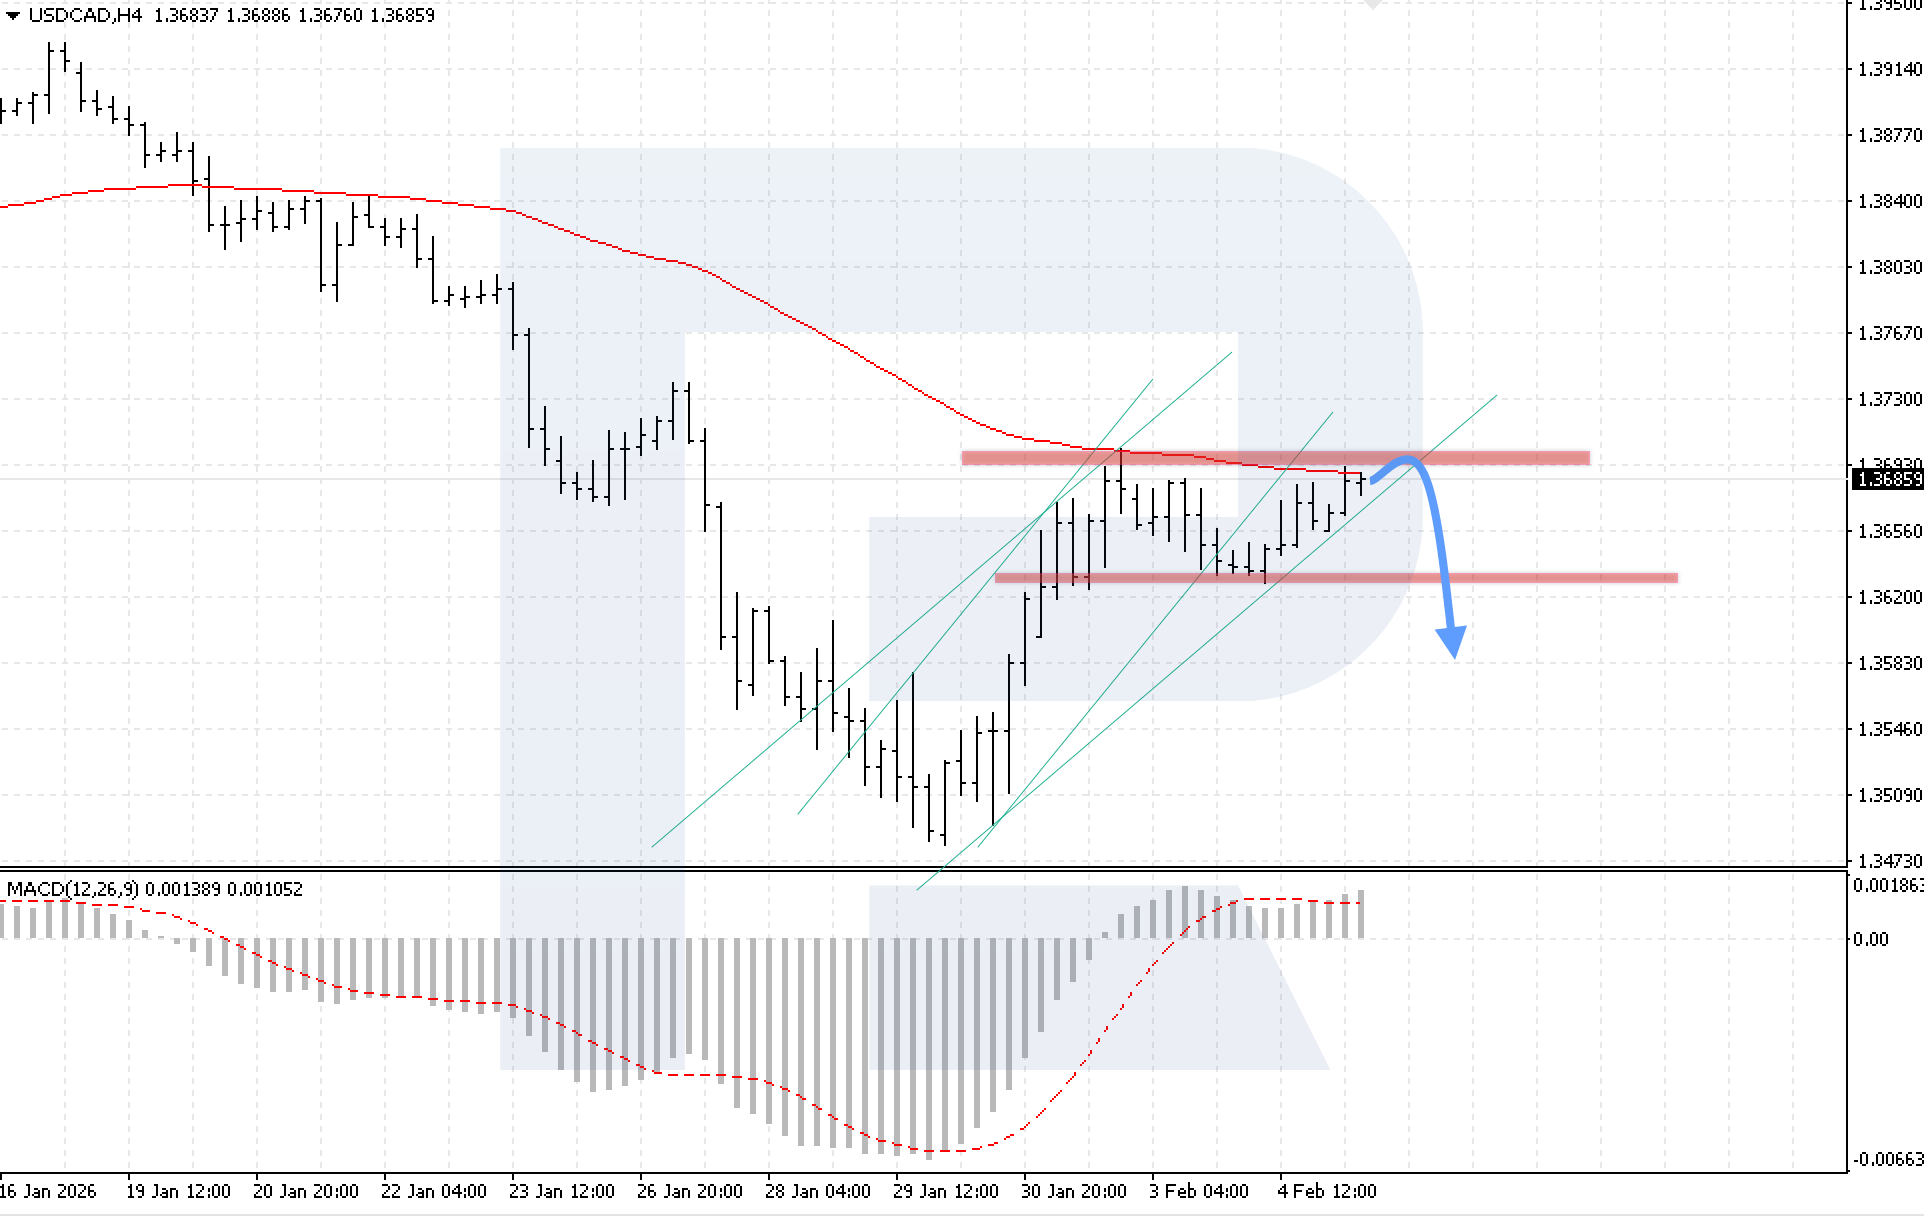
USDCAD forecast
On the USDCAD H4 chart, the market continues to correct and form a Double Top reversal pattern. The nearest resistance level is located at 1.3695. Today, 5 February 2026, the pair could rebound from this level and gain bearish momentum, with a potential target at 1.3585.
The technical picture confirms this scenario: the MACD indicator shows a slowdown in histogram growth and indicates the risk of forming bearish divergence. A key condition for the downward scenario will be price consolidation below the 1.3655 level, which would signal a breakout of the lower boundary of the bullish channel.
The alternative scenario will be activated if the upper boundary of the Double Top reversal model is broken with consolidation above the 1.3735 level, which would signal renewed growth in USDCAD.
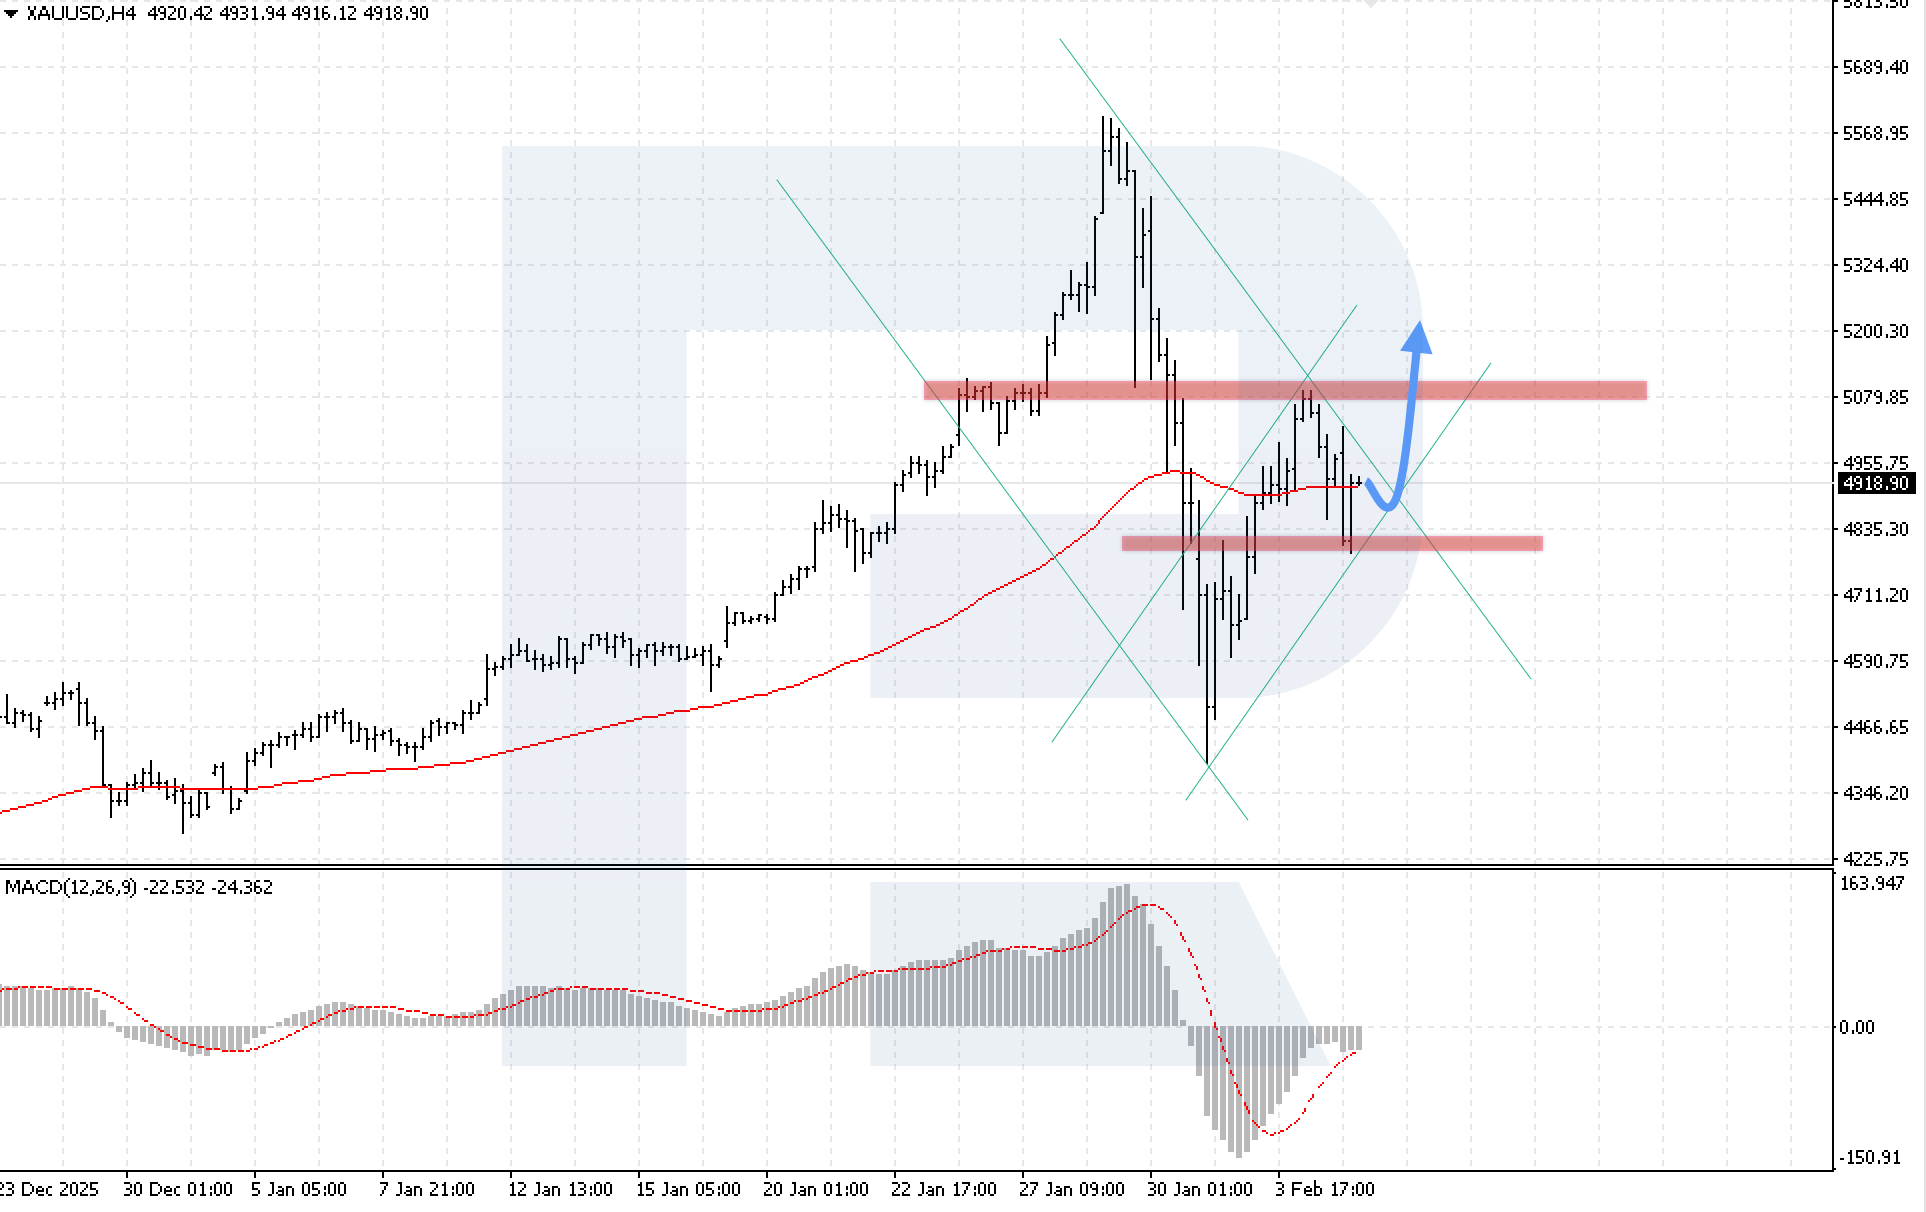
XAUUSD forecast
On the XAUUSD H4 chart, the market is undergoing a correction after the previous growth. Buyers are holding prices above the EMA-85, indicating persistent bullish pressure. The nearest support level is located at 4,835. Today, 5 February 2026, prices could rebound from the lower boundary of the bullish channel, with a target at 5,205.
The technical picture confirms this scenario: the MACD indicator shows histogram growth, reflecting the completion of the correction phase and the resumption of the bullish momentum. A key condition for the scenario will be price consolidation above the 5,025 level, which would confirm buyer strength and indicate a breakout above the upper boundary of the descending channel.
The alternative scenario will be activated if the lower boundary of the channel is broken with consolidation below the 4,745 level, which could trigger further decline in XAUUSD prices towards 4,355.
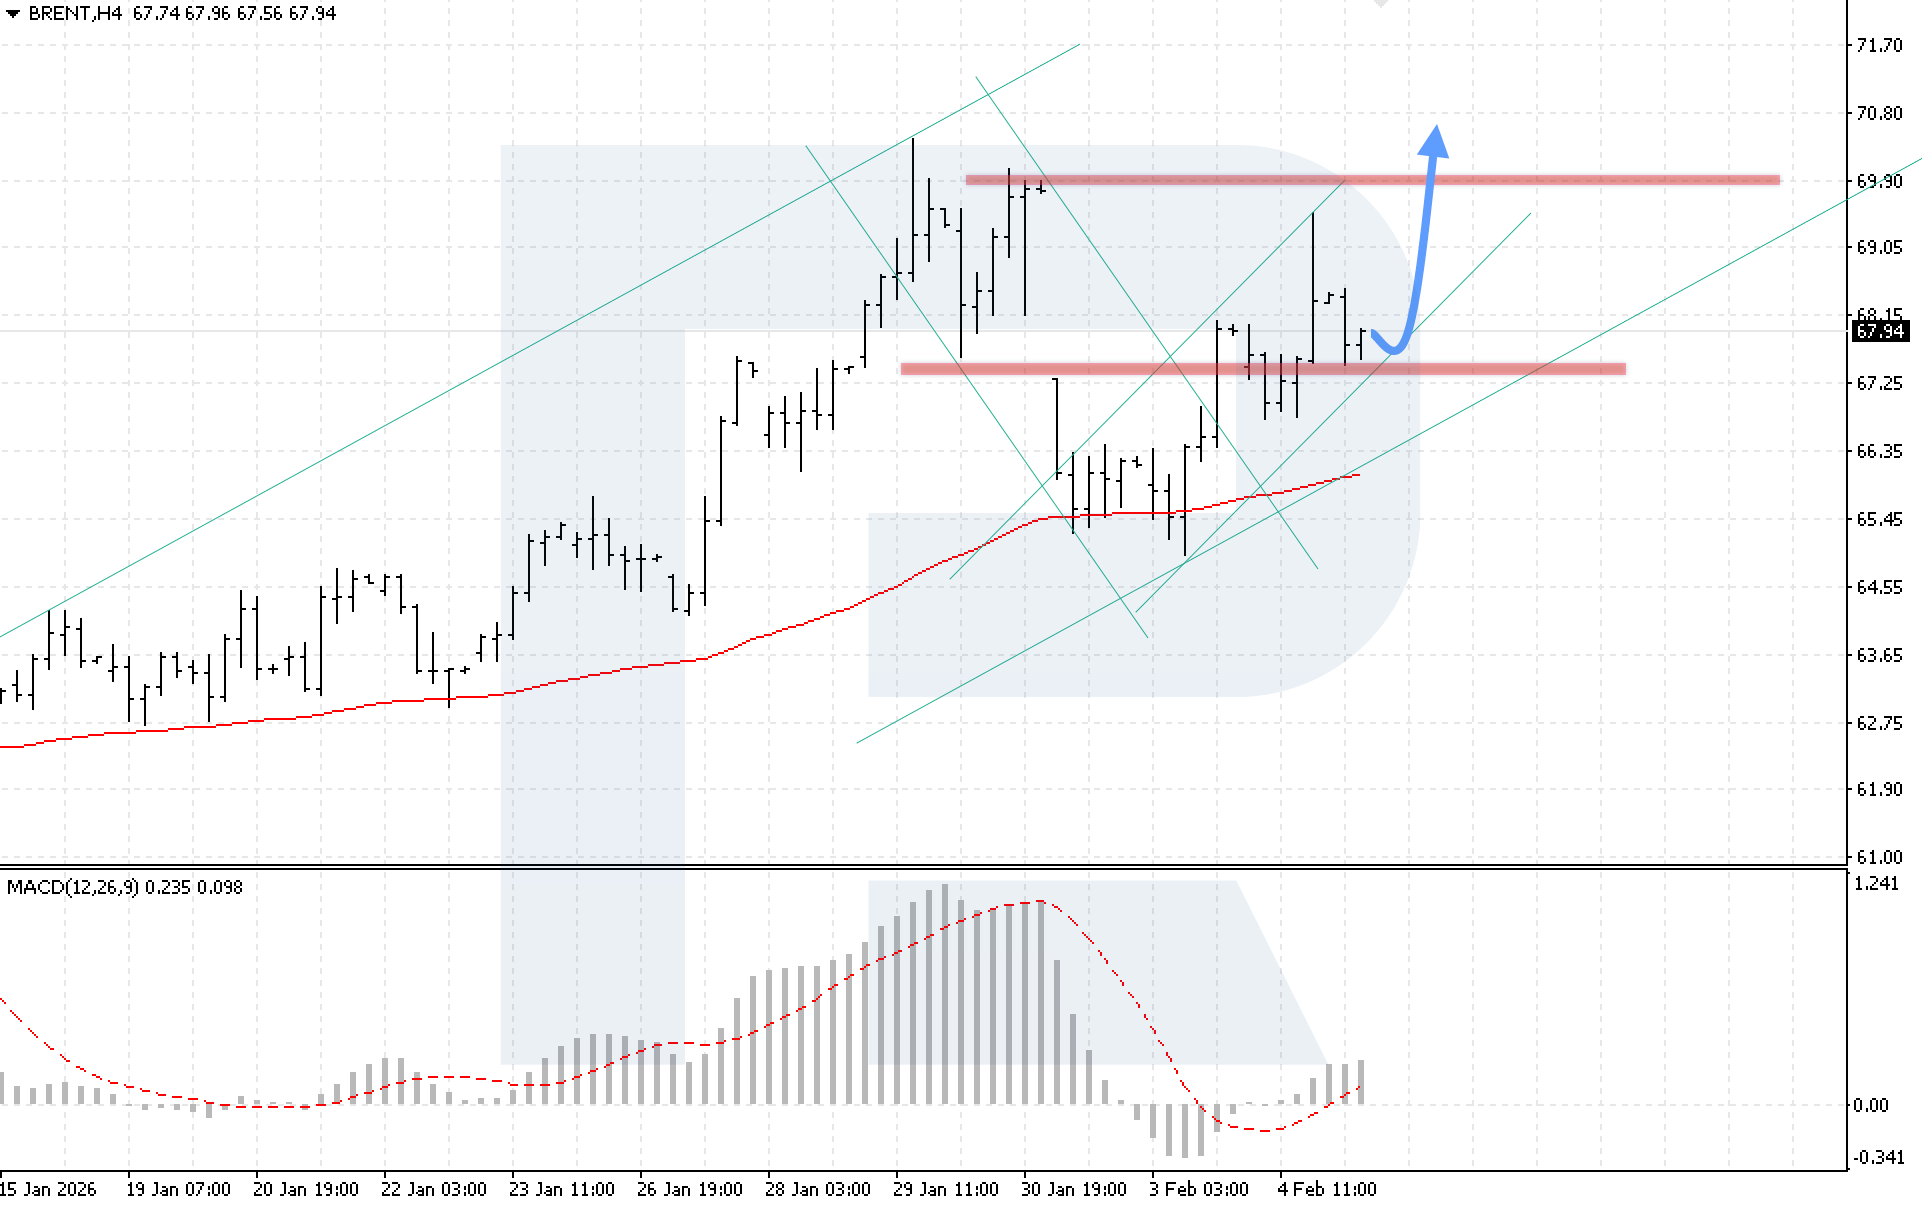
Brent forecast
On the Brent H4 chart, the market is forming a corrective wave after rebounding from the resistance level. Buyers are holding prices above the EMA-85, indicating increasing bullish pressure. The nearest support level is located at 67,35. Today, 5 February 2026, quotes could rise towards the 70,80 level after rebounding from the lower boundary of the ascending channel.
The technical picture confirms the bullish scenario: the MACD indicator shows histogram growth, reflecting the development phase of the bullish momentum. A key condition for the scenario will be price consolidation above the 69,05 level.
The alternative scenario will be activated if the lower boundary of the channel is broken with consolidation below the 66,70 level, which could trigger a corrective wave and a decline in Brent prices.
Editors’ picks
 EURUSD 2026-2027 forecast: key market trends and future predictions
This article provides the EURUSD forecast for 2026 and 2027 and highlights the main factors determining the direction of the pair’s movements. We will apply technical analysis, take into account the opinions of leading experts, large banks, and financial institutions, and study AI-based forecasts. This comprehensive insight into EURUSD predictions should help investors and traders make informed decisions.
 Gold (XAUUSD) forecast 2026 and beyond: expert insights, price predictions, and analysis
Dive deep into the Gold (XAUUSD) price outlook for 2026 and beyond, combining technical analysis, expert forecasts, and key macroeconomic factors. It explains the drivers behind gold’s recent surge, explores potential scenarios including a move toward 4,500 to 5,000 USD per ounce, and highlights why the metal remains a strong hedge during global uncertainty.
Forecasts presented in this section only reflect the author’s private opinion and should not be considered as guidance for trading. RoboForex bears no responsibility for trading results based on trading recommendations described in these analytical reviews.