Daily technical analysis and forecast for 6 February 2026
Here is a detailed daily technical analysis and forecast for EURUSD, USDJPY, GBPUSD, AUDUSD, USDCAD, XAUUSD, and Brent for 6 February 2026.
EURUSD forecast
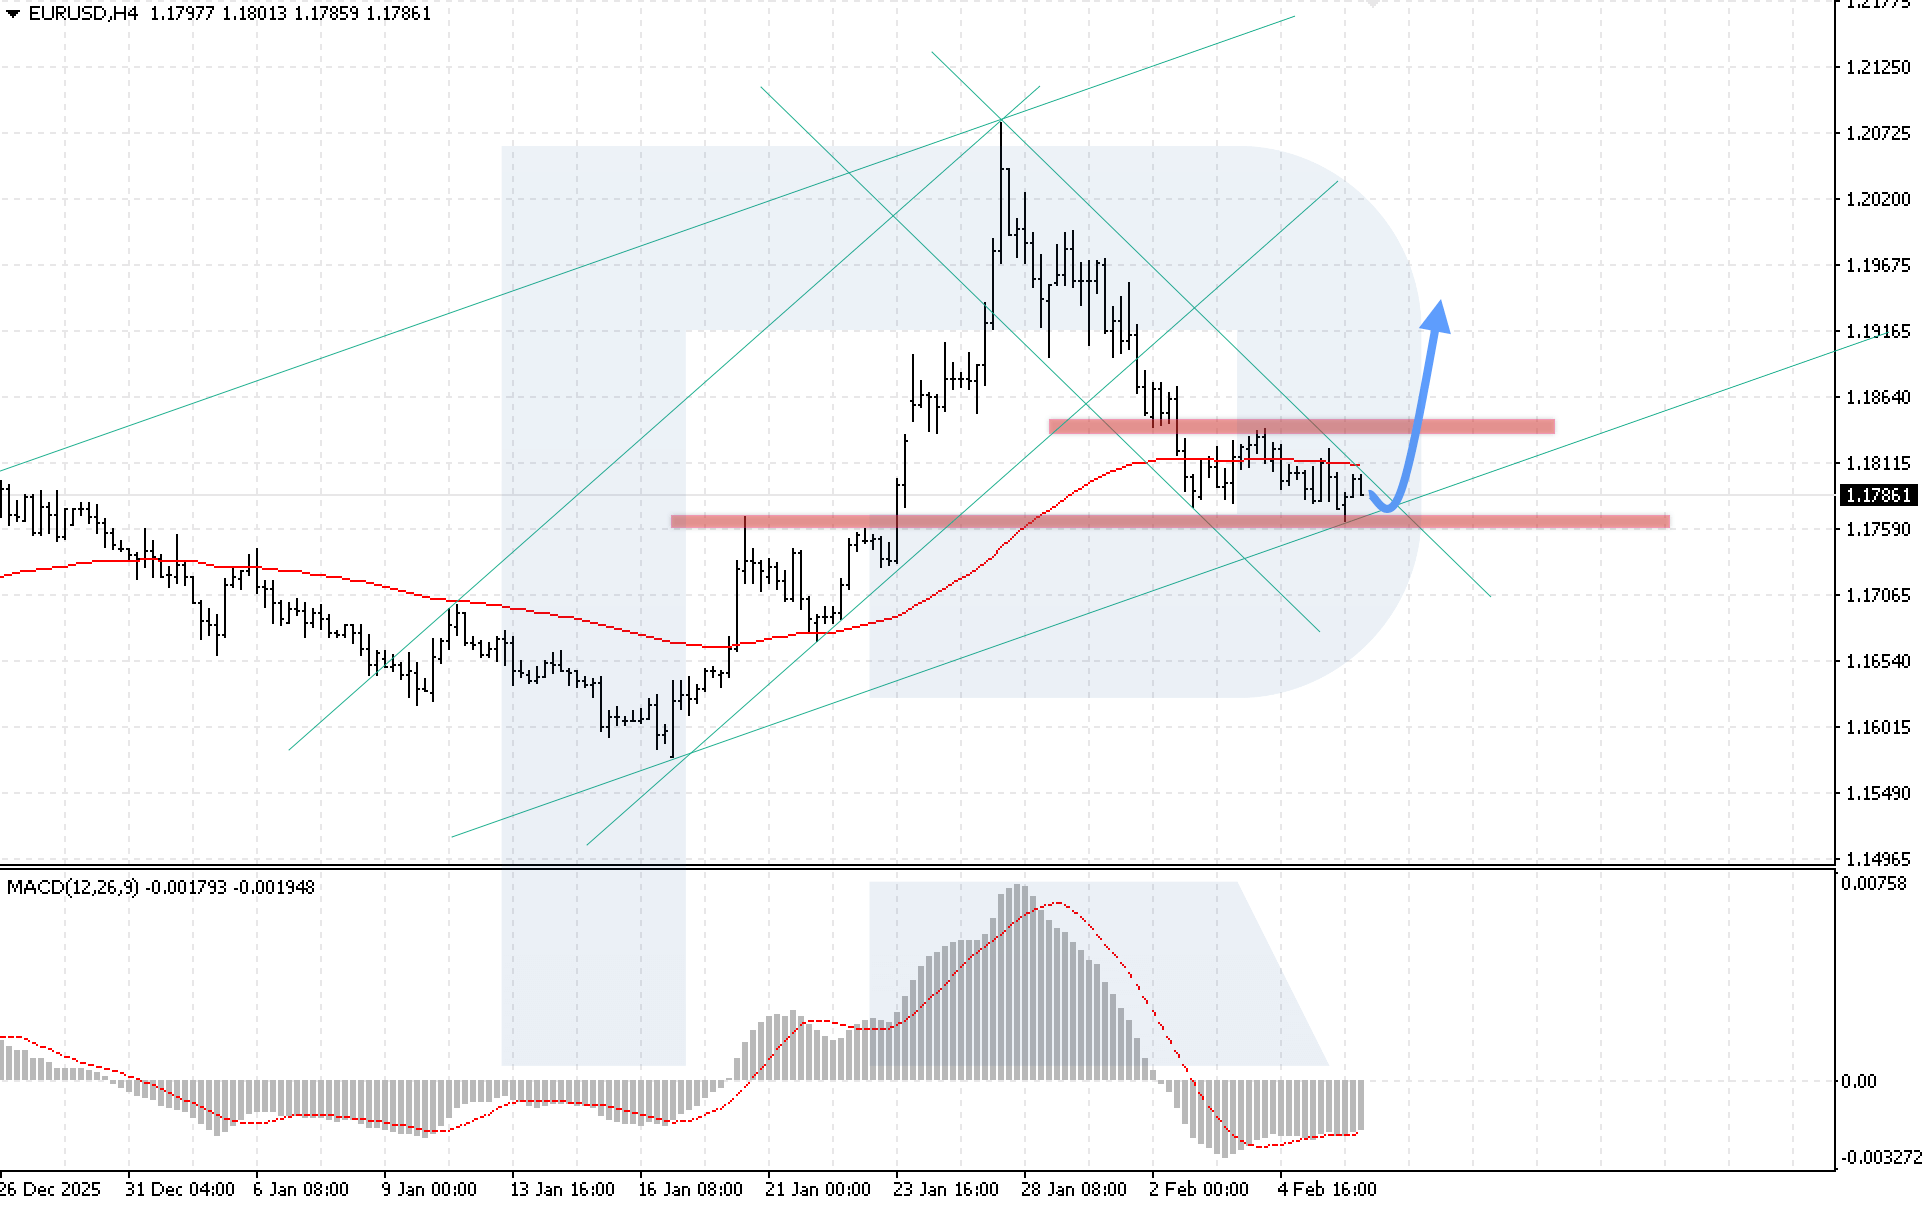
On the EURUSD H4 chart, a bearish correction continues to develop as part of a Double Bottom reversal pattern. Today, 6 February 2026, the consolidation could be complete, followed by a potential bullish wave, with a target at the 1.1925 level.
The technical picture supports this scenario: the MACD indicator shows histogram growth, and bullish divergence is forming. A key condition for the upside will be confident price consolidation above the 1.1845 level, which will confirm a breakout above the upper boundary of the reversal pattern and increase the likelihood of reaching the pattern targets.
The alternative scenario will be activated if prices decline below 1.1740, which may lead to renewed bearish momentum.
USDJPY forecast
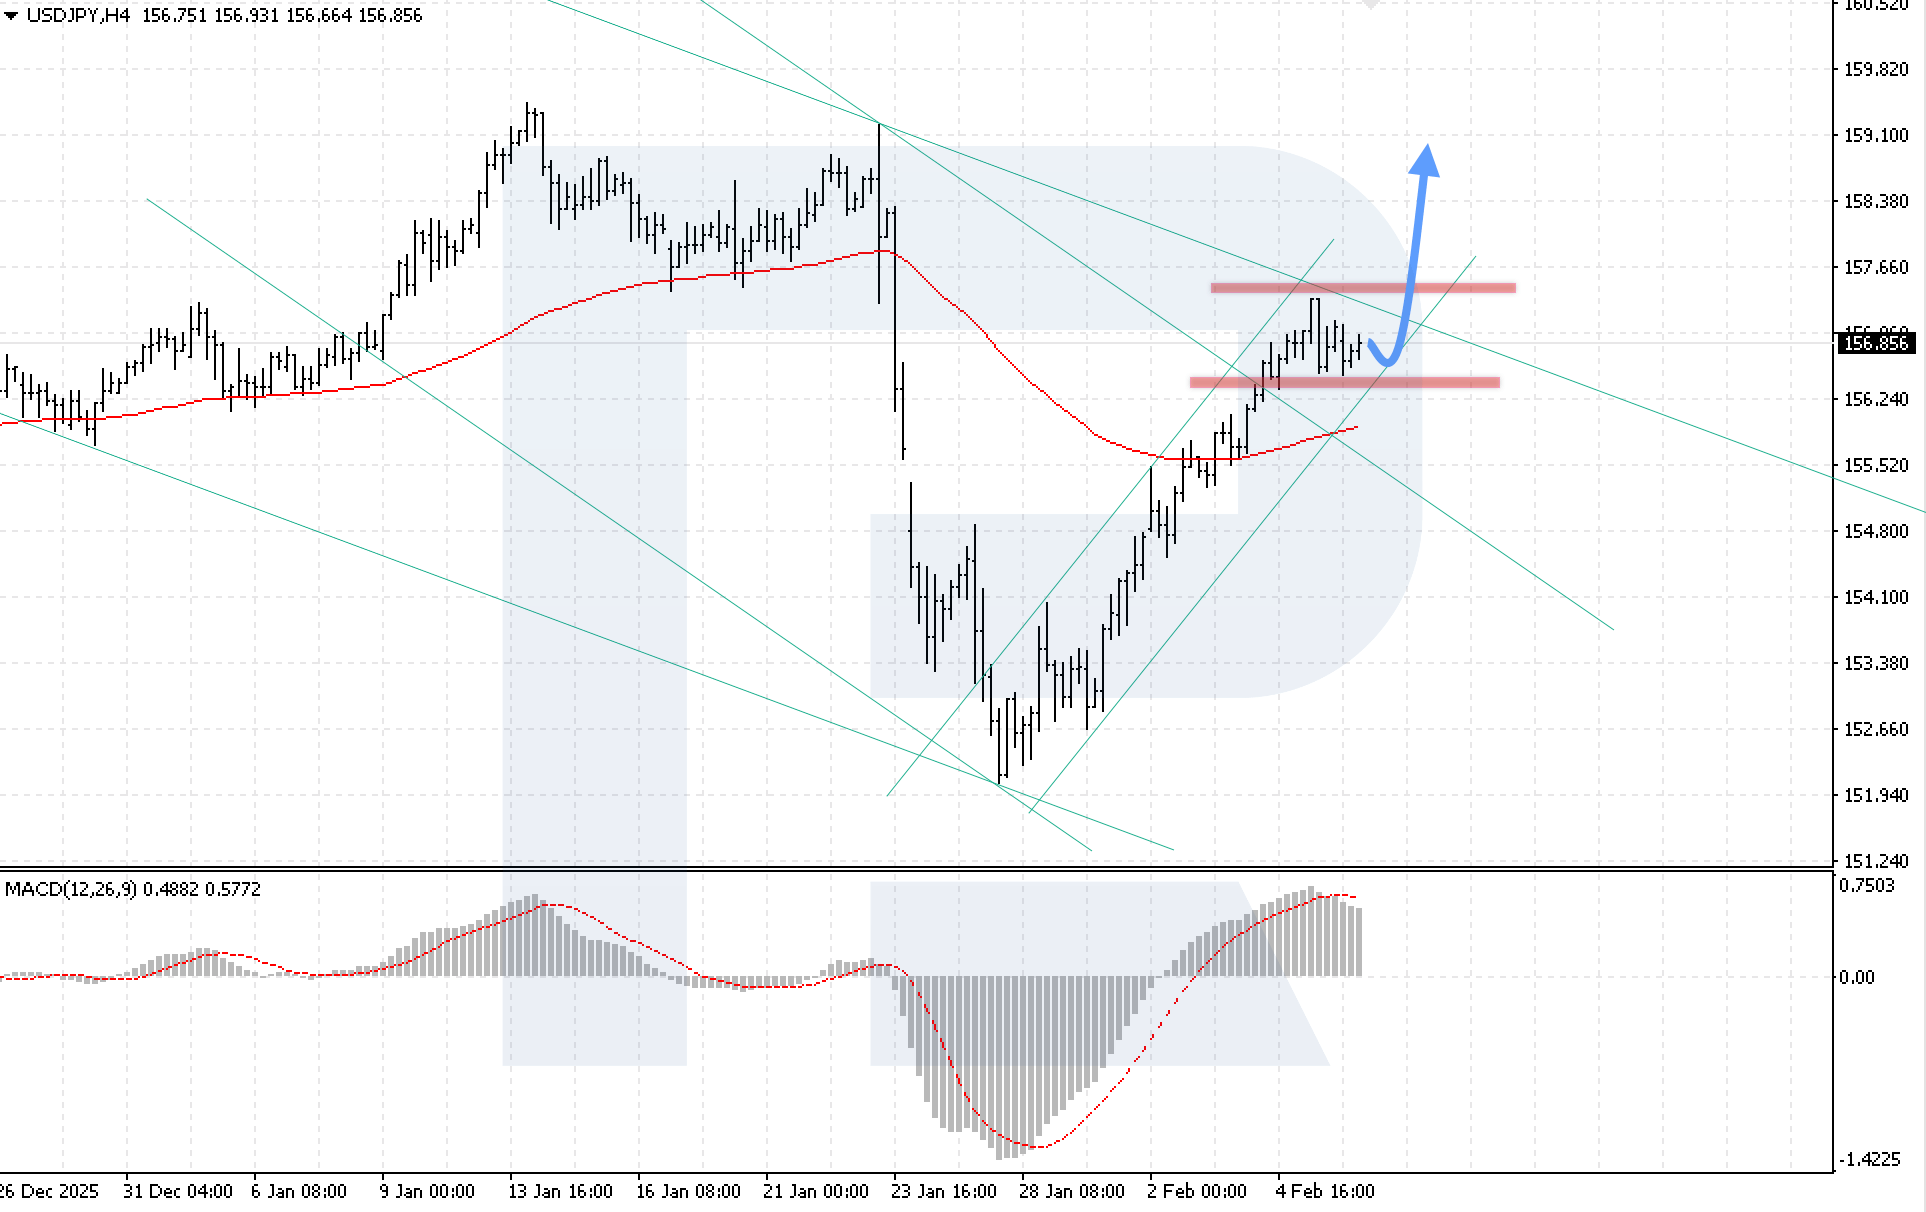
On the USDJPY H4 chart, the market is in a consolidation phase after testing the upper boundary of the downward channel. The nearest support level is located at 156.40. Today, 6 February 2026, the bullish momentum is likely to continue towards a target of 159.10.
The technical picture confirms this scenario: the MACD indicator shows a slowdown in histogram decline, indicating strengthening bullish pressure. A key condition for the upward movement will be a breakout above the upper boundary of the downward channel with price consolidation above 157.45.
The alternative scenario will be activated if the lower boundary of the channel is broken with consolidation below the 156.25 level, which may trigger renewed bearish momentum and further decline in USDJPY quotes.
GBPUSD forecast
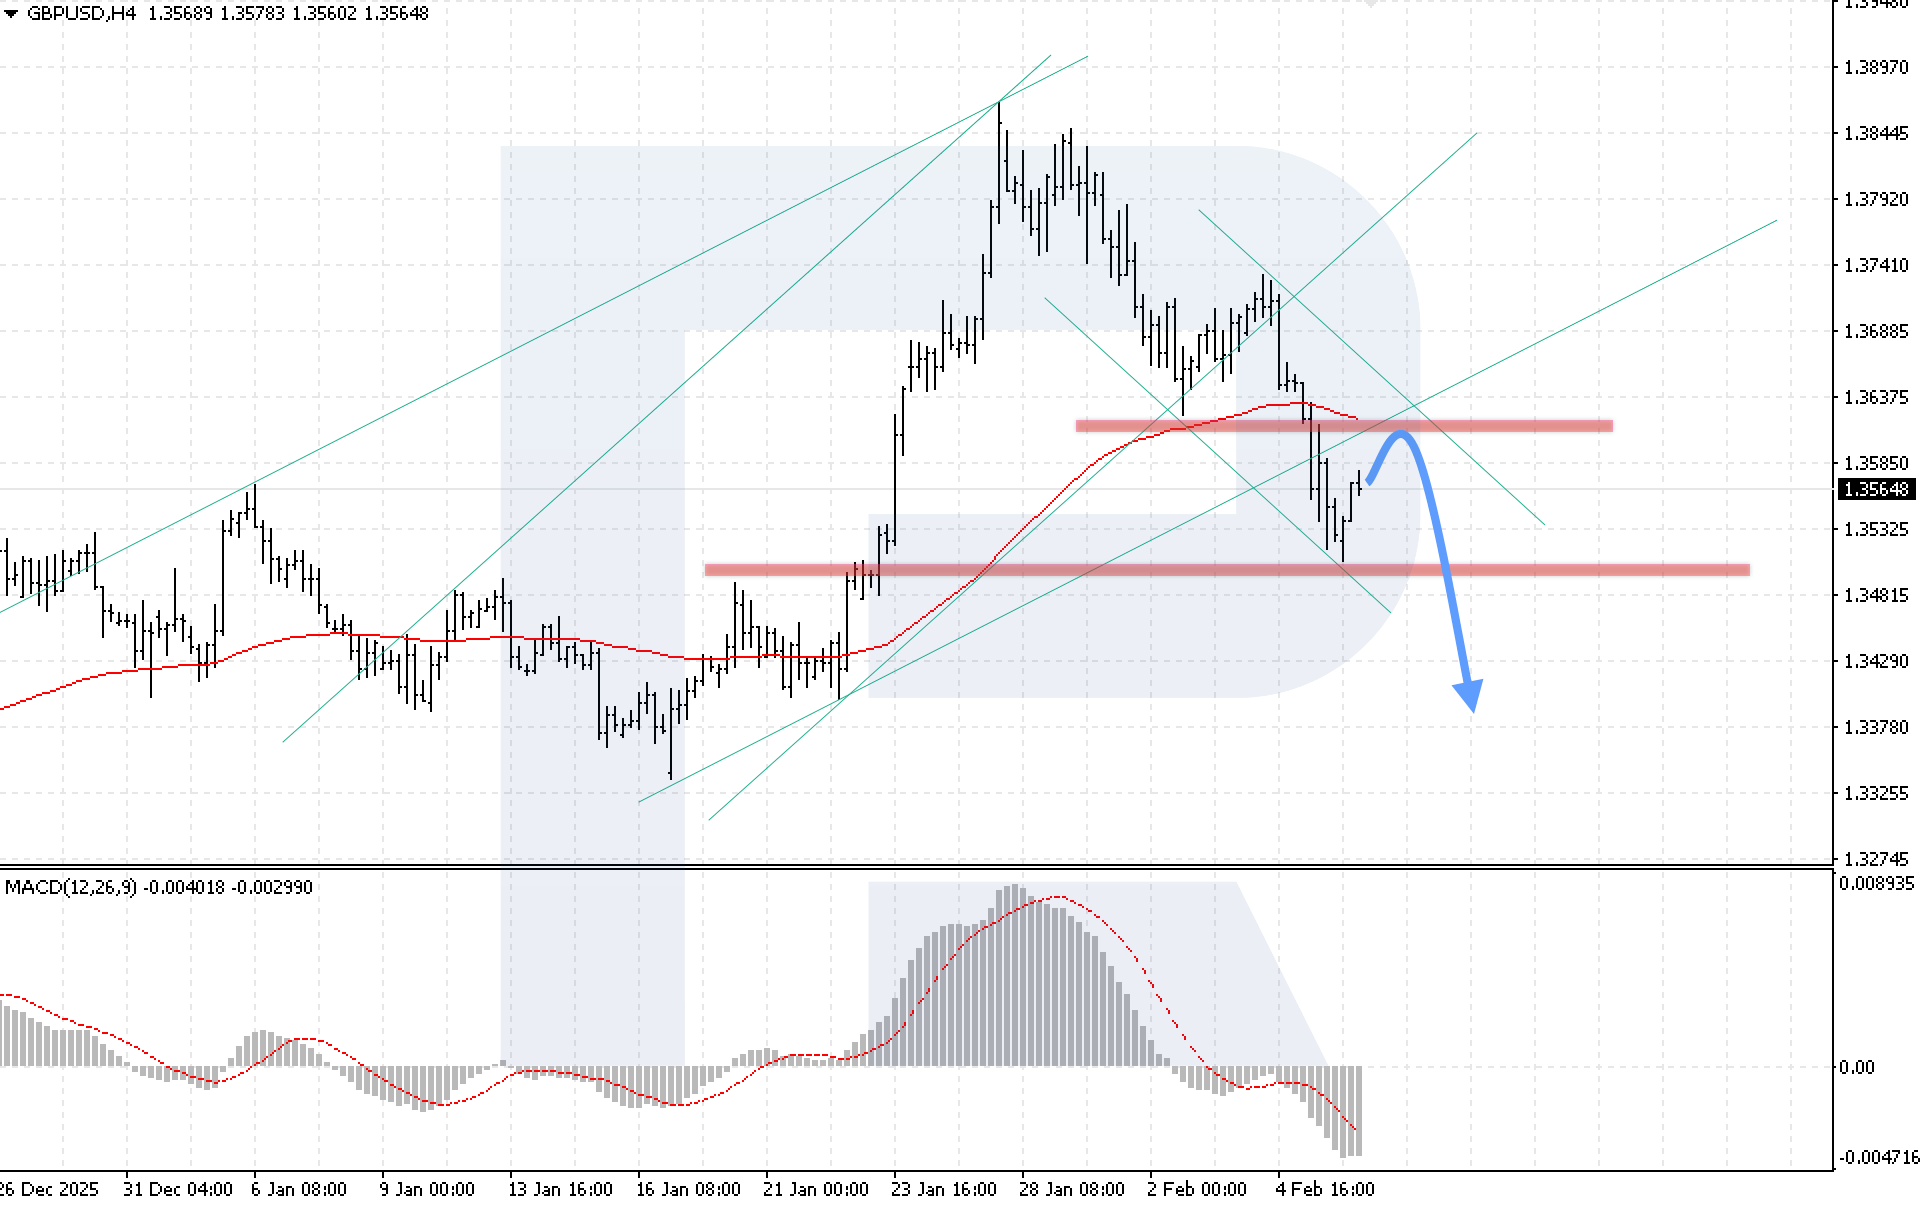
On the GBPUSD H4 chart, prices continue to decline after breaking below the lower boundary of the bullish channel. The nearest support level is located at 1.3500. Today, 6 February 2026, the pair could continue to decline towards the 1.3395 level after rebounding from the lower boundary of the current channel.
The technical picture confirms this scenario: the MACD indicator shows a decline, indicating persistent selling pressure. A key condition for the downward movement will be price consolidation below the 1.3535 level.
The alternative scenario will be activated if the price breaks above the 1.3635 resistance level, potentially opening the way for a return to the bullish channel and resumed growth.
AUDUSD forecast
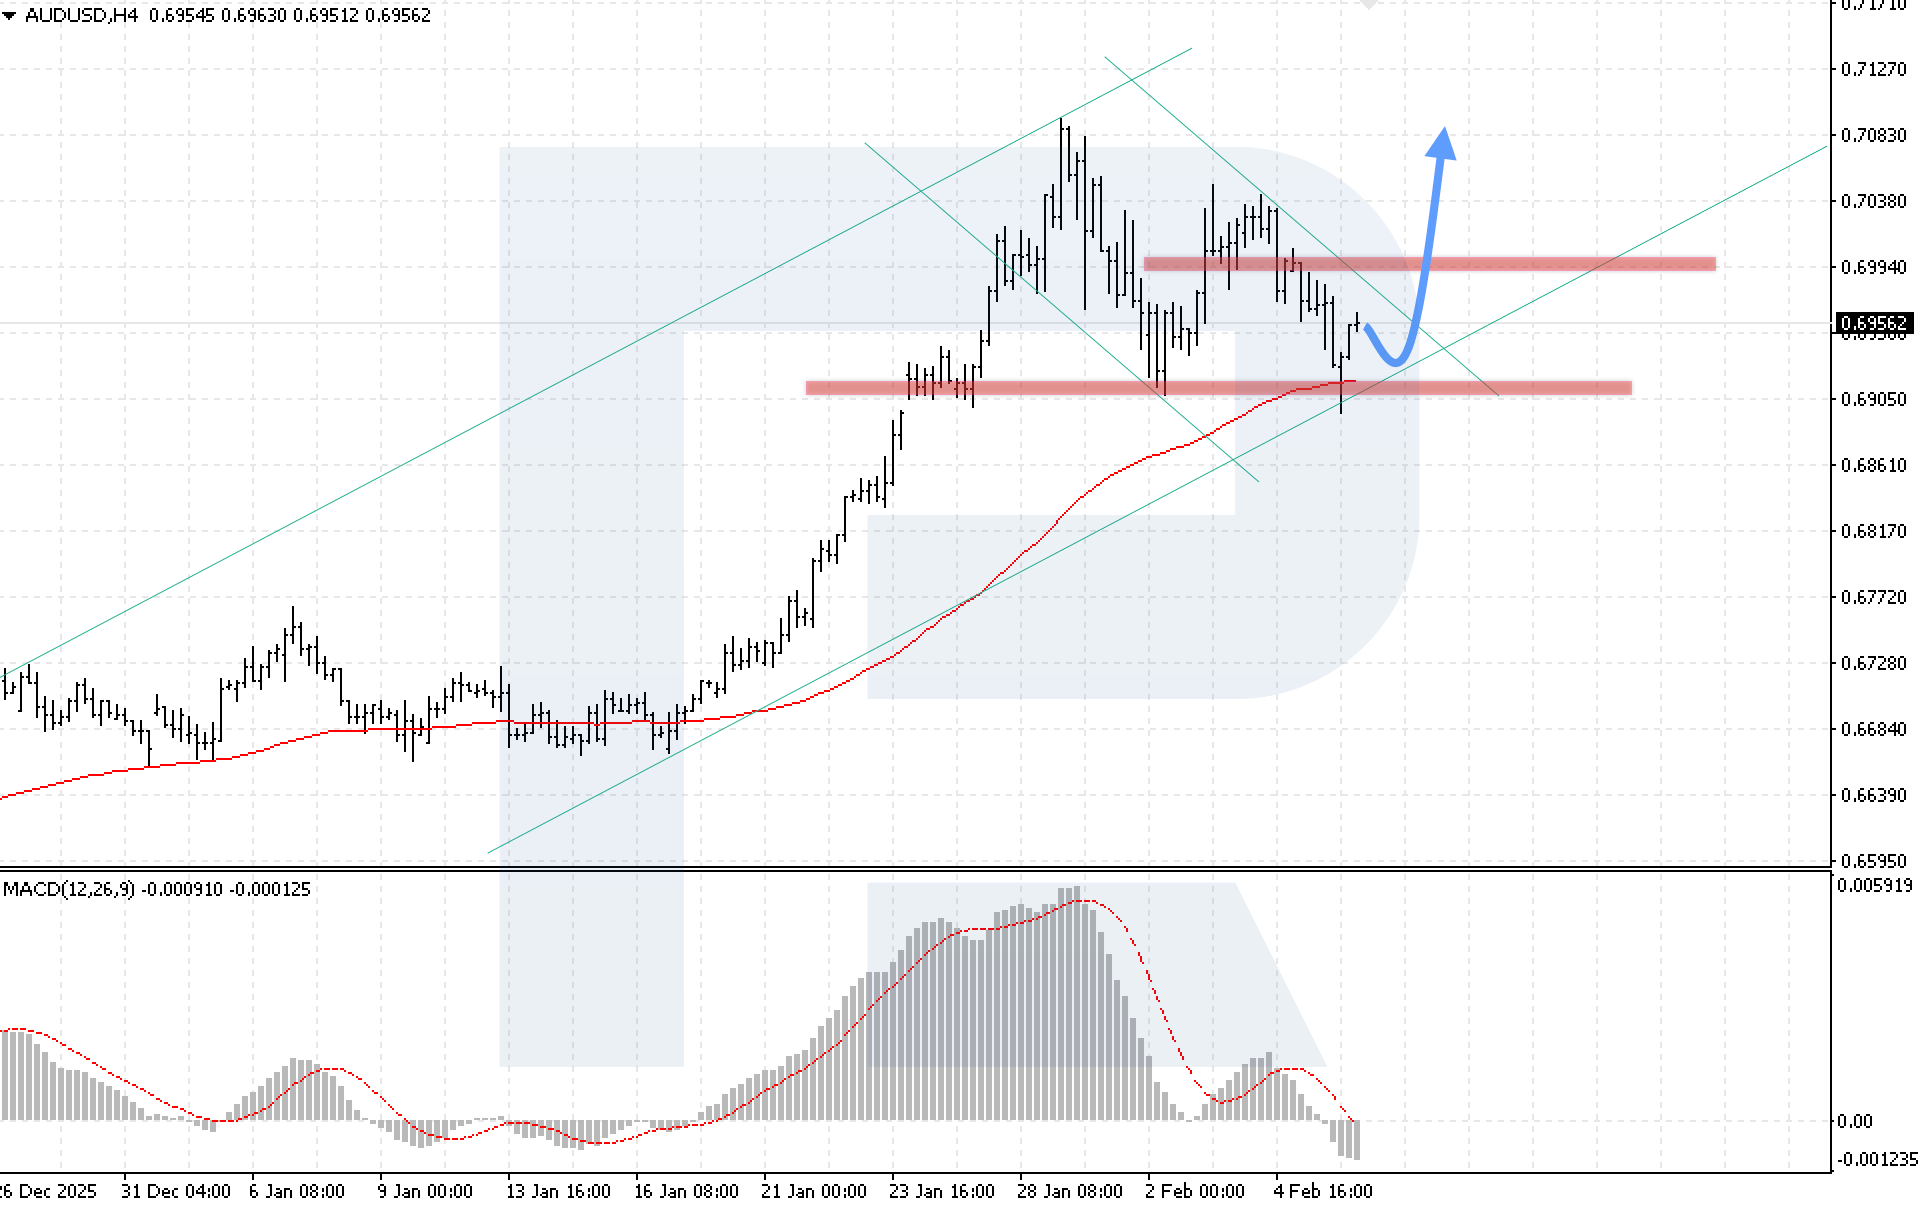
On the AUDUSD H4 chart, the market is rising after rebounding from the EMA-85. Prices have tested the 0.6905 support level for the third time, while the nearest resistance is located at 0.6995. Today, 6 February 2026, the bullish wave will likely continue, with a target at 0.7085.
The technical picture confirms this scenario: the MACD indicator shows a slowdown in histogram decline, indicating the completion of the downward movement. A key condition for the bullish scenario will be price consolidation above the 0.6985 level, which will confirm a breakout above the upper boundary of the bearish channel.
The alternative scenario will be activated if the price breaks below the channel’s lower boundary and consolidates below 0.6885, signalling renewed downward momentum in the AUDUSD pair.
USDCAD forecast
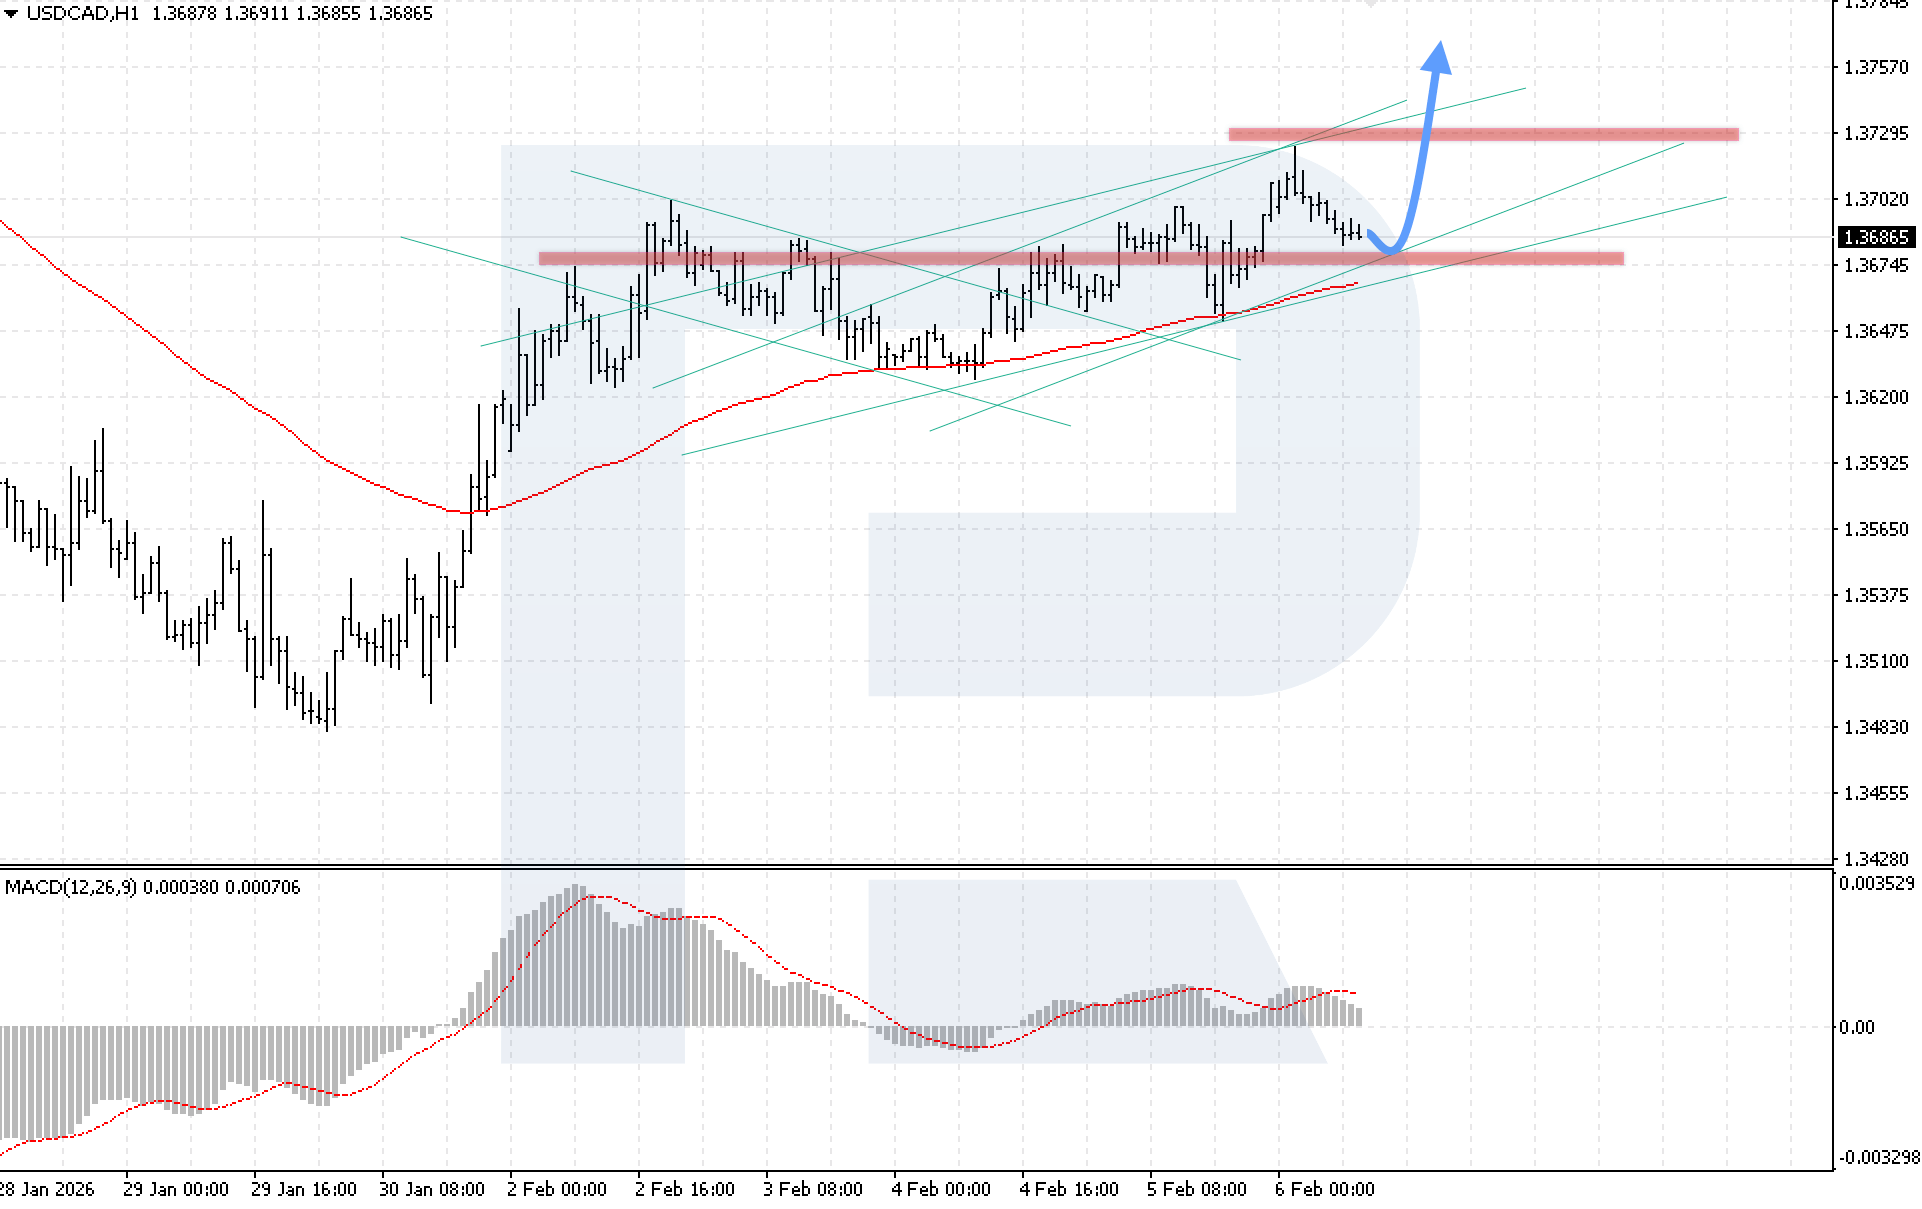
On the USDCAD H1 chart, the market continues its upward movement as buyers have broken above the EMA-85. The nearest resistance level is located at 1.3725. Today, 6 February 2026, the pair could continue its upward trajectory after rebounding from the 1.3675 support level, with a target at 1.3760.
The technical picture confirms the bullish scenario: the MACD indicator shows a slowdown in histogram decline, indicating weakening selling pressure. A key condition for continued upward movement will be price consolidation above the local resistance at 1.3705, which will confirm bullish strength.
The alternative scenario will be activated if the price breaks below the lower boundary of the bullish reversal channel and consolidates below 1.3665, signalling renewed downward momentum in the USDCAD pair.
XAUUSD forecast
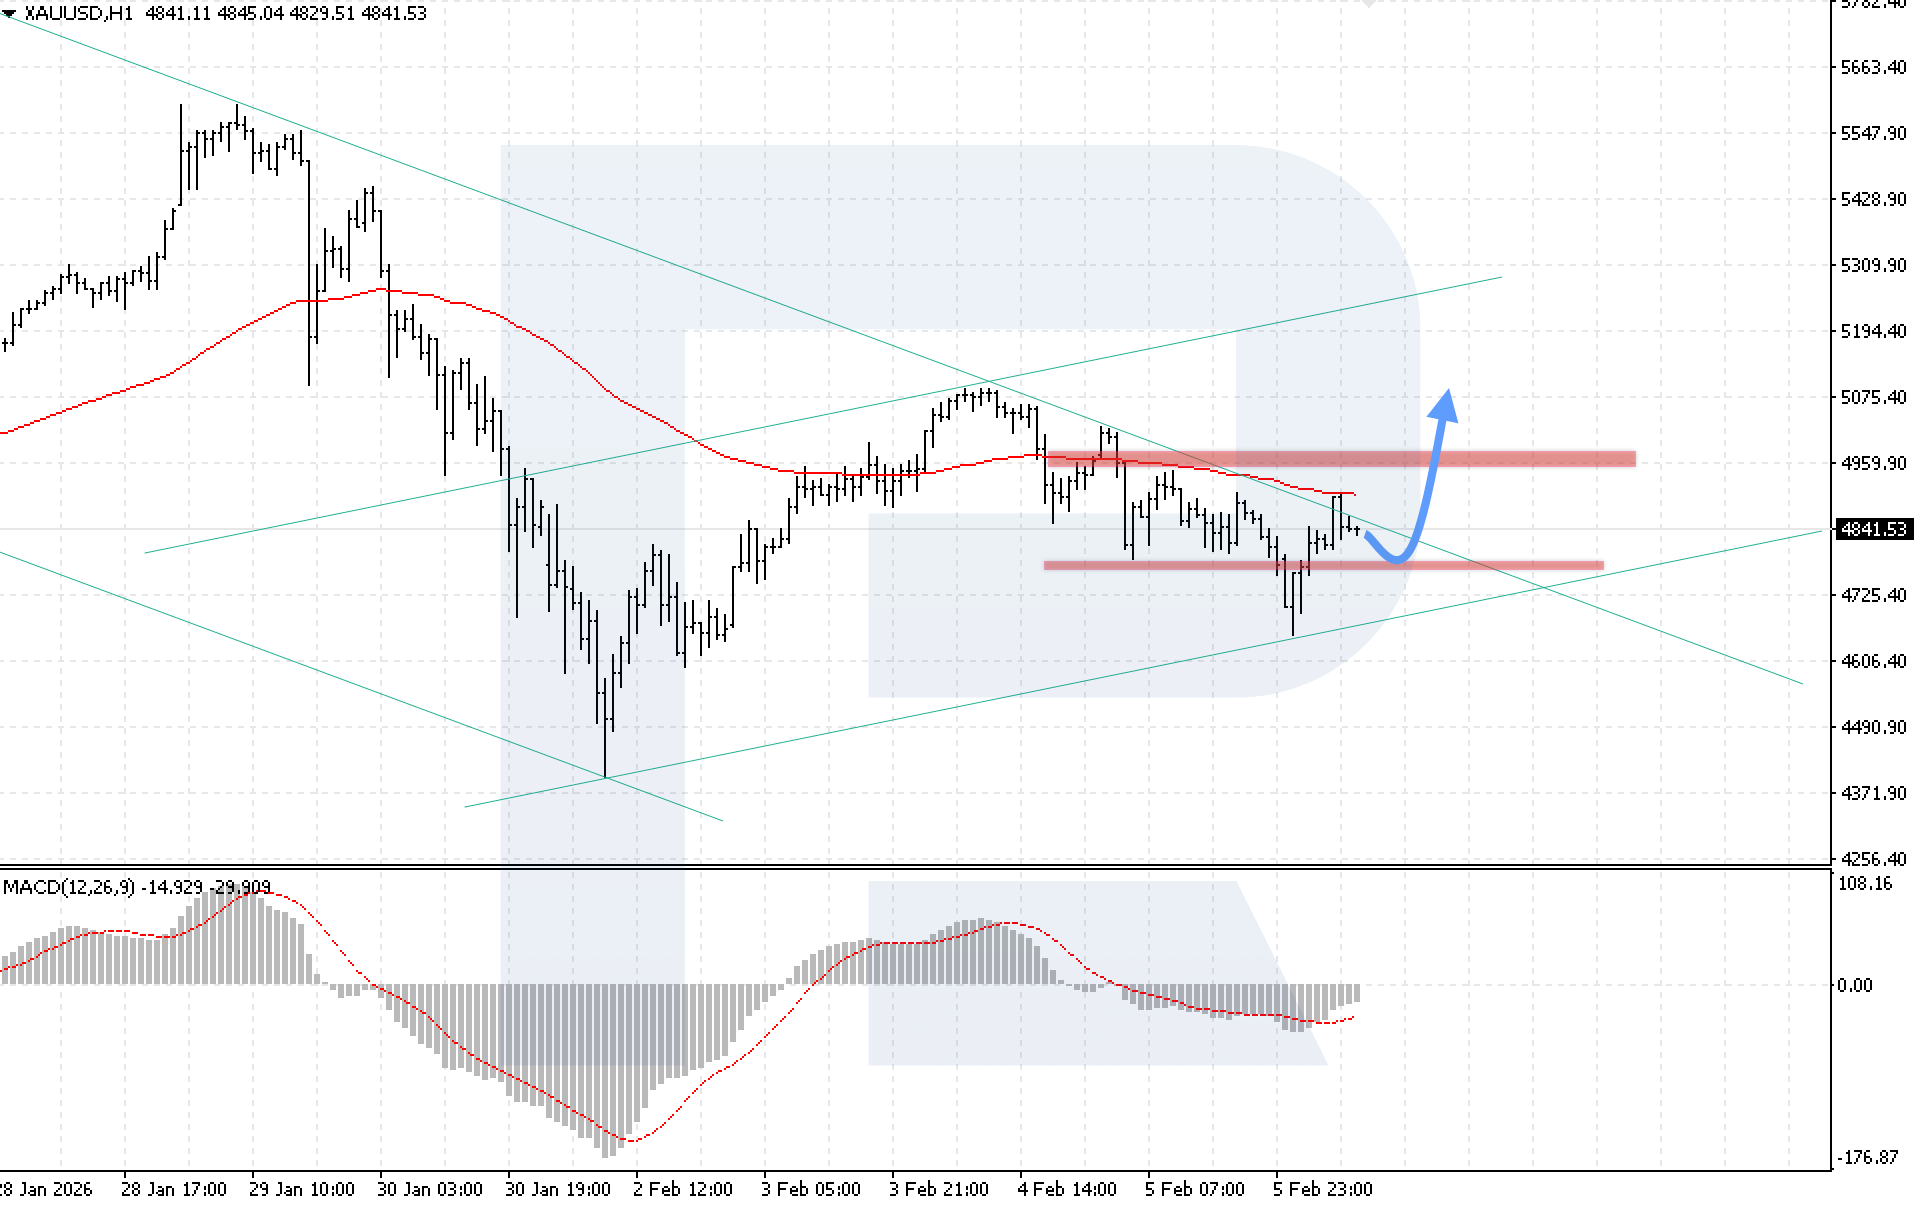
On the XAUUSD H1 chart, the market is in a correction phase, with sellers holding prices below the EMA-85, indicating persistent bearish pressure. The nearest support level is located at 4,815. Today, 6 February 2026, the pair will likely rebound from the key support line before climbing to the 5,075 target.
The technical picture confirms this scenario: the MACD indicator shows histogram growth, reflecting the completion of the correction and a possible resumption of the bullish momentum. A key condition for the bullish scenario will be price consolidation above the 4,965 level, which will confirm buyer strength and indicate a breakout above the upper boundary of the downward channel.
The alternative scenario will be activated if the lower boundary of the channel is broken with consolidation below 4,705, which may push XAUUSD prices lower towards the 4,385 level.
Brent forecast
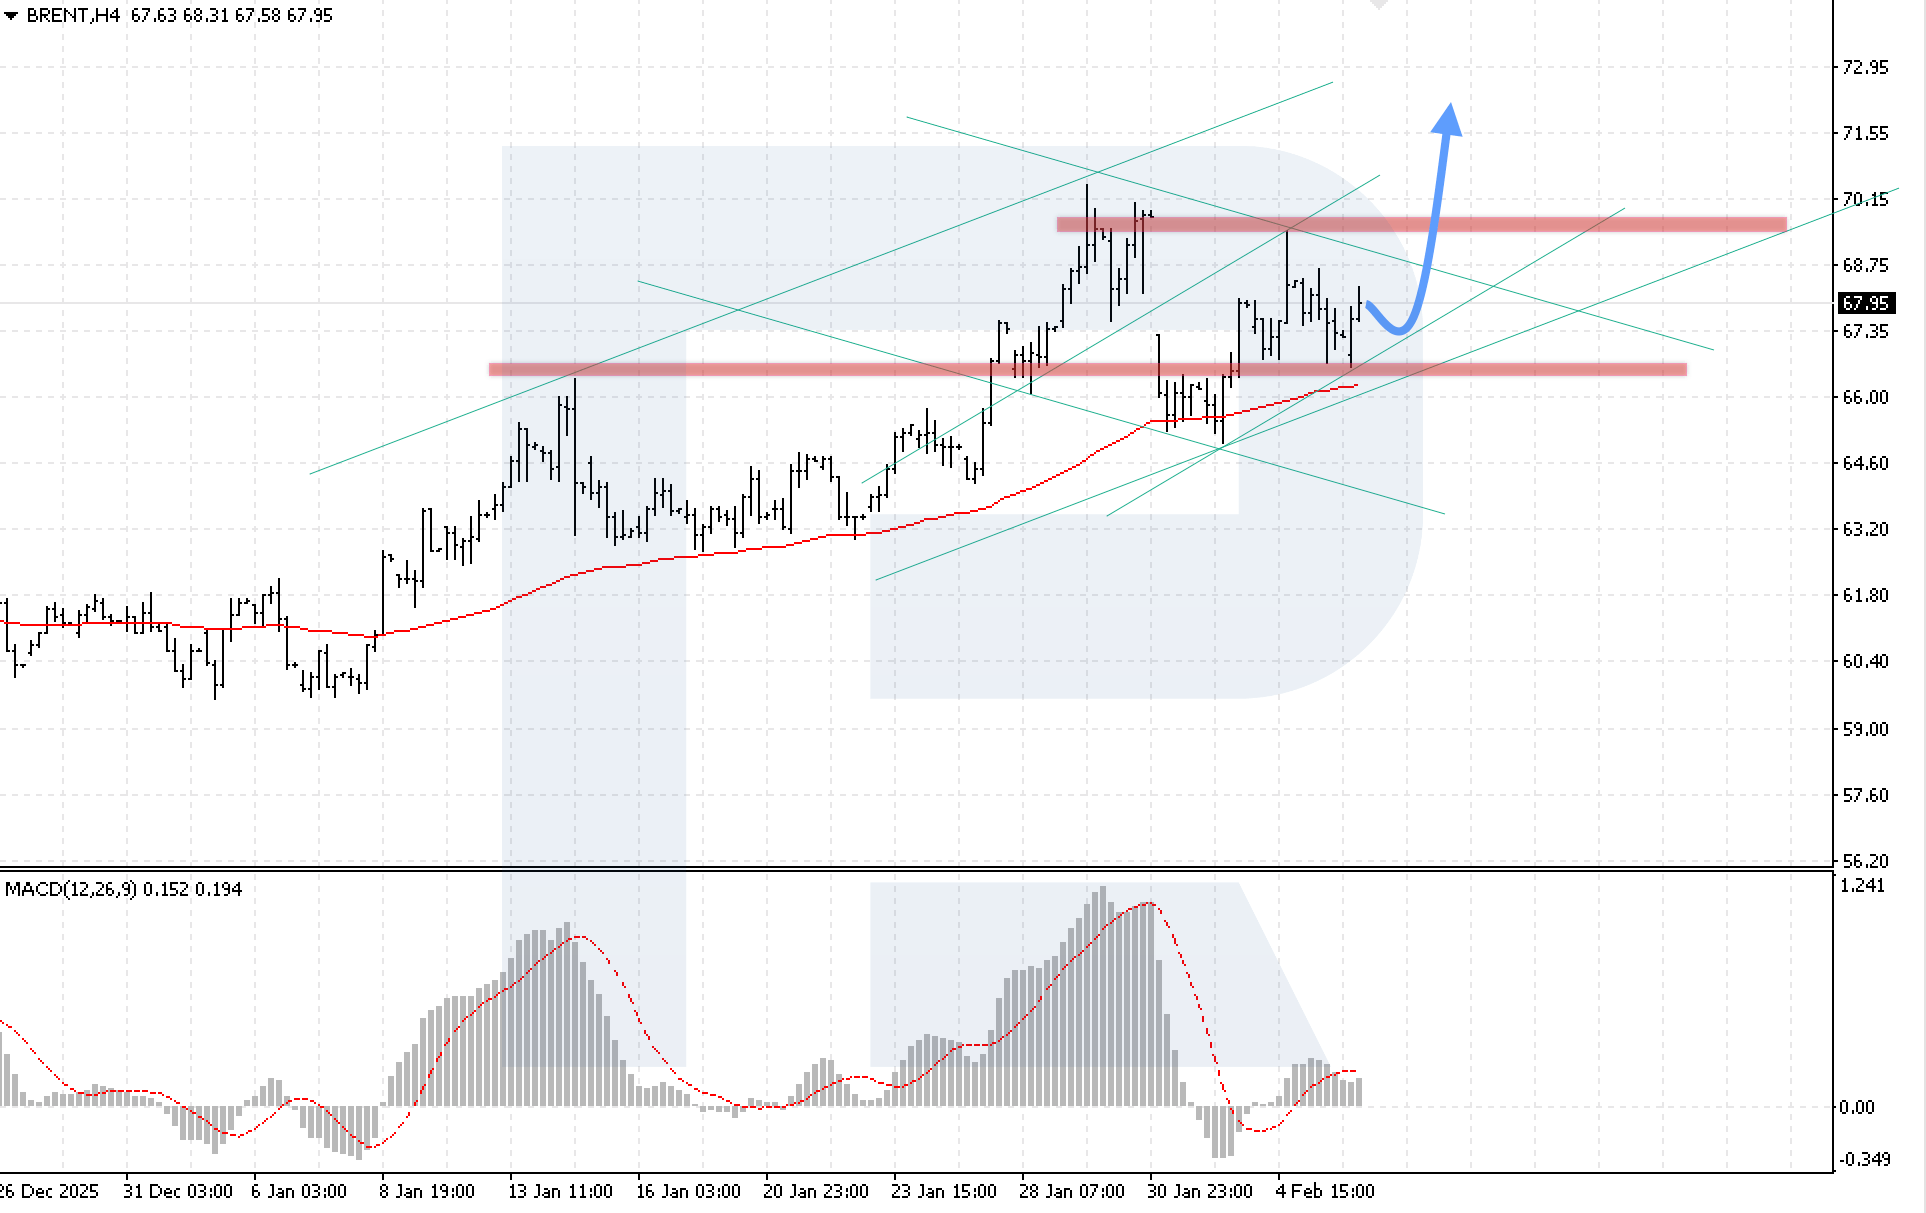
On the Brent H4 chart, the market continues to rise after a correction phase. Buyers are holding prices above the EMA-85, while the nearest support level is located at 66,45. Today, 6 February 2026, the pair could maintain its bullish momentum towards the 71,65 target after rebounding from the lower boundary of the ascending channel.
The technical picture confirms the bullish scenario: the MACD indicator shows histogram growth, reflecting the development of the upward impulse. A key condition for the scenario will be price consolidation above the 69,05 level, which will confirm a breakout above the upper boundary of the bearish correction channel.
The alternative scenario will be activated if the lower boundary of the channel is broken with consolidation below 65,65, which may trigger a corrective wave and a decline in Brent prices.
Editors’ picks
 EURUSD 2026-2027 forecast: key market trends and future predictions
This article provides the EURUSD forecast for 2026 and 2027 and highlights the main factors determining the direction of the pair’s movements. We will apply technical analysis, take into account the opinions of leading experts, large banks, and financial institutions, and study AI-based forecasts. This comprehensive insight into EURUSD predictions should help investors and traders make informed decisions.
 Gold (XAUUSD) forecast 2026 and beyond: expert insights, price predictions, and analysis
Dive deep into the Gold (XAUUSD) price outlook for 2026 and beyond, combining technical analysis, expert forecasts, and key macroeconomic factors. It explains the drivers behind gold’s recent surge, explores potential scenarios including a move toward 4,500 to 5,000 USD per ounce, and highlights why the metal remains a strong hedge during global uncertainty.
Forecasts presented in this section only reflect the author’s private opinion and should not be considered as guidance for trading. RoboForex bears no responsibility for trading results based on trading recommendations described in these analytical reviews.