Daily technical analysis and forecast for 13 February 2026
Here is a detailed daily technical analysis and forecast for EURUSD, USDJPY, GBPUSD, AUDUSD, USDCAD, XAUUSD, and Brent for 13 February 2026.
EURUSD forecast
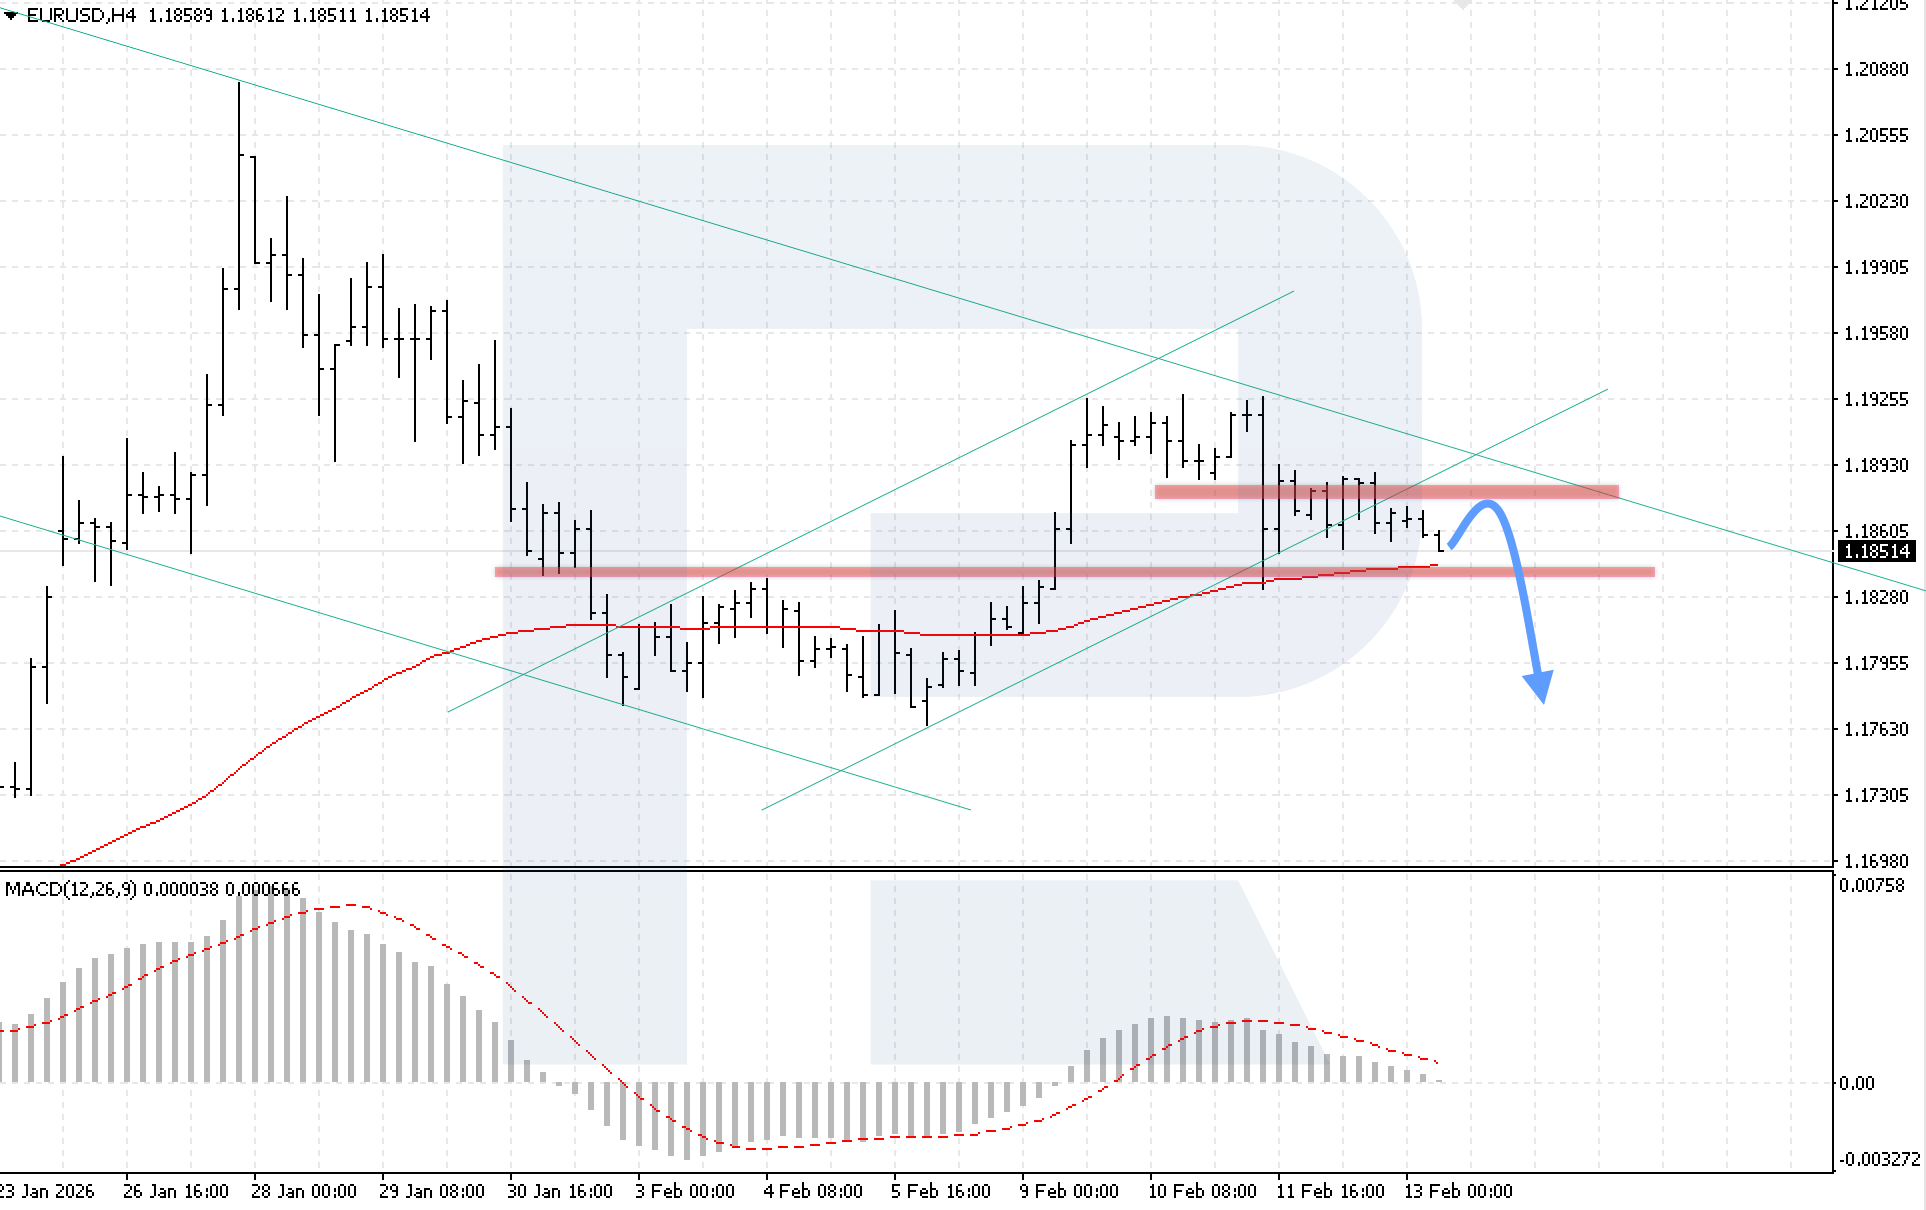
On the H4 chart of the EURUSD currency pair, the market has entered a correction phase. Quotes have moved beyond the bullish channel; however, buyers continue to hold the price above the EMA-85, restraining a deeper downward movement. Today, 13 February 2026, the baseline scenario remains a rebound from the local resistance level at 1.1885, followed by a decline towards 1.1775.
The technical picture confirms this scenario. The MACD indicator shows further histogram decline, and it may cross the zero line shortly, strengthening the bearish signal. The key condition for continued decline will be firm consolidation below 1.1835.
The alternative scenario will activate if the price rises above 1.1905. A breakout above the upper boundary of the descending channel will indicate easing selling pressure and open the potential for growth towards 1.1975.
USDJPY forecast
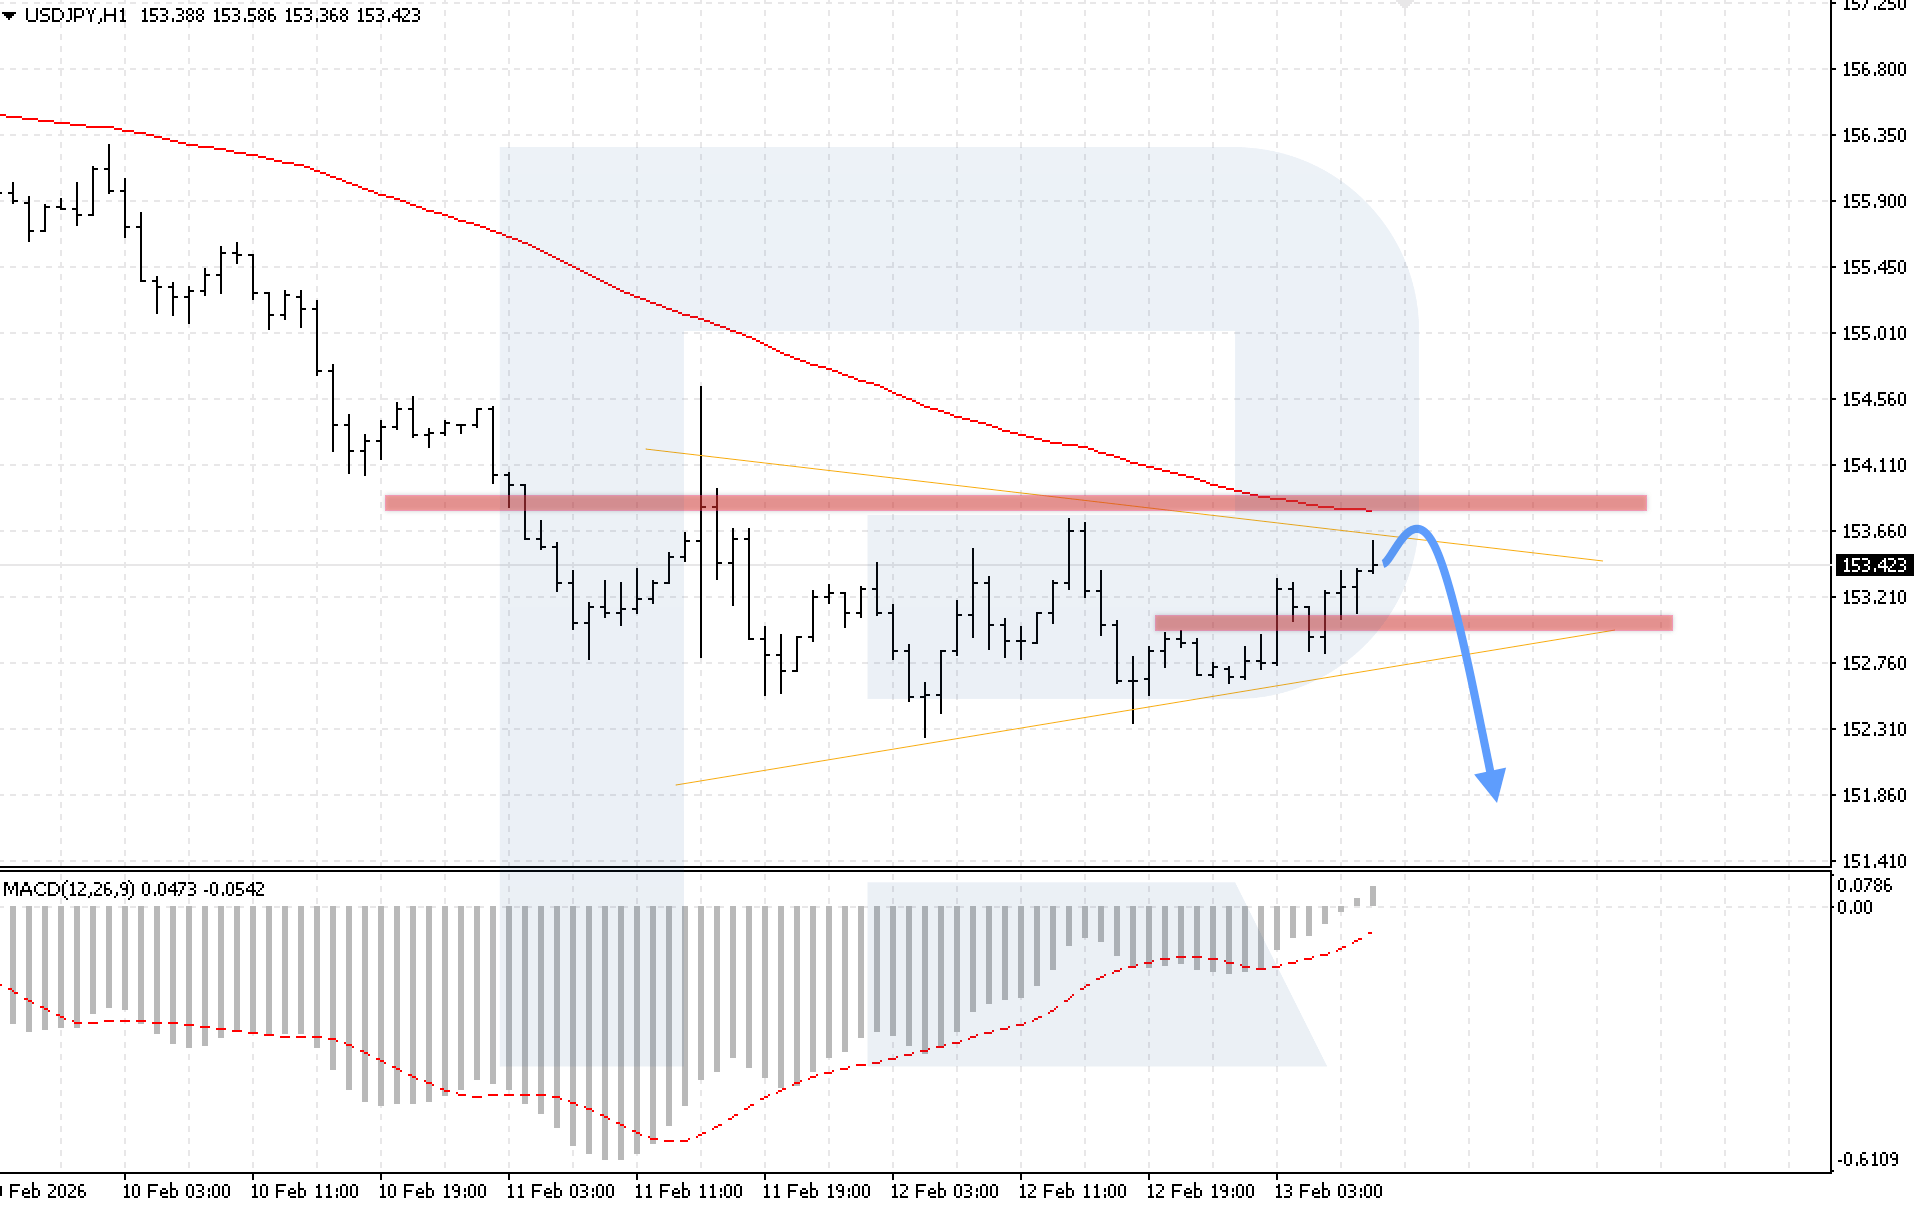
On the H1 chart of the USDJPY currency pair, the market is developing a correction within a Triangle pattern. Sellers continue to hold quotes below the EMA-95 for an extended period, indicating sustained bearish pressure. The nearest support zone is located at 153.05. Today, 13 February 2026, the baseline scenario suggests a further decline towards the target of 151.85 after a rebound from the upper boundary of the Triangle pattern.
The technical picture confirms this scenario. The MACD indicator shows a slowdown in histogram growth, reinforcing the bearish signal. The key condition for the downward movement will be a breakout below the lower boundary of the pattern, followed by consolidation below 152.65.
The alternative scenario will activate if the upper boundary of the pattern is broken with consolidation above 153.85. Such a signal will create conditions for renewed growth in the USDJPY pair.
GBPUSD forecast
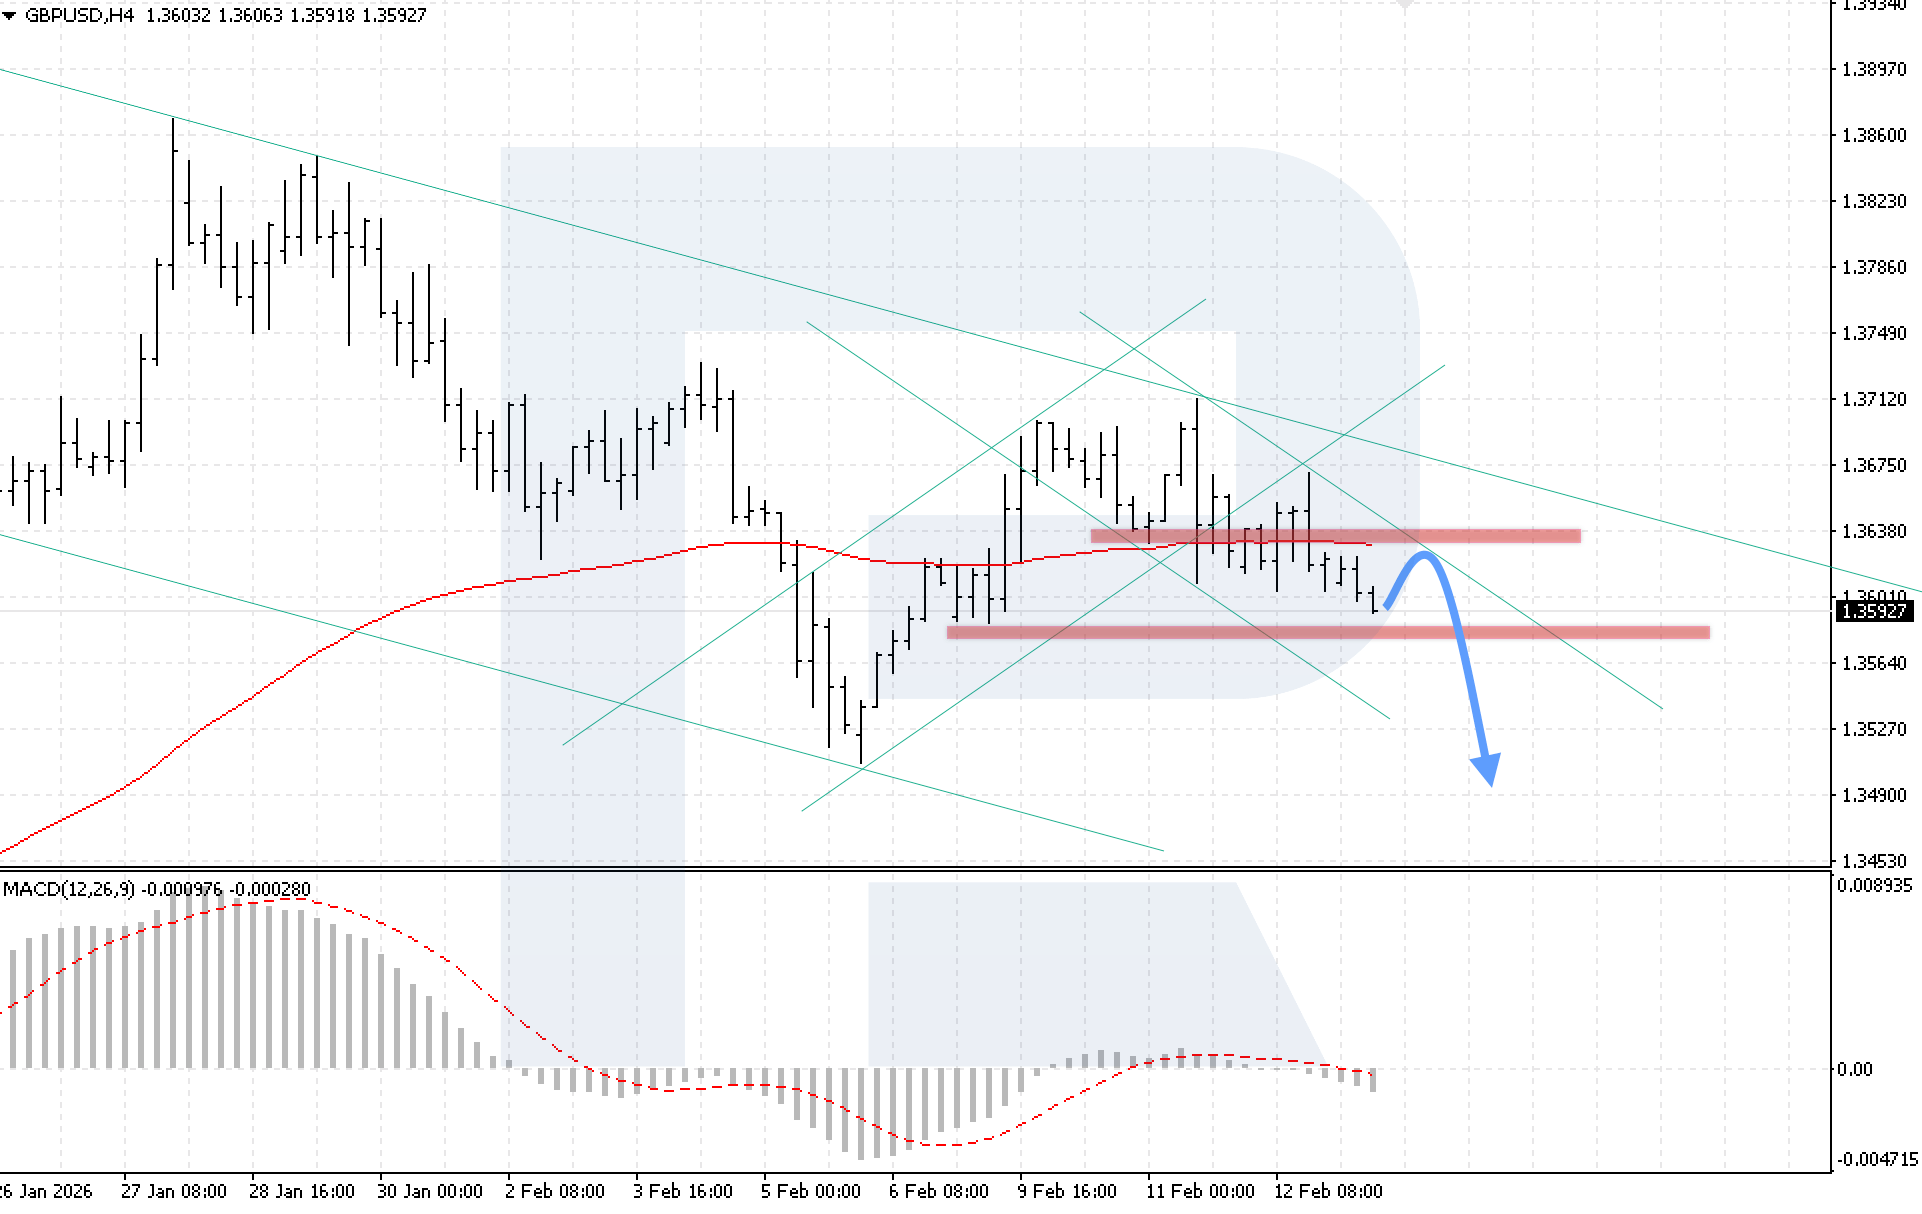
On the H4 chart of the GBPUSD currency pair, quotes continue to move within a downtrend. Sellers have secured the price below the EMA-85, confirming sustained bearish pressure. The nearest resistance level is located at 1.3635. Today, 13 February 2026, the baseline scenario suggests a rebound from the upper boundary of the bearish channel, followed by a decline towards 1.3490.
The technical picture confirms this scenario. The MACD indicator shows a decline after crossing the zero line, reinforcing the bearish signal. The key condition for continued decline will be consolidation below the local support level at 1.3565.
The alternative scenario will activate if the upper boundary of the bearish channel is broken with consolidation above 1.3645. Such a signal will open the potential for renewed growth in the pair.
AUDUSD forecast
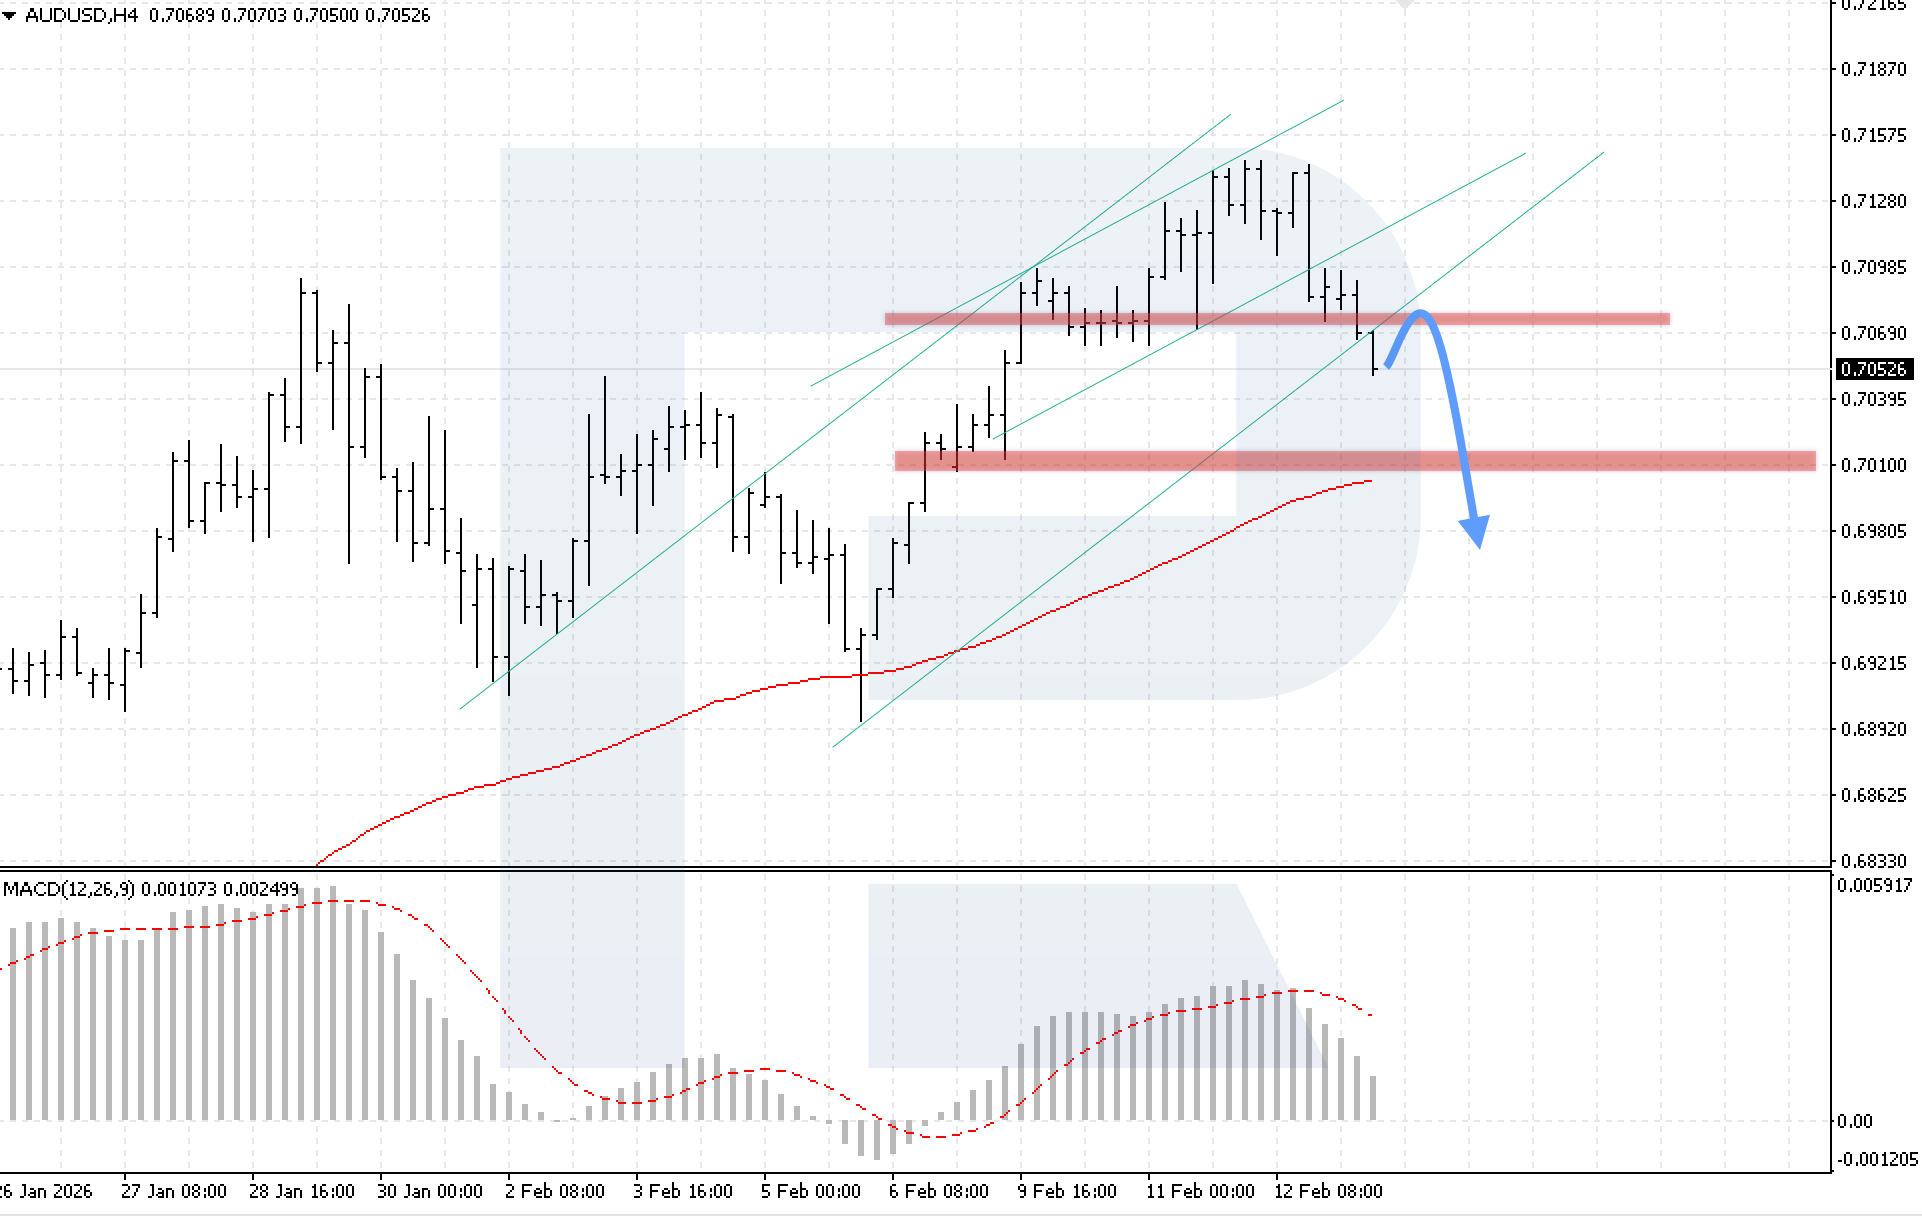
On the H4 chart of the AUDUSD currency pair, the market continues to decline. Sellers have secured positions below the lower boundary of the bullish channel; however, quotes remain above the EMA-85, indicating sustained bullish pressure. Today, 13 February 2026, the base scenario suggests continued downward momentum after a rebound from the broken channel boundary, with a target at 0.6975.
The technical picture confirms this scenario. The MACD indicator shows an active histogram decline, strengthening the bearish signal. The key condition for the downward movement will be consolidation below 0.7035.
The alternative scenario will activate if quotes rise and break above the resistance level with consolidation above 0.7105. Such a signal will indicate a potential return of the price into the bullish channel and open up opportunities for further growth.
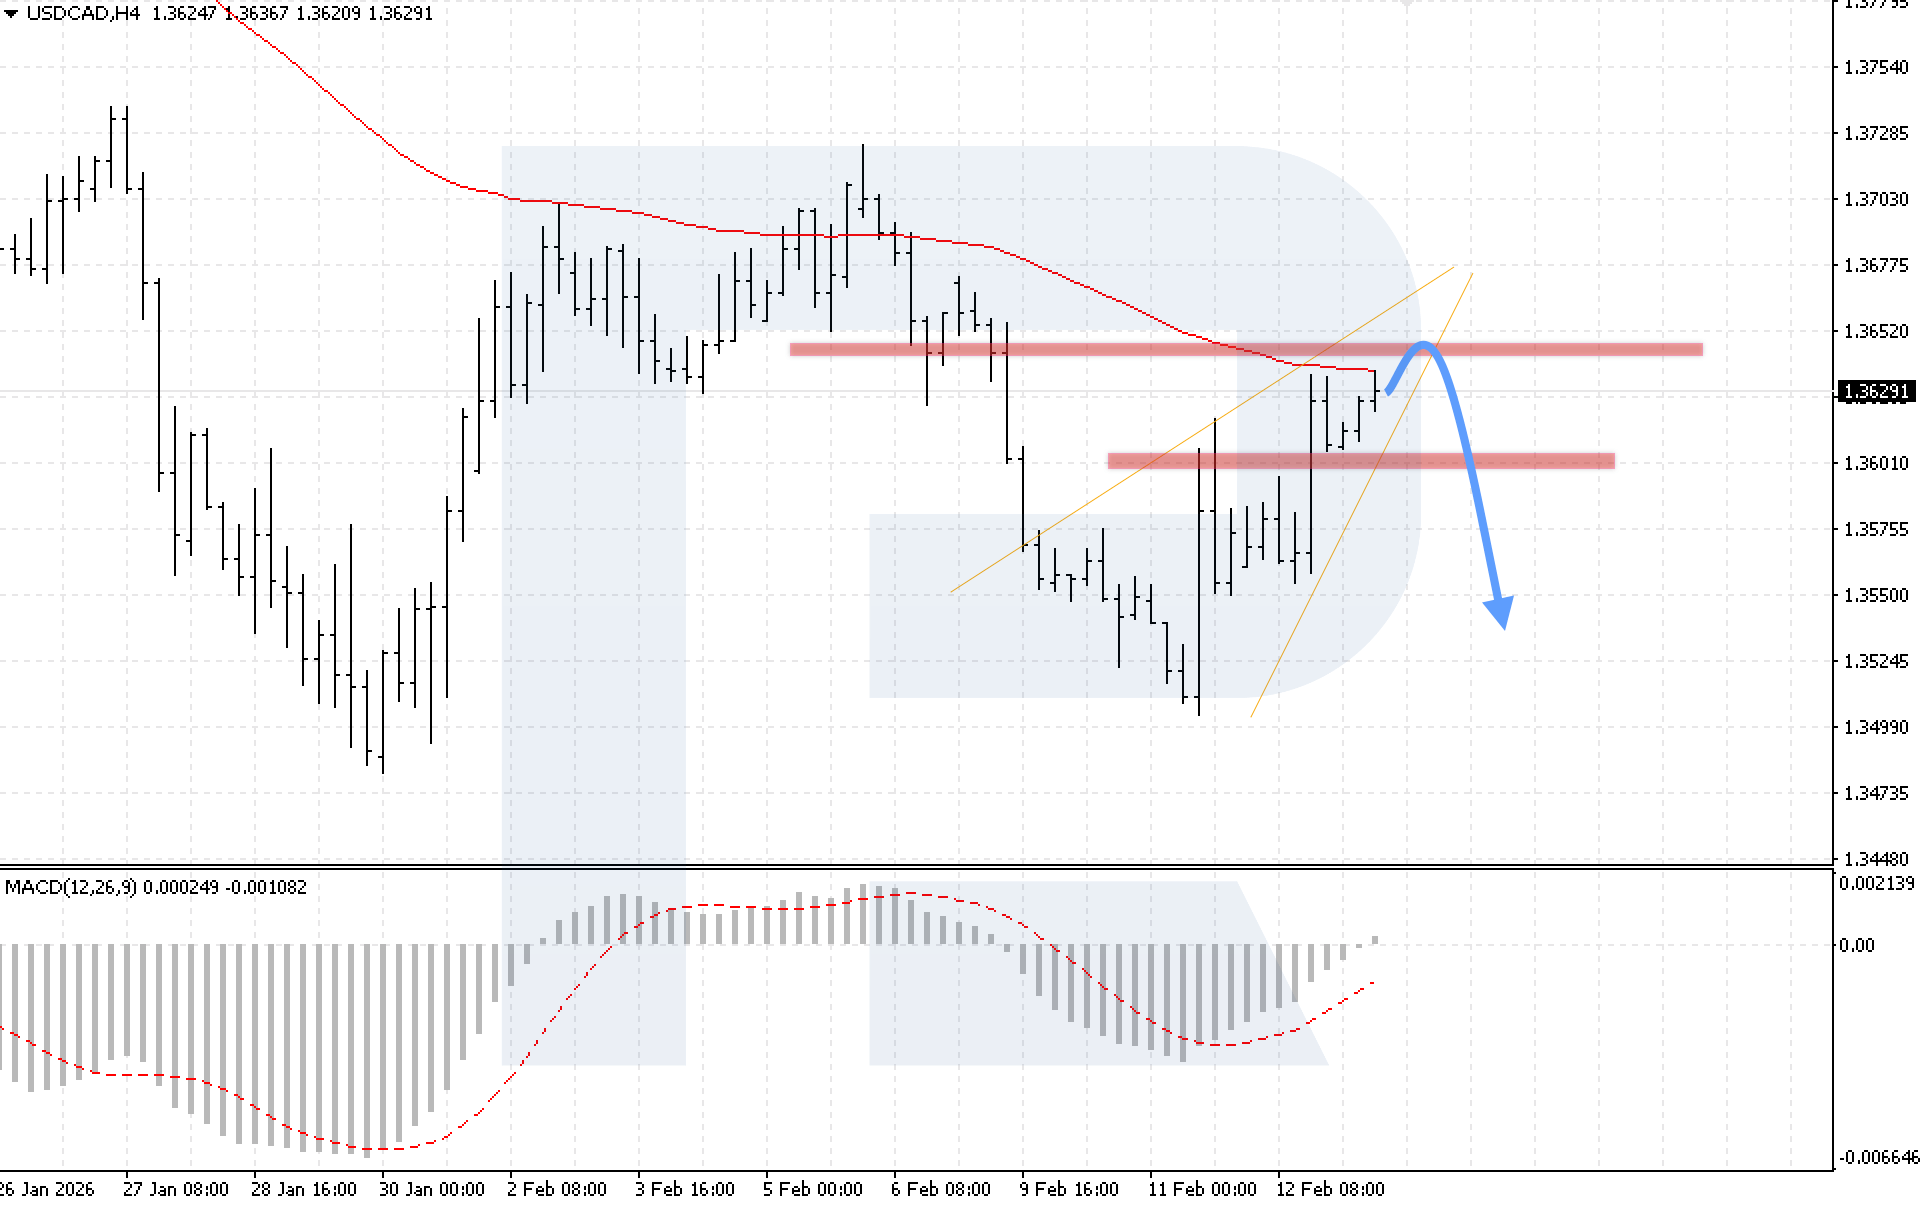
USDCAD forecast
On the H4 chart of the USDCAD currency pair, the market continues to move within a bullish correction, while quotes remain below the EMA-85. There is a risk of forming a Wedge reversal pattern. Today, 13 February 2026, the baseline scenario suggests a decline with a target at 1.3535 after a rebound from the upper boundary of the Wedge pattern.
The technical picture confirms the bearish scenario. The MACD indicator shows slowing growth, and another rebound from the 1.3625 resistance level will strengthen selling pressure. The key condition for the downward movement will be consolidation below 1.3600. This will confirm a breakout below the lower boundary of the Wedge pattern and open the way towards downside targets.
The alternative scenario will activate if the upper boundary of the pattern is broken with consolidation above 1.3665. Such a signal will indicate renewed growth in the USDCAD currency pair.
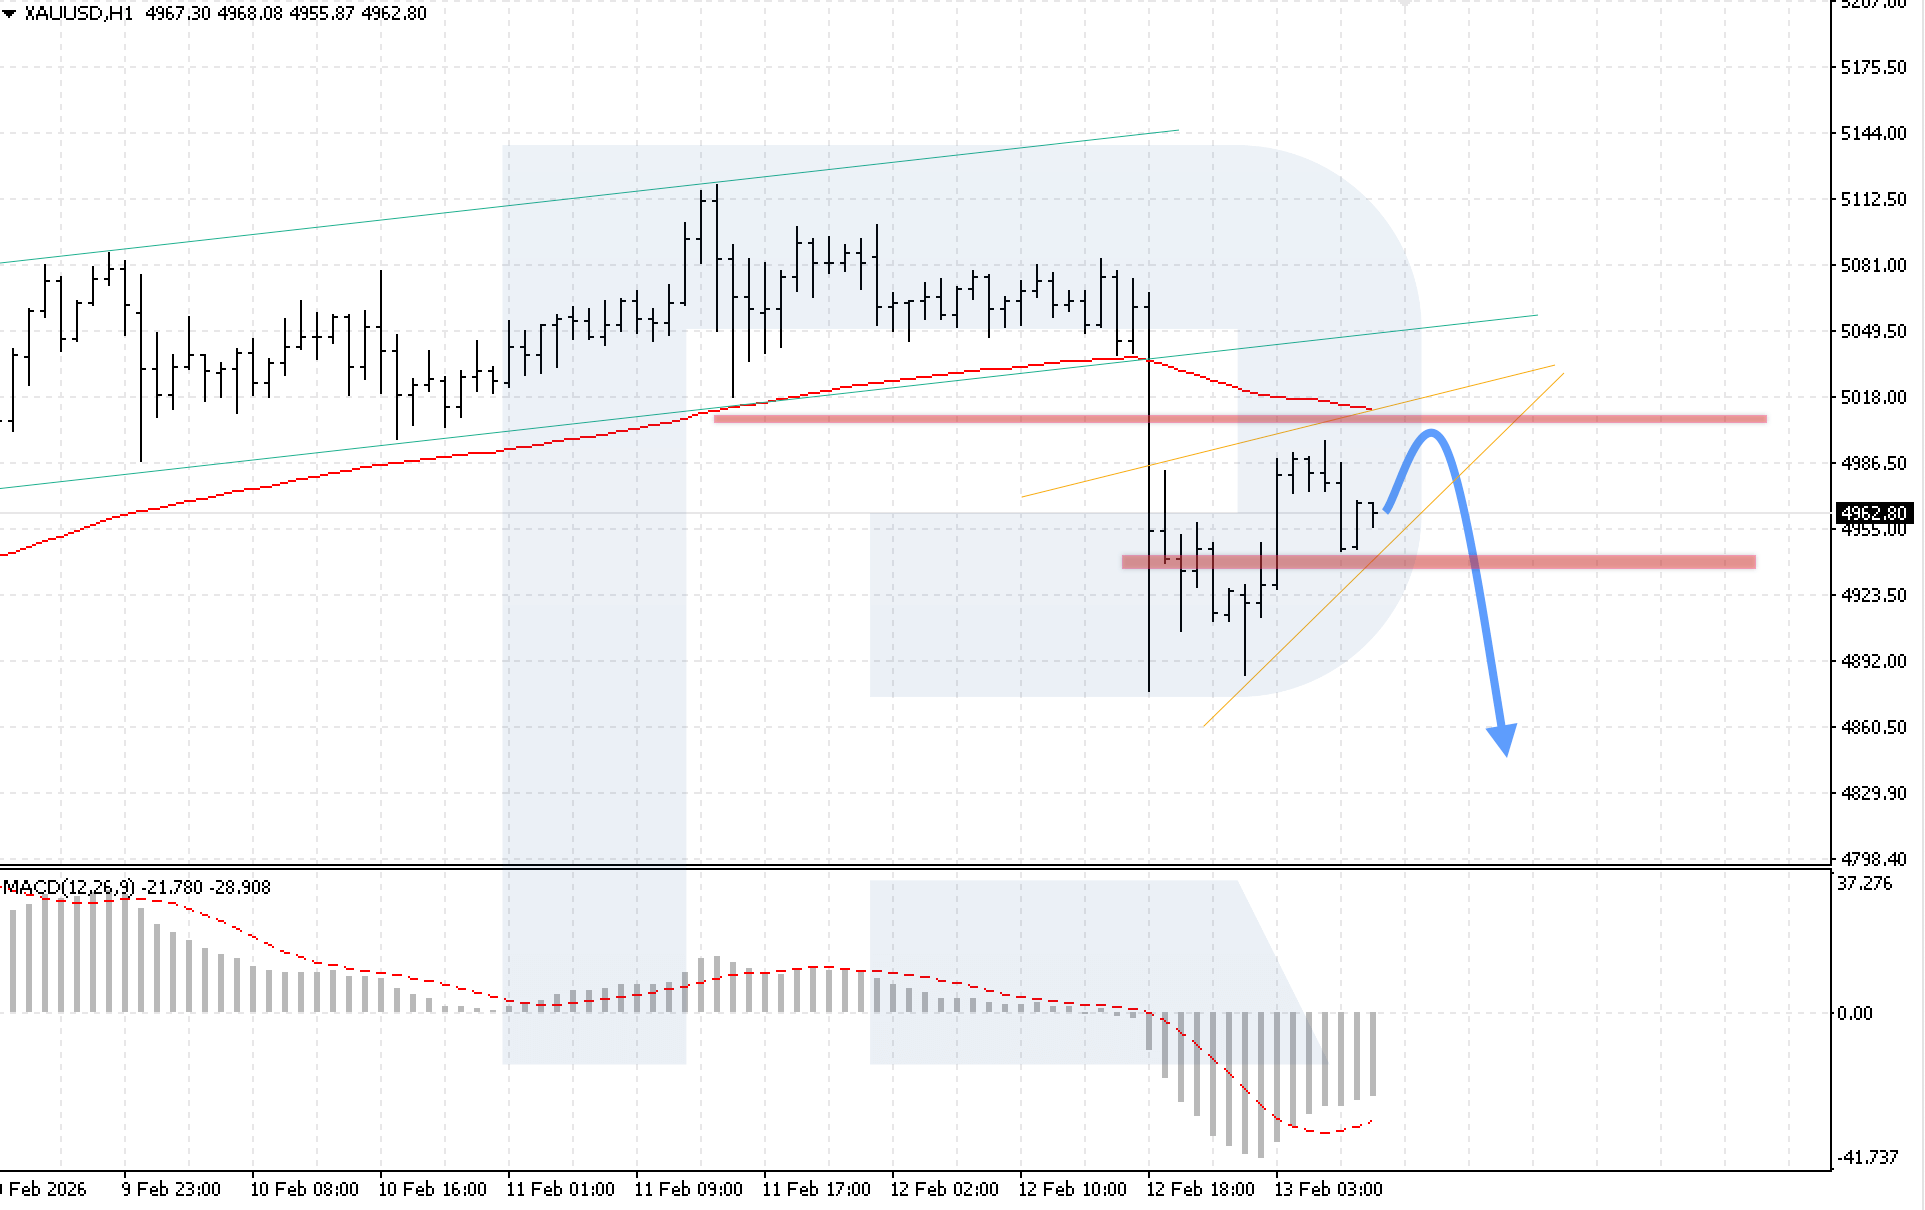
XAUUSD forecast
On the XAUUSD H1 chart, the market has secured positions below the lower boundary of the consolidation channel. Today, 13 February 2026, the baseline scenario suggests a continued decline after a rebound from the local resistance level, with a target at 4,860.
The technical picture confirms this scenario. The MACD indicator shows slowing growth, while sellers hold the price below the EMA-85, reinforcing the bearish signal. The key condition for the downward movement will be consolidation below 4,935, confirming a breakout below the lower boundary of the Wedge reversal pattern.
The alternative scenario will activate if the resistance level is broken with consolidation above 5,025. Such a signal will indicate the cancellation of the reversal pattern and open the potential for continued growth in XAUUSD quotes.
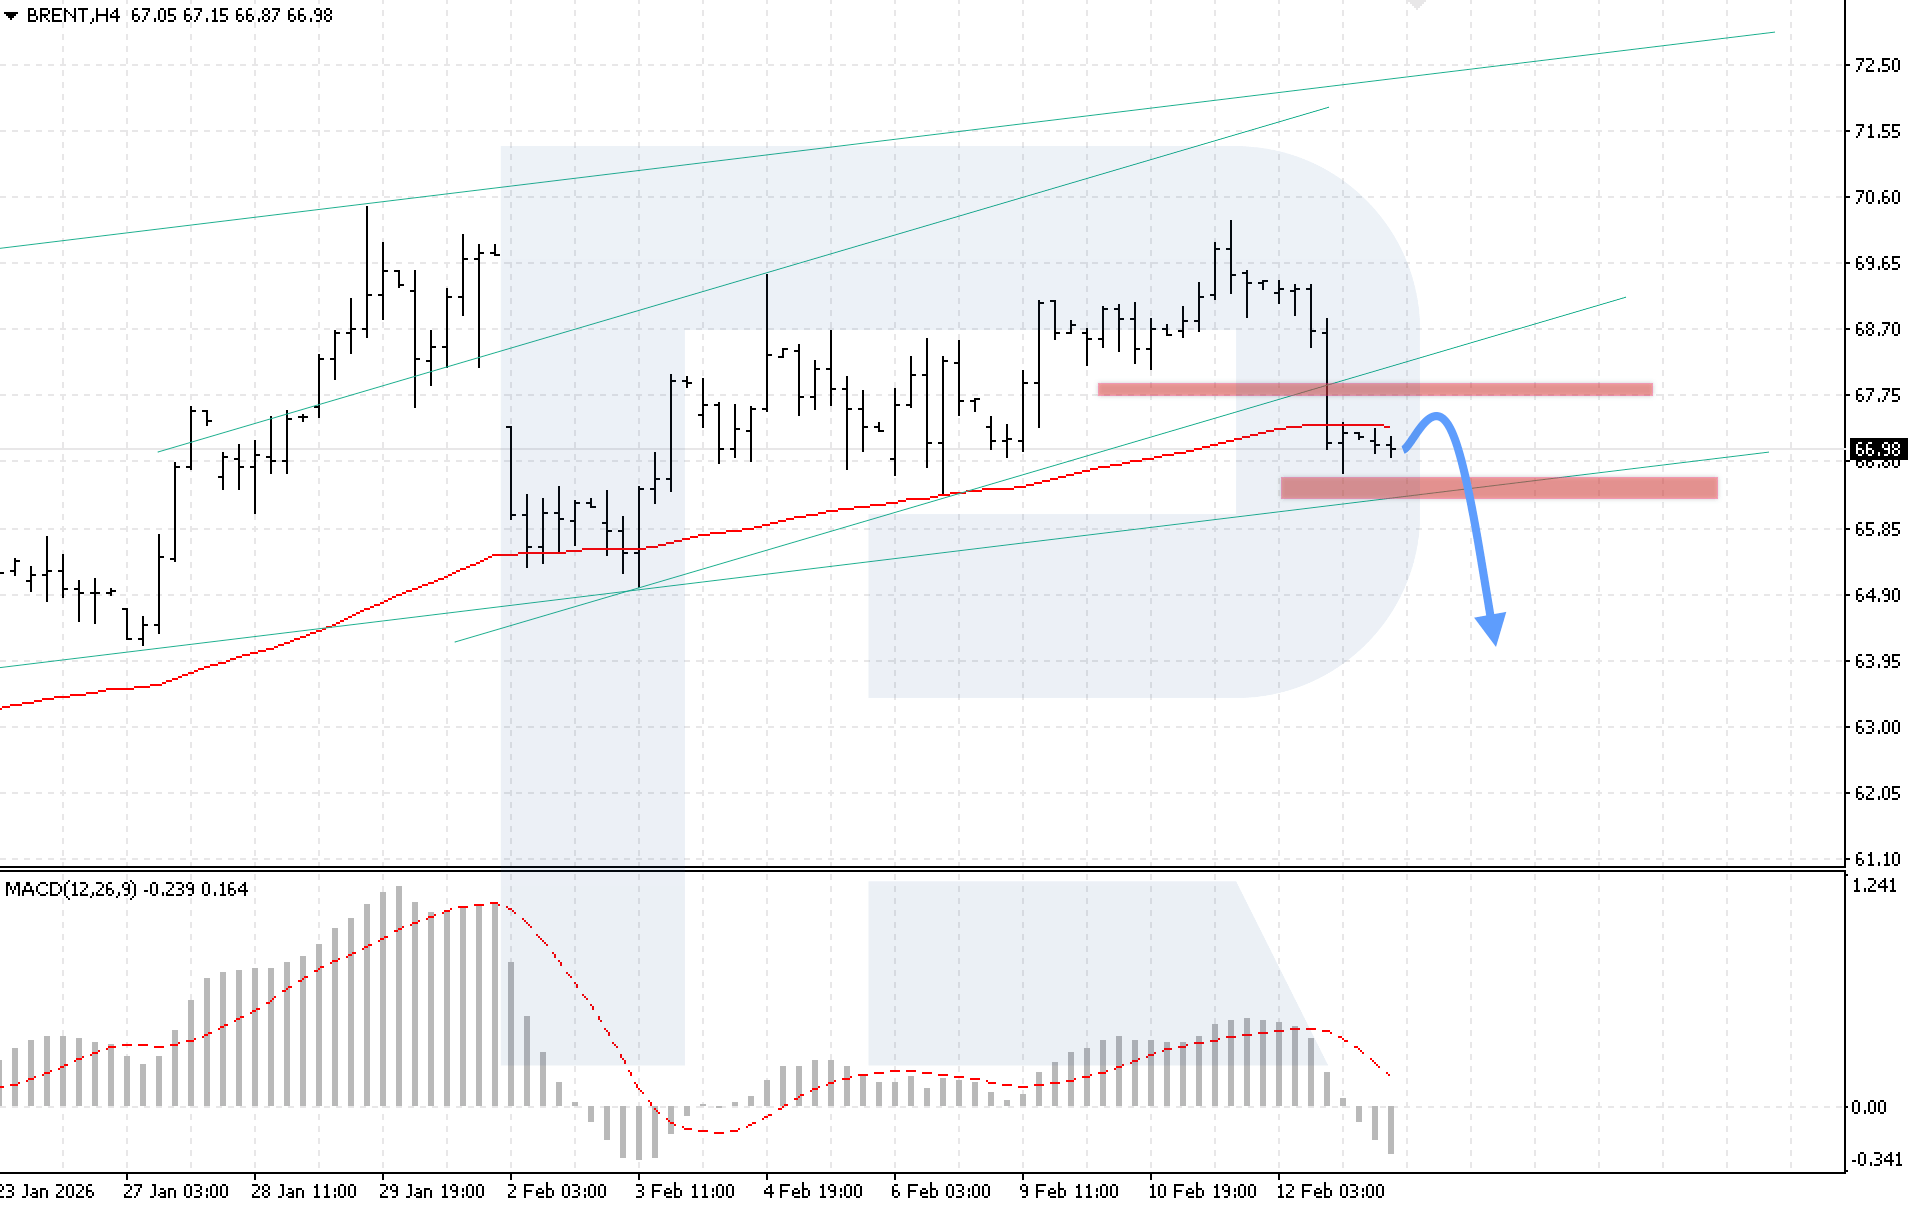
Brent forecast
On the H4 chart of Brent crude oil, the market continues to decline within a bullish channel. Sellers have secured positions below the EMA-85, indicating increasing bearish pressure. Today, 13 February 2026, the baseline scenario suggests a continued decline after a rebound from the EMA-85, with a target at 64.05.
The technical picture confirms the bearish scenario. The MACD indicator shows a declining histogram, strengthening the sell signal. The key condition for the downward movement will be consolidation below 66.10, confirming a breakout of the lower boundary of the bullish channel.
The alternative scenario will activate if the local resistance level is broken with consolidation above 67.75. Such a signal will indicate renewed bullish pressure and open the door for growth in Brent quotes.
Editors’ picks
 EURUSD 2026-2027 forecast: key market trends and future predictions
This article provides the EURUSD forecast for 2026 and 2027 and highlights the main factors determining the direction of the pair’s movements. We will apply technical analysis, take into account the opinions of leading experts, large banks, and financial institutions, and study AI-based forecasts. This comprehensive insight into EURUSD predictions should help investors and traders make informed decisions.
 Gold (XAUUSD) forecast 2026 and beyond: expert insights, price predictions, and analysis
Dive deep into the Gold (XAUUSD) price outlook for 2026 and beyond, combining technical analysis, expert forecasts, and key macroeconomic factors. It explains the drivers behind gold’s recent surge, explores potential scenarios including a move toward 4,500 to 5,000 USD per ounce, and highlights why the metal remains a strong hedge during global uncertainty.
Forecasts presented in this section only reflect the author’s private opinion and should not be considered as guidance for trading. RoboForex bears no responsibility for trading results based on trading recommendations described in these analytical reviews.