Daily technical analysis and forecast for 18 February 2026
Here is a detailed daily technical analysis and forecast for EURUSD, USDJPY, GBPUSD, AUDUSD, USDCAD, XAUUSD, and Brent for 18 February 2026.
EURUSD forecast
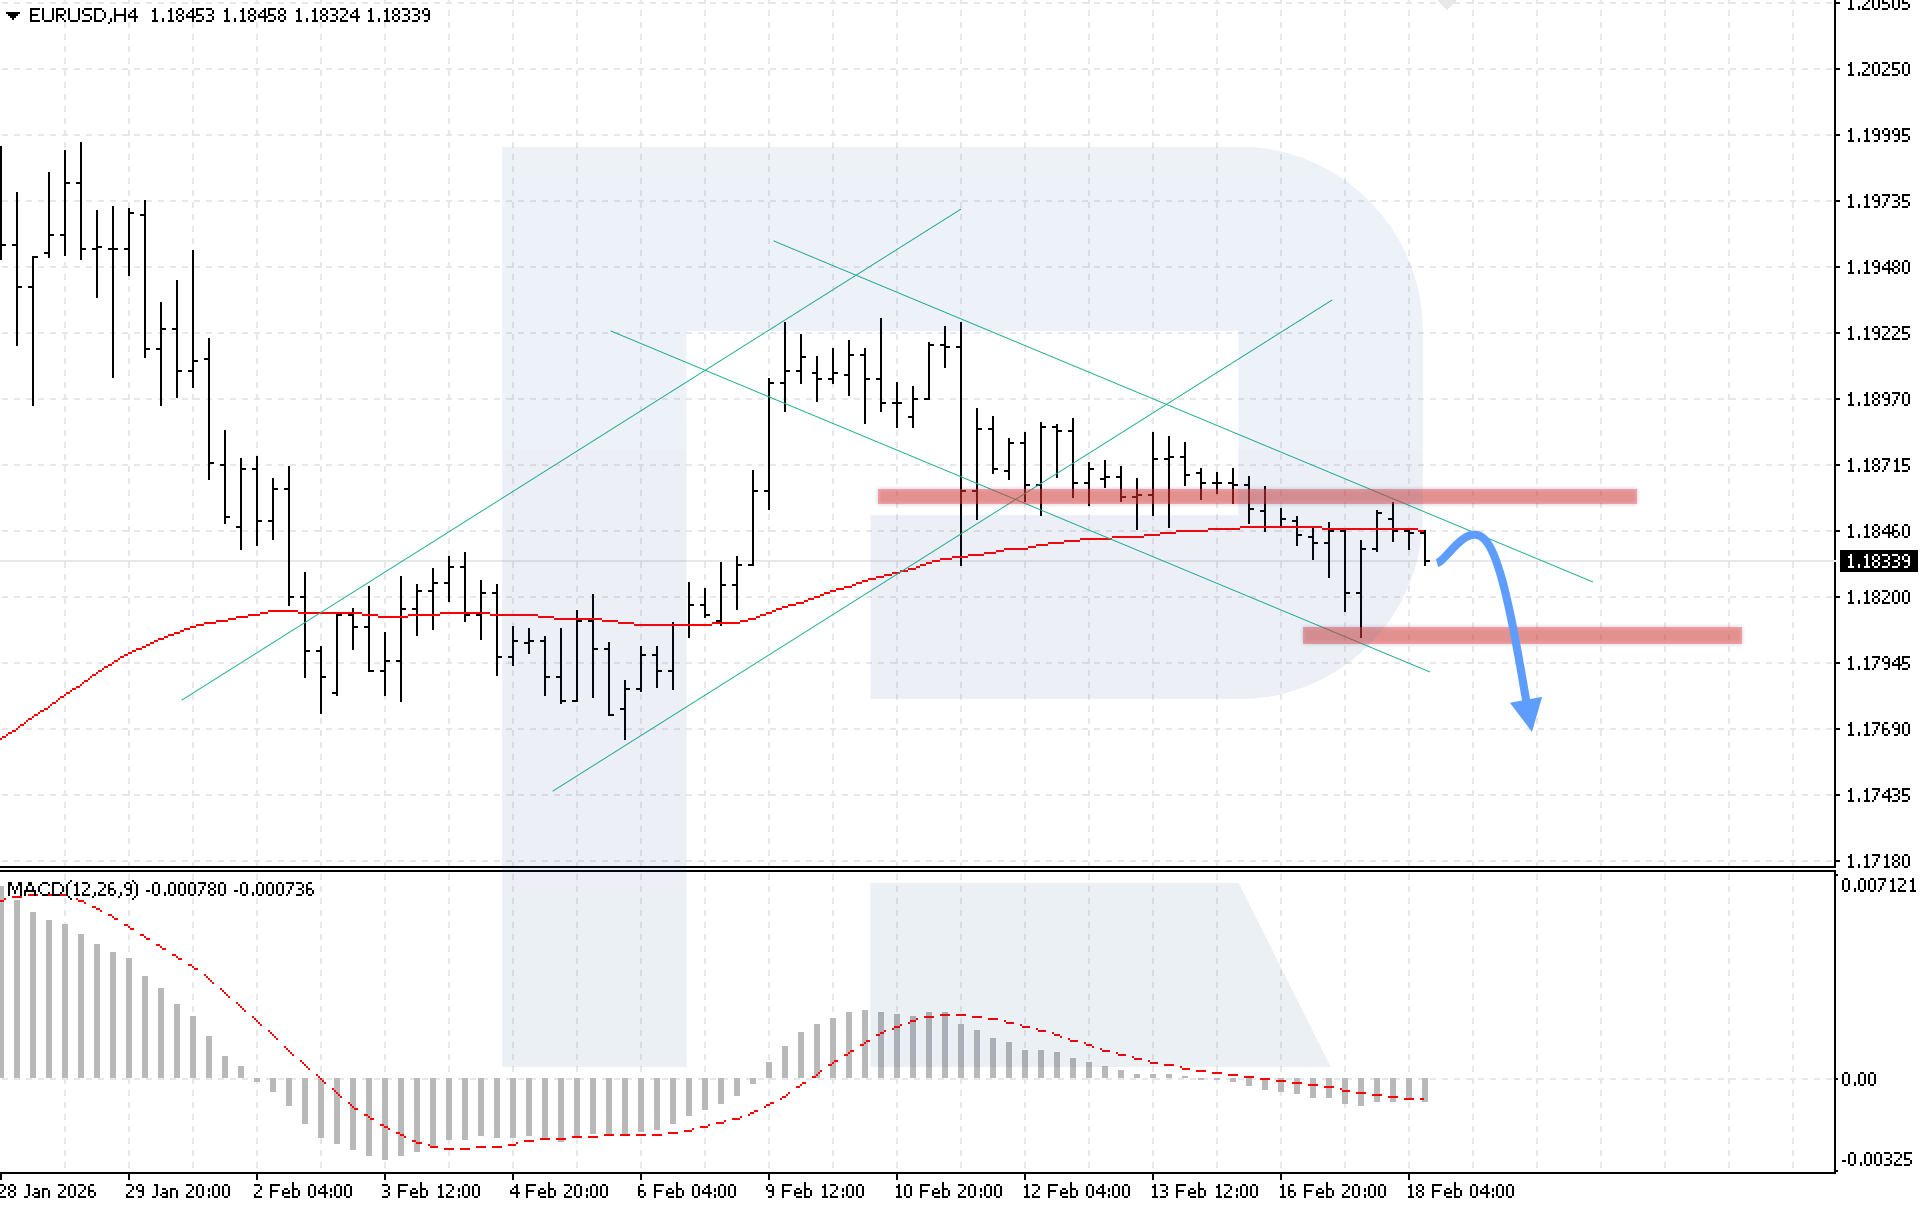
On the H4 chart of the EURUSD currency pair, the market has completed a corrective wave, and quotes have broken below the EMA-85, indicating renewed pressure from sellers. Today, 18 February 2026, the baseline scenario remains a rebound from the upper boundary of the descending channel at 1.1845, followed by a decline towards 1.1765.
The technical picture confirms this scenario. MACD shows a decline in the histogram after a brief slowdown in the downward movement. The key condition for continued decline will be firm consolidation below the local support level of 1.1820.
The alternative scenario will activate if the price rises above 1.1875. In this case, a breakout above the upper boundary of the descending channel will strengthen bullish pressure and open the way for a deeper corrective move.
USDJPY forecast
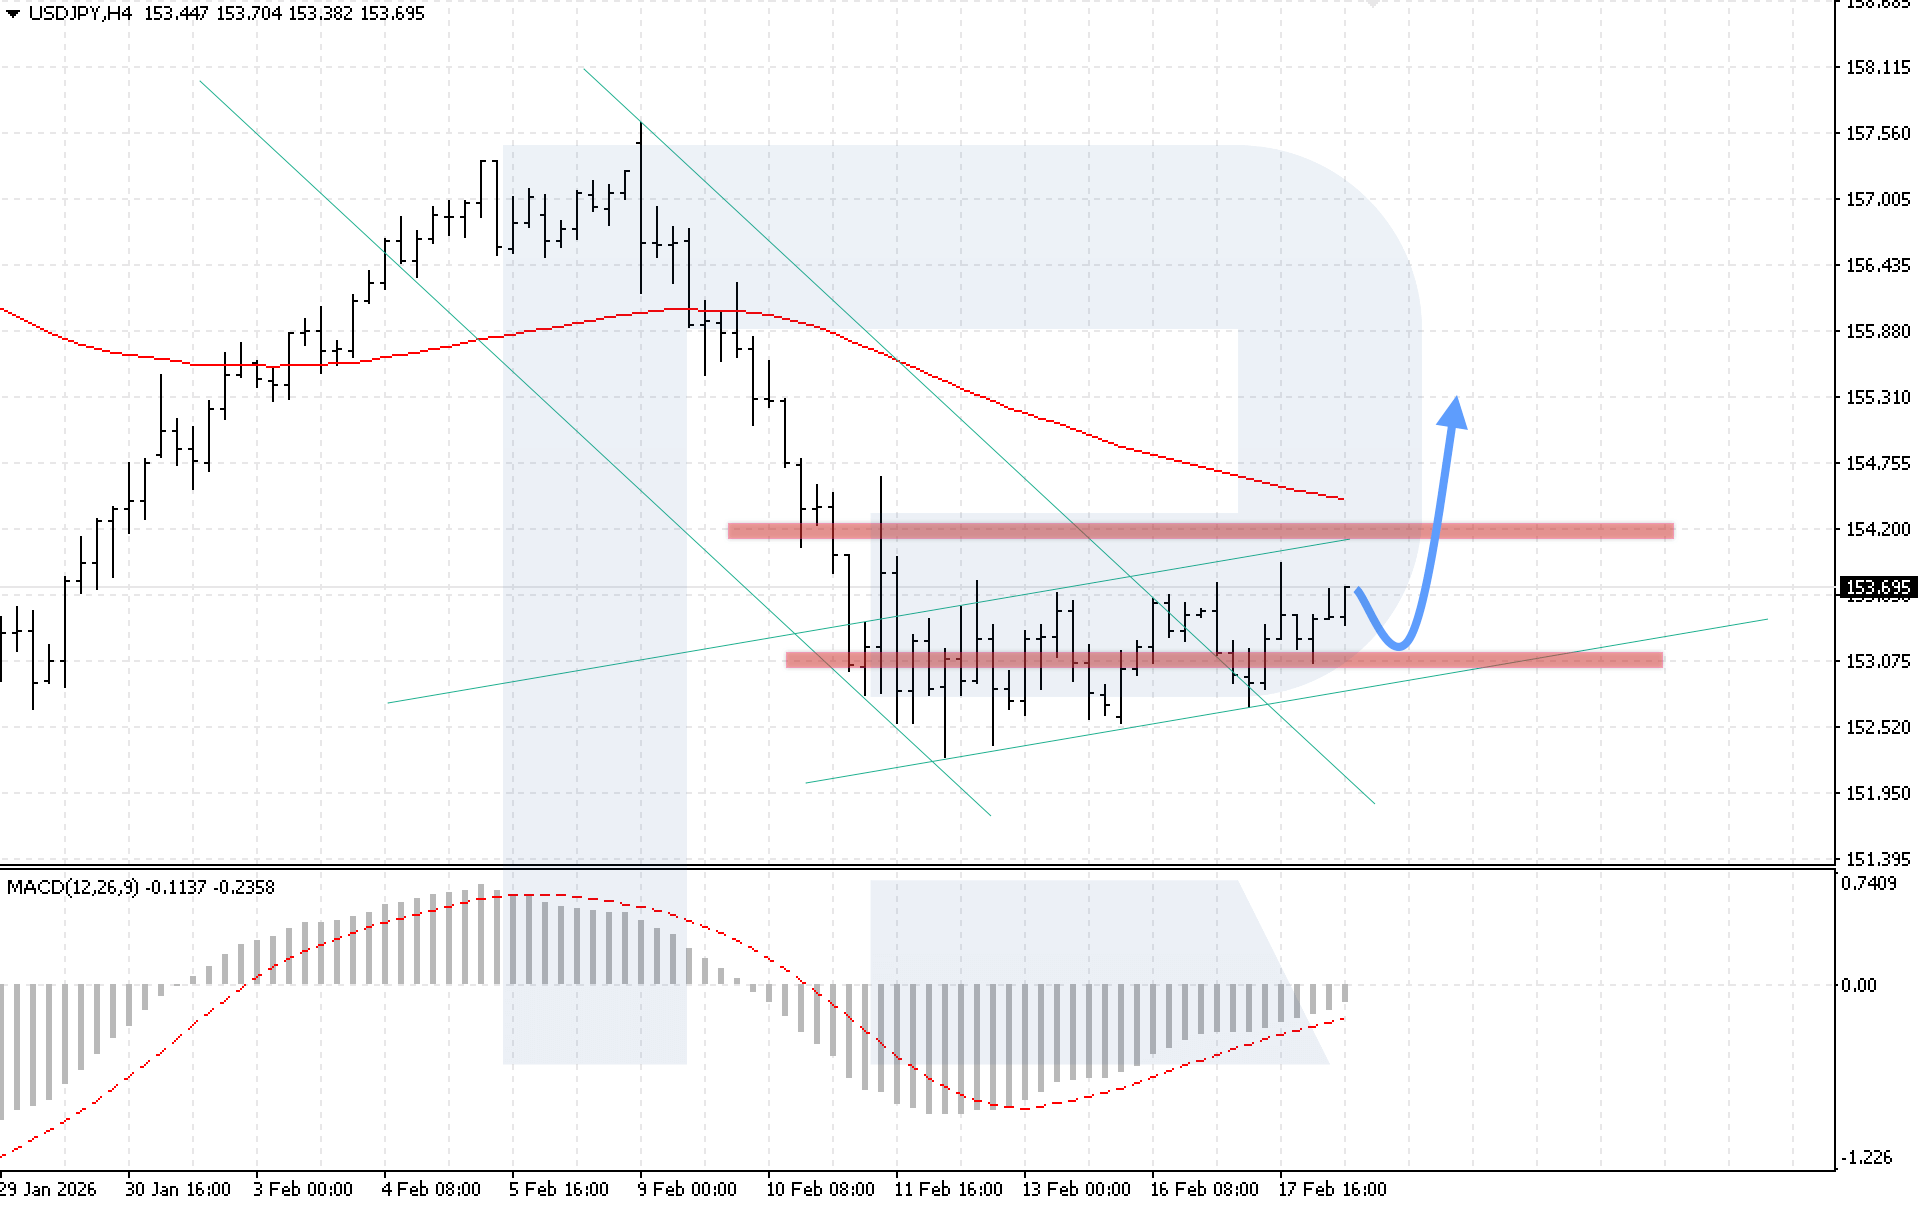
On the H4 chart of the USDJPY currency pair, the market is rising; however, buyers have failed to break above the key resistance level to exit the consolidation channel. Today, 18 February 2026, the baseline scenario suggests a rebound from the support level, followed by growth towards 155.35.
The technical picture confirms this scenario. The MACD indicator shows steady growth of the histogram. The key condition for growth will be a breakout above the upper boundary of the bullish channel with consolidation above 154.25.
The alternative scenario will activate if the lower boundary of the ascending channel is broken with consolidation below 152.45. Such a signal will indicate renewed decline in USDJPY.
GBPUSD forecast
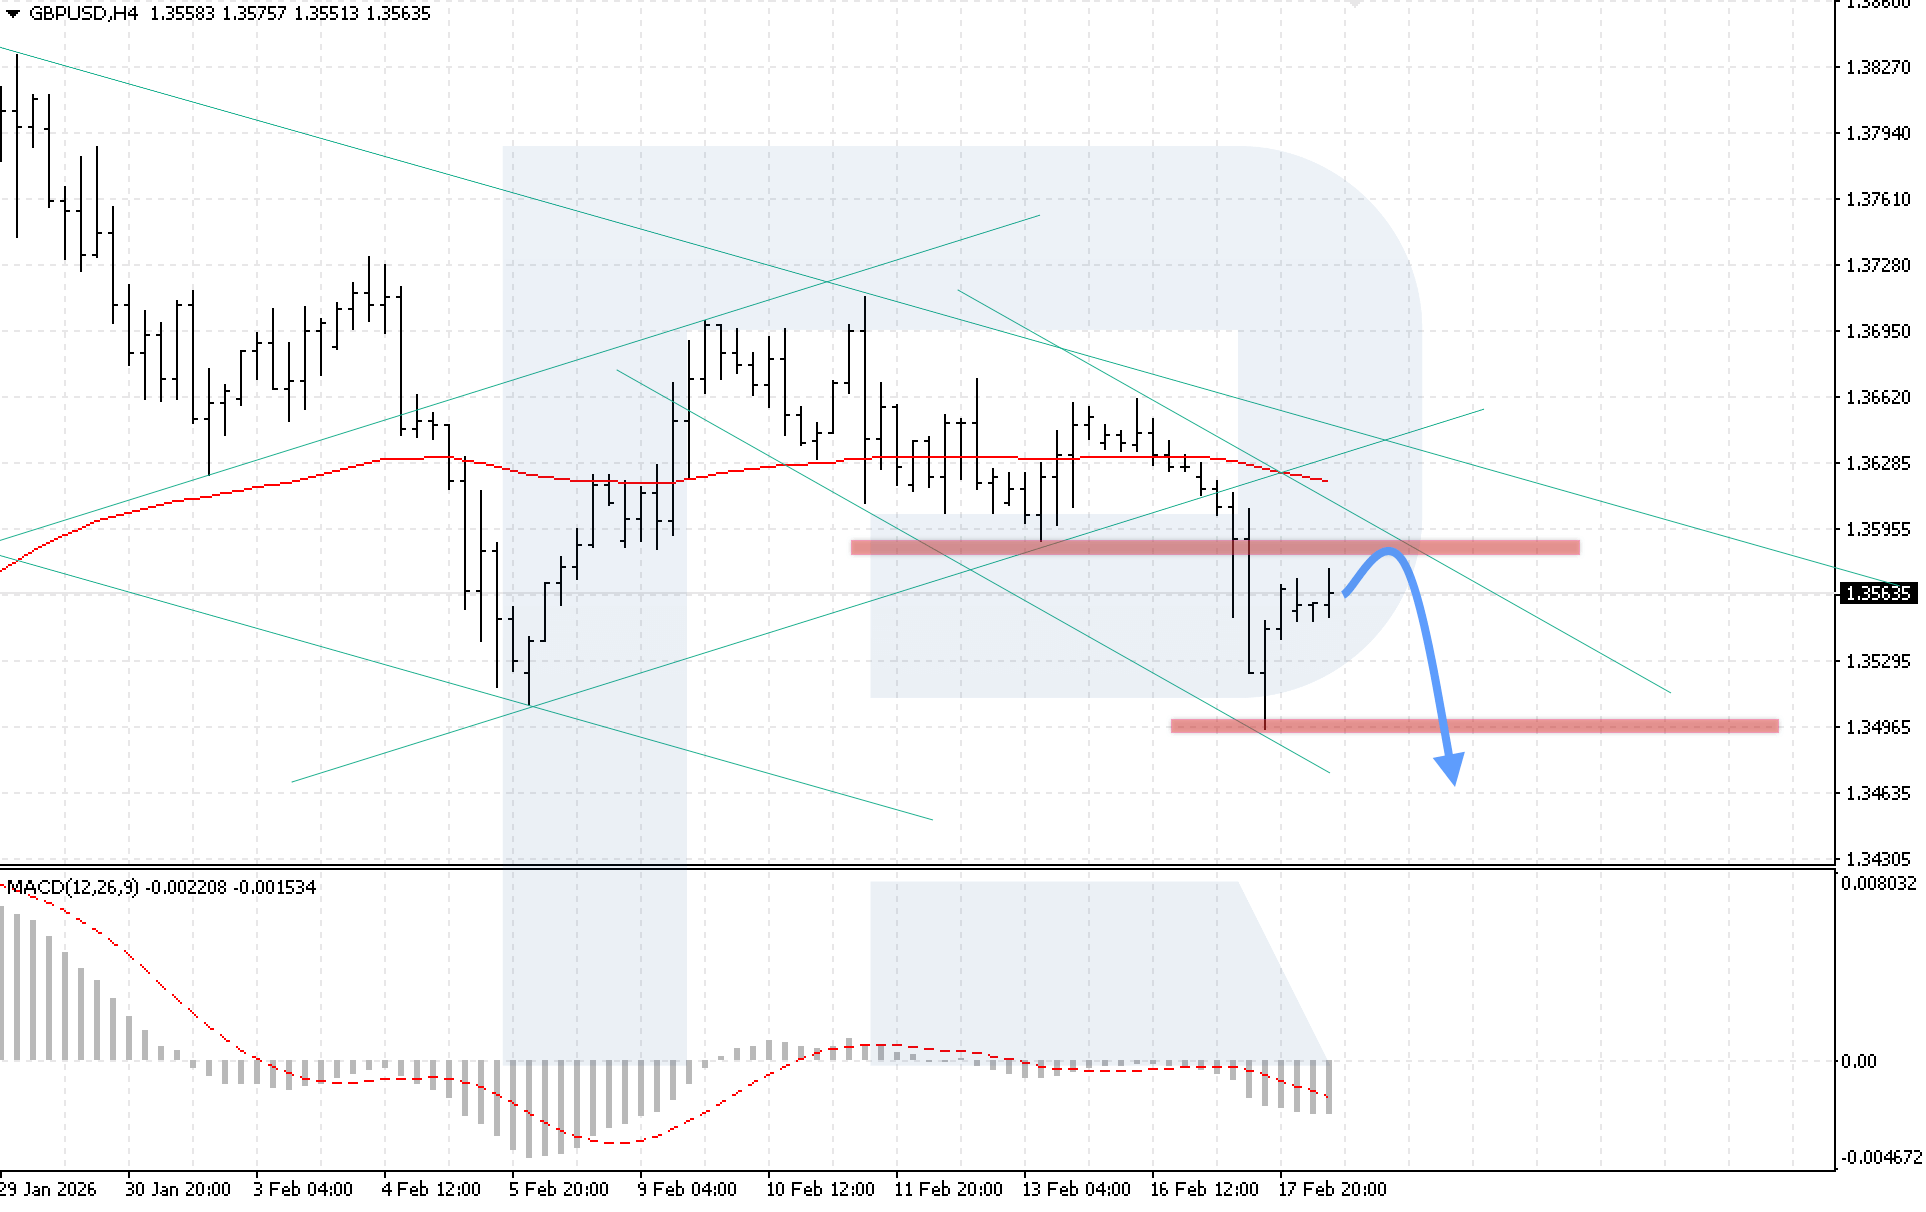
On the H4 chart of the GBPUSD currency pair, quotes are in a correction phase, remaining within a descending channel. Today, 18 February 2026, the baseline scenario suggests a rebound from the channel’s upper boundary, followed by a decline towards 1.3465.
The technical picture confirms this scenario. The MACD indicator shows a decline in the histogram, indicating strengthening bearish momentum. The key condition for continued decline will be consolidation below 1.3535.
The alternative scenario will activate if the upper boundary of the descending channel is broken with consolidation above 1.3605. Such a signal will indicate renewed growth in GBPUSD.
AUDUSD forecast
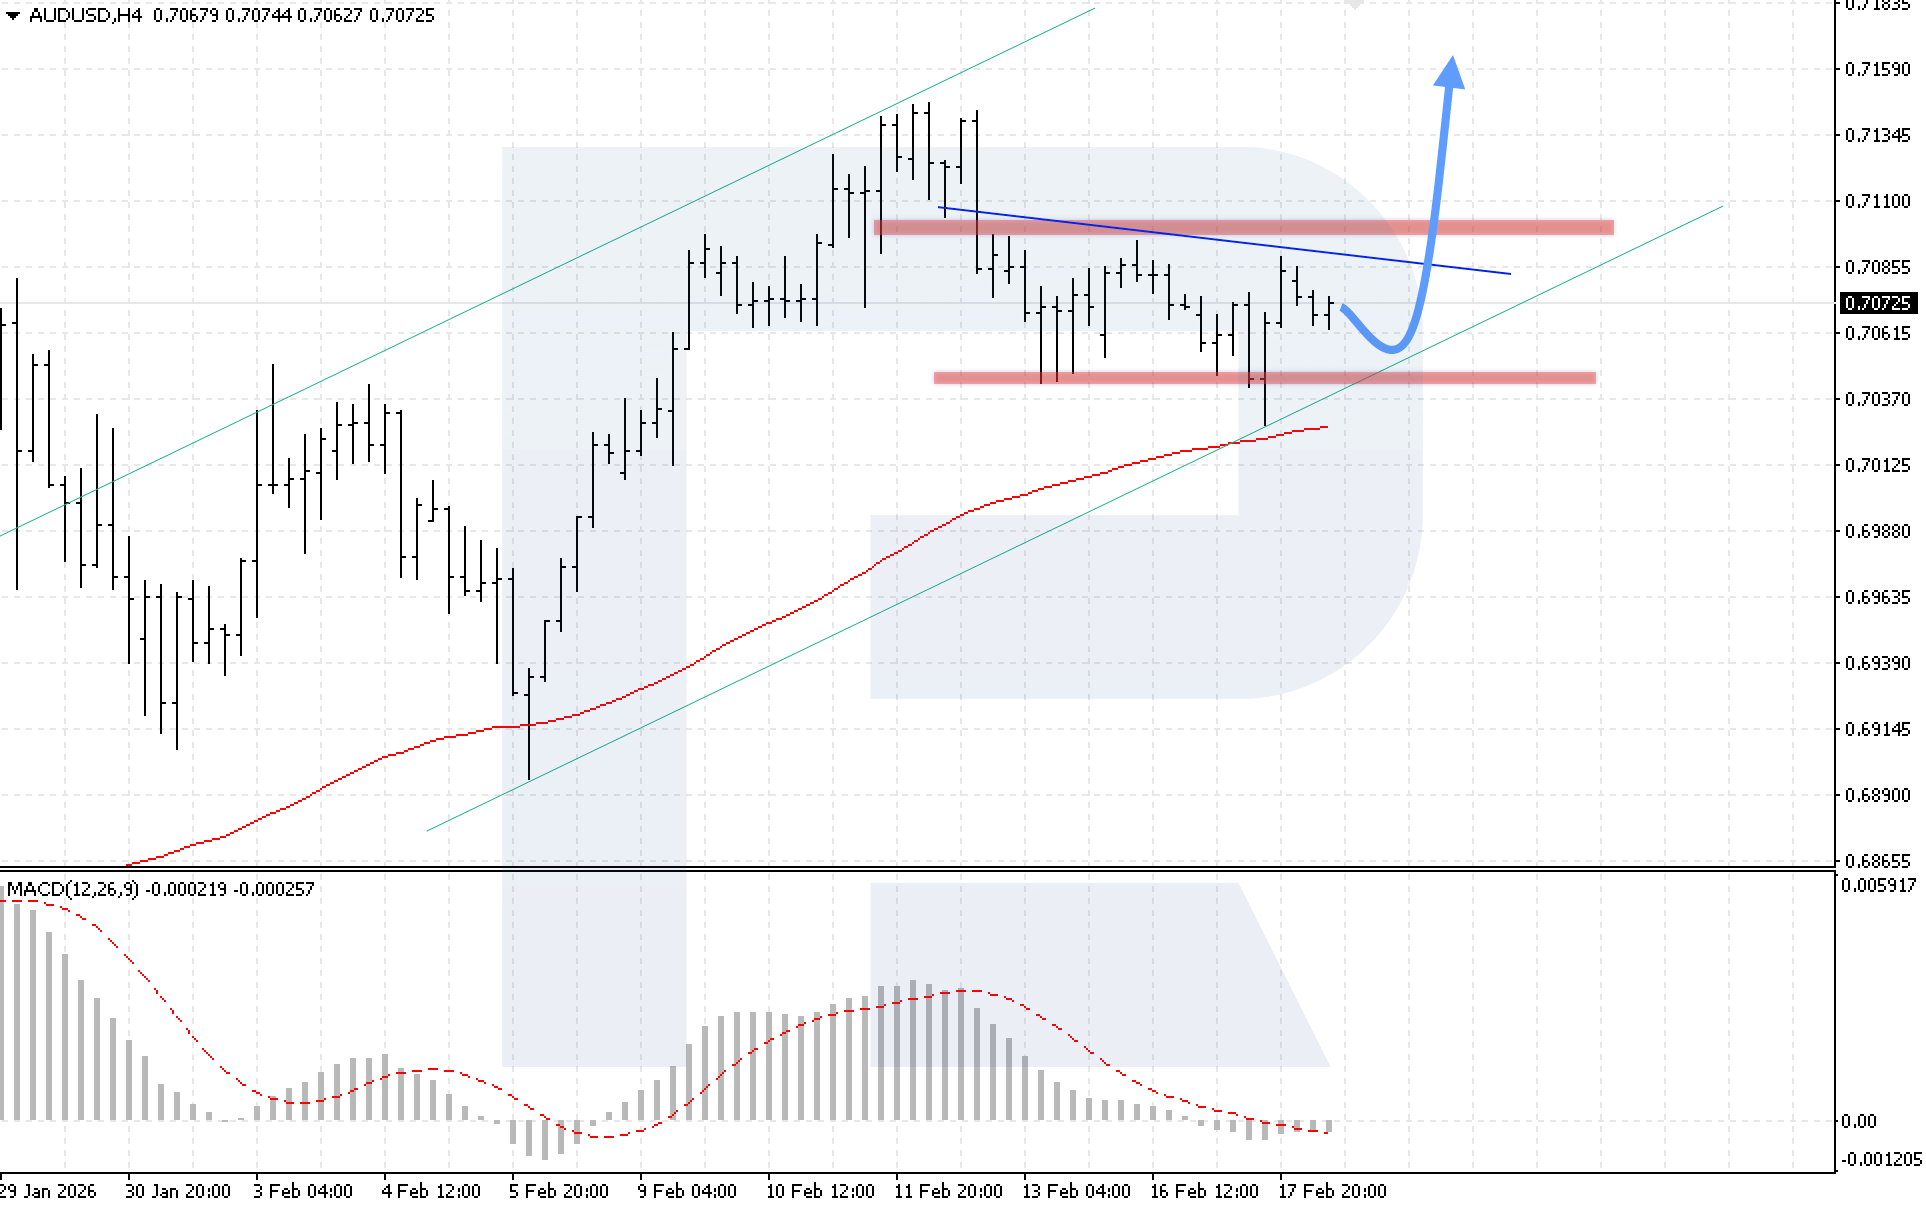
On the H4 chart of the AUDUSD currency pair, the market continues to form a corrective wave within a Head and Shoulders pattern. Today, 18 February 2026, the baseline scenario suggests growth after a rebound from the lower boundary of the bullish channel, with a target at 0.7165.
The technical picture confirms this scenario. The MACD indicator shows a slowdown in histogram decline, while the formation of the Head and Shoulders pattern strengthens the potential for upward movement. The key condition for growth will be consolidation above 0.7085, indicating a breakout above the upper boundary of the pattern.
The alternative scenario will activate if the price declines with a breakout below 0.7020. Such a signal will indicate cancellation of the reversal pattern and continued downward movement in AUDUSD.
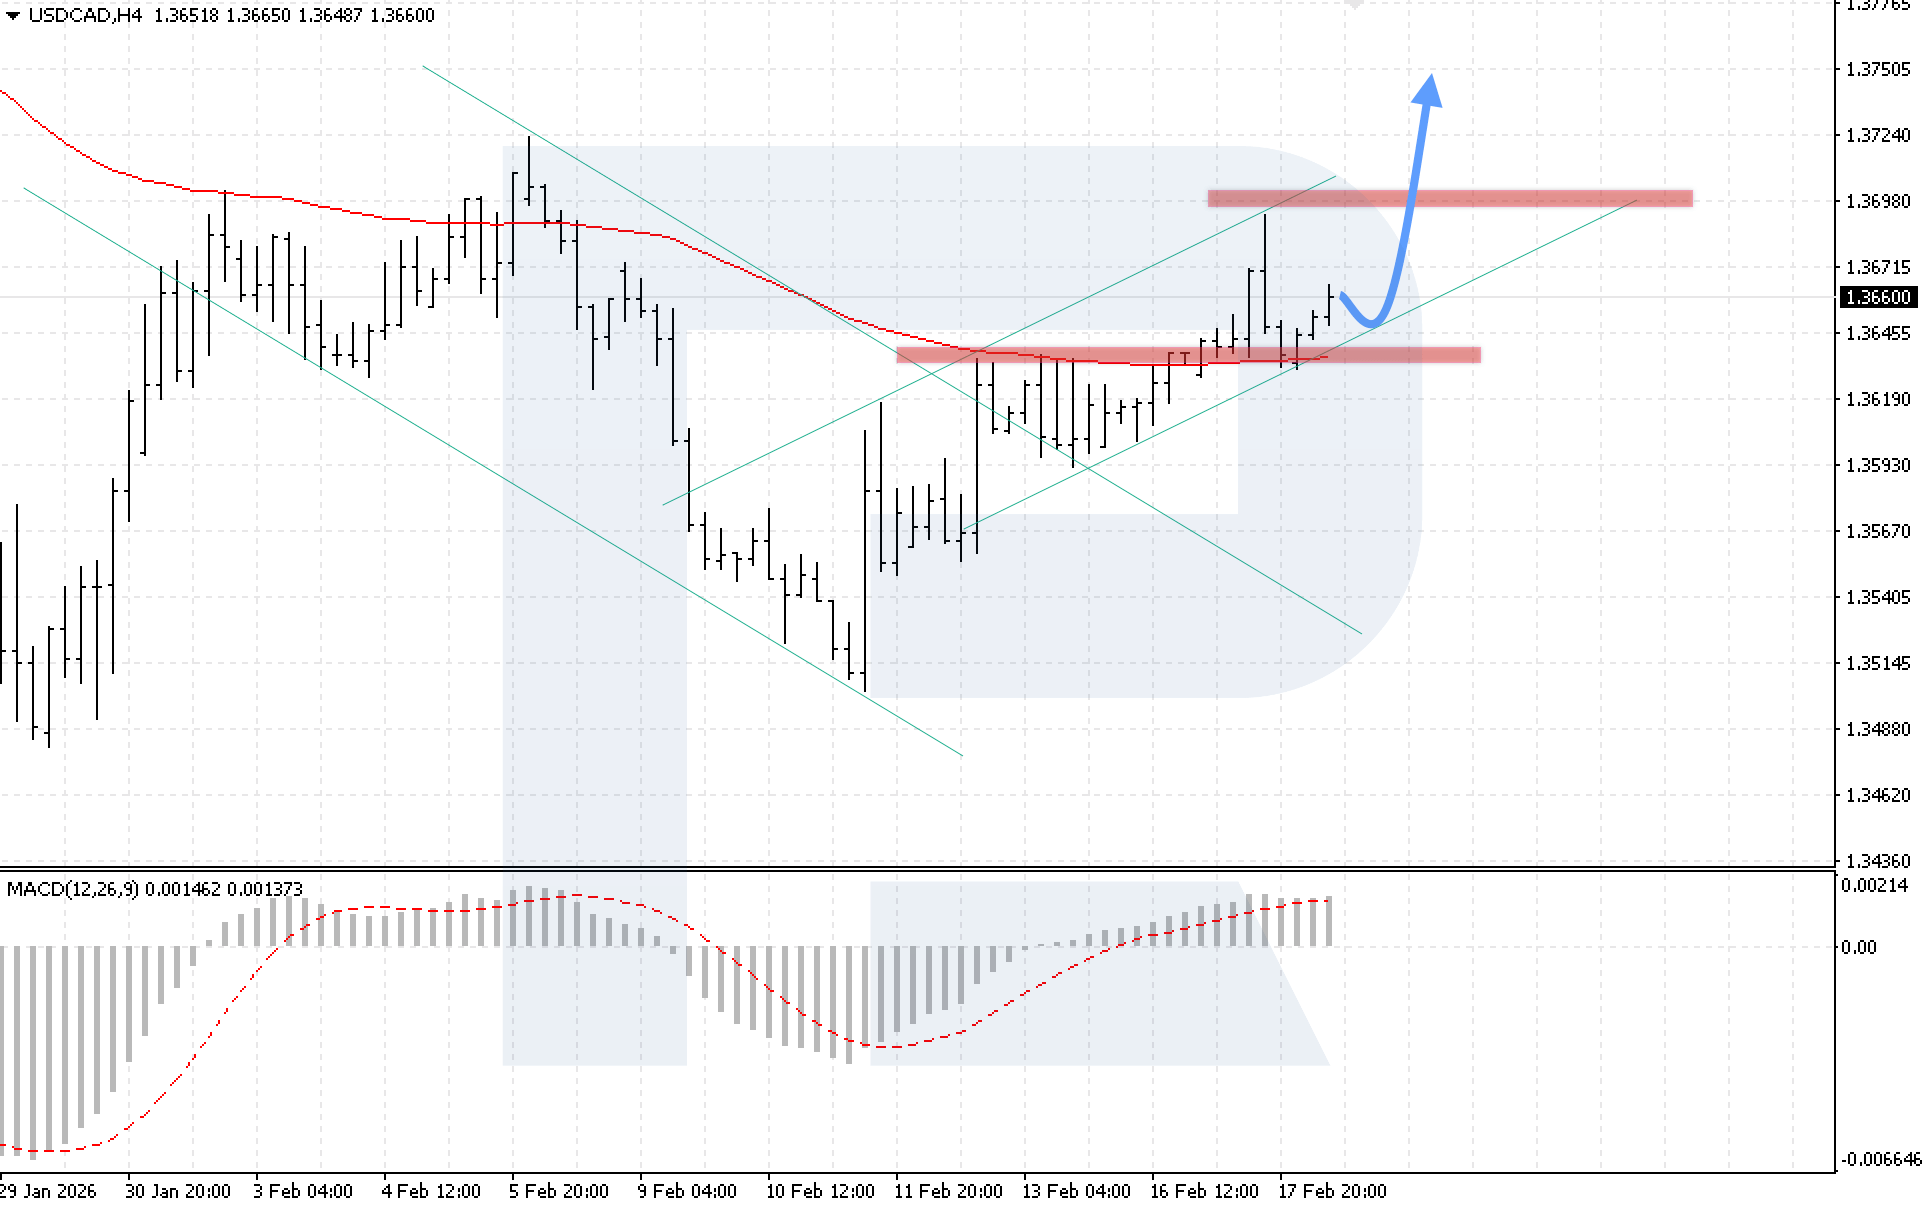
USDCAD forecast
On the H1 chart of the USDCAD currency pair, the market continues to move within an uptrend after rebounding from the EMA-85. Buyers are holding quotes inside the bullish channel. Today, 18 February 2026, the baseline scenario suggests continued growth with a target at 1.3750.
The technical picture confirms the bullish scenario. The MACD histogram is rising, strengthening the signal for continued upward movement. The key condition for growth will be consolidation above the local resistance level at 1.3695.
The alternative scenario will activate if the lower boundary of the channel is broken with consolidation below 1.3615. Such a signal will indicate renewed decline towards the next support level.
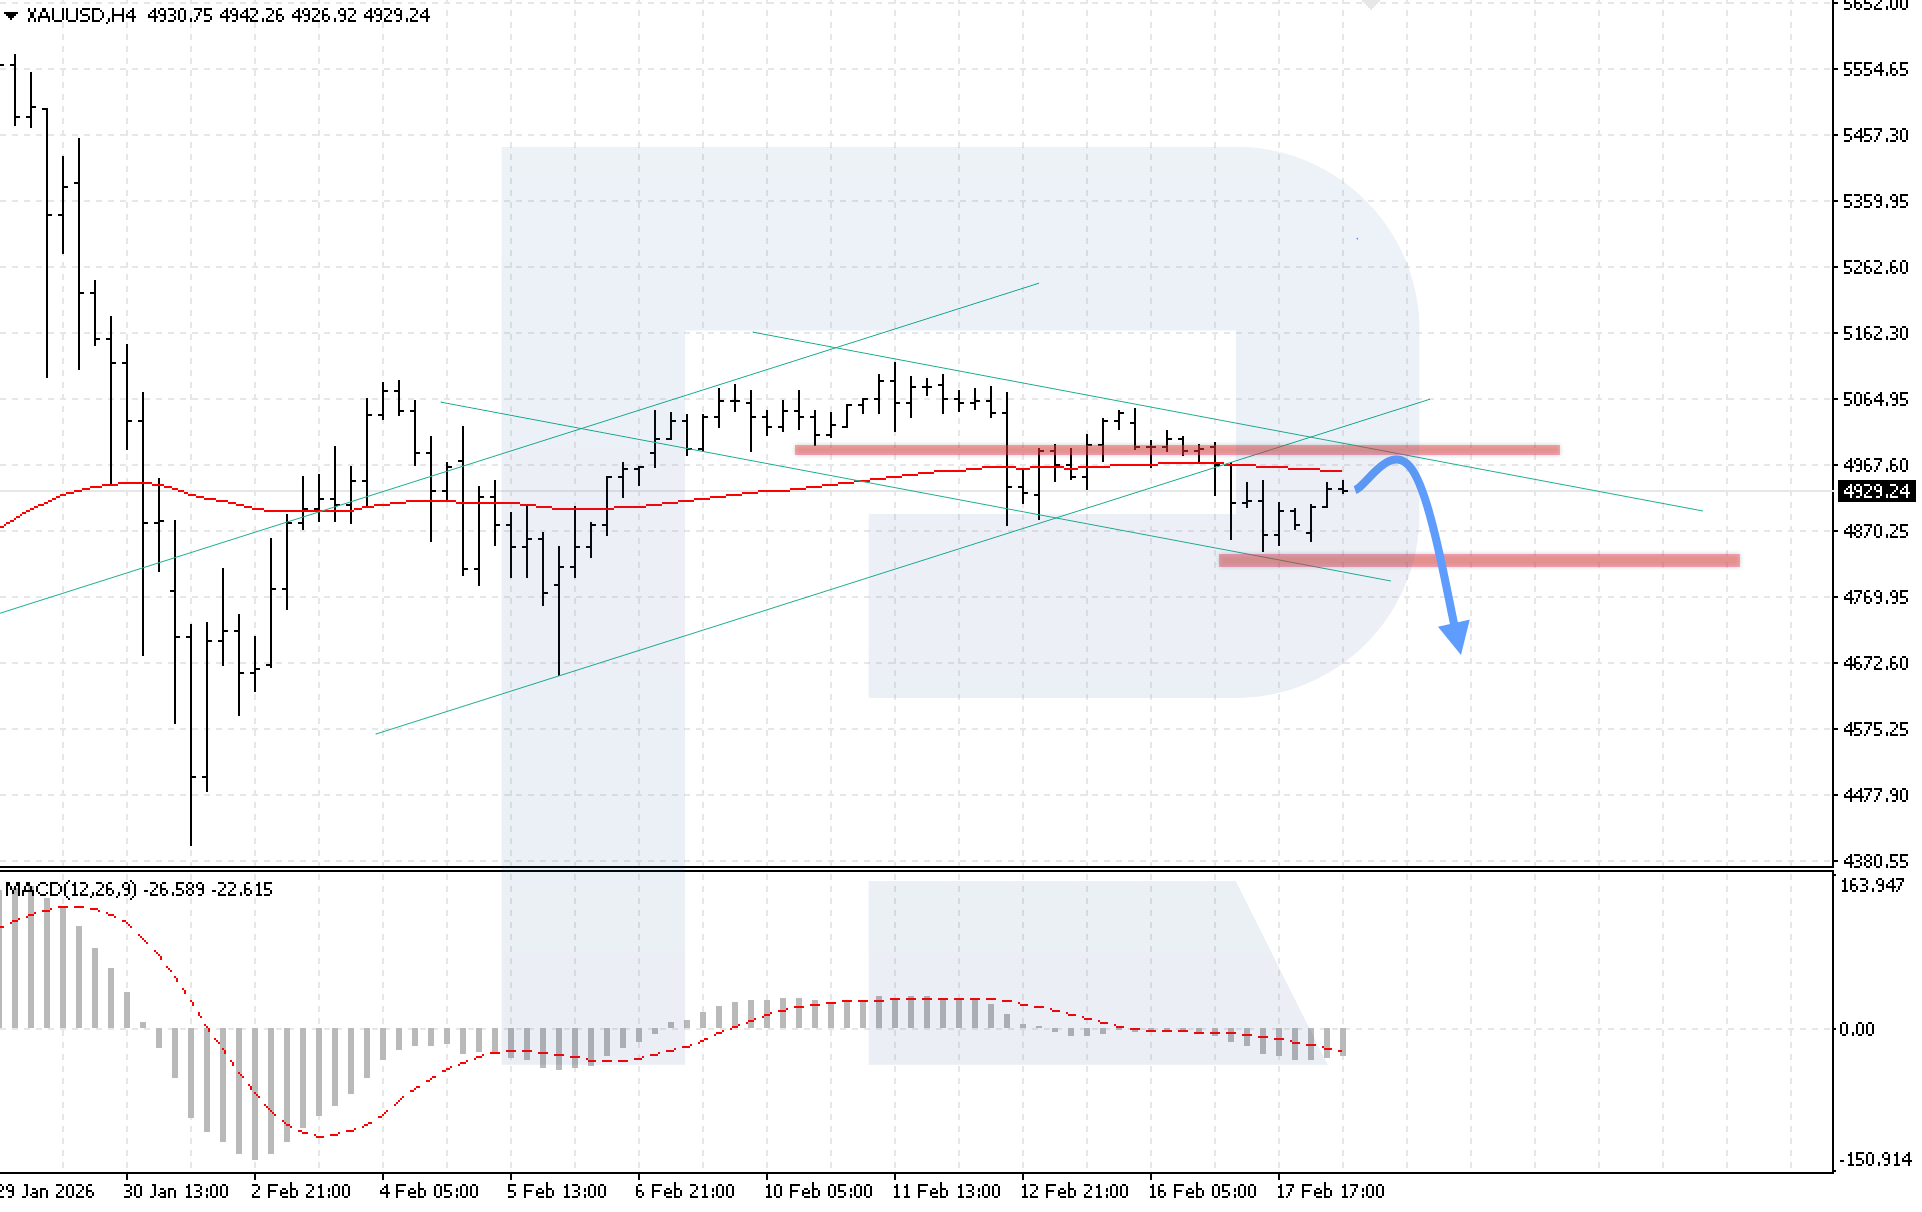
XAUUSD forecast
On the XAUUSD H4 chart, the market is undergoing a correction after a sharp decline, with sellers holding quotes below the EMA-85. Today, 18 February 2026, the baseline scenario suggests renewed decline after a rebound from the upper boundary of the channel, with a target at 4,675.
The technical picture confirms the bearish scenario. The MACD indicator has slowed its decline, but bearish pressure remains. The key condition for continued decline will be consolidation below the 4,825 support level.
The alternative scenario will activate if prices break above the resistance level and consolidate above 4,995. Such a signal will indicate a breakout of the upper boundary of the descending channel and open the potential for further correction in XAUUSD quotes.
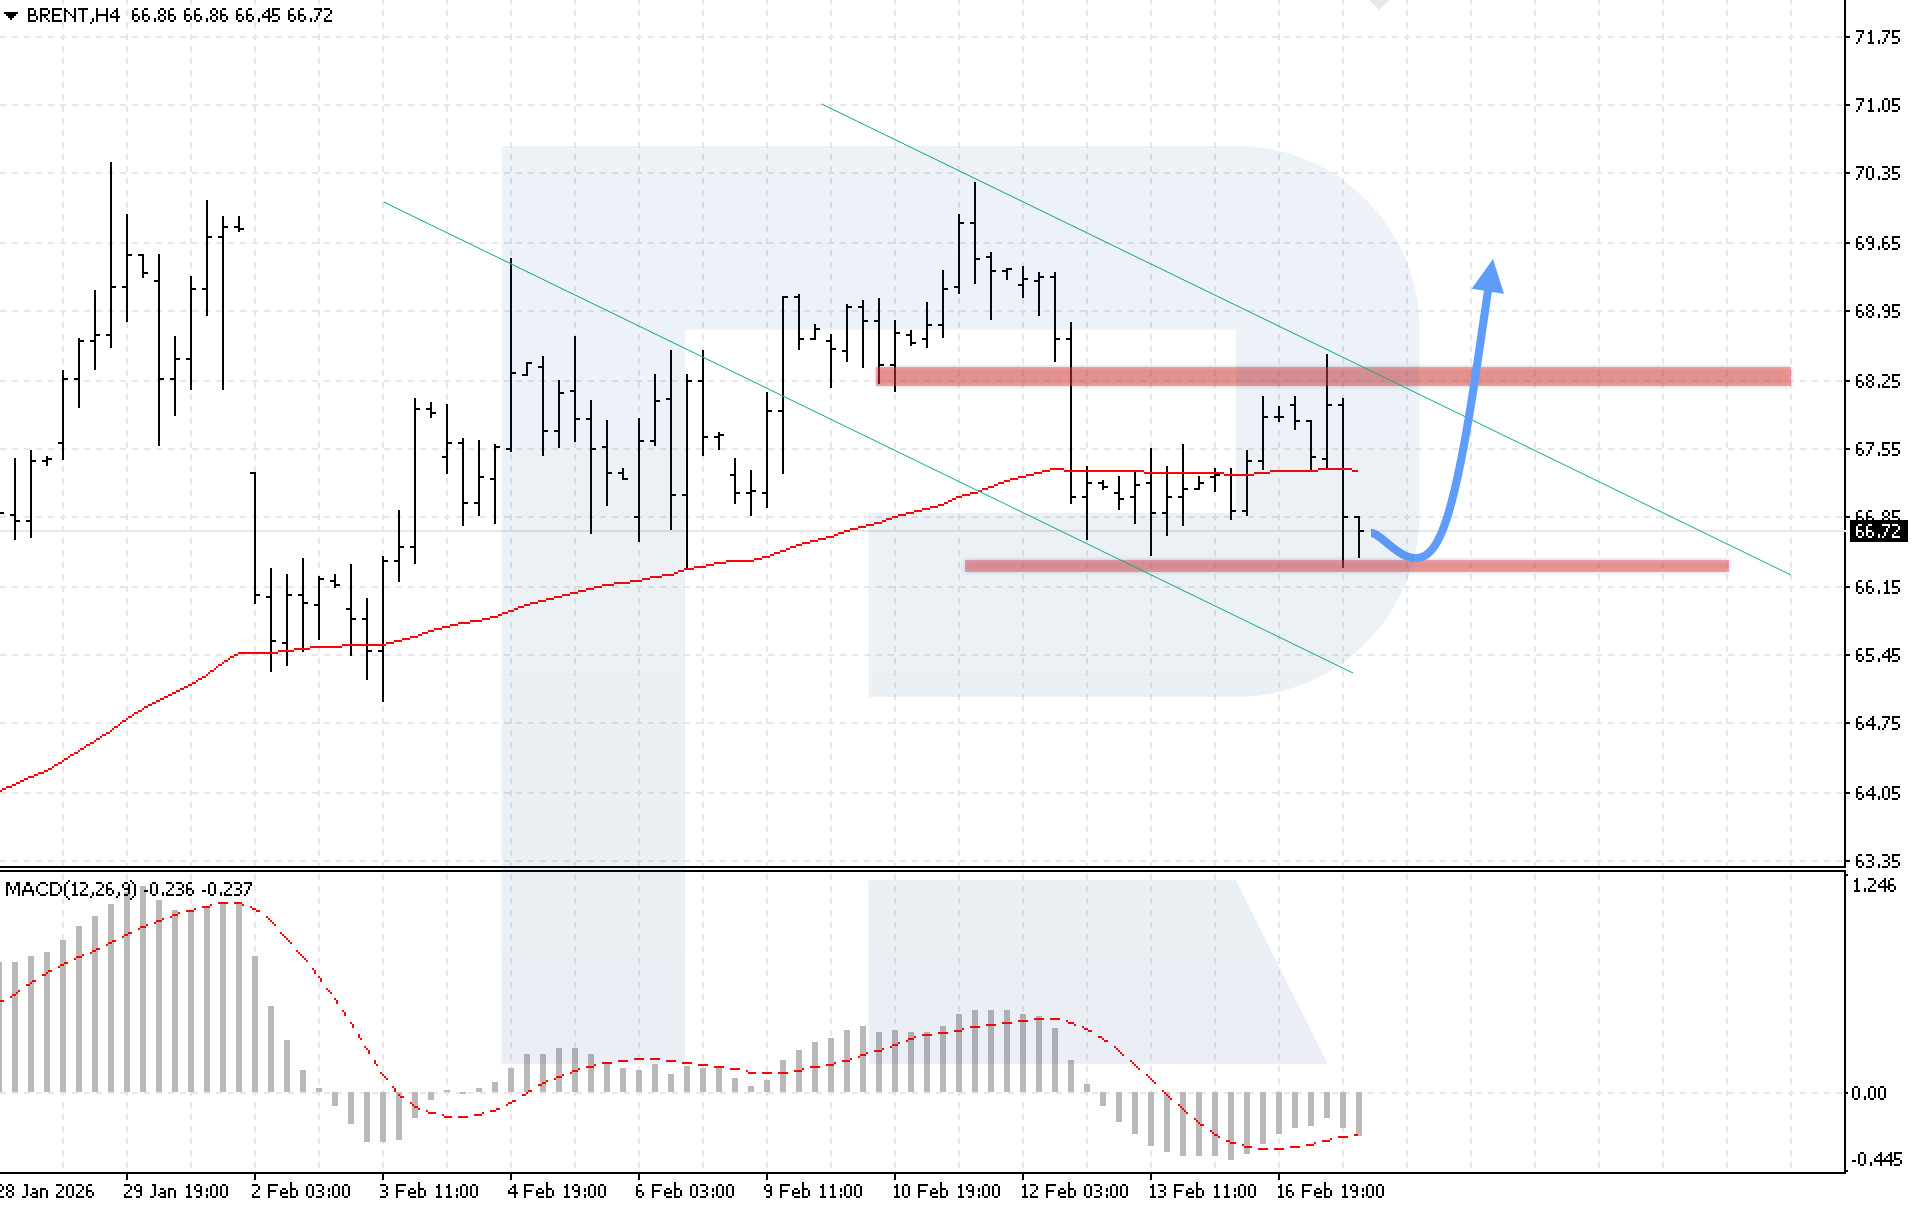
Brent forecast
On the H4 chart of Brent crude oil, the market continues to decline, with quotes falling below the EMA-85, indicating selling pressure. Today, 18 February 2026, the baseline scenario suggests a rebound from the local support level, followed by growth towards 69.70.
The technical picture confirms the bullish scenario. The MACD indicator is forming a bullish divergence, suggesting a potential reversal. The key condition for growth will be consolidation above the 68.25 resistance level, confirming a breakout above the upper boundary of the Double Bottom reversal pattern.
The alternative scenario will activate if prices break below the local support level and consolidate below 66.05. Such a signal will indicate the cancellation of the reversal pattern and continued decline in Brent quotes.
Editors’ picks
 EURUSD 2026-2027 forecast: key market trends and future predictions
This article provides the EURUSD forecast for 2026 and 2027 and highlights the main factors determining the direction of the pair’s movements. We will apply technical analysis, take into account the opinions of leading experts, large banks, and financial institutions, and study AI-based forecasts. This comprehensive insight into EURUSD predictions should help investors and traders make informed decisions.
 Gold (XAUUSD) forecast 2026 and beyond: expert insights, price predictions, and analysis
Dive deep into the Gold (XAUUSD) price outlook for 2026 and beyond, combining technical analysis, expert forecasts, and key macroeconomic factors. It explains the drivers behind gold’s recent surge, explores potential scenarios including a move toward 4,500 to 5,000 USD per ounce, and highlights why the metal remains a strong hedge during global uncertainty.
Forecasts presented in this section only reflect the author’s private opinion and should not be considered as guidance for trading. RoboForex bears no responsibility for trading results based on trading recommendations described in these analytical reviews.