Daily technical analysis and forecast for 7 April 2026
Here is a detailed daily technical analysis and forecast for EURUSD, USDJPY, GBPUSD, AUDUSD, USDCAD, XAUUSD, and Brent for 7 April 2026.
EURUSD forecast
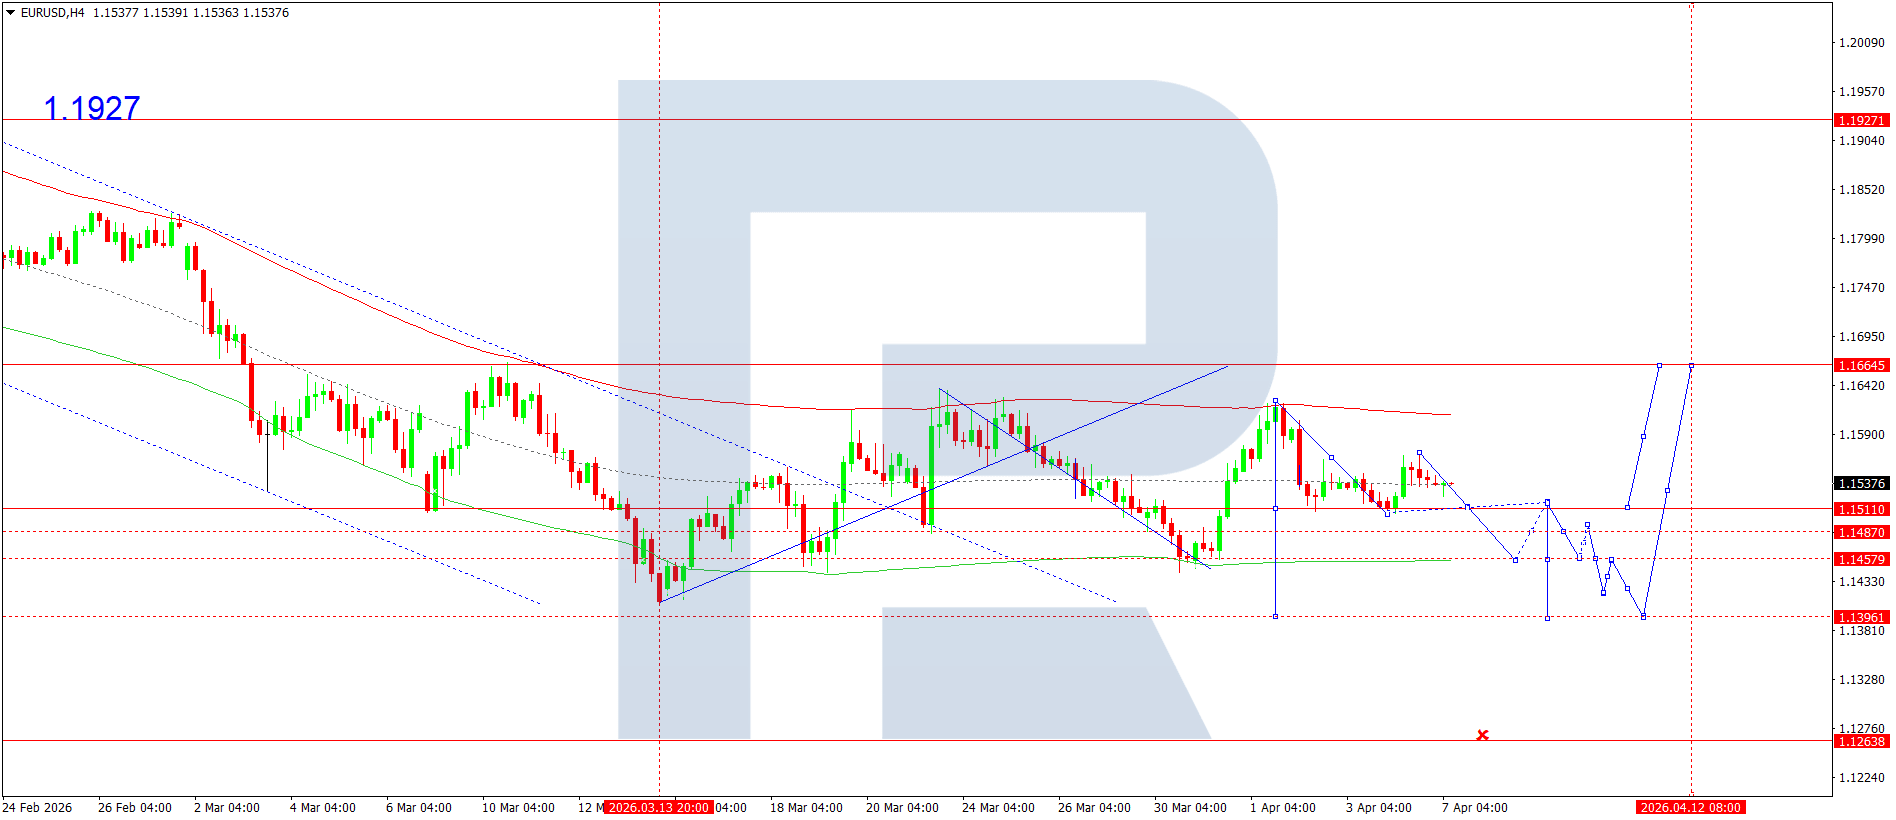
On the H4 chart of the EURUSD pair, the market completed a downward wave to 1.1511 and a corrective move towards 1.1571. Today, 7 April 2026, the pair is expected to decline to 1.1525. It is relevant to consider the probability of a breakout below this level and a continued downward move towards 1.1455. Subsequently, growth to 1.1511 (testing from below) is expected. An upward breakout from this range would open the potential for a continued correction towards 1.1664, while a downward breakout could extend the downward wave towards 1.1396.
Technically, this scenario is confirmed by the indicated Elliott wave structure and the wave matrix with a pivot point at 1.1666. It is regarded as key within the structure of the downward wave for EURUSD. At the moment, the market is forming a consolidation range around the central line of the Price Envelope at 1.1530. In case of a downward breakout from this range, the pair is expected to dip towards its lower boundary at 1.1455. Conversely, an upward breakout could trigger an upward move towards its upper boundary at 1.1664. Subsequently, a decline to its lower boundary at 1.1396 is possible.
Technical indicators for today’s EURUSD forecast suggest further downward movement towards 1.1455.
USDJPY forecast
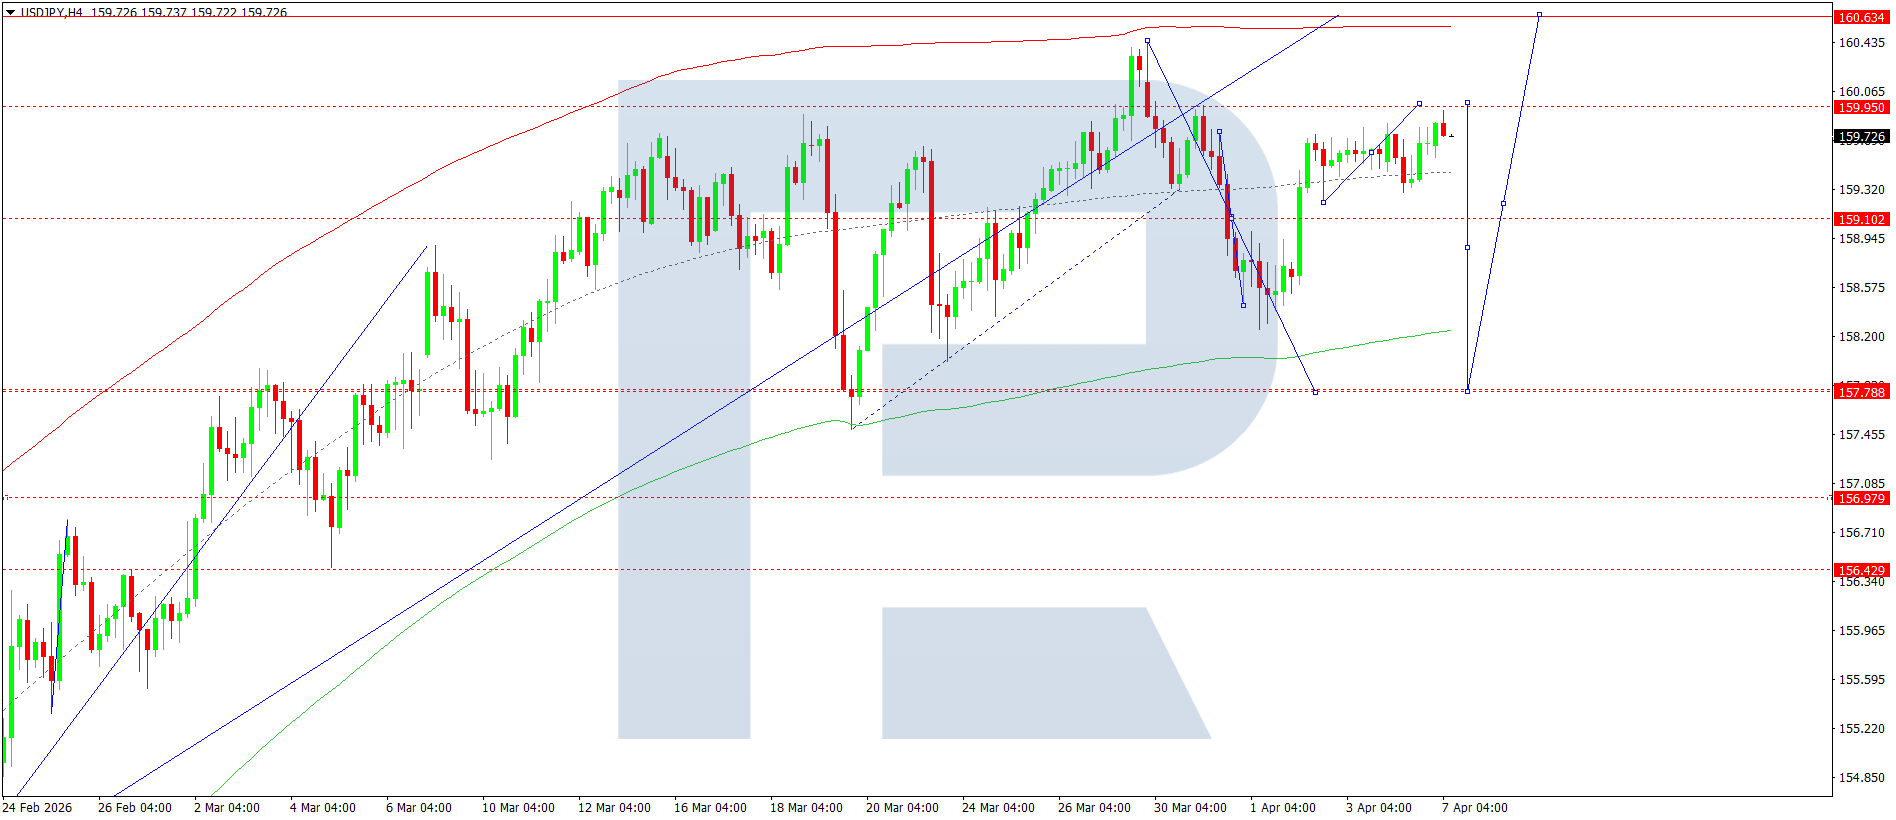
On the H4 chart of the USDJPY pair, the market continues to develop a consolidation range around 159.59. Today, 7 April 2026, in case of an upward breakout from this range, the potential for a wave towards 159.95 will open. In case of a downward breakout, a corrective wave towards 157.88 could follow. Subsequently, growth to 160.60 is expected.
Technically, this scenario for USDJPY is confirmed by the indicated Elliott wave structure and the downward wave matrix with a pivot point at 159.19. It is regarded as key within this structure. At the moment, the market completed a corrective wave towards the central line of the Price Envelope at 159.10. The downward wave could extend further to the lower boundary at 157.88. Subsequently, growth to its upper boundary at 160.60 is expected.
Technical indicators for today’s USDJPY forecast suggest a decline to 157.88, followed by growth to 160.60.
GBPUSD forecast
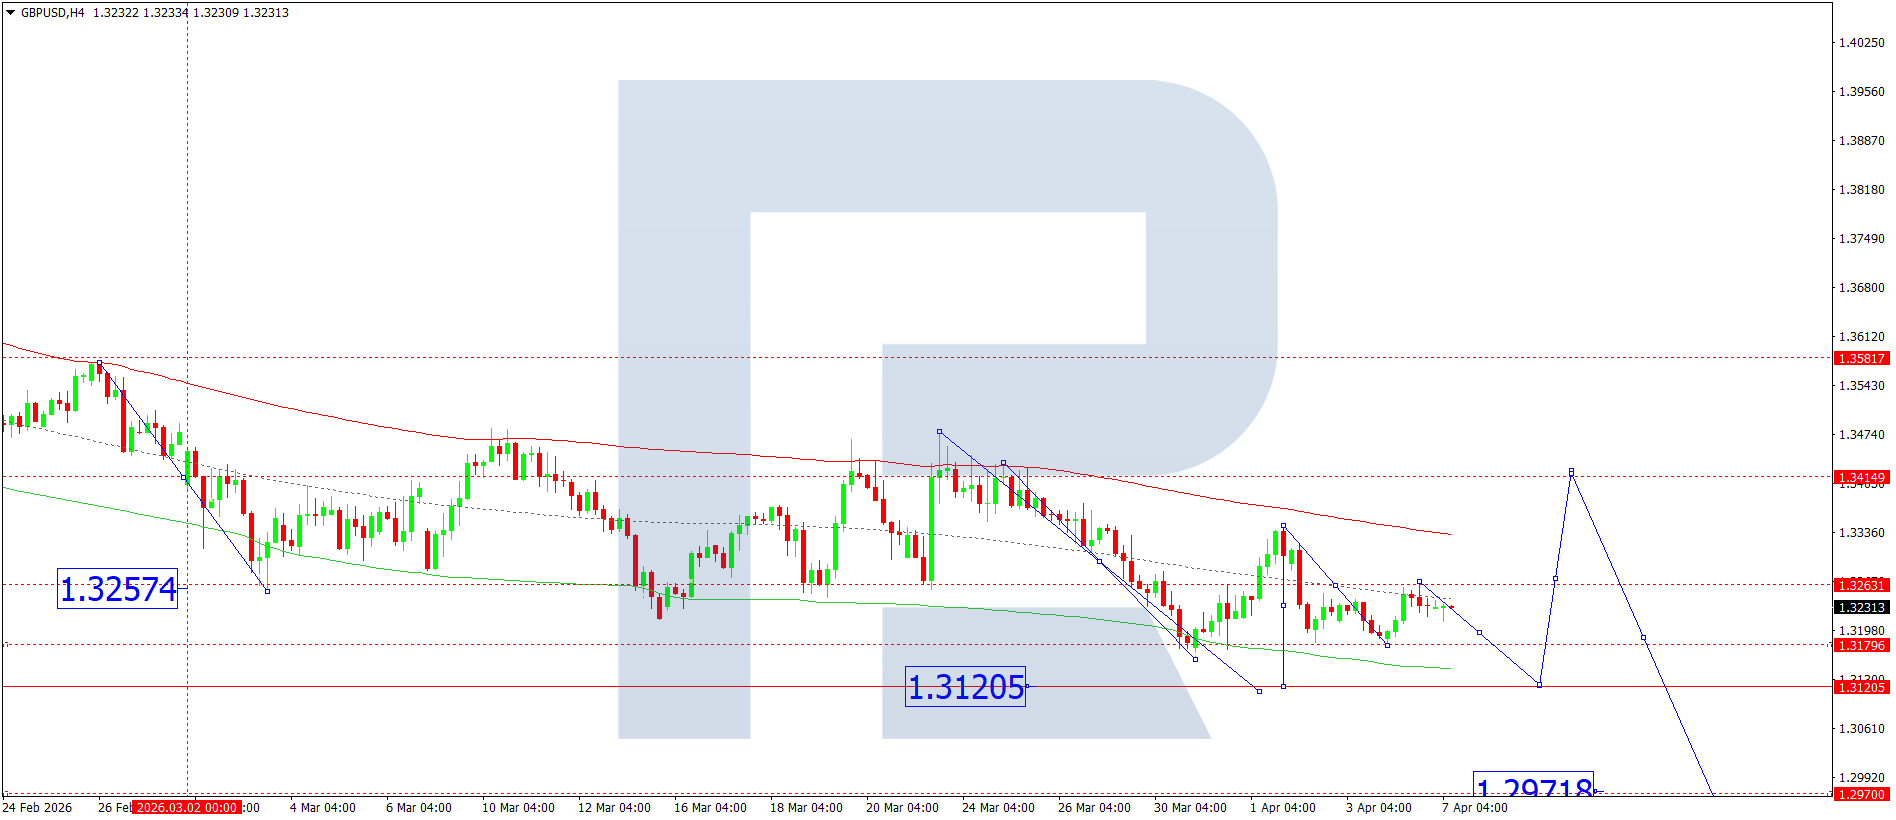
On the H4 chart of the GBPUSD pair, the market formed an upward wave towards 1.3265 and a decline to 1.3210. Today, 7 April 2026, a consolidation range is expected to develop below this level. A downward breakout would open the door for a decline to 1.3120, while an upward breakout could pave the way towards 1.3260, a local target.
Technically, this scenario for GBPUSD is confirmed by the indicated Elliott wave structure and the downward wave matrix with a pivot point at 1.3400. It is regarded as key within this structure. Today, a corrective wave towards the lower boundary of the Price Envelope at 1.3120 is possible. Subsequently, an upward wave could begin, aiming for its central line at 1.3260.
Technical indicators for today’s GBPUSD forecast suggest a decline to 1.3120.
AUDUSD forecast
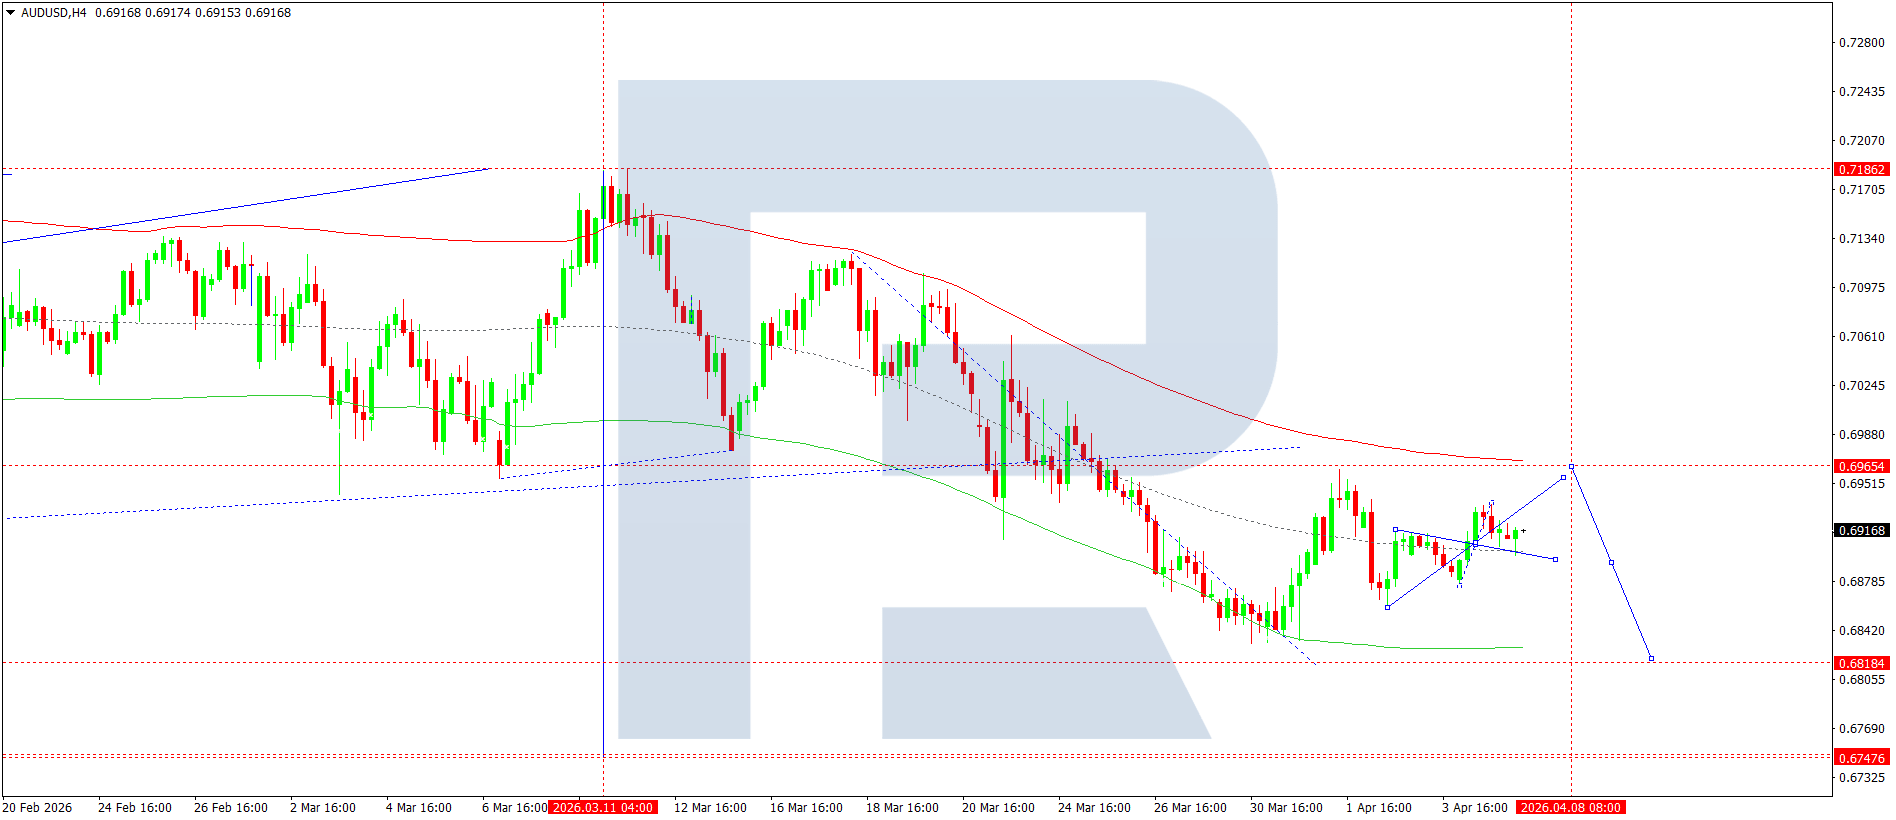
On the H4 chart of the AUDUSD pair, the market formed a consolidation range around 0.6900. Today, 7 April 2026, an upward wave is expected to develop towards 0.6969, followed by a downward wave to 0.6818, a local target.
Technically, this scenario is confirmed by the indicated Elliott wave structure and the downward wave matrix with a pivot point at 0.7000. It is regarded as key within this structure. At the moment, the market is forming a corrective wave towards its upper boundary at 0.6969. Subsequently, the price is expected to decline to the central line of the Price Envelope at 0.6900.
Technical indicators for today’s AUDUSD forecast suggest growth to 0.6969, followed by a decline to 0.6818.
USDCAD forecast
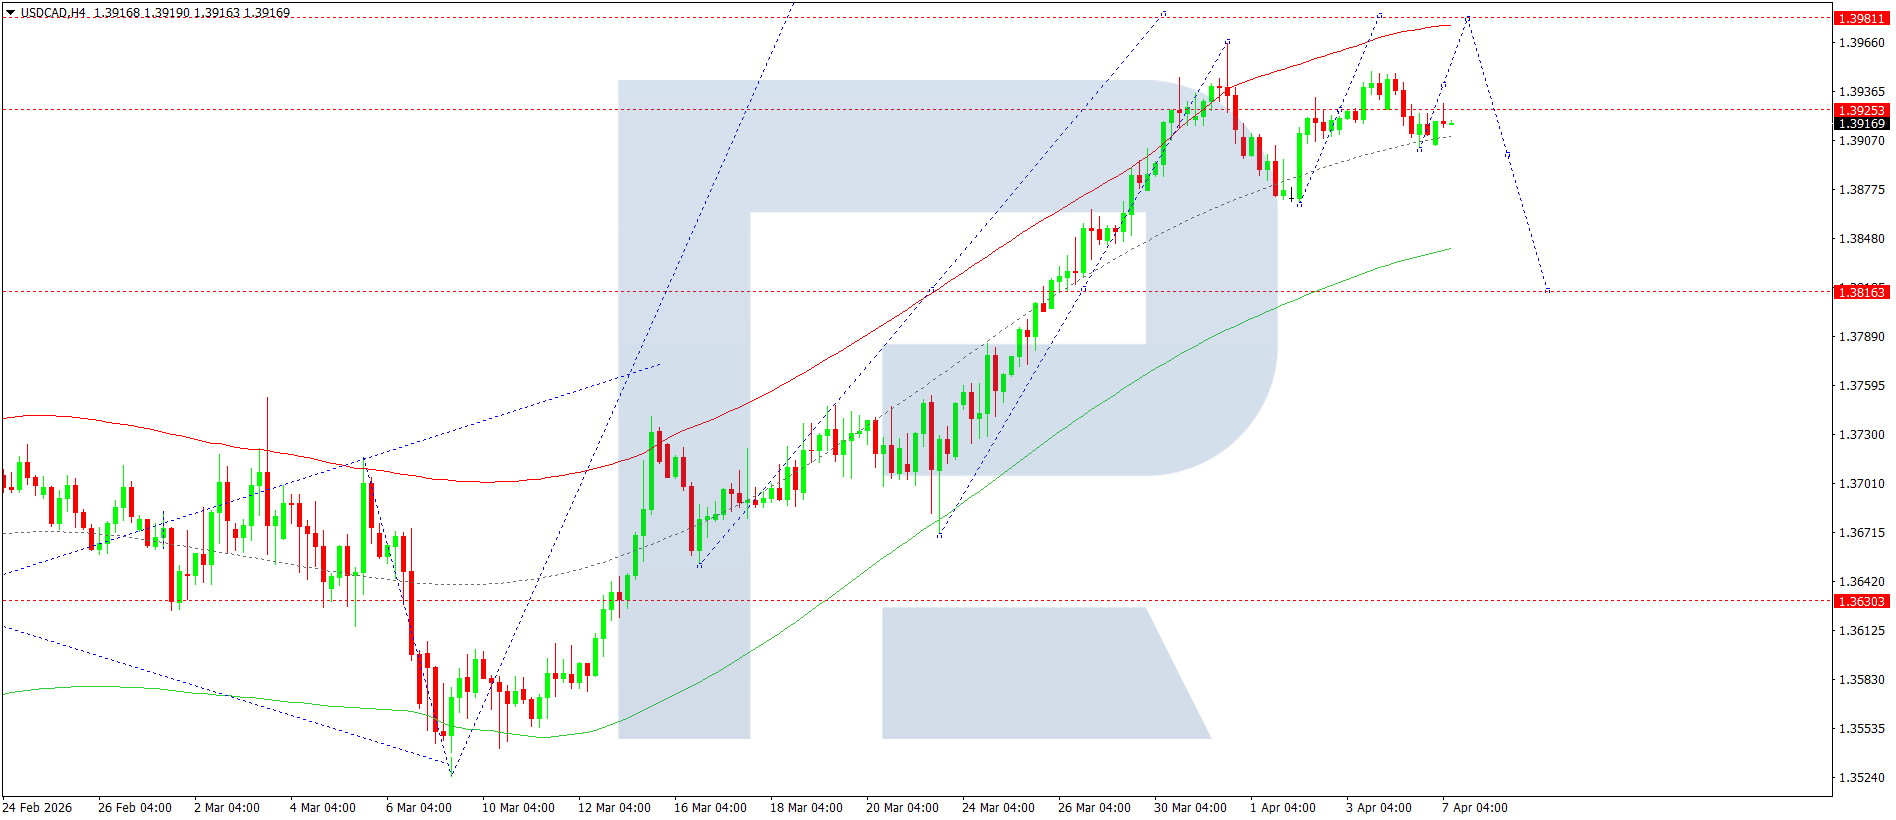
On the H4 chart of the USDCAD pair, the market completed an upward wave, reaching 1.3929. Today, 7 April 2026, a consolidation range is expected to develop above this level. In case of a downward breakout, the potential for a decline to 1.3890 will open. In case of an upward breakout, further growth to 1.3981 is expected.
Technically, this scenario is confirmed by the indicated Elliott wave structure and the upward wave matrix with a pivot point at 1.3629. It is regarded as key within this structure. At the moment, the market is forming a growth structure towards the upper boundary of the Price Envelope at 1.3981. Subsequently, a downward wave towards its central line at 1.3820 is expected.
Technical indicators for today’s USDCAD forecast suggest growth to 1.3981, followed by a decline to 1.3820.
XAUUSD forecast
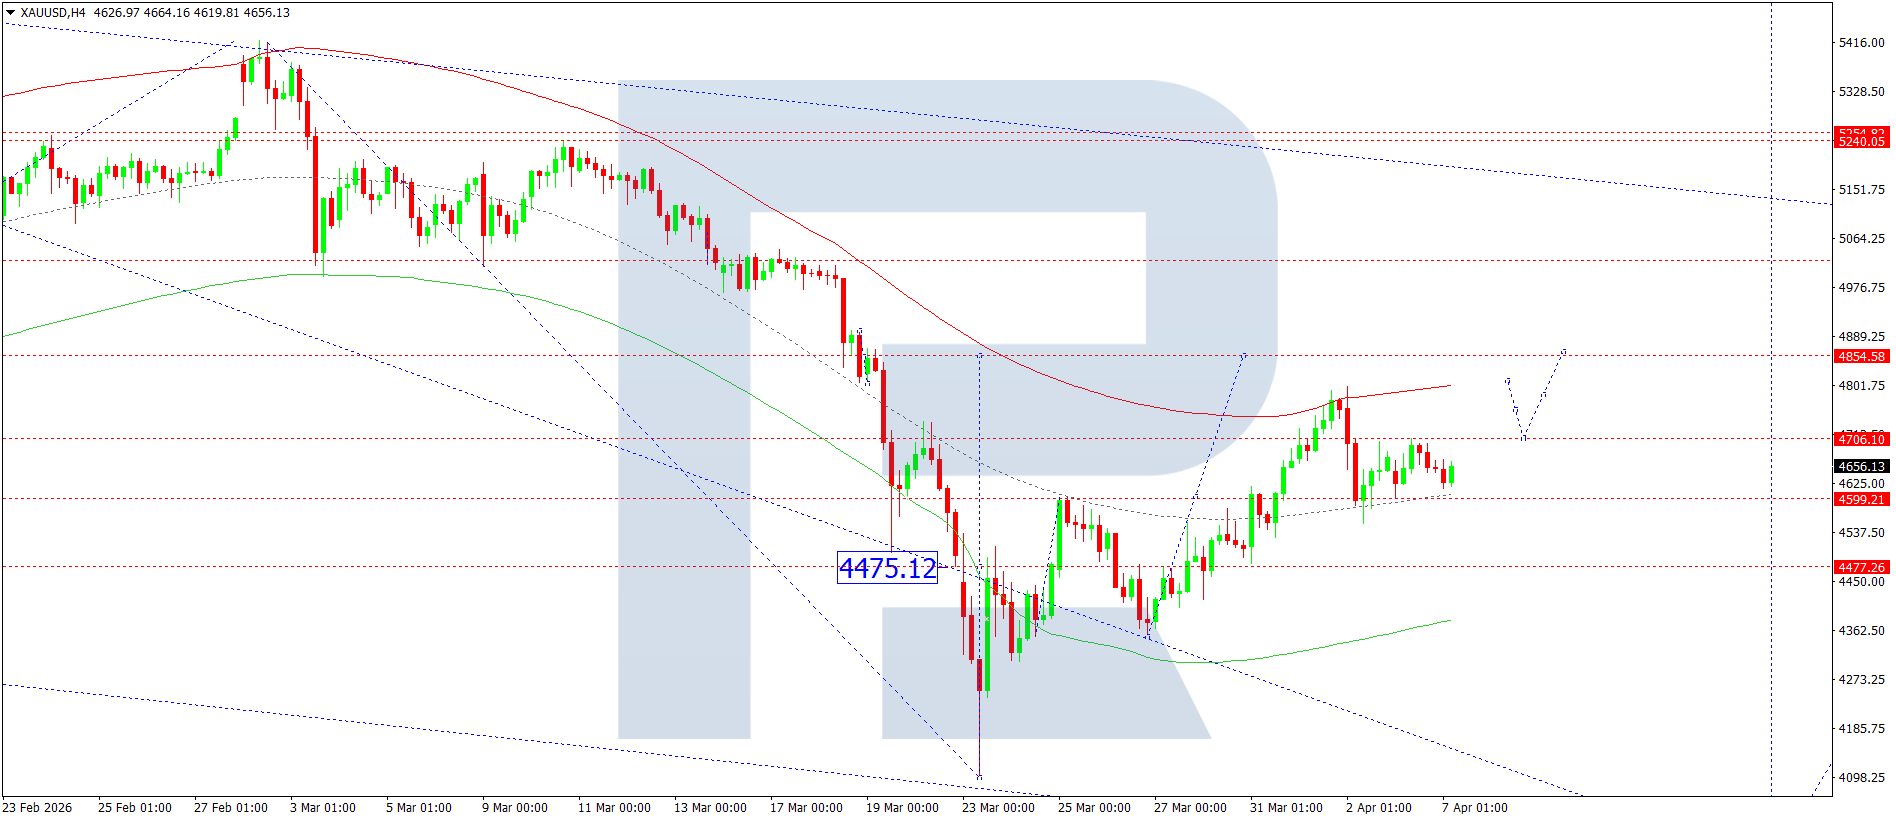
On the H4 chart of XAUUSD, the market completed an upward wave to 4,700. Today, 6 April 2026, a consolidation range is expected to develop around this level. In case of an upward breakout, the potential for growth to 4,854 will open, with prospects for continuation of the trend to 5,045. Alternatively, in case of a downward breakout, another downward move to 4,477 cannot be ruled out. The target is local.
Technically, this scenario is confirmed by the indicated Elliott wave structure and the upward wave matrix with a pivot point at 4,474. It is regarded as key within this structure. At the moment, the market is forming a consolidation range around the central line of the Price Envelope at 4,599. In case of a downward breakout, the downward wave is expected to continue towards 4,477. Conversely, an upward breakout, would open the potential for an upward wave towards 4,854.
Technical indicators for today’s XAUUSD forecast suggest a decline to 4,599, followed by growth to 4,854.
Brent forecast
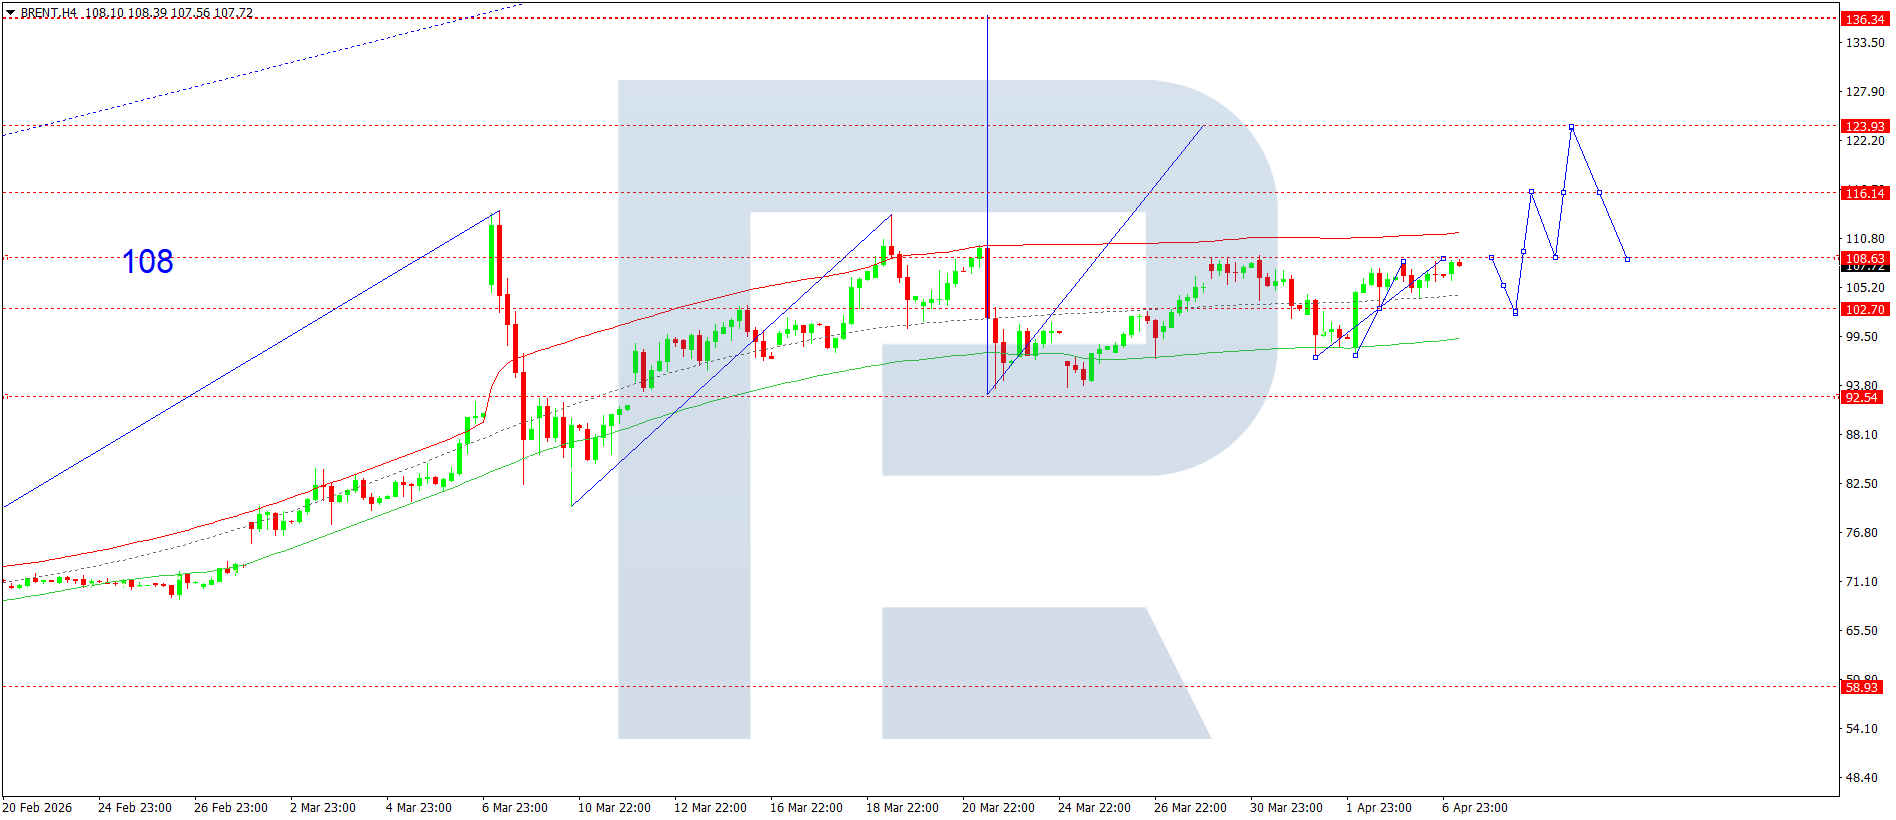
On the H4 chart of Brent crude oil, the market completed an upward wave to 108.39. Today, 7 April 2026, a consolidation range could develop below this level. In case of an upward breakout, the potential for growth to 116.16 will open, with prospects for continuation of the trend to 123.93. The target is local. In case of a downward breakout, a corrective move to 102.70 cannot be ruled out, followed by growth to 116.16.
Technically, this scenario is confirmed by the indicated Elliott wave structure and the upward wave matrix with a pivot point at 98.00. It is regarded as key within this structure. At the moment, the market is forming a consolidation range around the central line of the Price Envelope at 102.70. An upward breakout would open the door for a wave towards its upper boundary at 116.16.
Technical indicators for today’s Brent forecast suggest growth to 116.16.
Editors’ picks
 EURUSD 2026-2027 forecast: key market trends and future predictions
This article provides the EURUSD forecast for 2026 and 2027 and highlights the main factors determining the direction of the pair’s movements. We will apply technical analysis, take into account the opinions of leading experts, large banks, and financial institutions, and study AI-based forecasts. This comprehensive insight into EURUSD predictions should help investors and traders make informed decisions.
 Gold (XAUUSD) forecast 2026 and beyond: expert insights, price predictions, and analysis
Dive deep into the Gold (XAUUSD) price outlook for 2026 and beyond, combining technical analysis, expert forecasts, and key macroeconomic factors. It explains the drivers behind gold’s recent surge, explores potential scenarios including a move toward 4,500 to 5,000 USD per ounce, and highlights why the metal remains a strong hedge during global uncertainty.
Forecasts presented in this section only reflect the author’s private opinion and should not be considered as guidance for trading. RoboForex bears no responsibility for trading results based on trading recommendations described in these analytical reviews.