
Daily technical analysis and forecast for 29 May 2026
Here is a detailed daily technical analysis and forecast for EURUSD, USDJPY, GBPUSD, AUDUSD, USDCAD, XAUUSD, and Brent for 29 May 2026.
EURUSD forecast
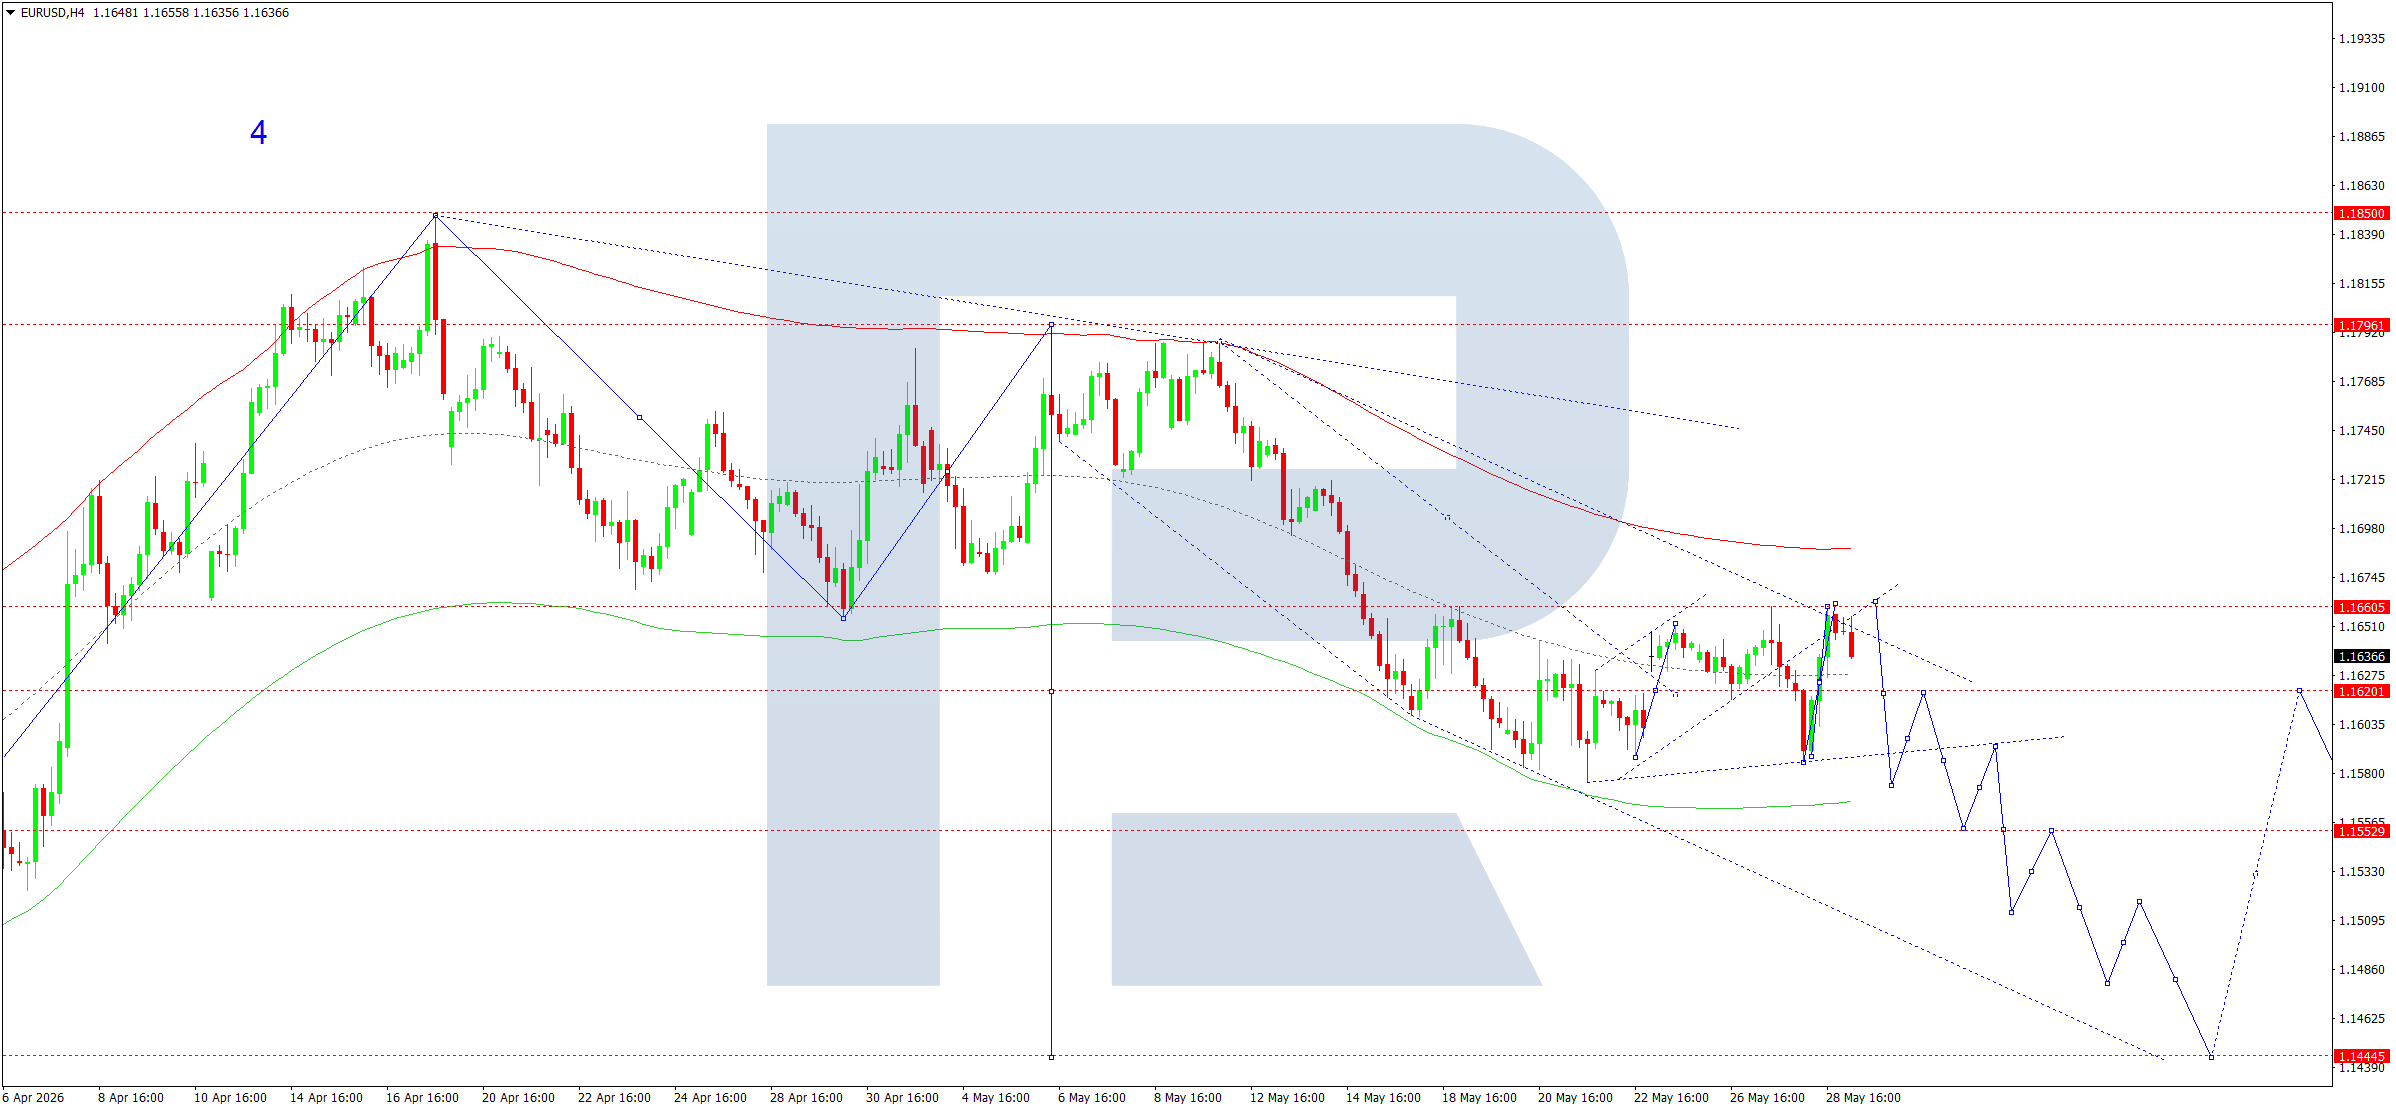
On the H4 chart of the EURUSD pair, the market continues to develop a wide consolidation range around 1.1621. At the moment, the range has expanded downwards to 1.1585 and upwards to 1.1660. Today, 29 May 2026, a decline to 1.1626 is expected. Subsequently, another upward move to 1.1666 is likely.
Technically, this scenario is confirmed by the indicated Elliott wave structure and the wave matrix with a pivot point at 1.1620. It is regarded as key within the structure of the downward wave for EURUSD. At the moment, the market is forming a consolidation range around the central line of the Price Envelope at 1.1620. The price is expected to rise to its upper boundary and decline to its lower boundary at 1.1570.
Technical indicators for today’s EURUSD forecast suggest the consolidation range could continue to develop around 1.1620, possibly expanding upwards to 1.1666 and downwards to 1.1530.
USDJPY forecast
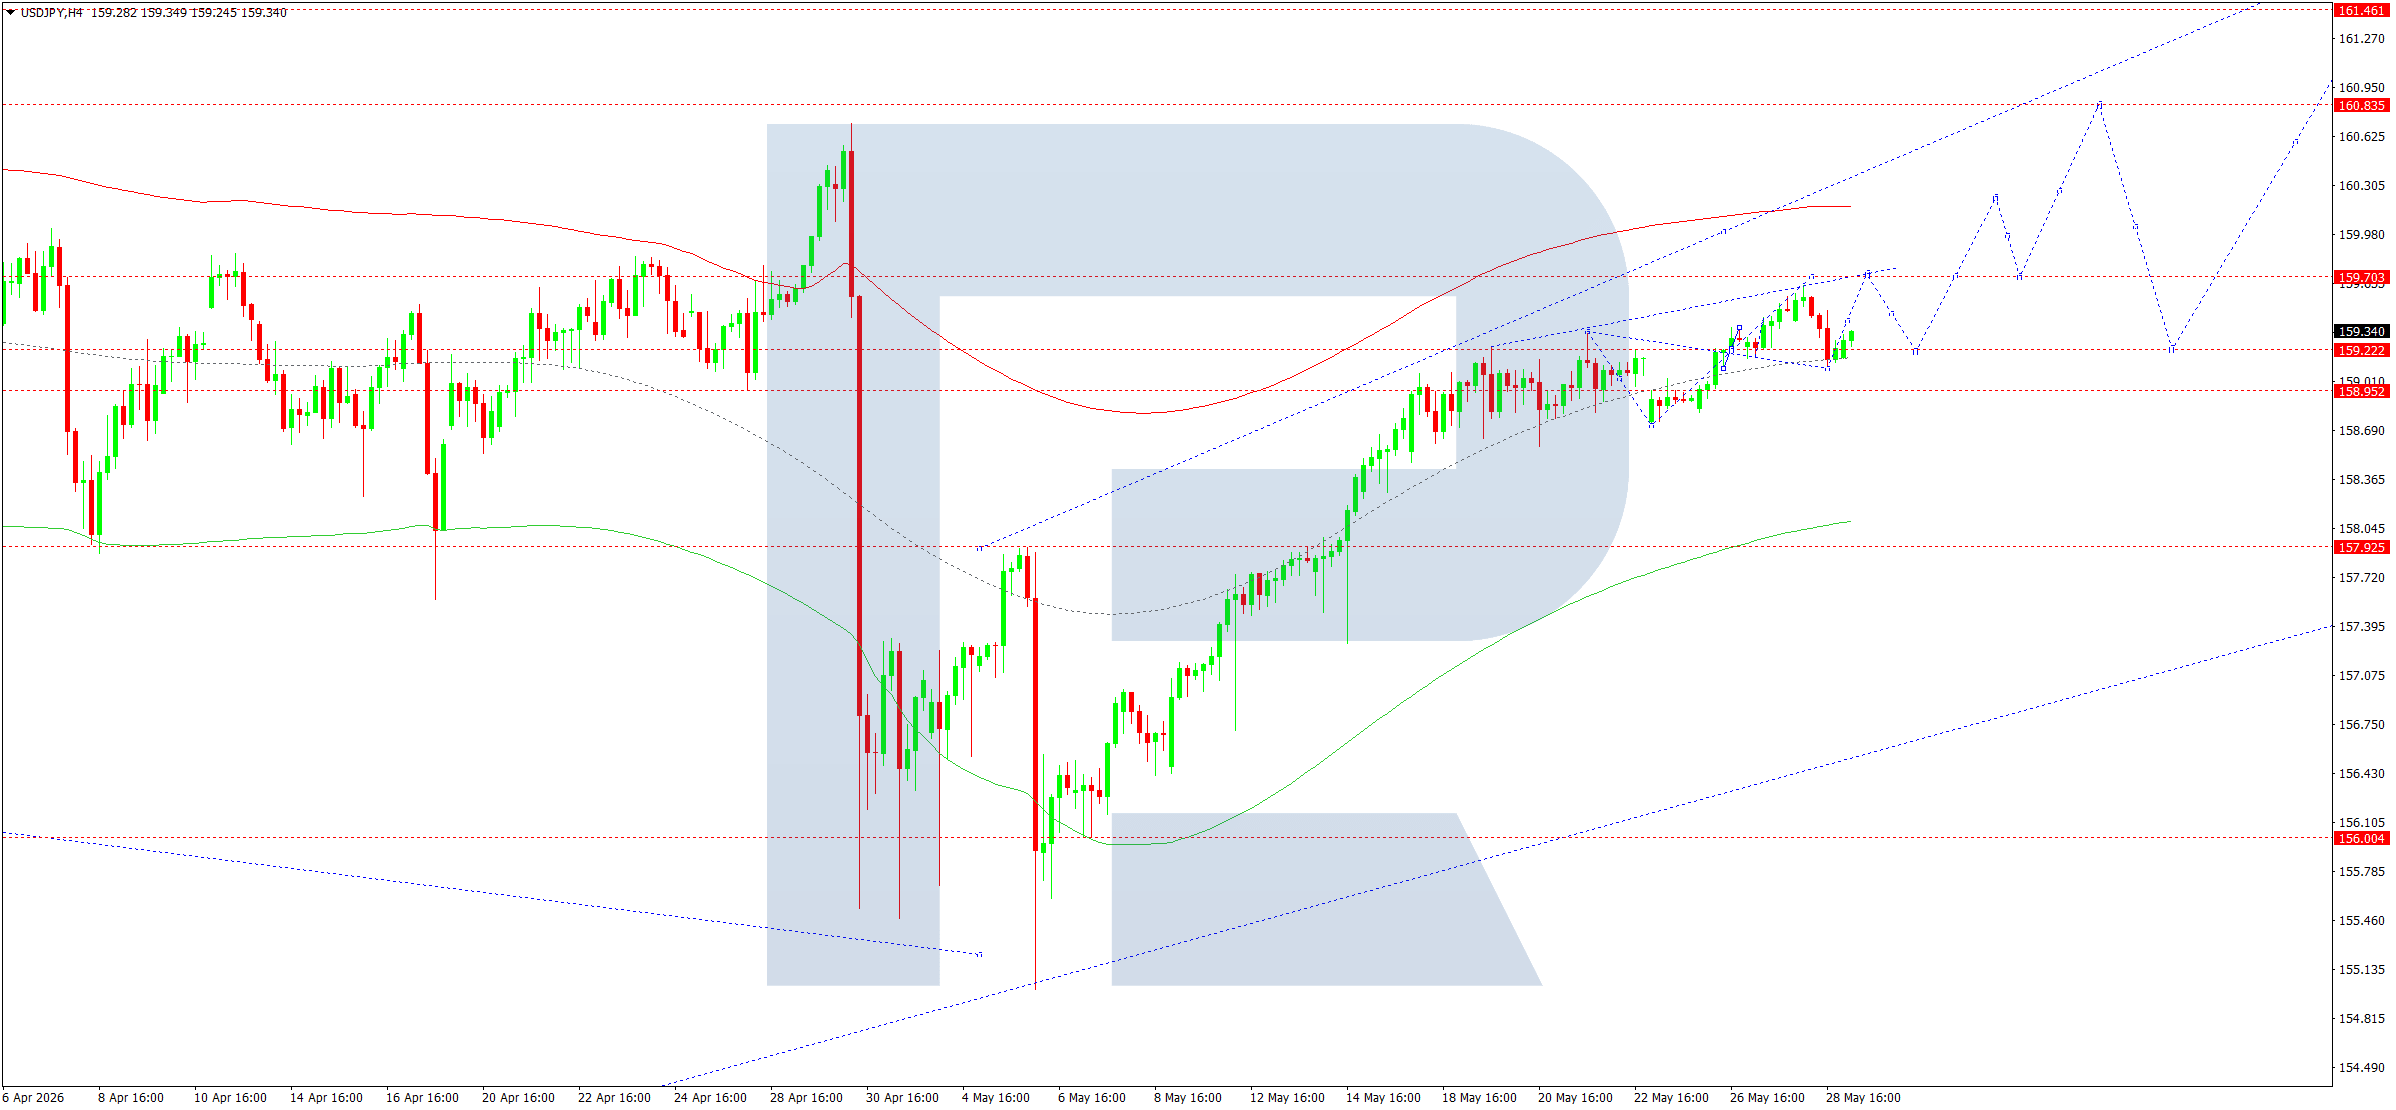
On the H4 chart of the USDJPY pair, the market completed a downward wave to 159.19. Today, 29 May 2026, a consolidation range has formed above this level. The range is expected to expand upwards to 159.70. Subsequently, a decline to 159.22 is anticipated. An upward breakout from the range would open the way towards 160.30, while a downward breakout could trigger a correction towards 159.00.
Technically, this scenario for USDJPY is confirmed by the indicated Elliott wave structure and the upward wave matrix with a pivot point at 159.10. It is regarded as key within this wave structure. At the moment, the market received support at 159.10 and is forming an upward wave towards the upper boundary of the Price Envelope at 159.70. Subsequently, a new consolidation range is expected to develop below this level. A downward breakout from the range would open the potential for a decline to 159.00. Alternatively, in case of an upward breakout, the trend could continue to 160.30.
Technical indicators for today’s USDJPY forecast suggest the upward wave could continue to 159.30.
GBPUSD forecast
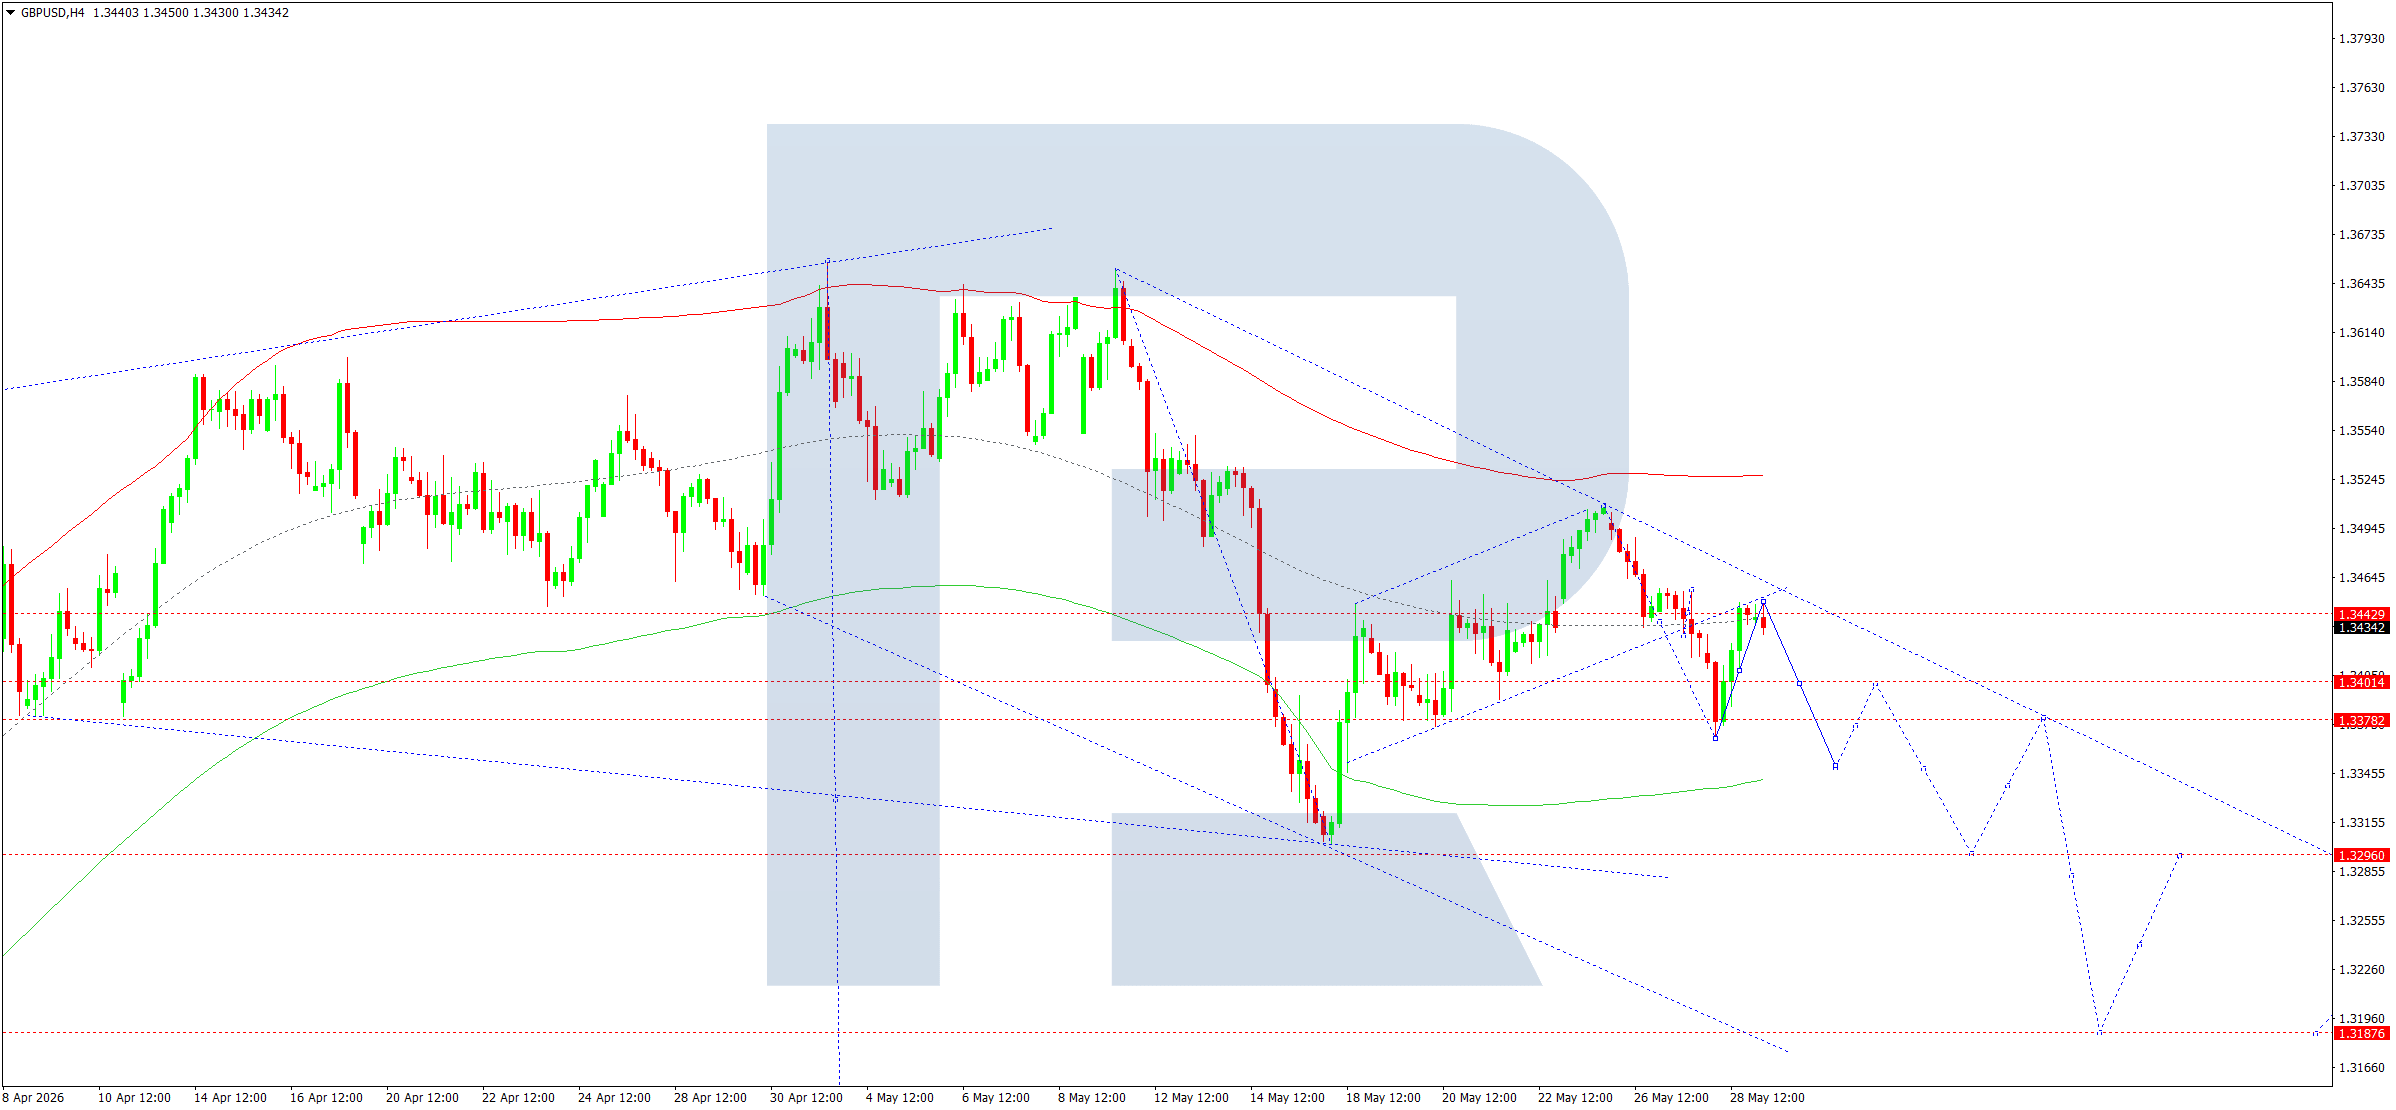
On the H4 chart of the GBPUSD pair, the market completed a downward wave to 1.3367. Today, 29 May 2026, the price is expected to correct towards 1.3444 and continue its decline to 1.3343. Subsequently, a consolidation range could form around this level. A breakout below this level would open the way towards 1.3290, while an upward breakout would expand the range to 1.3460. Then a decline along the trend to 1.3200 is expected.
Technically, this scenario for GBPUSD is confirmed by the indicated Elliott wave structure and the downward wave matrix with a pivot point at 1.3340. It is regarded as key within this wave structure. Today, a downward wave towards the lower boundary of the Price Envelope at 1.3344 is possible, followed by growth towards its central line at 1.3400.
Technical indicators for today’s GBPUSD forecast suggest a decline to 1.3344.
AUDUSD forecast
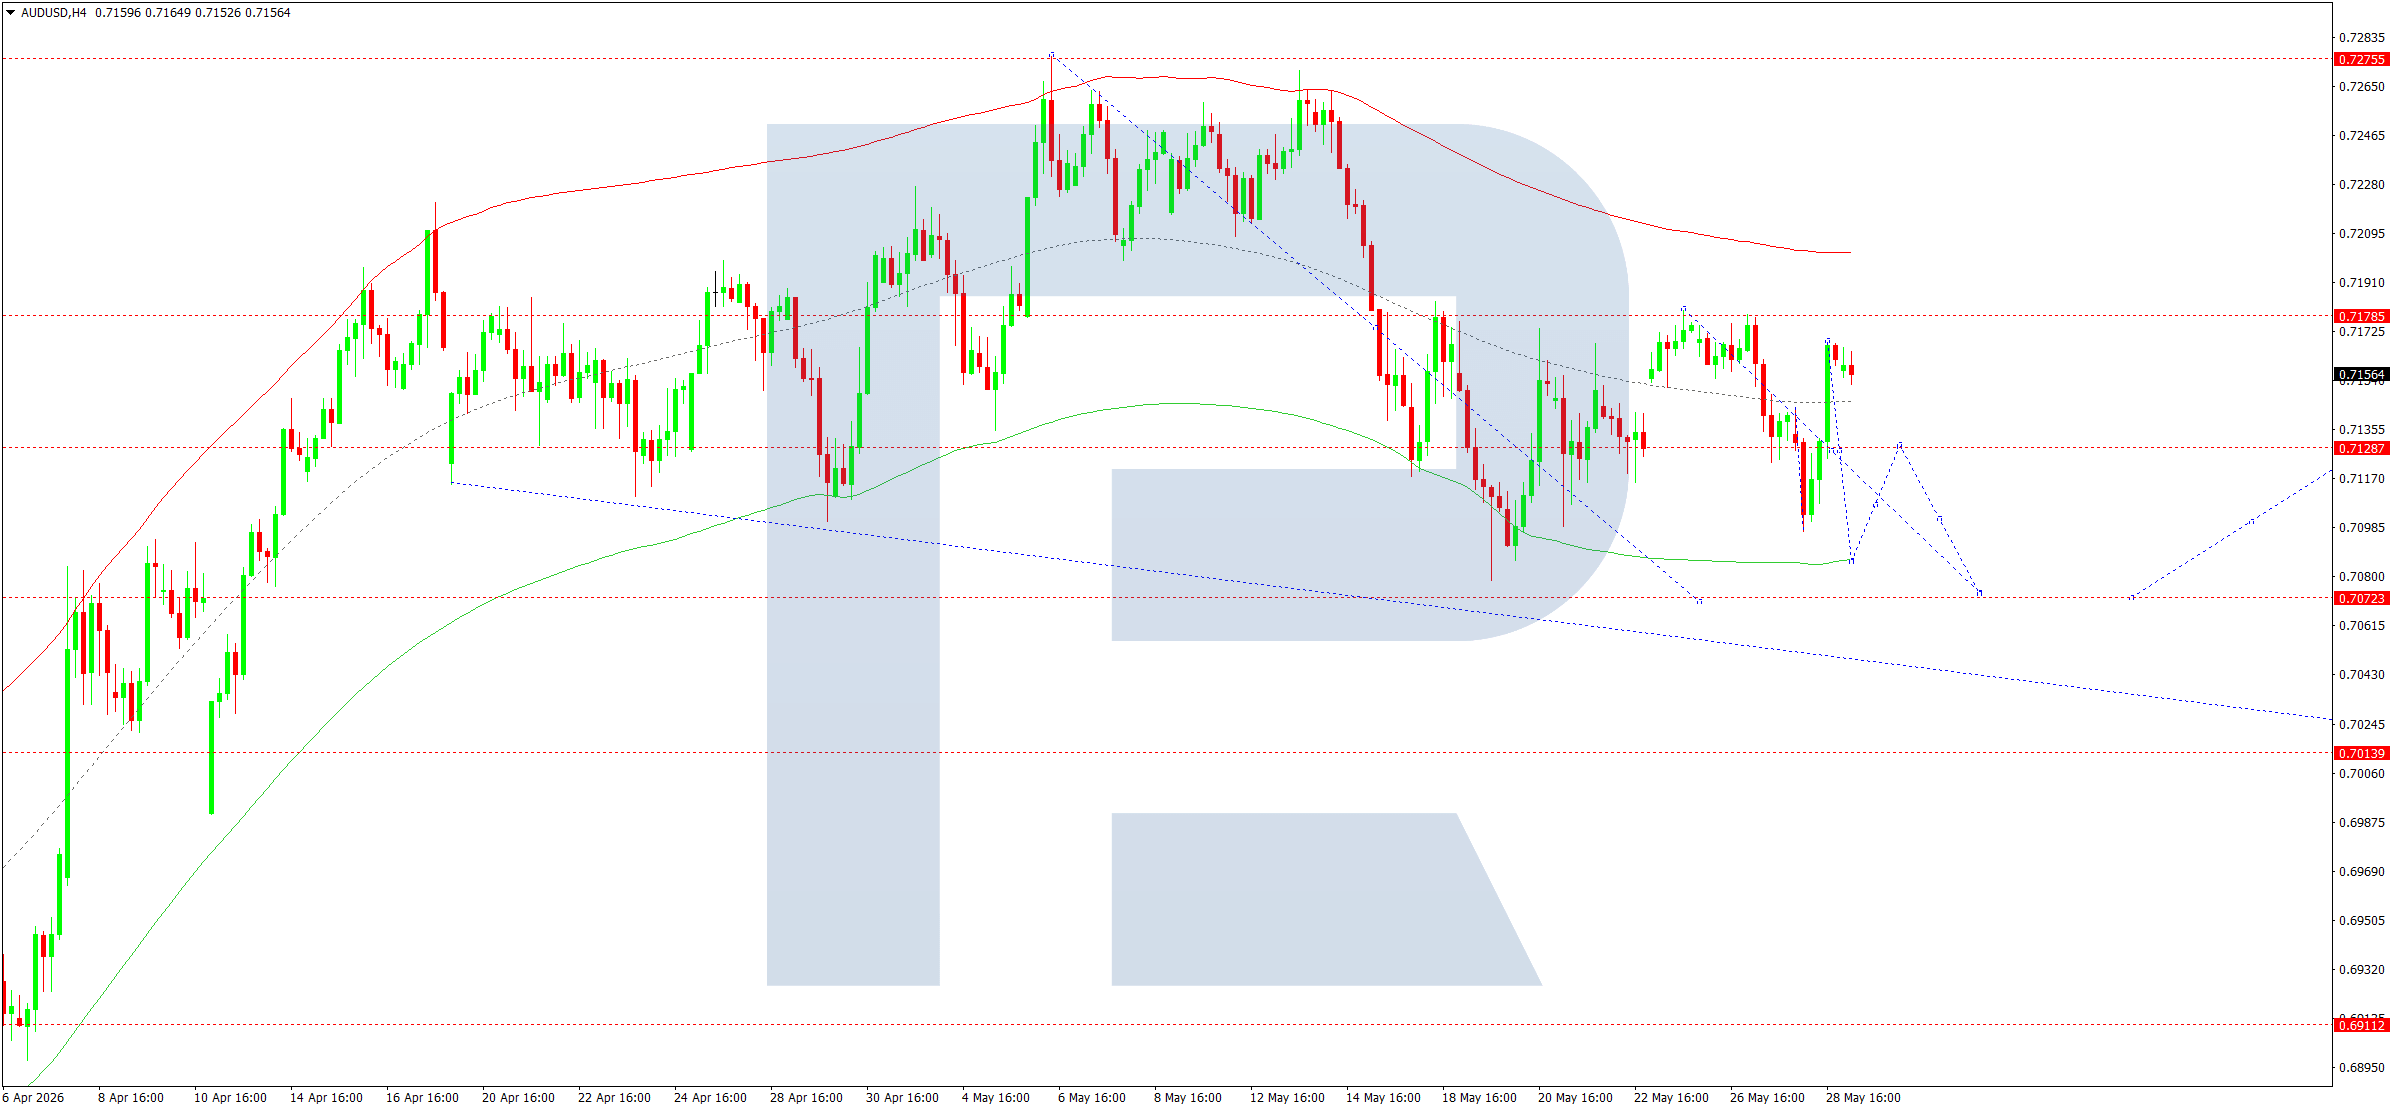
On the H4 chart of the AUDUSD pair, the market completed a downward wave to 0.7100 and an upward move to 0.7167. Today, 29 May 2026, a consolidation range is forming below this level. A downward wave is expected to begin, aiming for 0.7070 and possibly extending to 0.7030.
Technically, this scenario is confirmed by the indicated Elliott wave structure and the downward wave matrix for AUDUSD with a pivot point at 0.7200. It is regarded as key within this wave structure. At the moment, the market completed a downward wave to the central line of the Price Envelope at 0.7100. Subsequently, the price is expected to edge higher to 0.7181 before declining to its lower boundary at 0.7070.
Technical indicators for today’s AUDUSD forecast suggest a drop to 0.7070.
USDCAD forecast
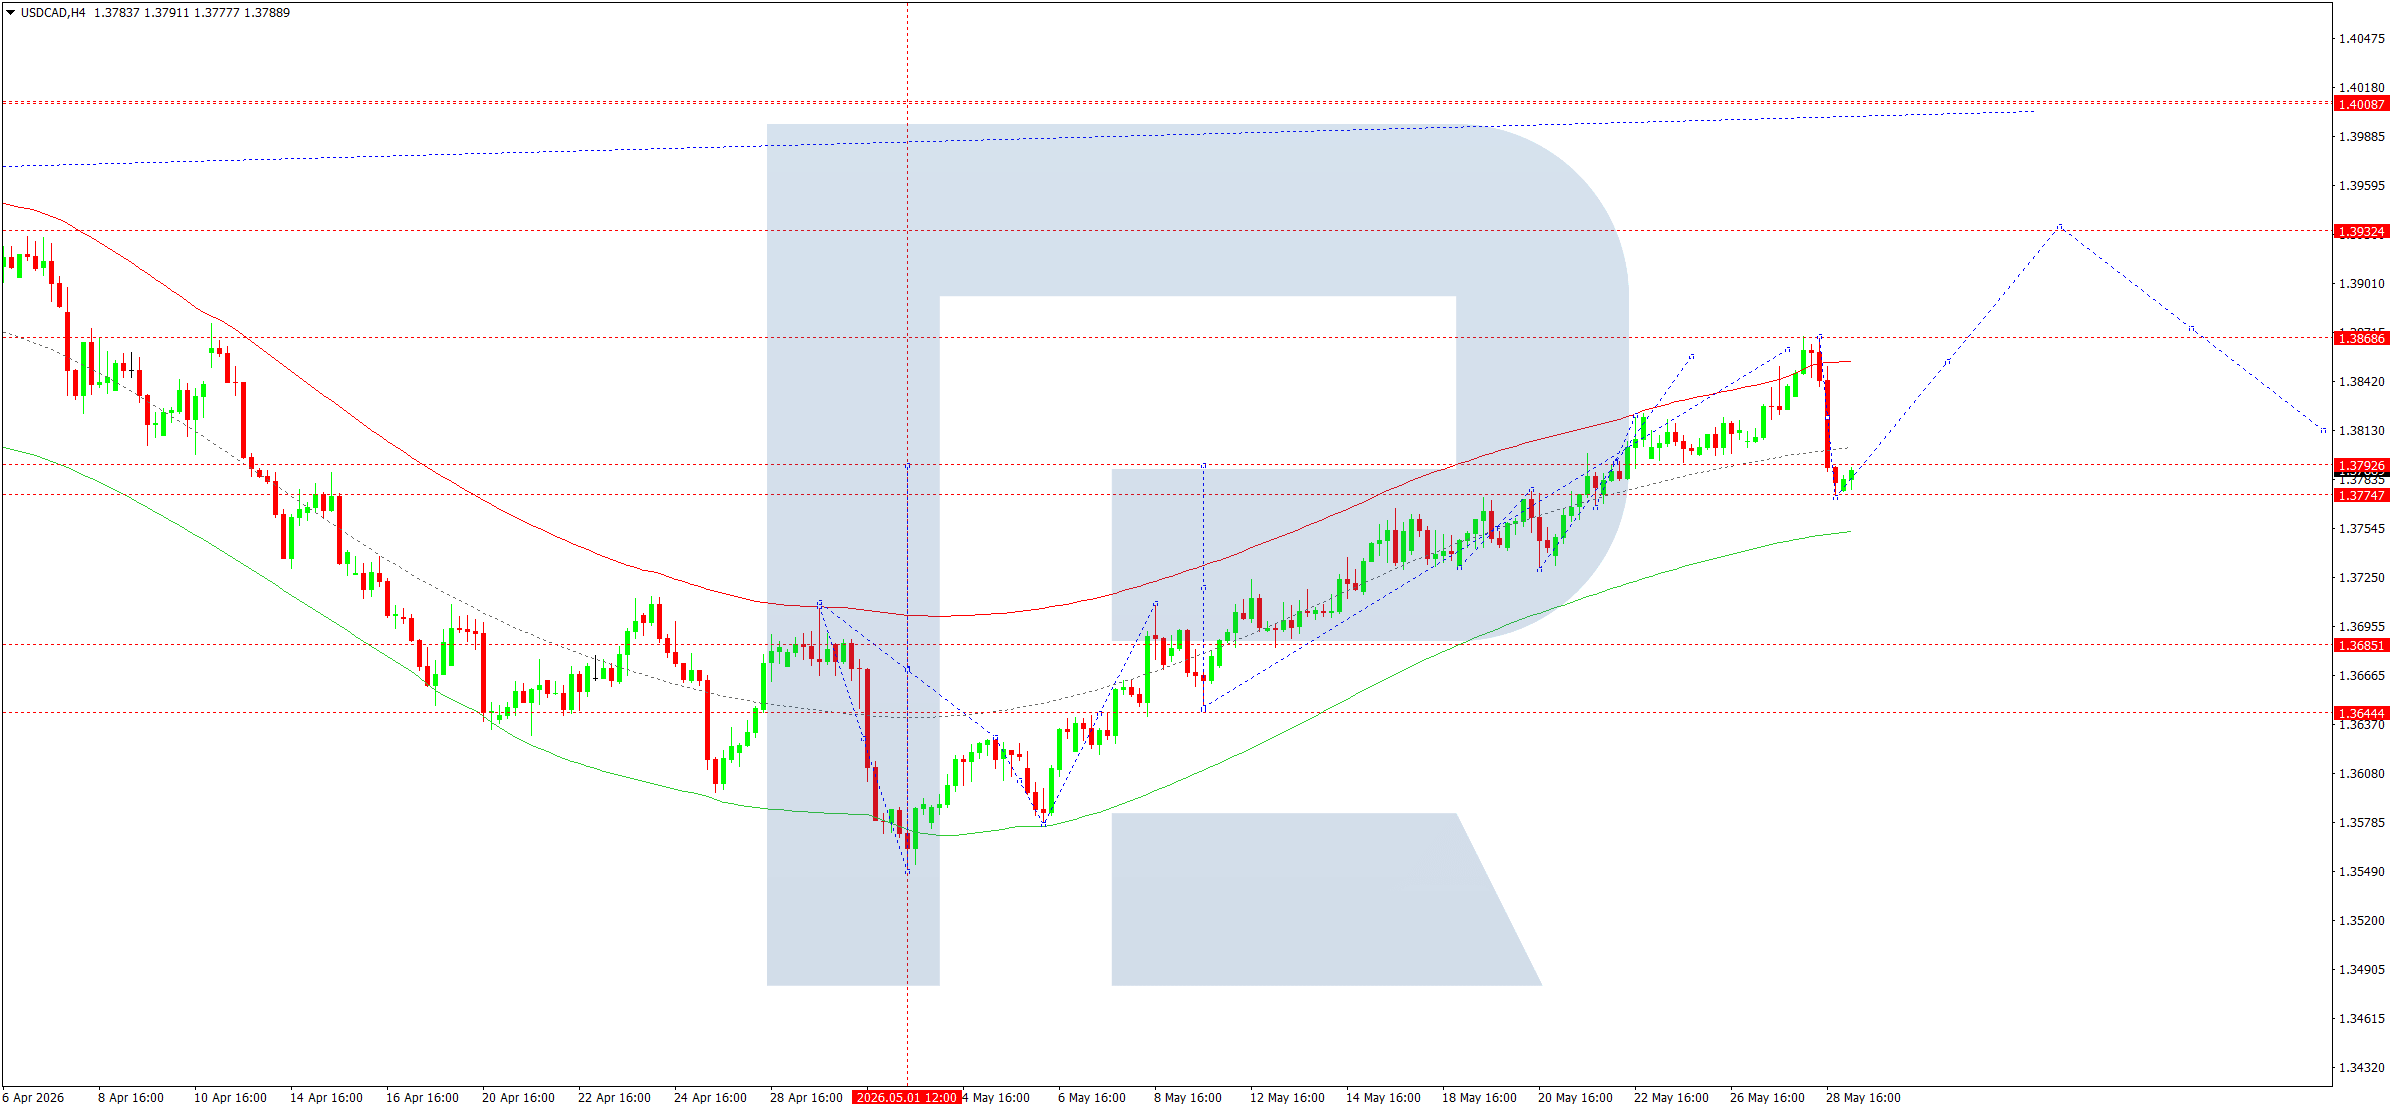
On the H4 chart of the USDCAD pair, the market continues to develop a consolidation range around 1.3775. Today, 29 May 2026, a downward move to 1.3752 cannot be ruled out, followed by growth to 1.3930. Subsequently, the price is expected to decline to 1.3788 before rising to 1.3940.
Technically, this scenario is confirmed by the indicated Elliott wave structure and the upward wave matrix with a pivot point at 1.3629. It is regarded as key for USDCAD within this growth wave structure. At the moment, the market is forming a downward wave structure towards the lower boundary of the Price Envelope at 1.3755. Subsequently, an upward move to its central line at 1.3800 is expected.
Technical indicators for today’s USDCAD forecast suggest a decline to 1.3755, followed by growth to 1.3800.
XAUUSD forecast
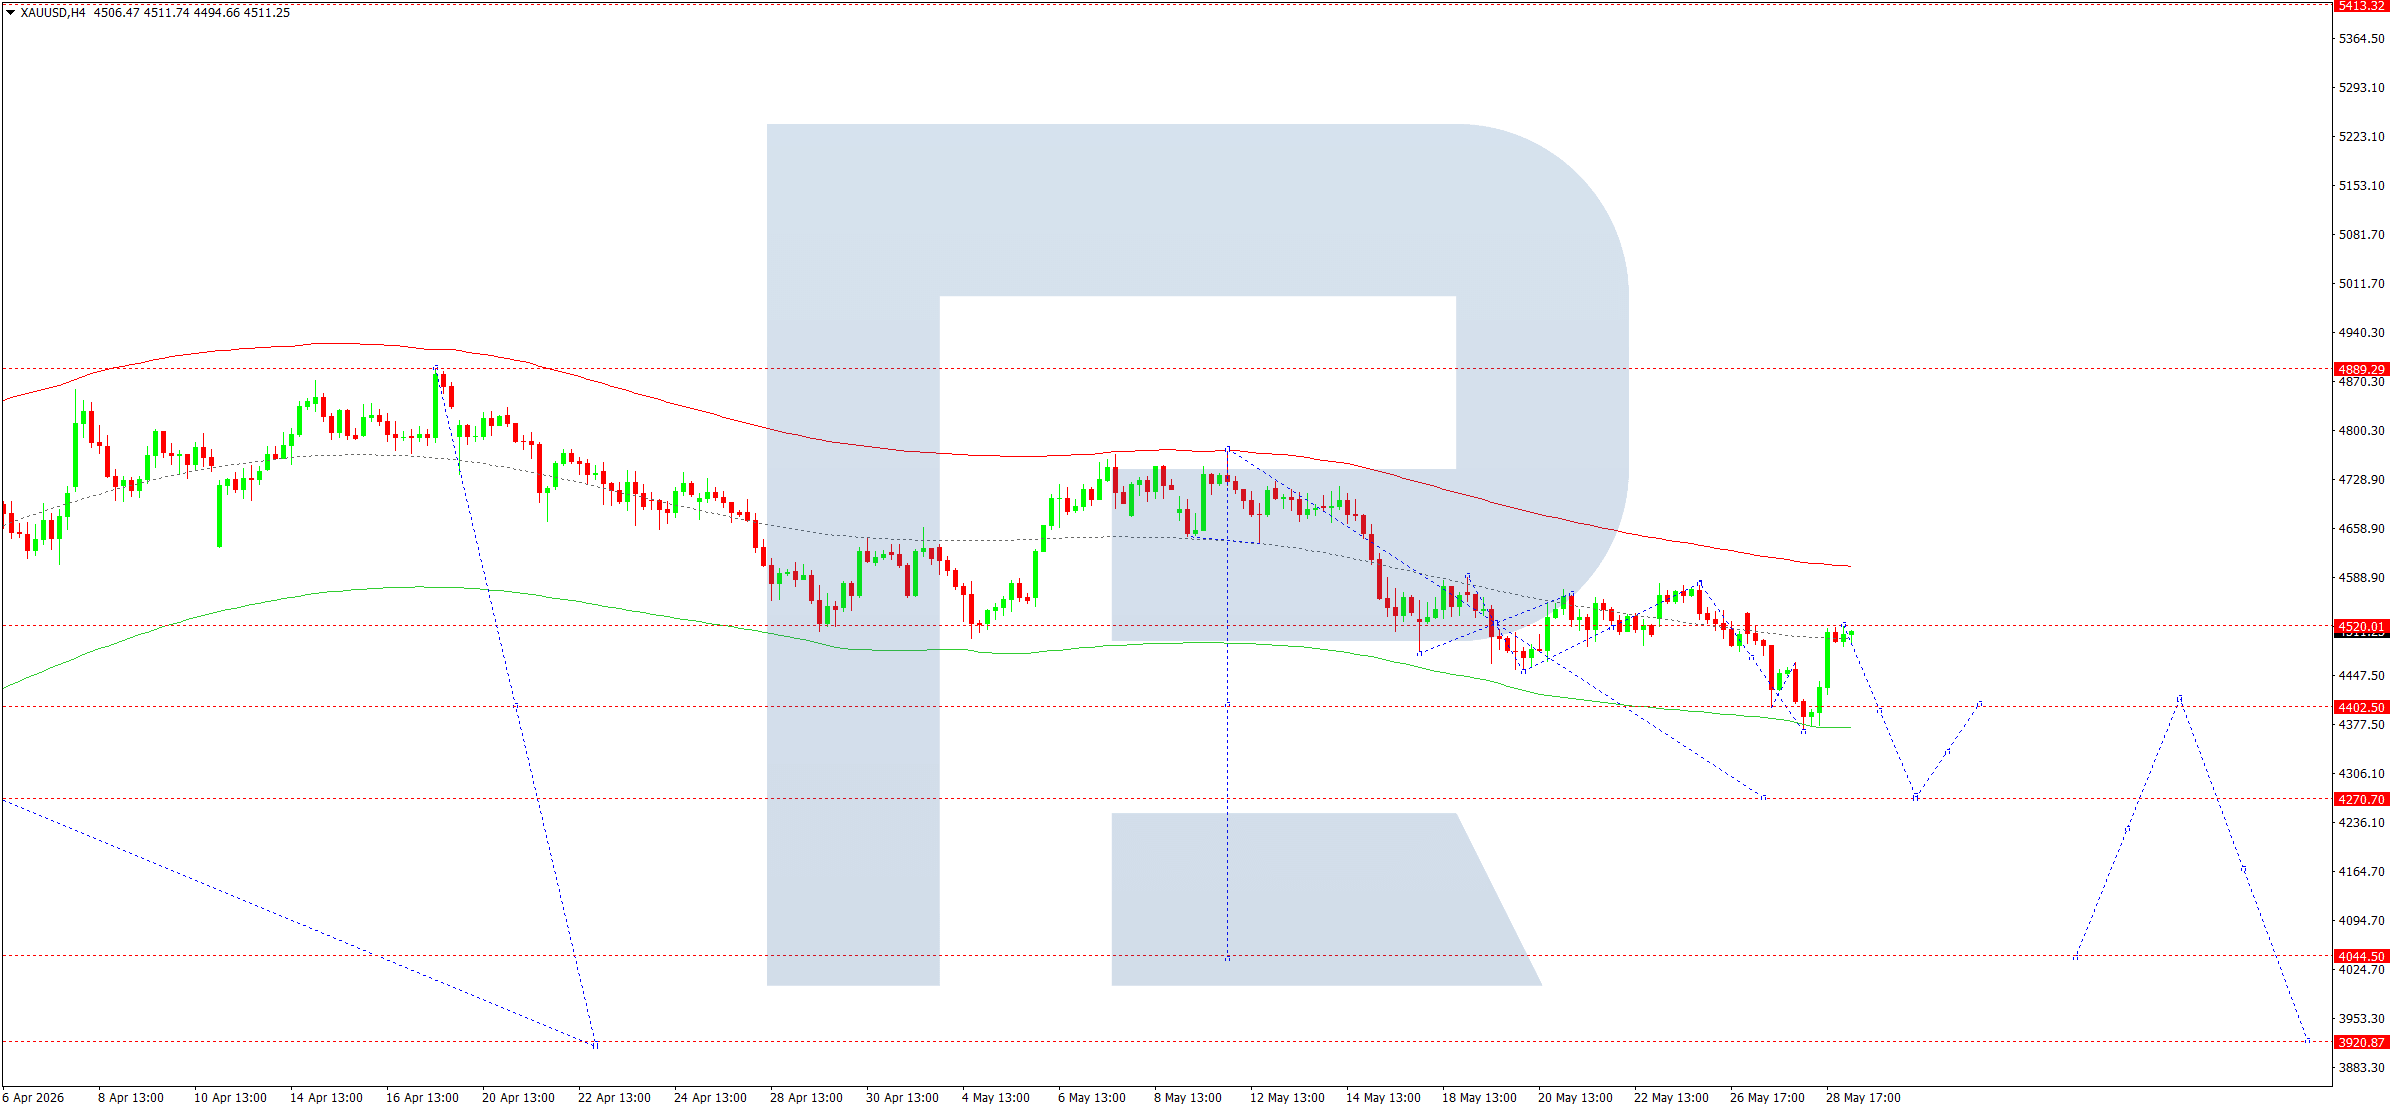
On the H4 chart of XAUUSD, the market formed a wide consolidation range around 4,520. Today, 29 May 2026, the range has expanded downwards to 4,366. Subsequently, prices are expected to advance to 4,520 before tumbling to 4,272.
Technically, this scenario is confirmed by the indicated Elliott wave structure and the downward wave matrix with a pivot point at 4,550. It is regarded as key for XAUUSD within this downward wave structure. At the moment, the market is forming a consolidation range around the central line of the Price Envelope at 4,520. In case of a downward breakout from the range, the downward wave is expected to continue to 4,350 and possibly further to 4,272.
Technical indicators for today’s XAUUSD forecast suggest a decline to 4,400.
Brent forecast
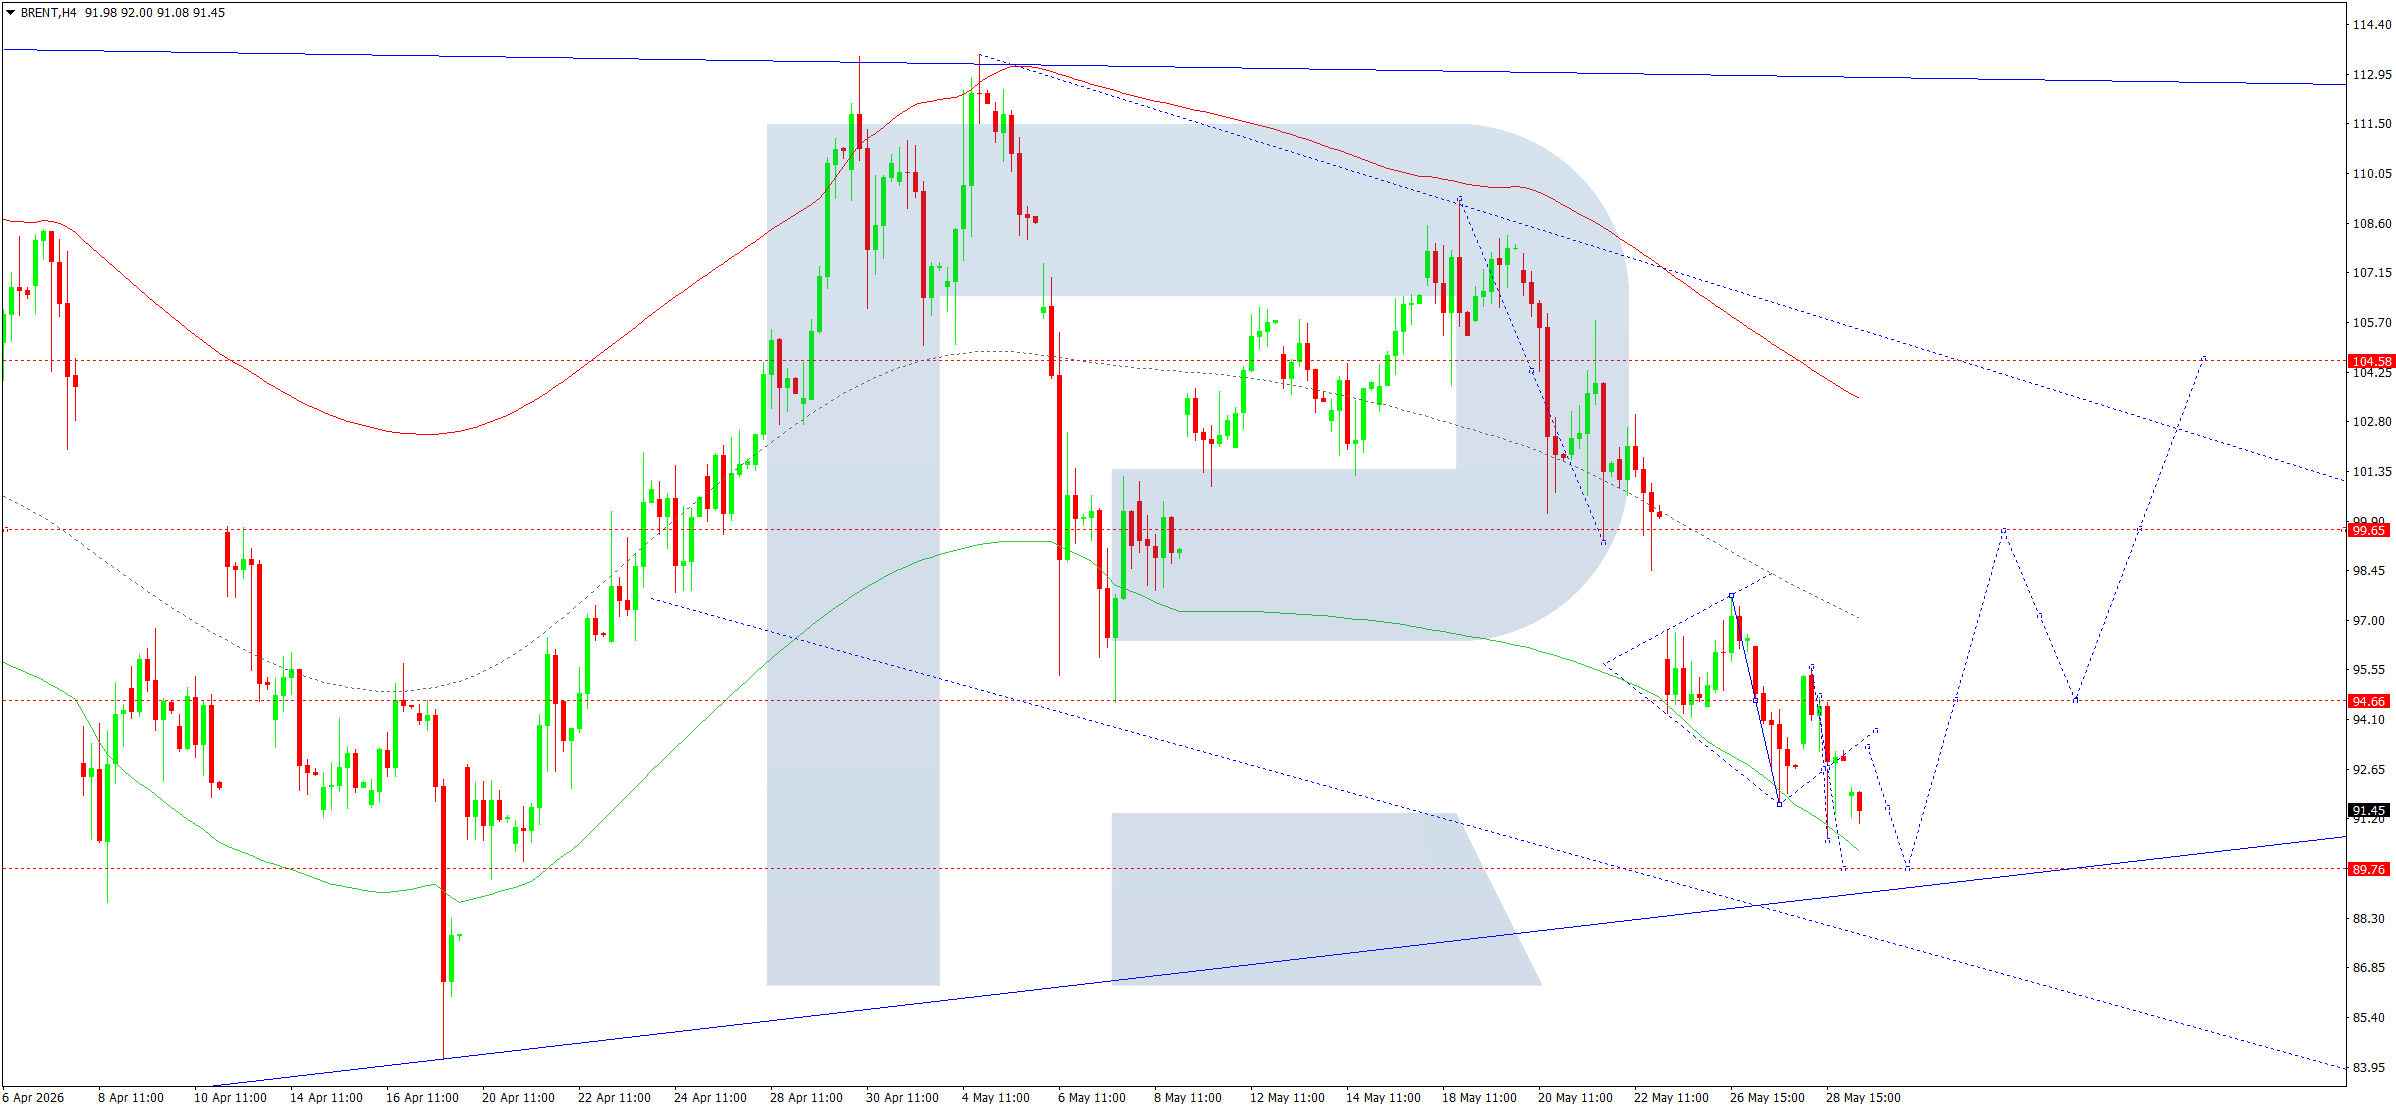
On the H4 chart of Brent crude oil, the market completed a downward wave to 90.60 and an upward wave to 93.15. Today, 29 May 2026, a downward move to 89.80 is likely. Subsequently, prices are expected to rise to 99.66, possibly climbing higher to 104.50.
Technically, this scenario is confirmed by the indicated Elliott wave structure and the upward wave matrix with a pivot point at 98.00. It is regarded as key for Brent within this wave structure. At the moment, the market is forming a consolidation range above the lower boundary of the Price Envelope at 90.60. Growth towards its upper boundary at 104.50 is expected.
Technical indicators for today’s Brent forecast suggest the beginning of growth to 104.50.
Editors’ picks
 EURUSD 2026-2027 forecast: key market trends and future predictions
This article provides the EURUSD forecast for 2026 and 2027 and highlights the main factors determining the direction of the pair’s movements. We will apply technical analysis, take into account the opinions of leading experts, large banks, and financial institutions, and study AI-based forecasts. This comprehensive insight into EURUSD predictions should help investors and traders make informed decisions.
 Gold (XAUUSD) forecast 2026 and beyond: expert insights, price predictions, and analysis
Dive deep into the Gold (XAUUSD) price outlook for 2026 and beyond, combining technical analysis, expert forecasts, and key macroeconomic factors. It explains the drivers behind gold’s recent surge, explores potential scenarios including a move toward 4,500 to 5,000 USD per ounce, and highlights why the metal remains a strong hedge during global uncertainty.
Forecasts presented in this section only reflect the author’s private opinion and should not be considered as guidance for trading. RoboForex bears no responsibility for trading results based on trading recommendations described in these analytical reviews.