
Daily technical analysis and forecast for 12 August 2026
Daily technical analysis and forecast for EURUSD, USDJPY, GBPUSD, AUDUSD, USDCAD, XAUUSD, US 500, and BTCUSD for 12 August 2026.
EURUSD forecast
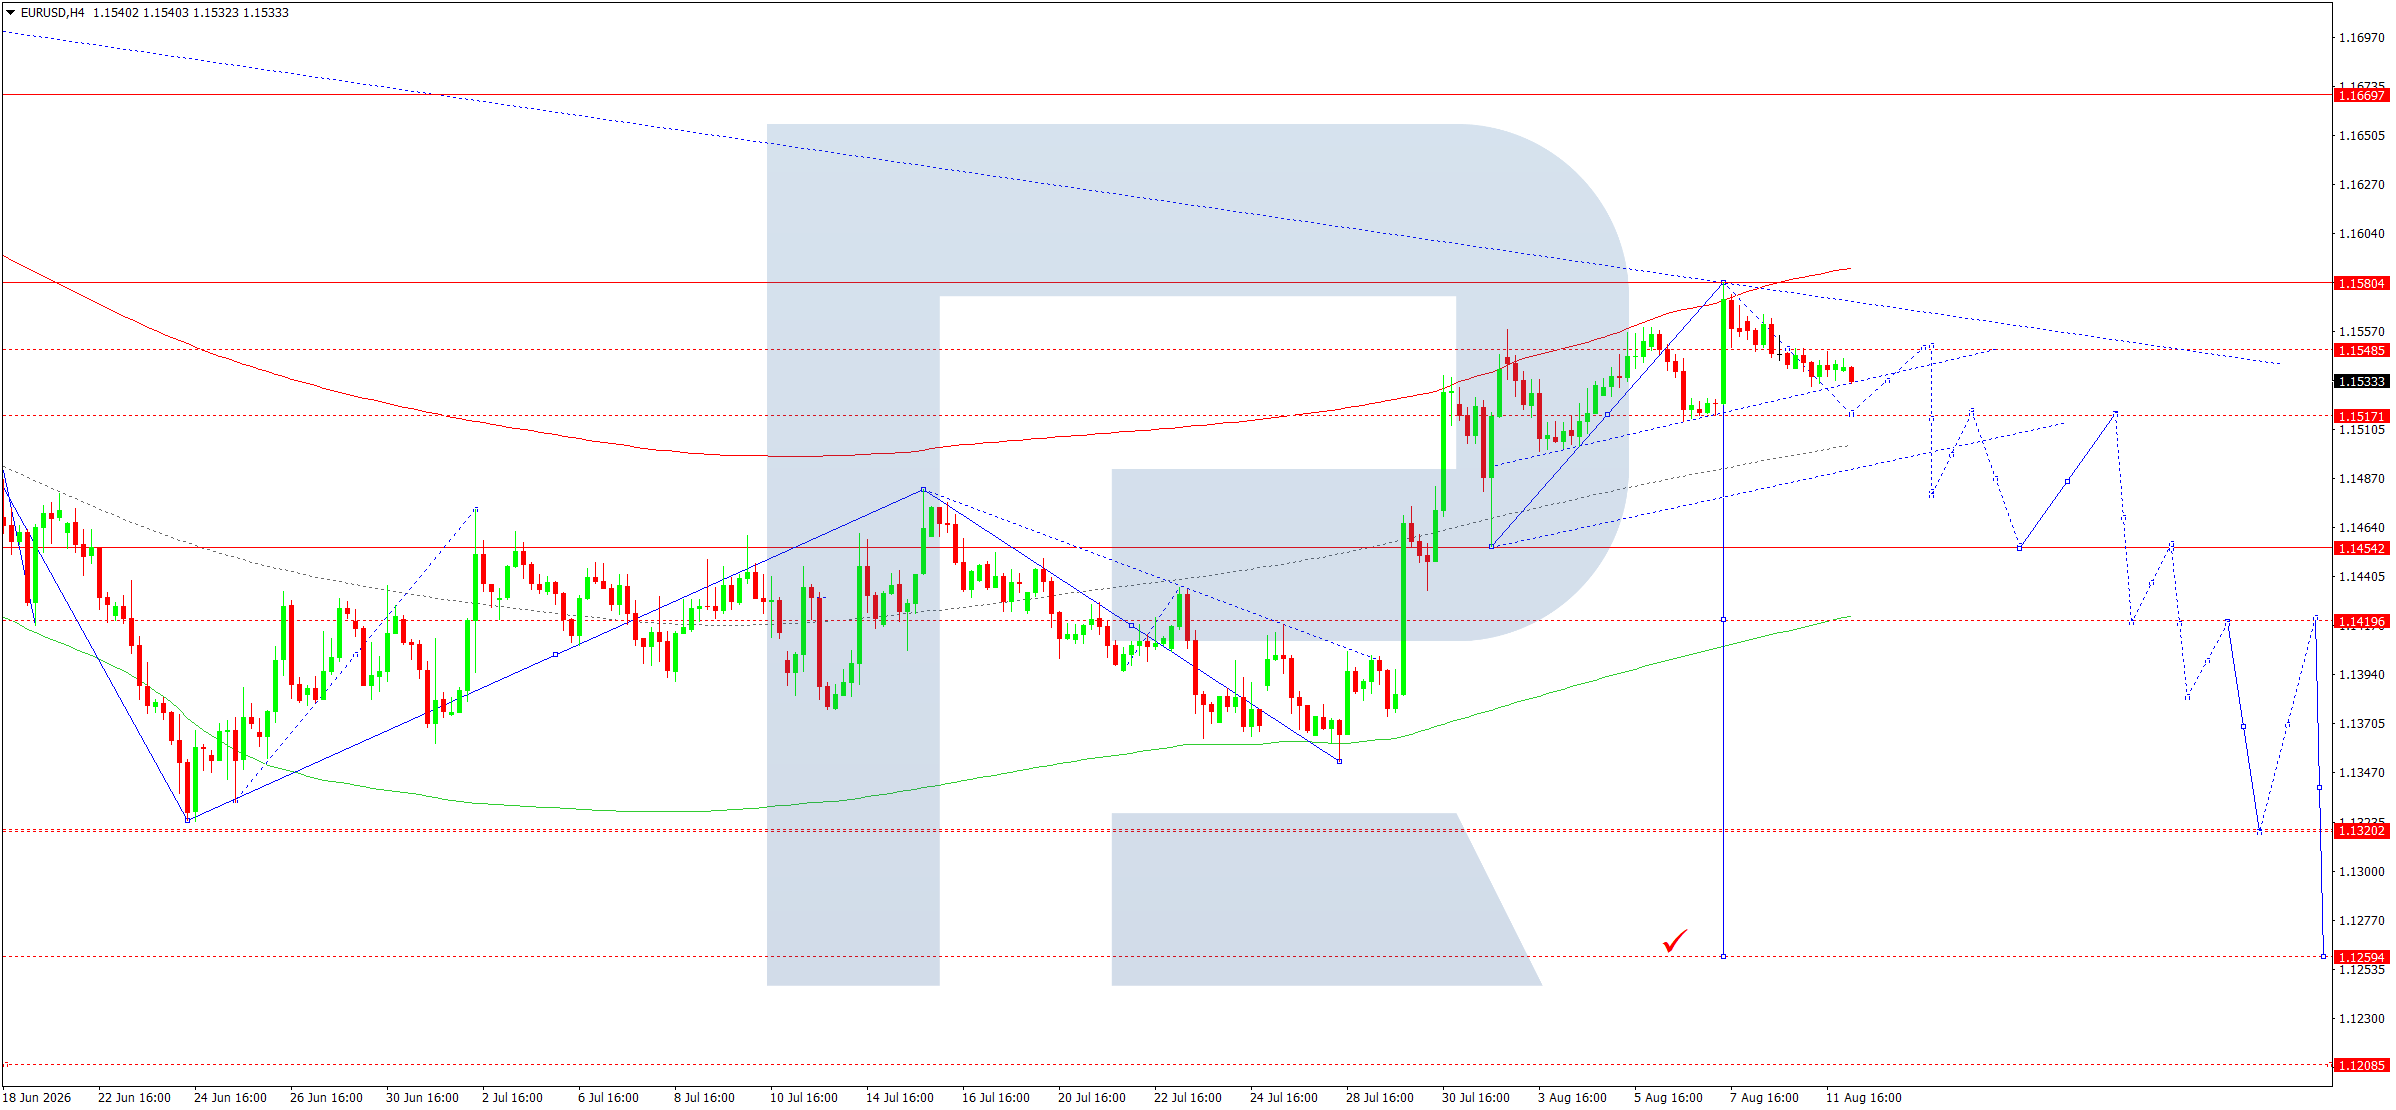
On the H4 chart, the EURUSD pair completed an upward wave towards 1.1545, testing the level from below. Today, 12 August 2026, the market is forming a consolidation range below this level. An upward breakout would open the way for a rally towards 1.1580. In contrast, a downward breakout could trigger a further decline towards 1.1500, with the downward wave potentially extending to 1.1455, a local target.
Technically, this scenario is confirmed by the Elliott wave structure and the wave matrix with a pivot point at 1.1680, a key level in the current EURUSD downward wave. The market has formed a consolidation range below the upper boundary of the Price Envelope at 1.1579. A downward breakout is expected to trigger a downward wave towards its central line at 1.1515. A breakout below this level could extend the decline towards 1.1455.
Technical indicators for today's EURUSD forecast suggest a decline towards 1.1515.
USDJPY forecast
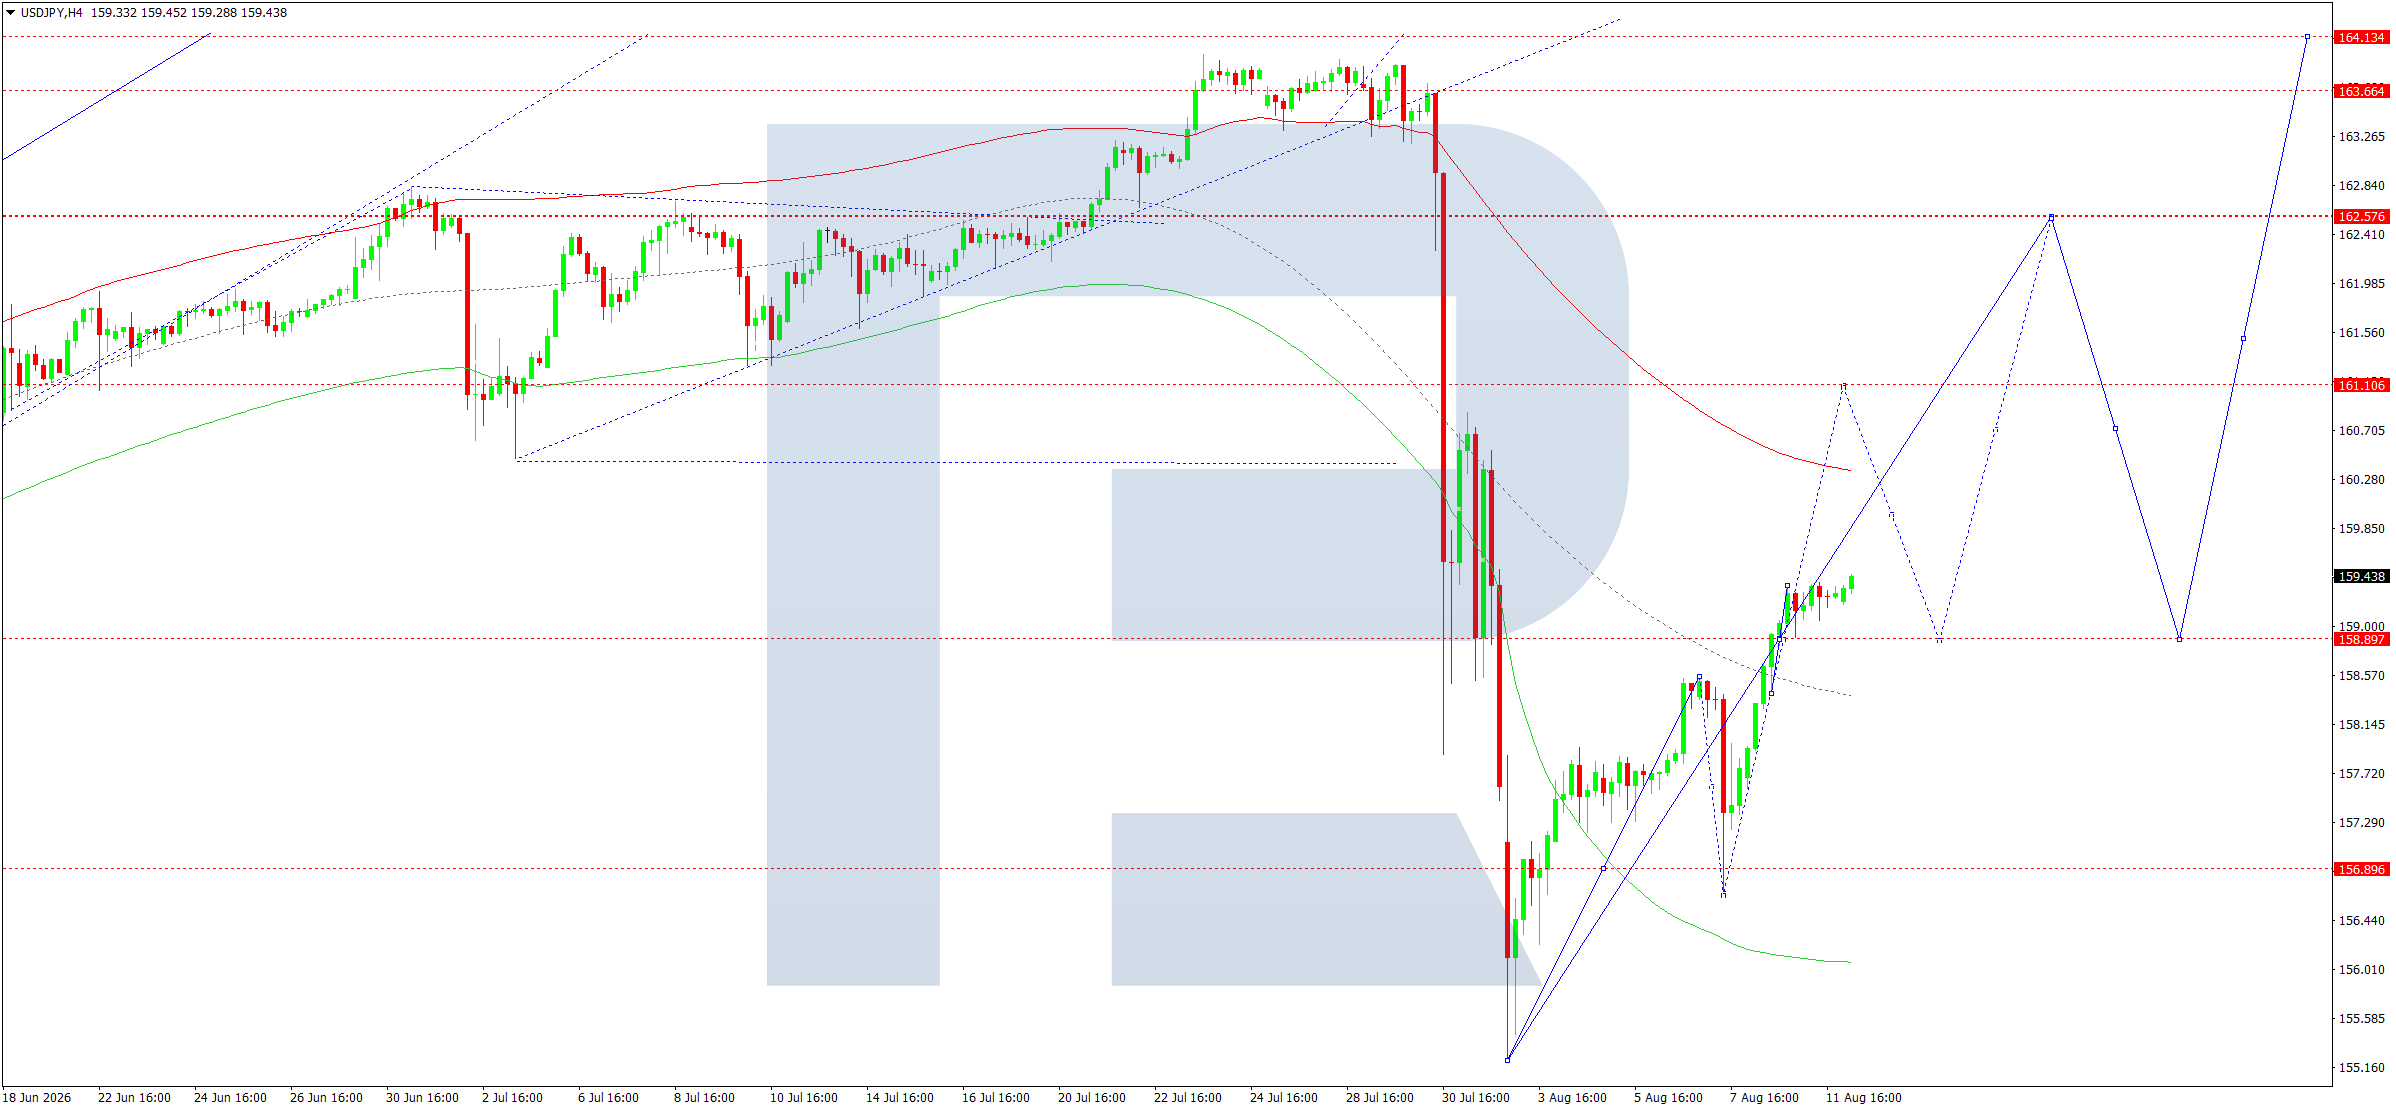
On the H4 chart, the USDJPY pair broke above 158.88. Today, 12 August 2026, a consolidation range is likely to form around this level. A downward breakout could trigger a correction towards 158.00, while an upward breakout would open the door for a continued move towards 161.10, a local target.
Technically, this scenario for USDJPY is confirmed by the Elliott wave structure and the upward wave matrix with a pivot point at 159.10, a key level in the current wave. The market is currently forming a consolidation range around the central line of the Price Envelope at 158.88. An upward breakout is expected today, opening the way for a rally towards its upper boundary at 161.10.
Technical indicators for today's USDJPY forecast suggest a rise towards 161.10.
GBPUSD forecast
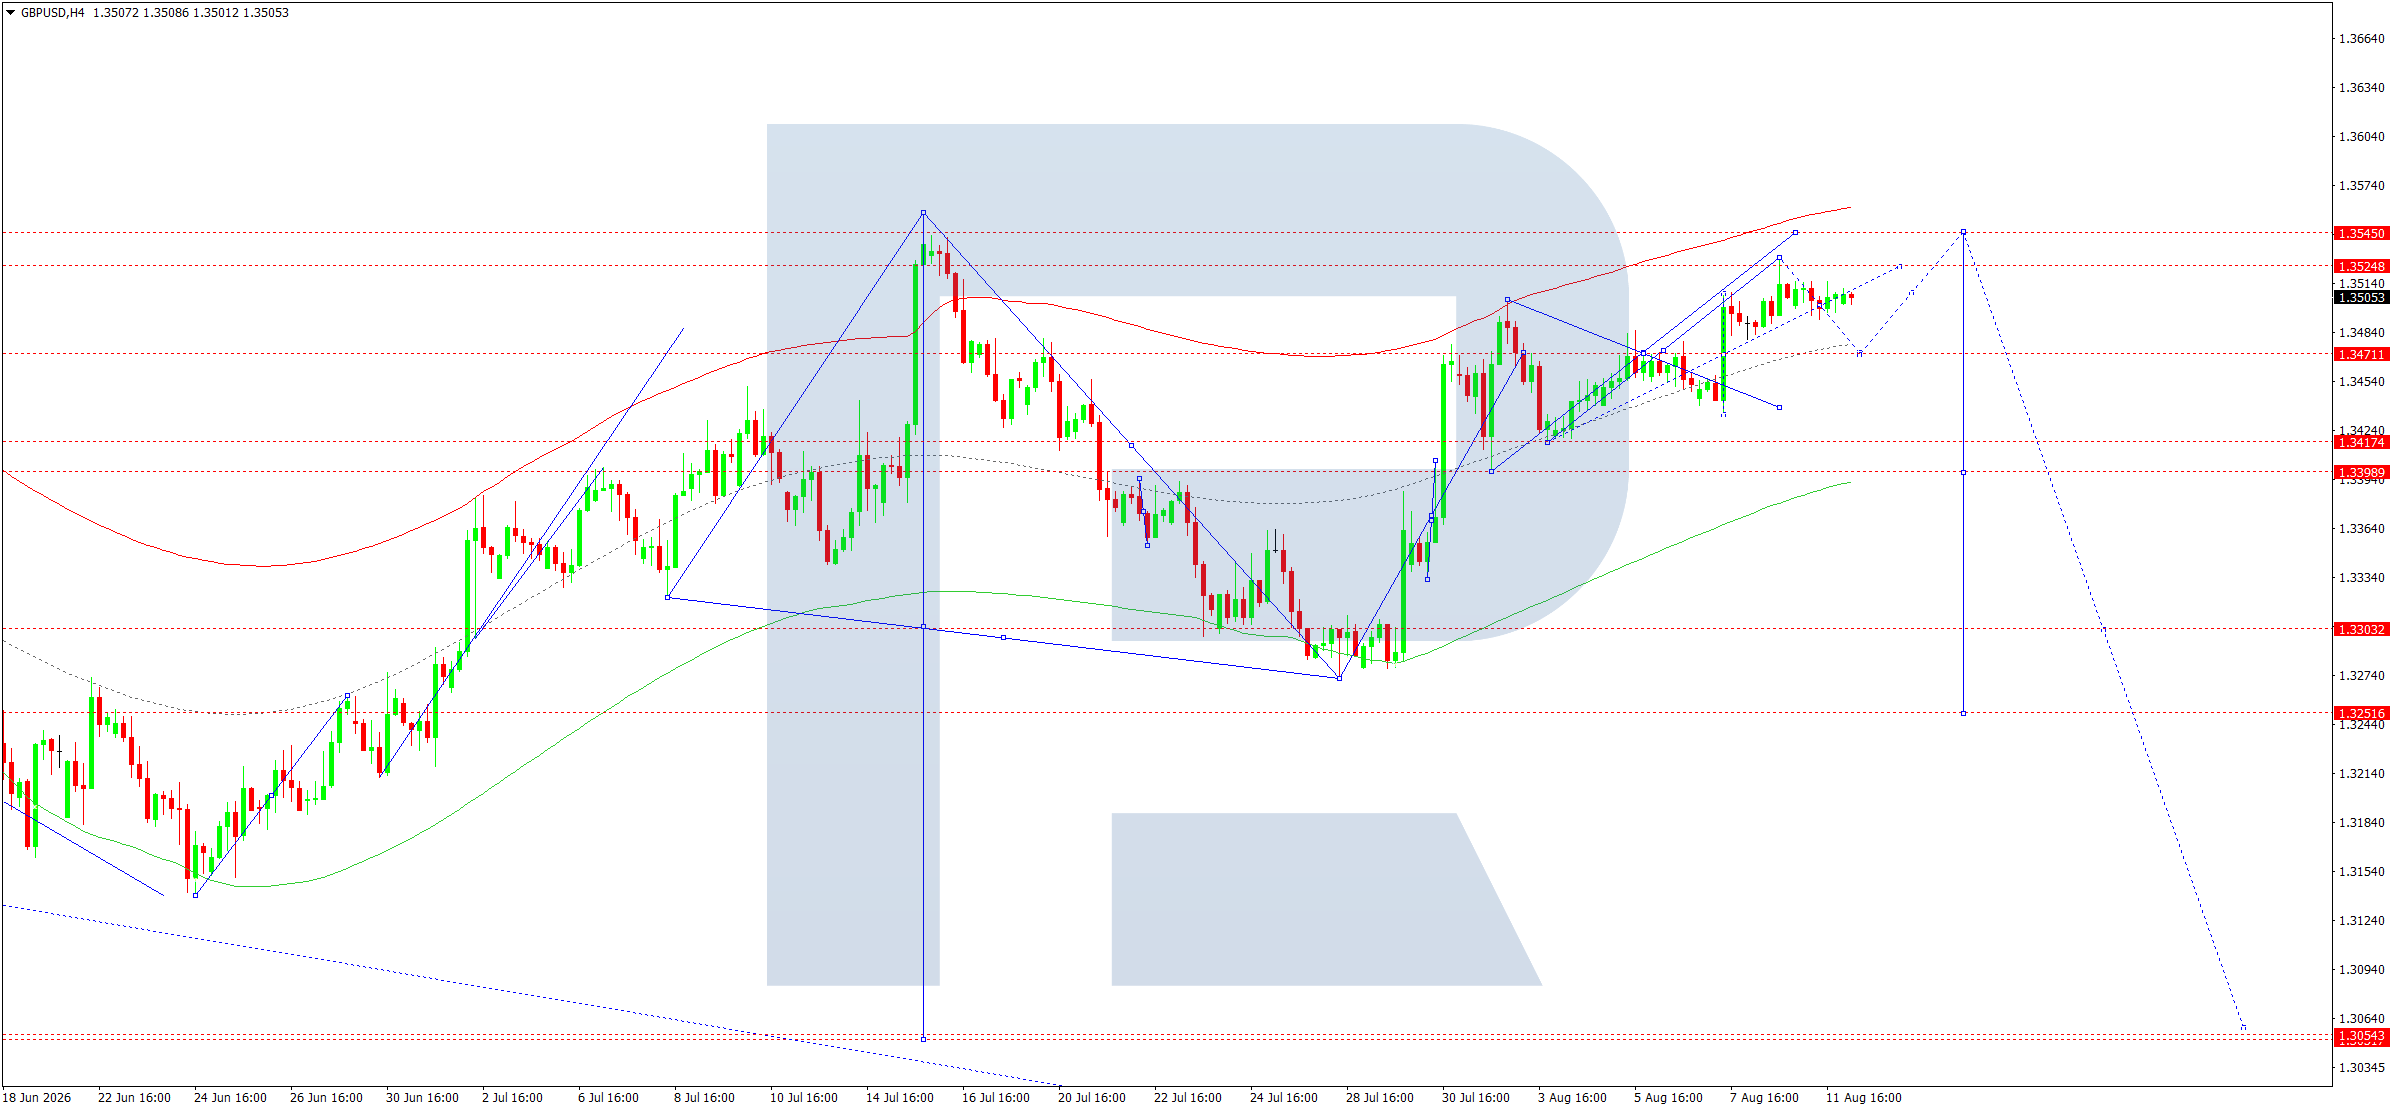
On the H4 chart, the GBPUSD pair completed a downward wave towards 1.3490. Today, 12 August 2026, the market is expected to form a consolidation range around this level. An upward breakout could trigger a correction towards 1.3545, followed by a decline towards 1.3470, with the downtrend potentially extending to 1.3300, a local target.
Technically, this scenario for GBPUSD is confirmed by the Elliott wave structure and the downward wave matrix with a pivot point at 1.3300, a key level in the current wave. Today, the market is forming a downward wave towards the central line of the Price Envelope at 1.3470. A consolidation range is then expected to develop above this level, followed by a potential decline towards 1.3440.
Technical indicators for today's GBPUSD forecast suggest a downward wave could begin towards 1.3440.
AUDUSD forecast
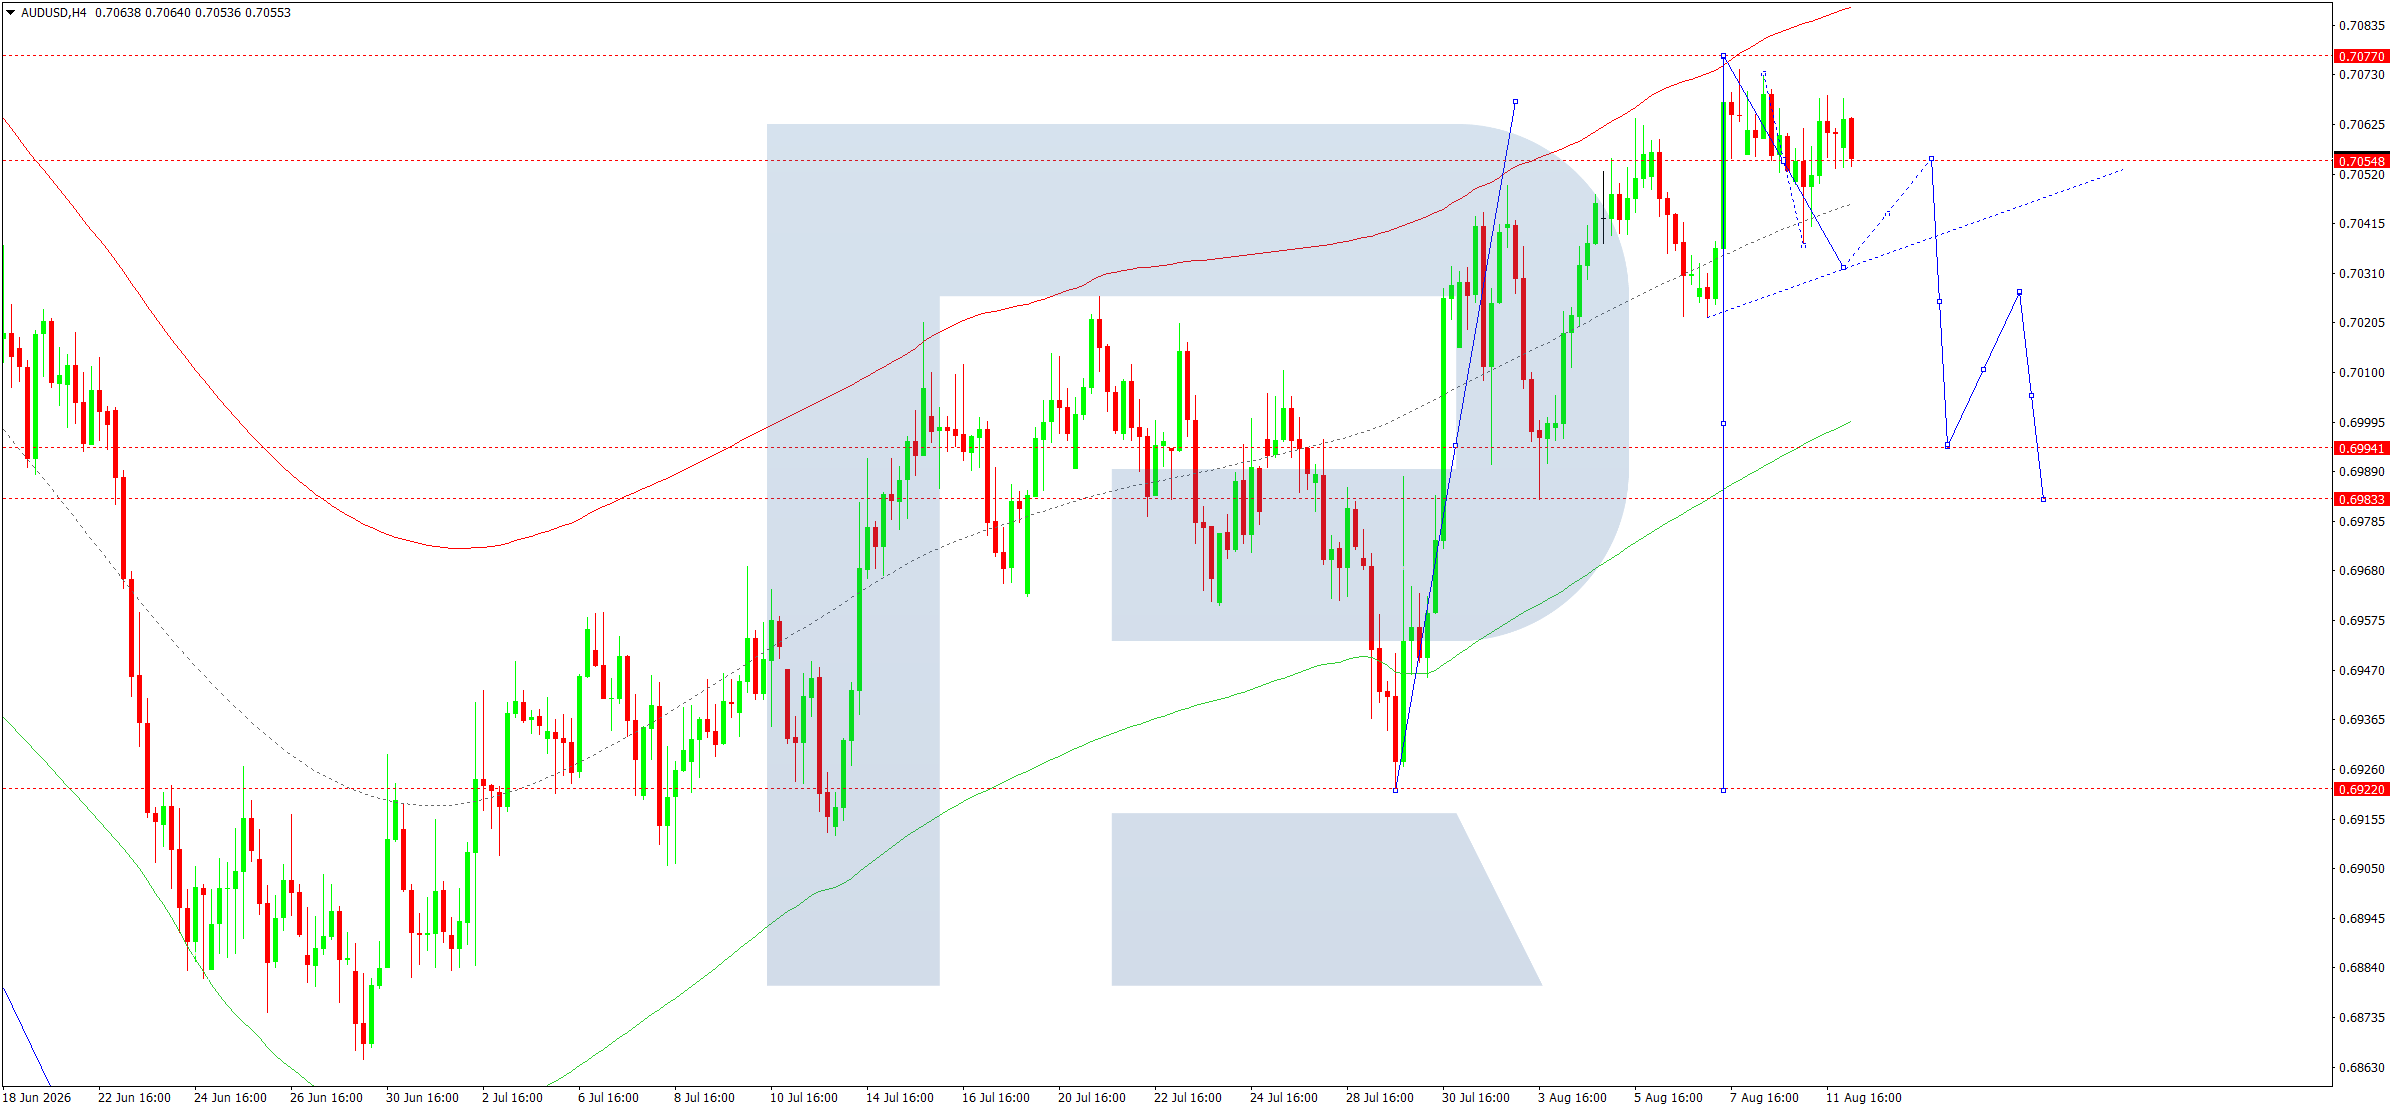
On the H4 chart, the AUDUSD pair is developing a downward wave towards 0.7030. Today, 12 August 2026, the market is expected to form a consolidation range above this level. An upward breakout would pave the way for a rally towards 0.7077, while a downward breakout could push the price down to 0.7000 and then 0.6922.
Technically, this scenario is confirmed by the Elliott wave structure and the downward wave matrix with a pivot point at 0.7200, a key level in the current wave for AUDUSD. The market is currently developing a downward wave towards the central line of the Price Envelope at 0.7050, with a consolidation range effectively forming above it. A rebound towards 0.7077 is possible, followed by the beginning of a downward wave towards its lower boundary at 0.6922.
Technical indicators for today's AUDUSD forecast suggest a downward wave could begin, targeting 0.6922.
USDCAD forecast
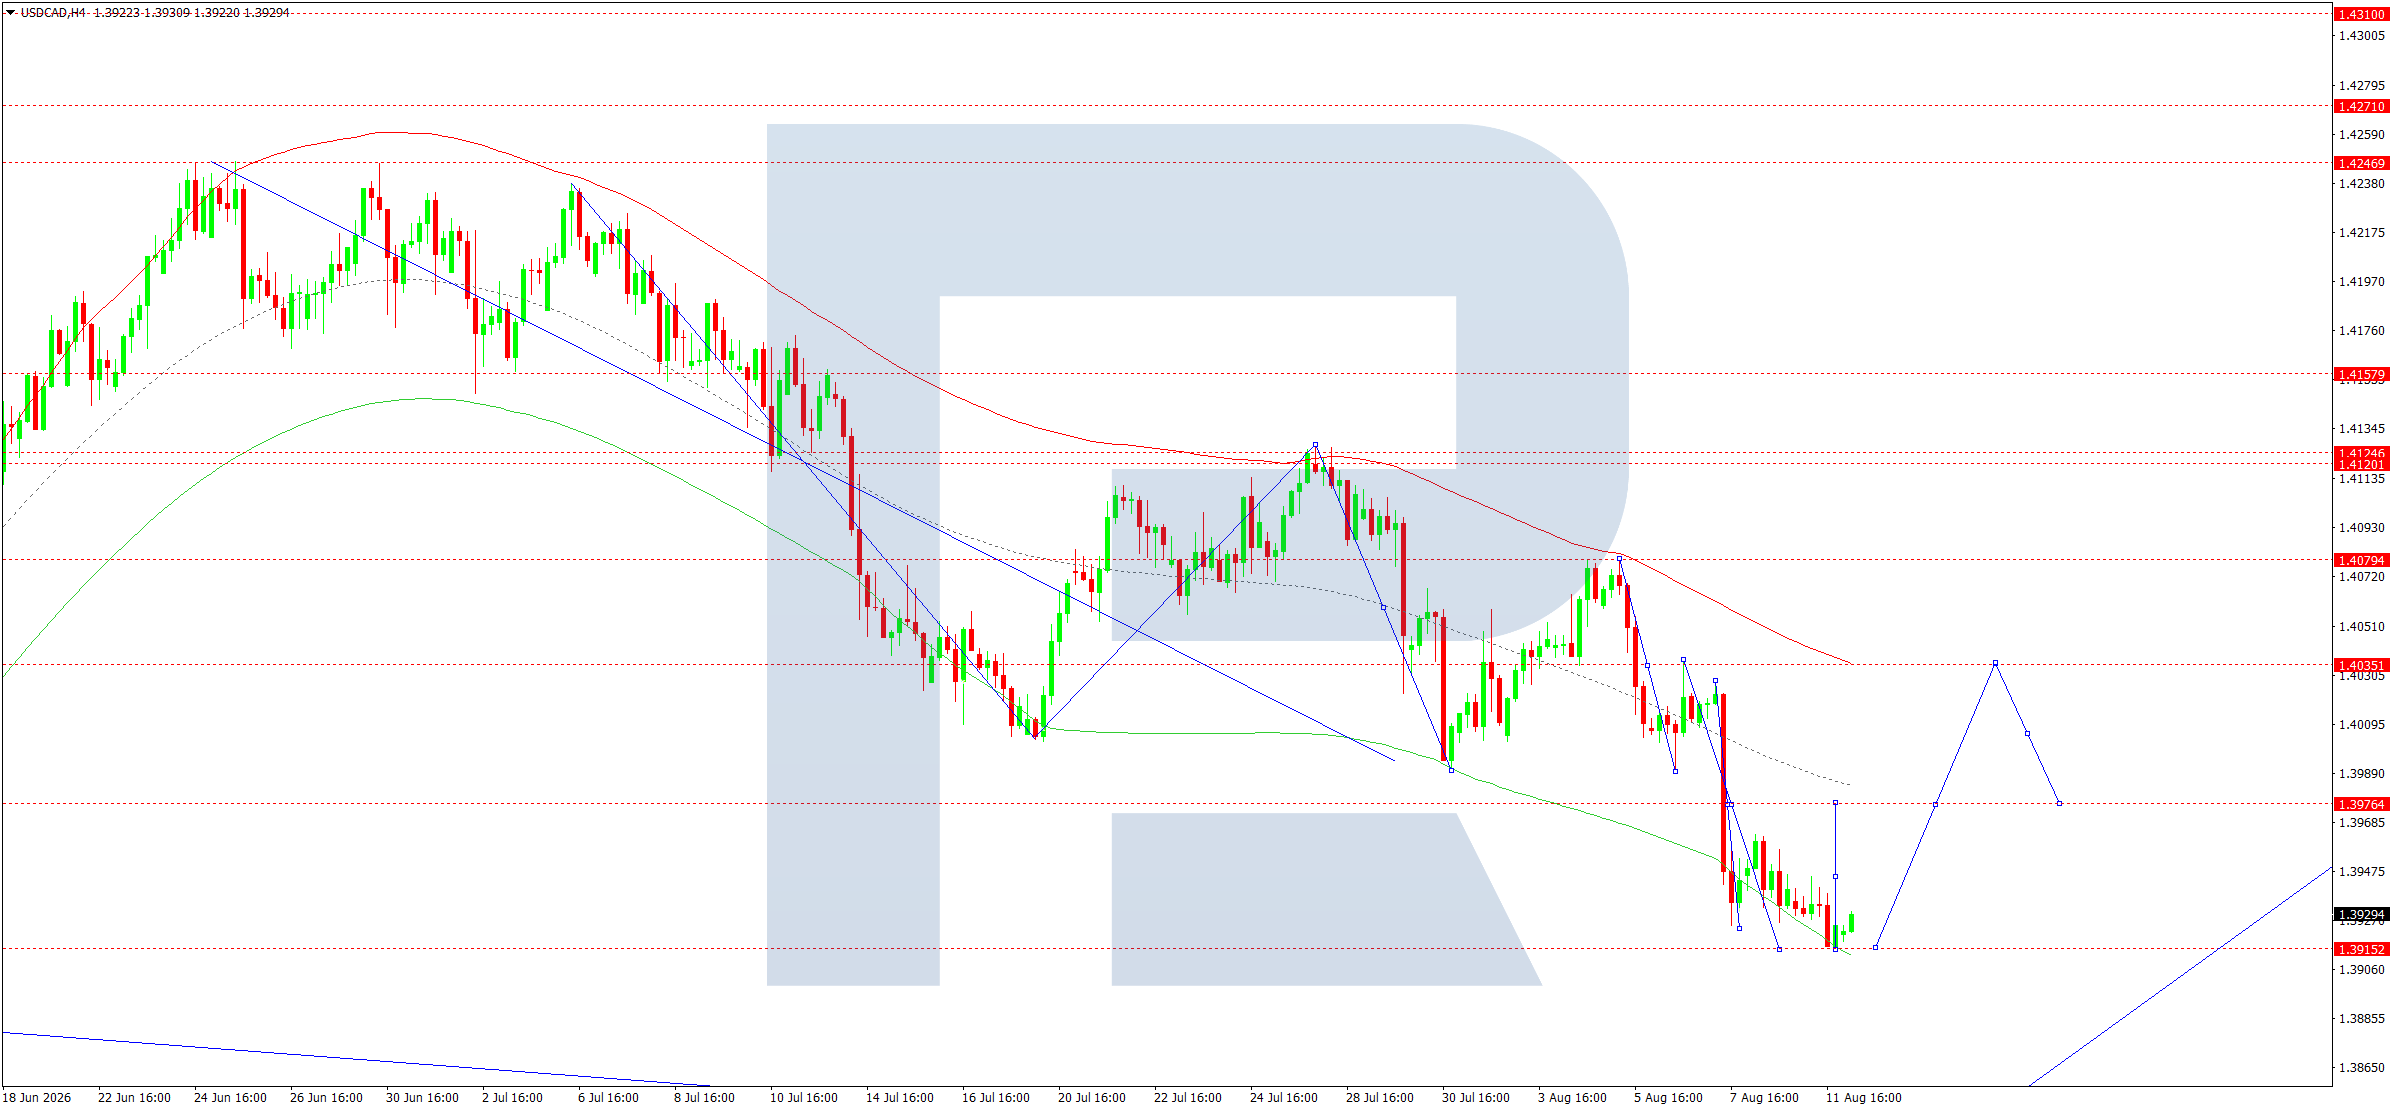
On the H4 chart, the USDCAD pair completed a downward wave towards 1.3915, followed by an upward impulse towards 1.3932. Today, 12 August 2026, the market is expected to form a consolidation range around this level. A downward breakout would open the way towards 1.3900, while an upward breakout could drive the price further up towards 1.3975, with the upward wave potentially extending to 1.4035.
Technically, this scenario is confirmed by the Elliott wave structure and the upward wave matrix with a pivot point at 1.3629, a key level in the current upward wave for USDCAD. The market is currently forming a consolidation range above the lower boundary of the Price Envelope at 1.3915. An upward wave towards its upper boundary at 1.4035 is expected next.
Technical indicators for today's USDCAD forecast suggest a rise towards 1.4035.
XAUUSD forecast
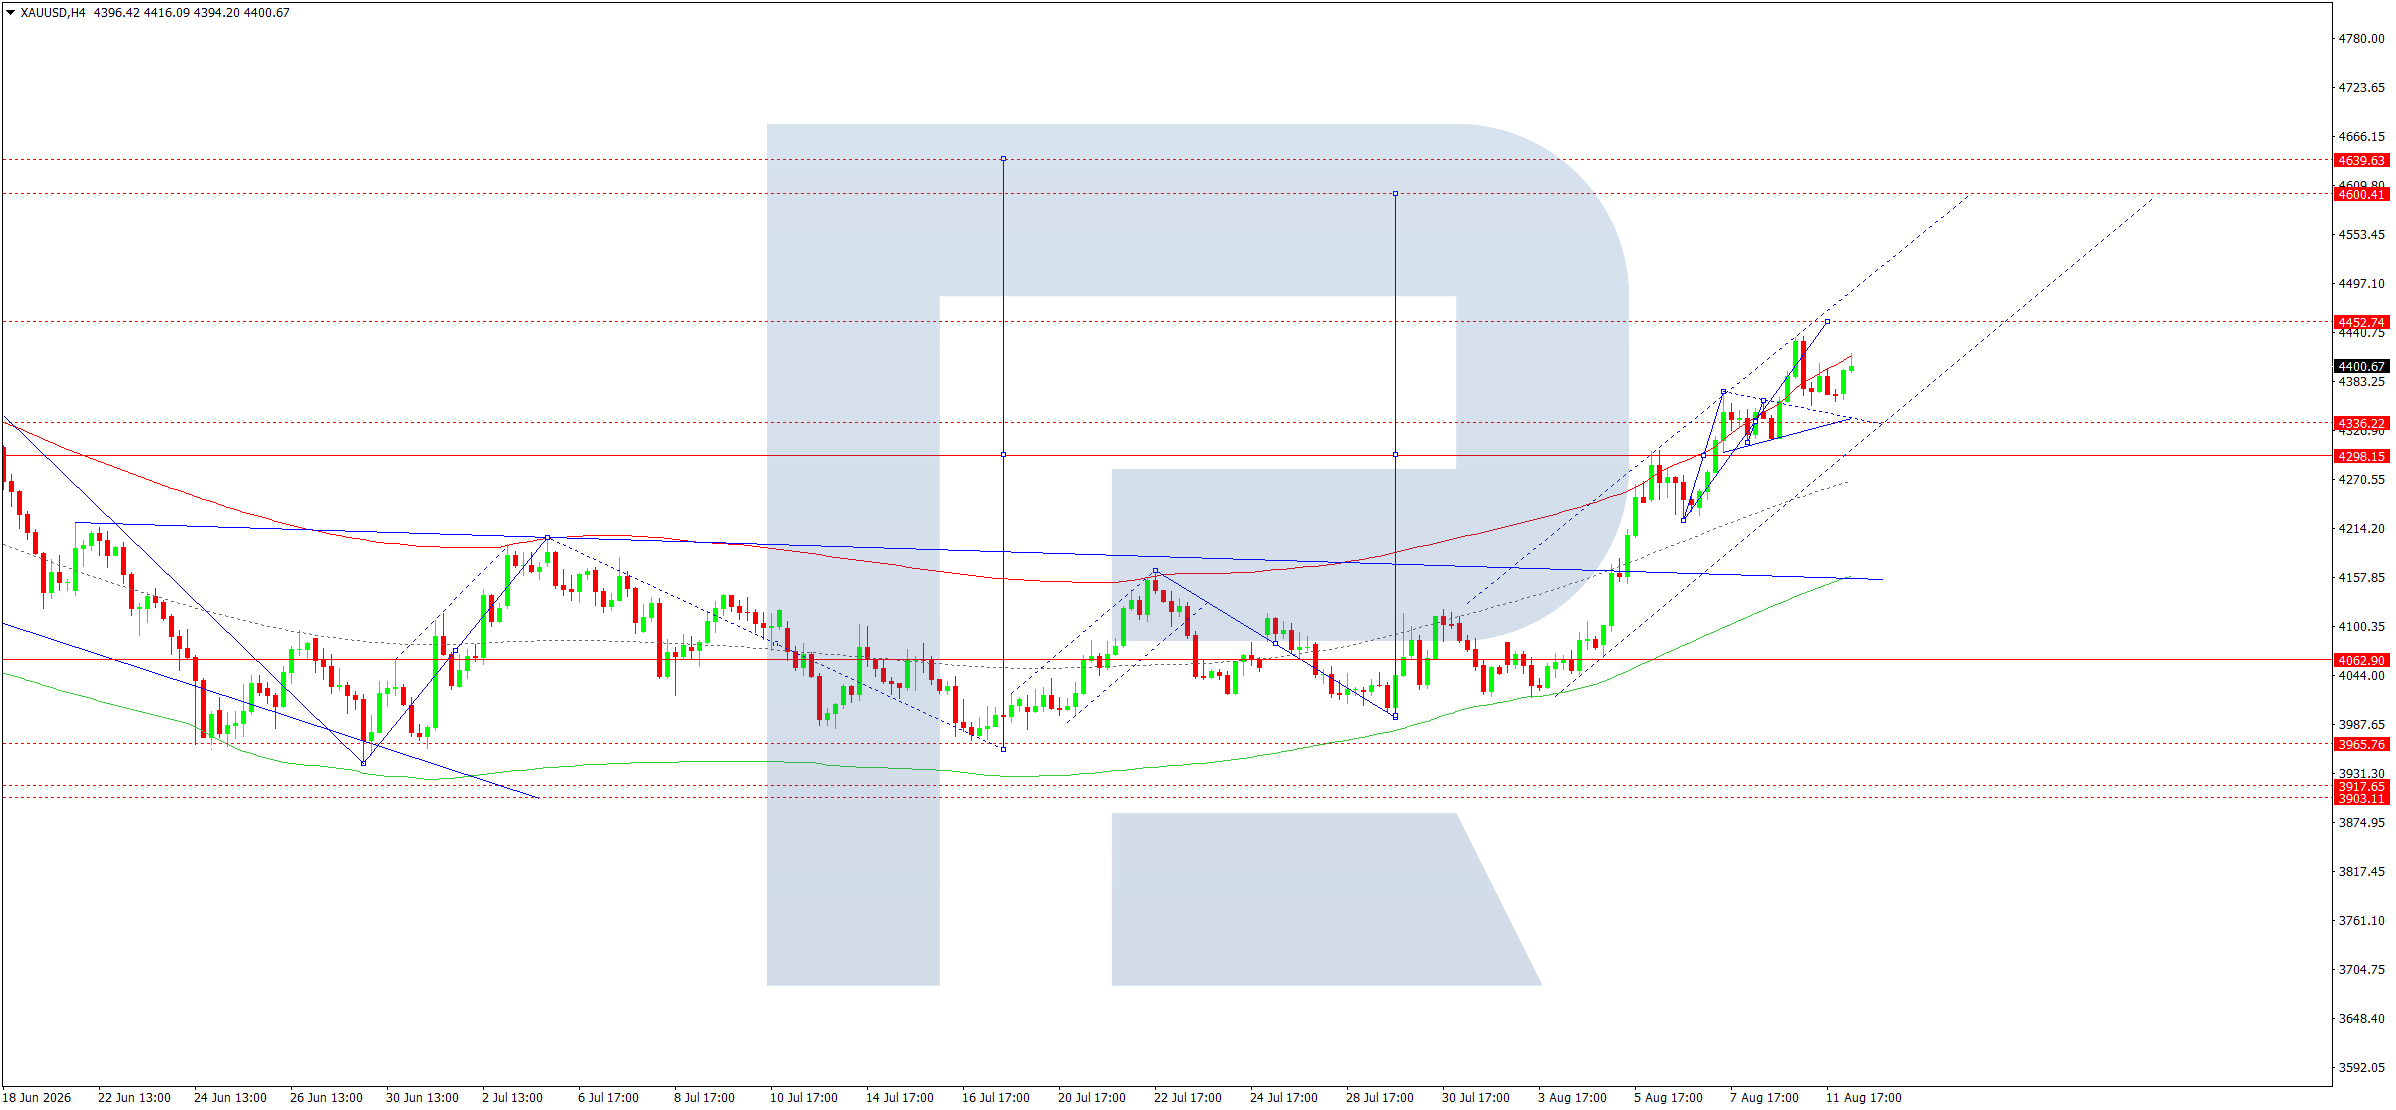
On the H4 chart, XAUUSD is developing an upward wave towards 4,455. Today, 12 August 2026, the market is expected to form a consolidation range below this level, followed by a correction towards 4,355 and a rally towards 4,600, a local target.
Technically, this scenario is confirmed by the Elliott wave structure and the downward wave matrix with a pivot point at 4,260, a key level in the current downward wave for XAUUSD. The market is currently developing an upward wave towards the upper boundary of the Price Envelope at 4,455. A consolidation range is expected to form below this level. A downward breakout could trigger a correction towards its central line at 4,355, followed by a rally towards its upper boundary at 4,600.
Technical indicators for today's XAUUSD forecast suggest an upward wave towards 4,455.
US 500 forecast
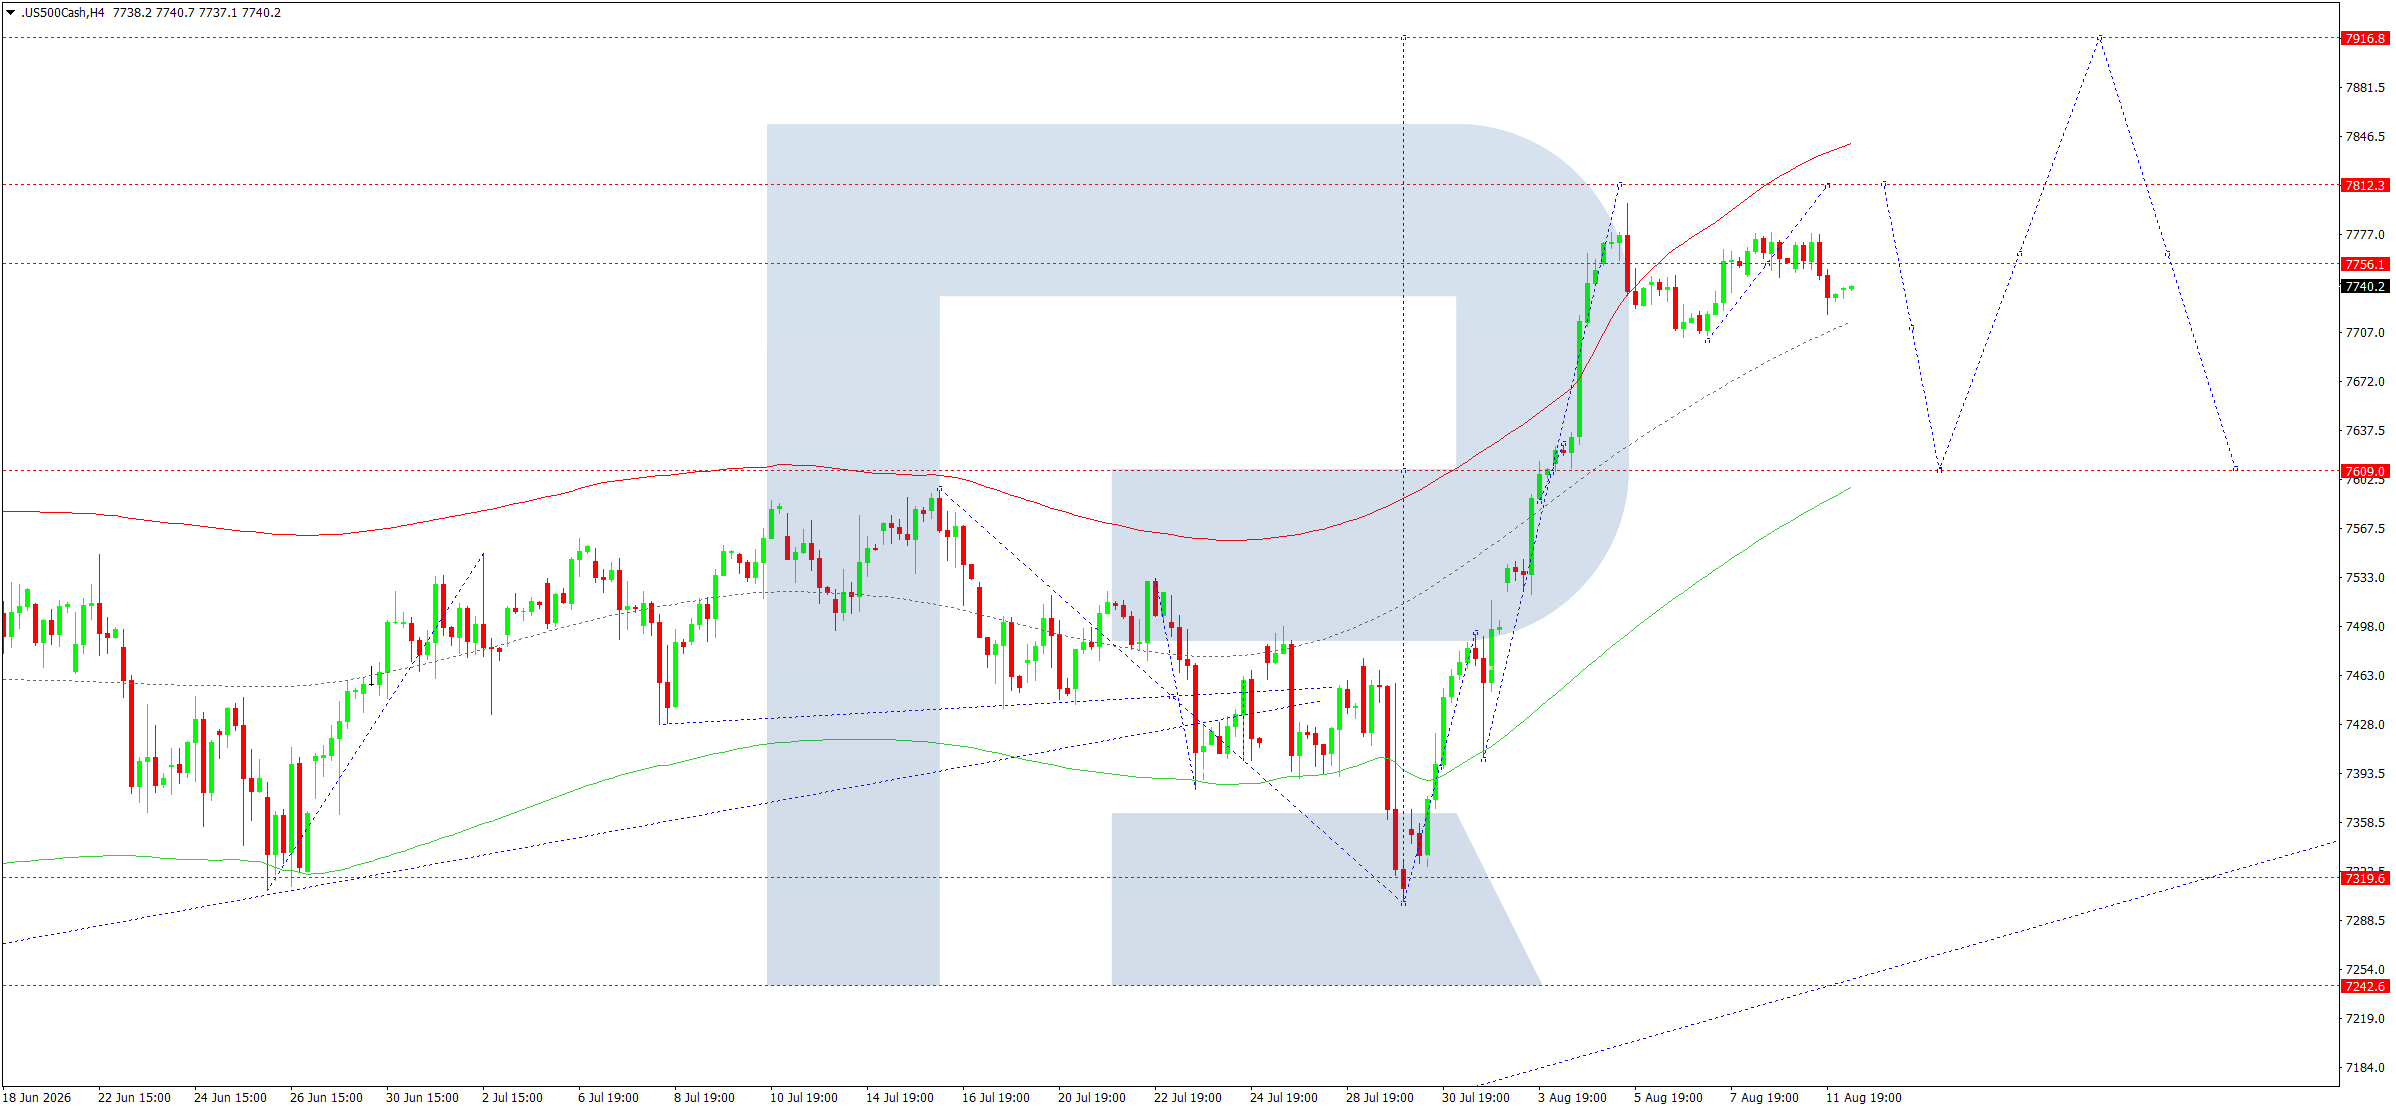
On the H4 chart, the US 500 completed an upward wave towards 7,778. Today, 12 August 2026, the market may form a consolidation range around this level. A downward breakout could trigger a decline towards 7,720, while an upward breakout could open the door for a rally towards 7,815, followed by a decline to 7,700.
Technically, this scenario is confirmed by the Elliott wave structure and the upward wave matrix with a pivot point at 7,600, a key level in the current wave for the US 500. The market is currently forming an upward wave towards the upper boundary of the Price Envelope at 7,815. A decline towards its central line at 7,700 is expected next.
Technical indicators for today's US 500 forecast suggest a rise towards 7,815.
BTCUSD forecast
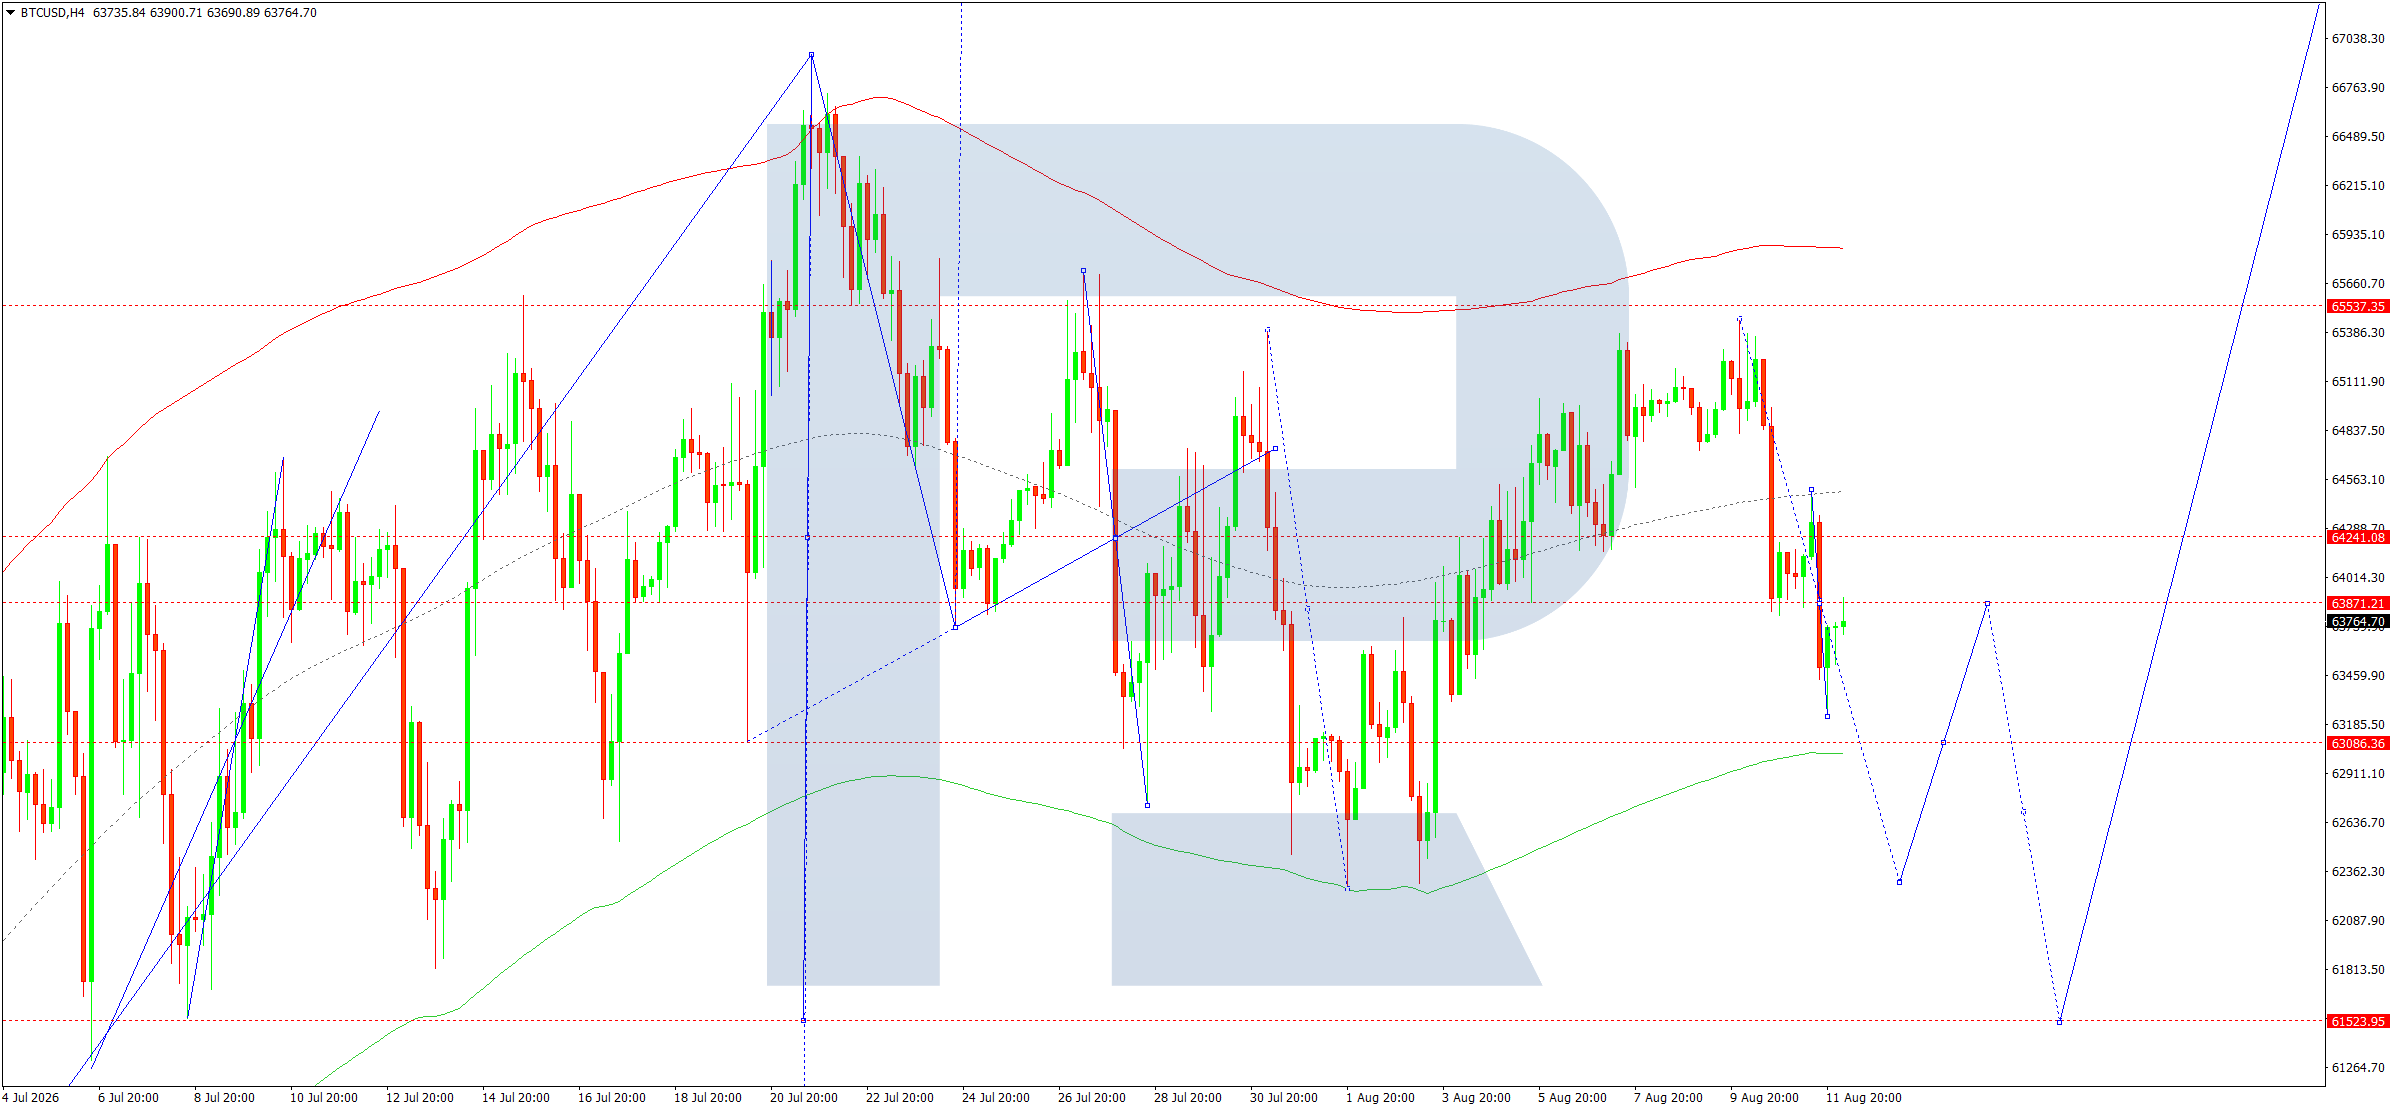
On the H4 chart, BTCUSD formed a consolidation range around 63,870. Today, 12 August 2026, a downward breakout has triggered a downward wave towards 63,240. The price is expected to move higher towards 63,900, testing it from below before dropping to 62,300.
Technically, this scenario is confirmed by the Elliott wave structure and the upward wave matrix with a pivot point at 63,000, a key level in this wave for BTCUSD. The market is currently forming a consolidation range around the central line of the Price Envelope at 64,590. A downward breakout towards its lower boundary at 63,000 is expected.
Technical indicators for today's BTCUSD forecast suggest a rebound towards 63,940, followed by the beginning of a decline to 62,300.
Editors’ picks
 EURUSD forecast 2026–2027: technical analysis, price levels & predictions
EURUSD has pulled back from the 2026 high of 1.1915 and is now trading near 1.1450 — below both EMA65 and EMA200 — with the active scenario shifting from bullish to bearish. The ECB raised rates to 2.40%, but the Fed holds at 3.75%, and US inflation (3.5%) continues to outpace the eurozone (2.8%). A confirmed break below 1.1280 opens the next downward wave toward 1.1080. We break down the key levels, three trading scenarios with entry triggers, and what Deutsche Bank, Morgan Stanley and UBS are forecasting for EURUSD in 2026.
 Gold (XAUUSD) forecast 2026: predictions based on fundamental and technical analysis
Gold has corrected over 25% from its all-time high of 5,597 USD and is now trading near 4,100 USD — testing a critical support zone. Is this the bottom, or will the downtrend continue? We break down the key levels (support 3,920 USD, breakout trigger 4,500 USD), three trading scenarios with entry levels, and what J.P. Morgan, Goldman Sachs and Deutsche Bank are forecasting for gold in 2026.
Forecasts presented in this section only reflect the author’s private opinion and should not be considered as guidance for trading. RoboForex bears no responsibility for trading results based on trading recommendations described in these analytical reviews.