
Daily technical analysis and forecast for 21 August 2026
Daily technical analysis and forecast for EURUSD, USDJPY, GBPUSD, AUDUSD, USDCAD, XAUUSD, US 500, and BTCUSD for 21 August 2026.
Each scenario on this page reflects the H4 market structure as of 21 August 2026 and stays relevant for the current trading day. It closes once the price reaches the take-profit or stop-loss level, or once the trading day ends with neither level reached. A new analysis with updated levels is published every trading day, so check the latest version rather than an older one.
EURUSD forecast
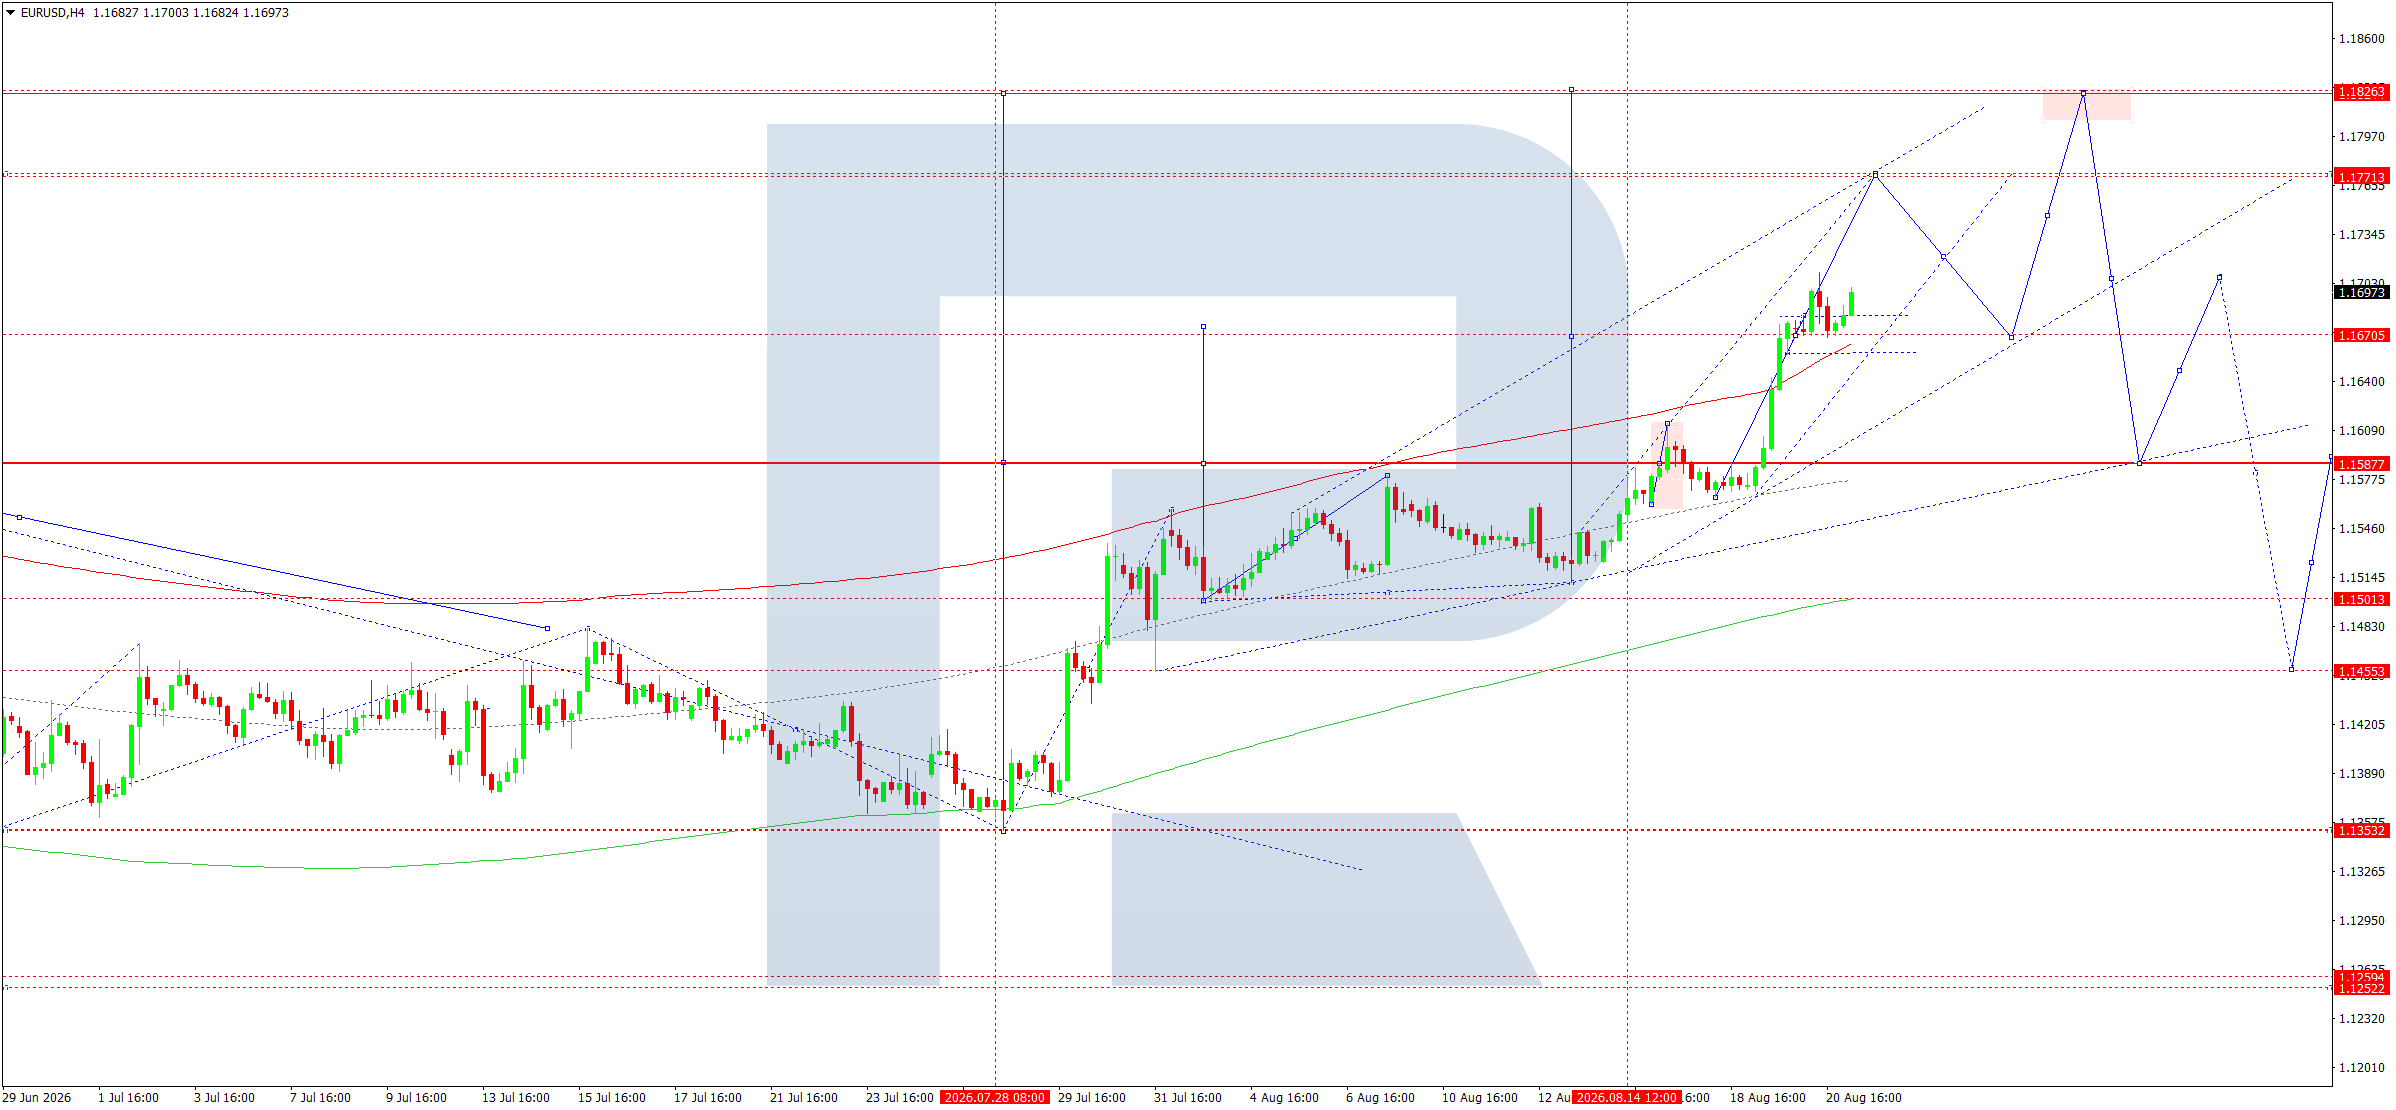
On the H4 chart, the EURUSD pair completed an upward wave towards 1.1709. Today, 21 August 2026, the price is forming a consolidation range below this resistance level.
The key matrix level is 1.1674, which is considered the pivot point of the current upward wave. As long as the price remains above this area, the continuation of the bullish structure remains the priority.
The main scenario suggests an upside breakout from the range, followed by a continued upward wave towards 1.1771, with further potential to reach the upper boundary of the structure at 1.1826.
A breakout below 1.1674 would signal a weakening of the current momentum and open the way towards 1.1587. This level is therefore considered key to invalidating the bullish scenario.
Trading scenario: BUY
- Price: 1.1690
- Entry price: 1.1709
- Stop loss: 1.1670
- Take profit: 1.1771
- Risk-to-reward ratio: 1:1.59
USDJPY forecast
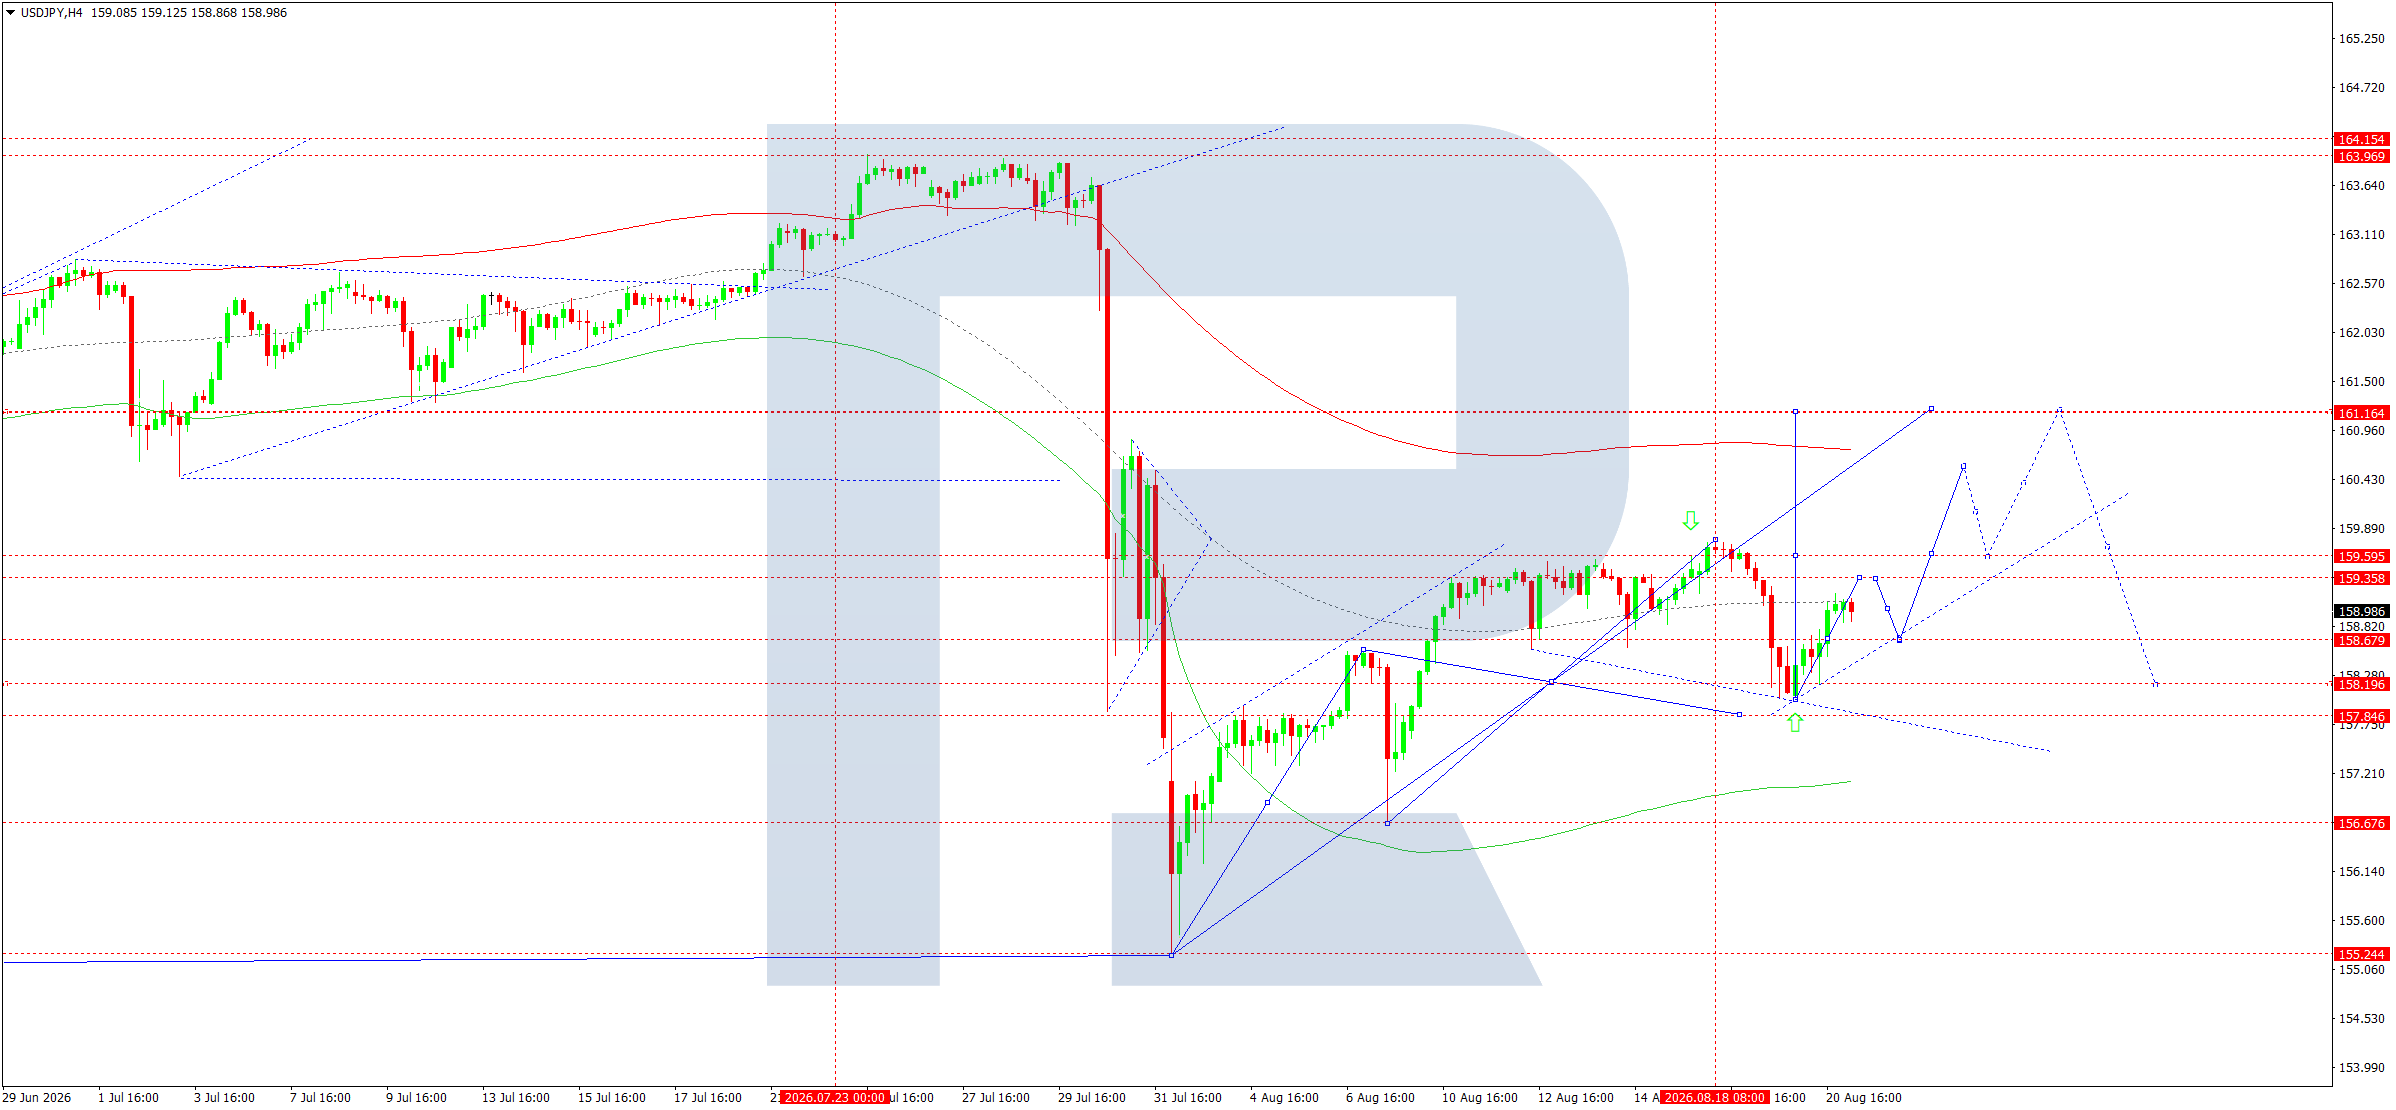
On the H4 chart, the USDJPY pair completed an upward wave towards the 159.15 area. The price is currently consolidating below this resistance level.
The key level of the wave matrix is 158.20, which acts as the pivot point of the current upward wave. As long as the price remains above it, the bullish structure remains intact.
The main scenario is a breakout above 159.15 and a continued upward move towards 159.97, with further potential to reach the upper boundary of the Price Envelope at 161.16.
However, the fundamental backdrop calls for caution: accelerating Japanese inflation is fuelling expectations of a BoJ rate hike, while the risk of currency intervention makes USDJPY movements above 160 particularly unstable.
Trading scenario: BUY
- Price: 158.91
- Entry price: 159.15
- Stop loss: 158.20
- Take profit: 161.16
- Risk-to-reward ratio: 1:2.12
GBPUSD forecast
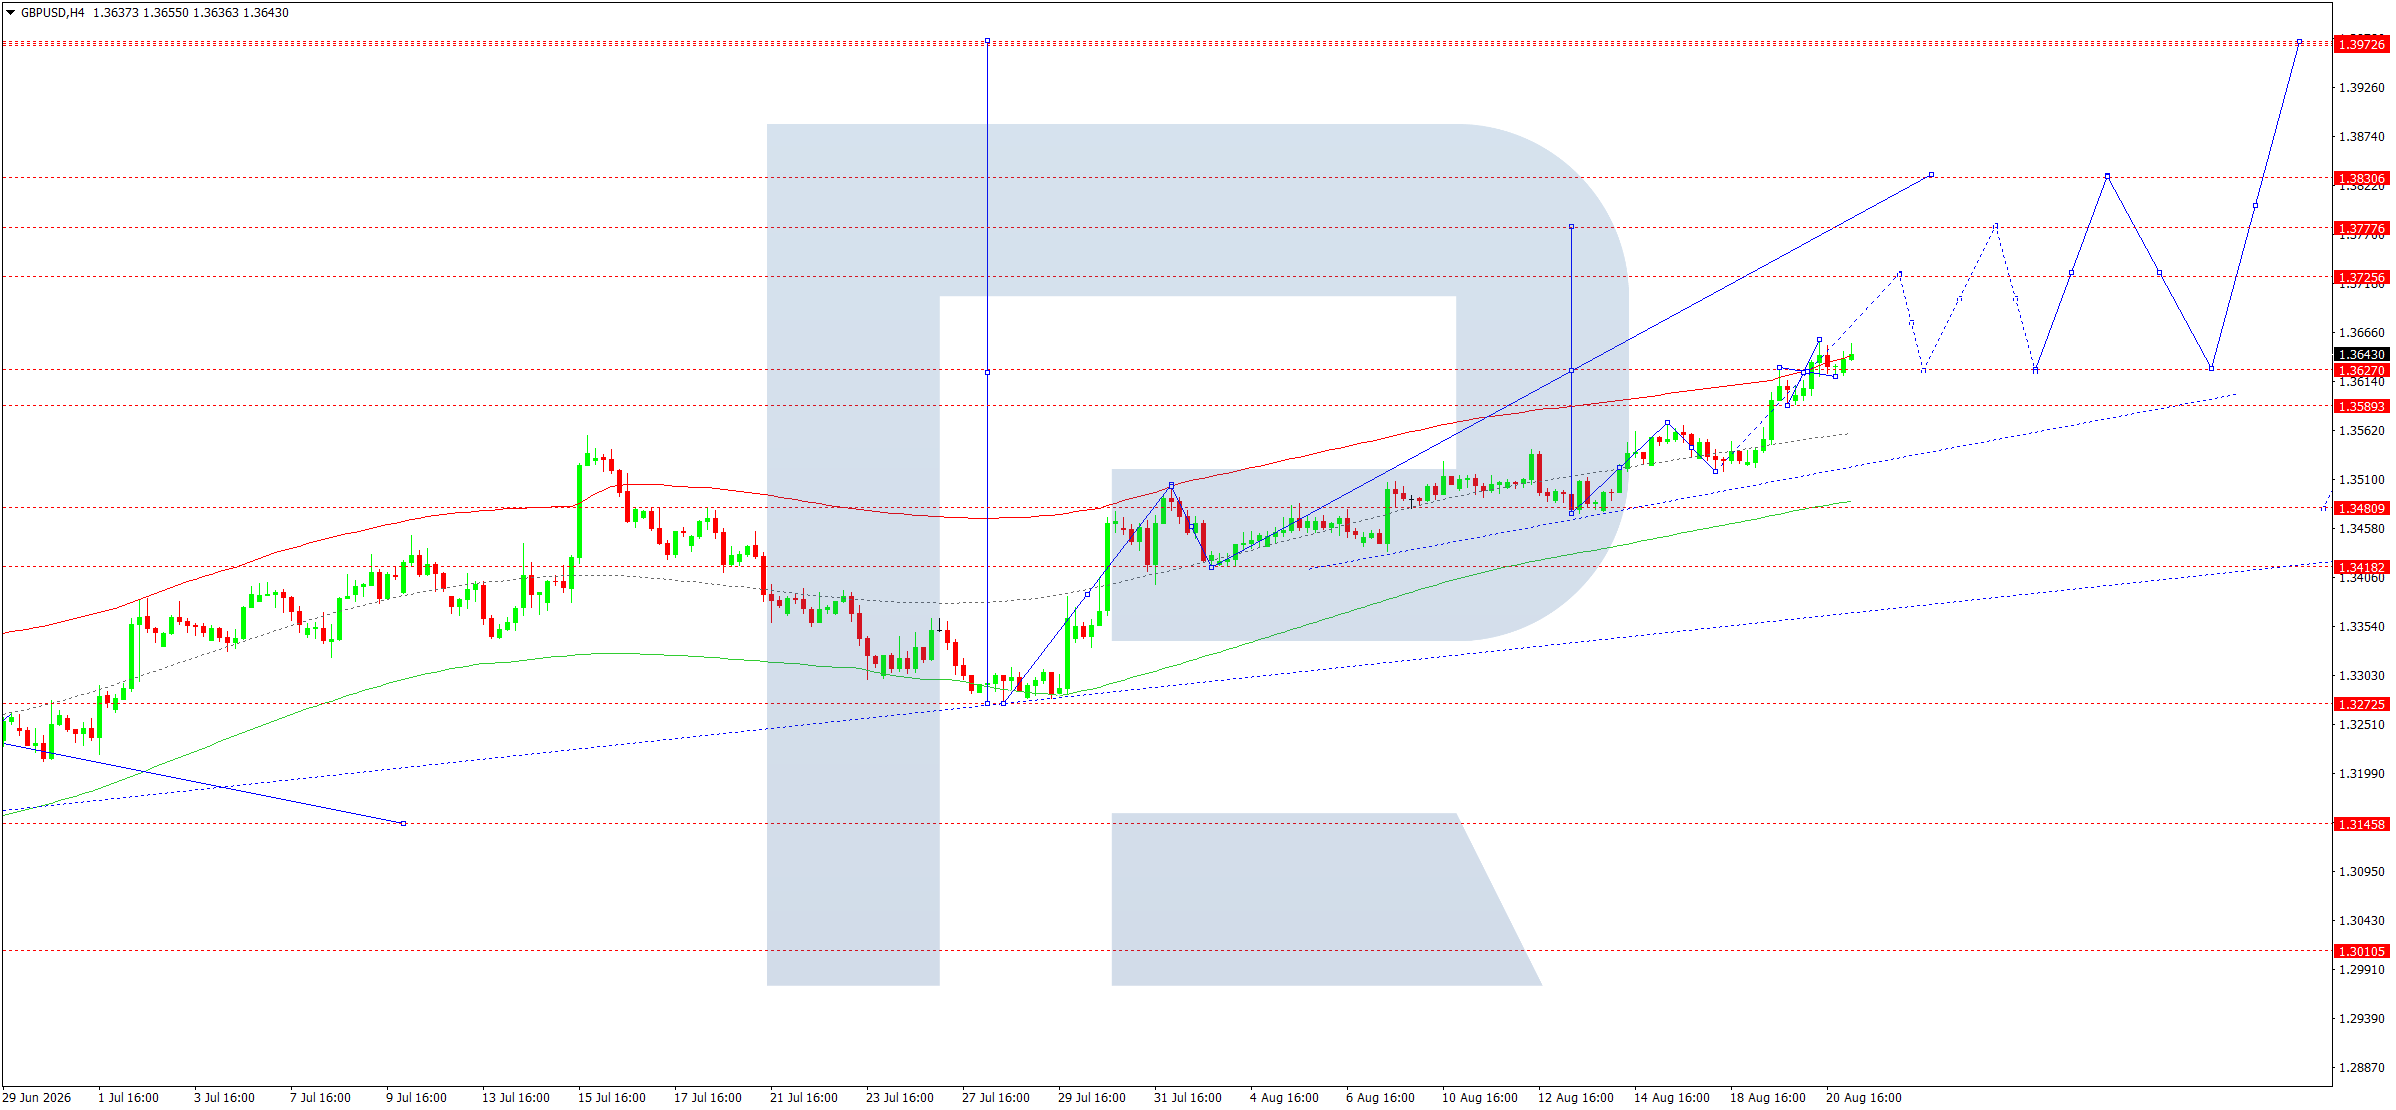
On the H4 chart, the GBPUSD pair is forming a consolidation range around 1.3627.
The pivot point of the wave matrix is 1.3627. The price remains above this level, so the upward wave structure remains intact.
The baseline scenario is a breakout above the upper boundary of the range at 1.3656, followed by a move towards 1.3727. If momentum persists, the next target will be 1.3777.
After reaching this area, a correction towards 1.3627 is possible. However, as long as the price remains above the pivot point of the wave matrix, the bullish scenario remains the priority.
Fundamentally, the pound is supported by persistent inflation in the UK and expectations regarding further BoE policy, while US dollar weakness remains an additional factor supporting the GBPUSD rate.
Trading scenario: BUY
- Price: 1.3650
- Entry price: 1.3656
- Stop loss: 1.3620
- Take profit: 1.3777
- Risk-to-reward ratio: 1:3.36
AUDUSD forecast
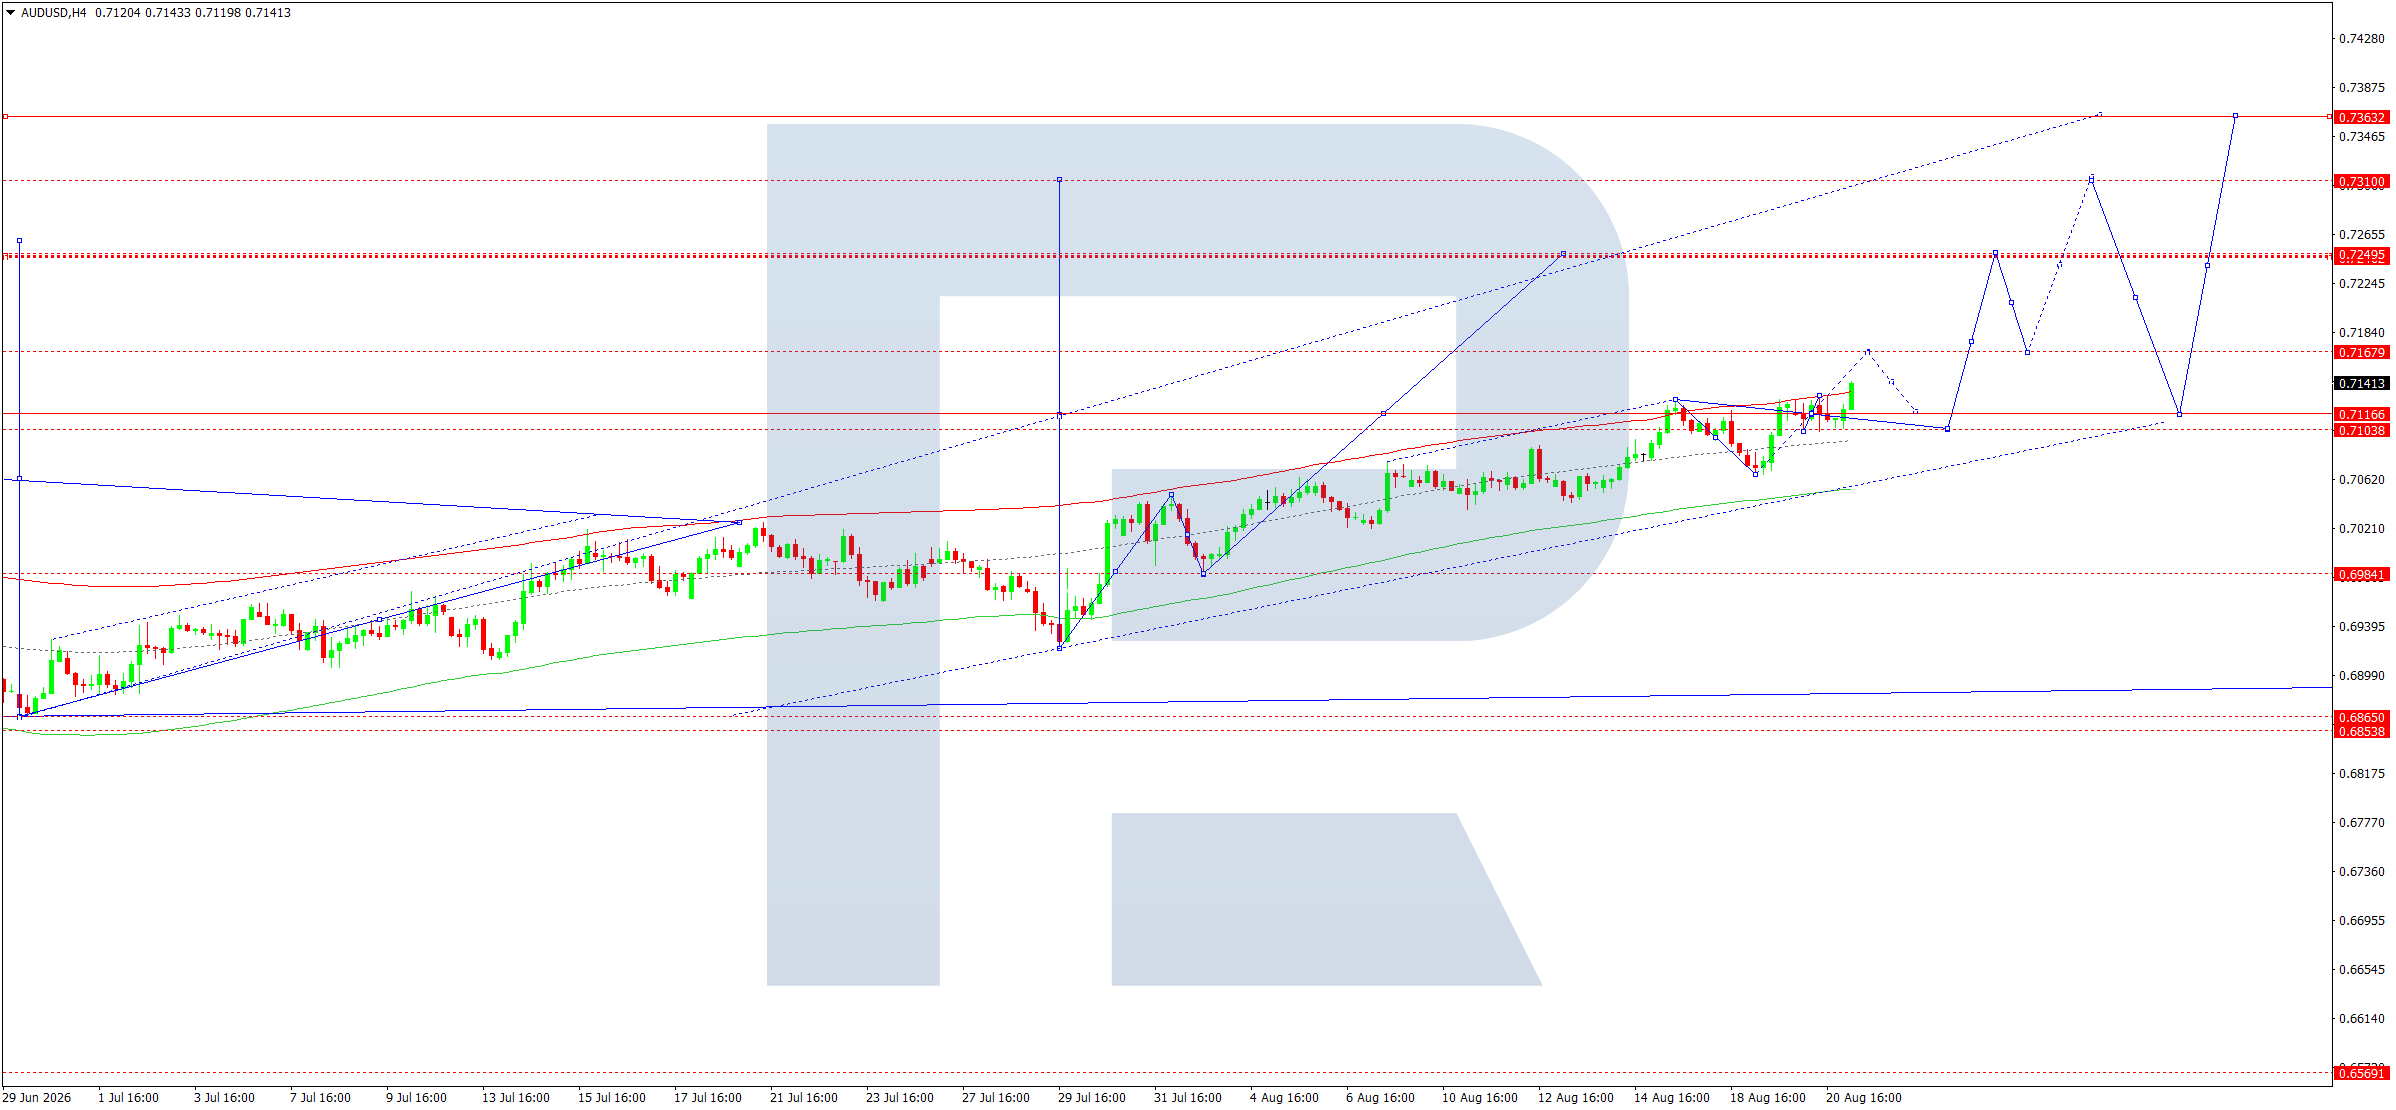
On the H4 chart, the AUDUSD pair completed an upward wave towards the 0.7133–0.7141 area and is forming a consolidation range.
The pivot point of the wave matrix is 0.7116. As long as the price remains above this level, the upward structure remains intact.
The main scenario is a breakout above the 0.7161 area, followed by continued growth towards 0.7250, the upper boundary of the Price Envelope.
A return below 0.7116 would indicate a corrective wave and reduce the likelihood of an immediate continuation of the rise.
The fundamental backdrop is mixed: US dollar weakness supports the AUD, while a rise in Australian unemployment to 4.5% limits expectations of aggressive RBA tightening. At the same time, the RBA retains the option of further rate hikes if inflation risks increase.
Trading scenario: BUY
- Price: 0.7141
- Entry price: 0.7161
- Stop loss: 0.7116
- Take profit: 0.7250
- Risk-to-reward ratio: 1:1.98
USDCAD forecast
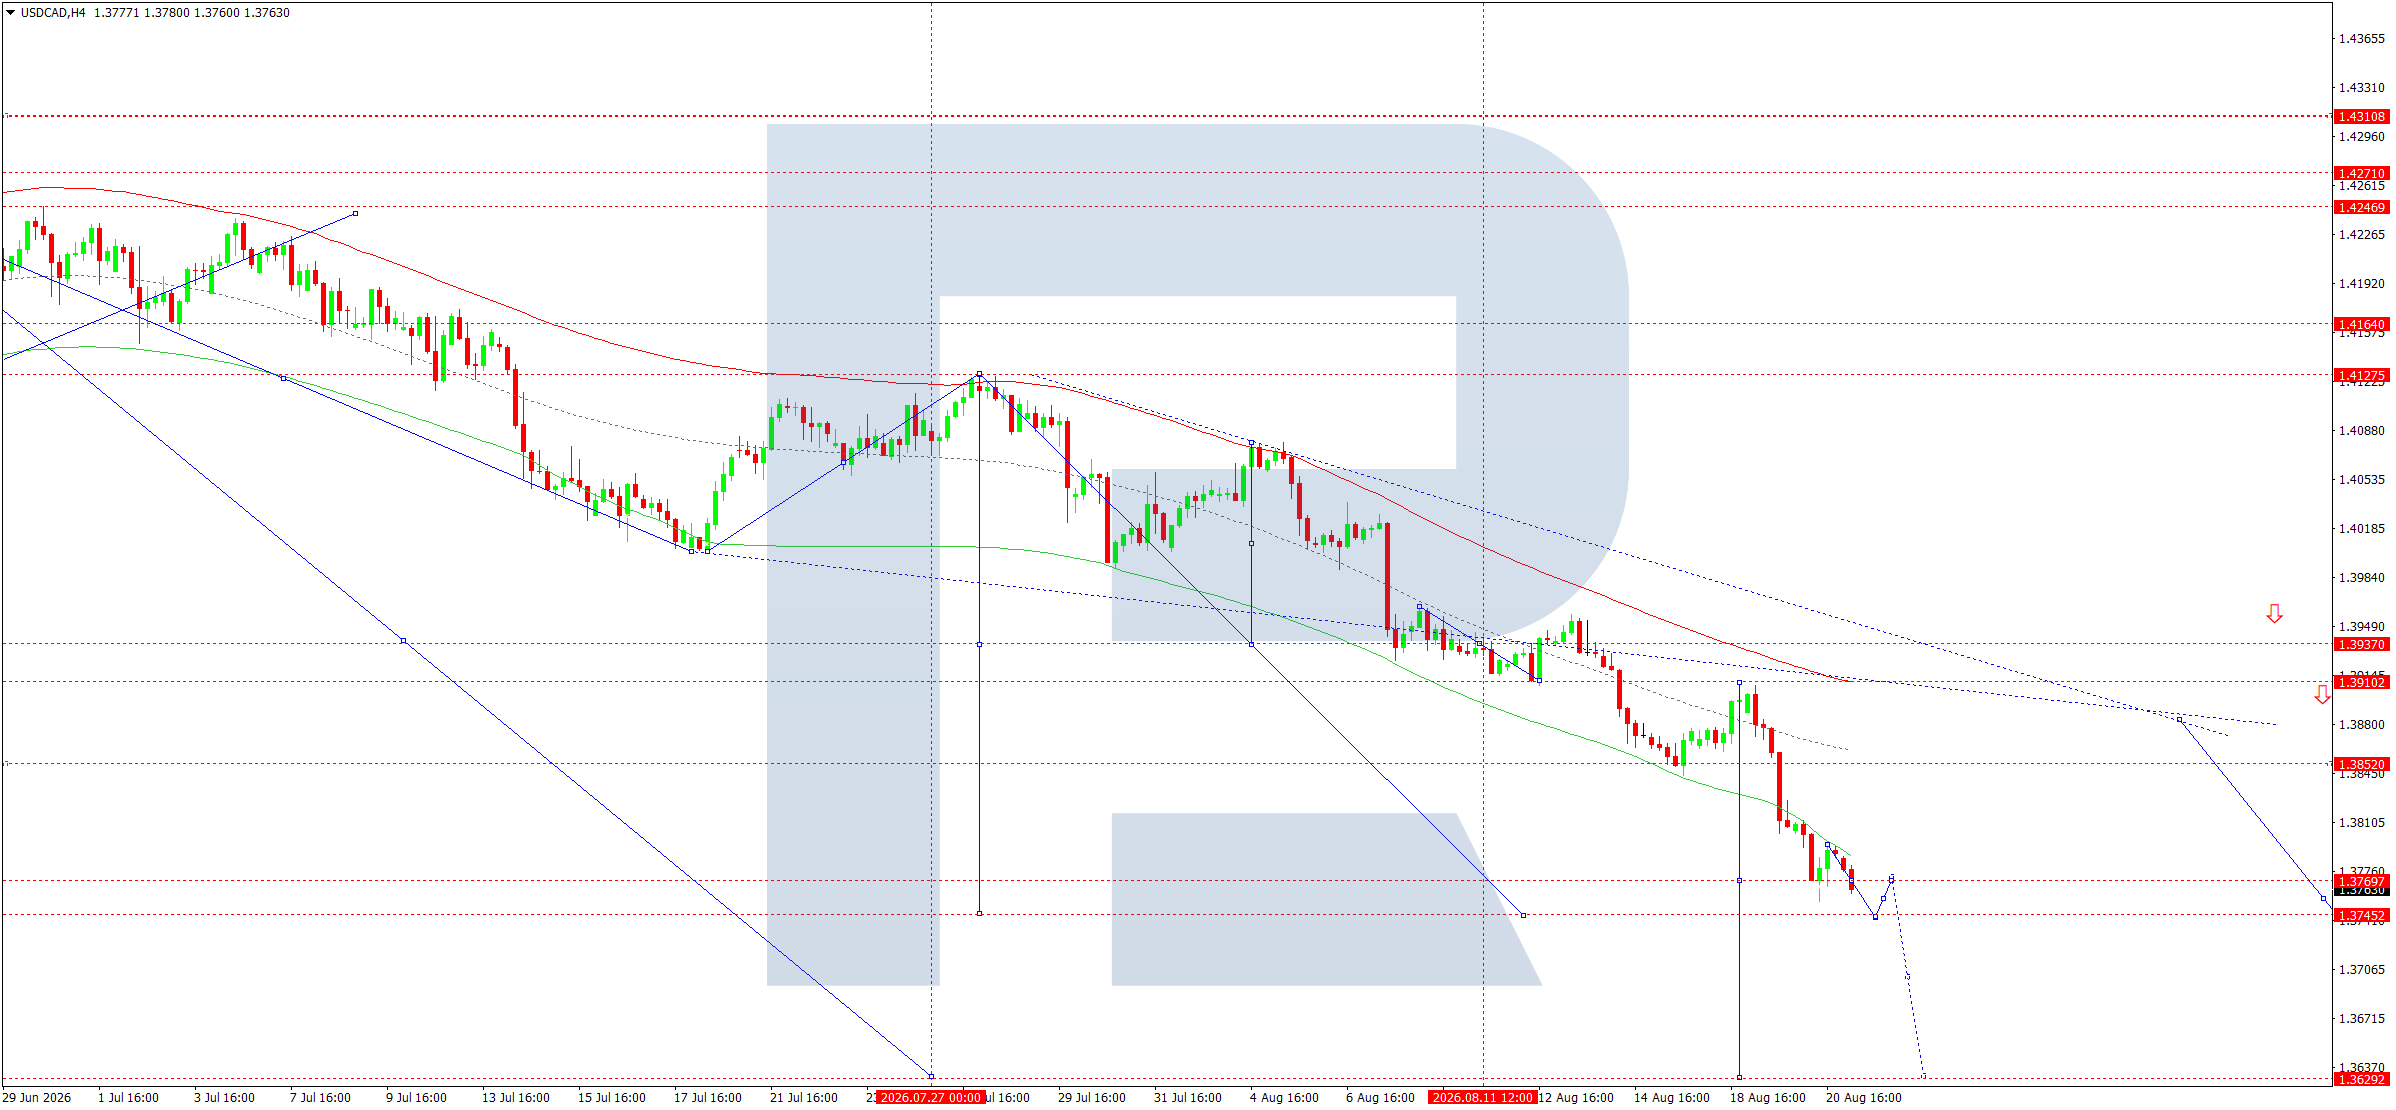
On the H4 chart, the USDCAD pair maintains a pronounced downward wave structure. The market has declined towards the 1.3767 area and is forming a consolidation range above the lower boundary of the Price Envelope.
The key level of the wave matrix is 1.3937. As long as the price is well below this mark, the medium-term structure remains bearish.
The main scenario is a breakout below 1.3745, followed by a continued downward wave towards 1.3630.
A return above 1.3853 would weaken the current bearish structure, while a breakout above 1.3937 would invalidate it.
The Canadian dollar is also supported by high oil prices as Brent is trading above 93 USD amid supply constraints and geopolitical risks.
Trading scenario: SELL
- Price: 1.3763
- Entry price: 1.3745
- Stop loss: 1.3800
- Take profit: 1.3630
- Risk-to-reward ratio: 1:2.09
XAUUSD forecast
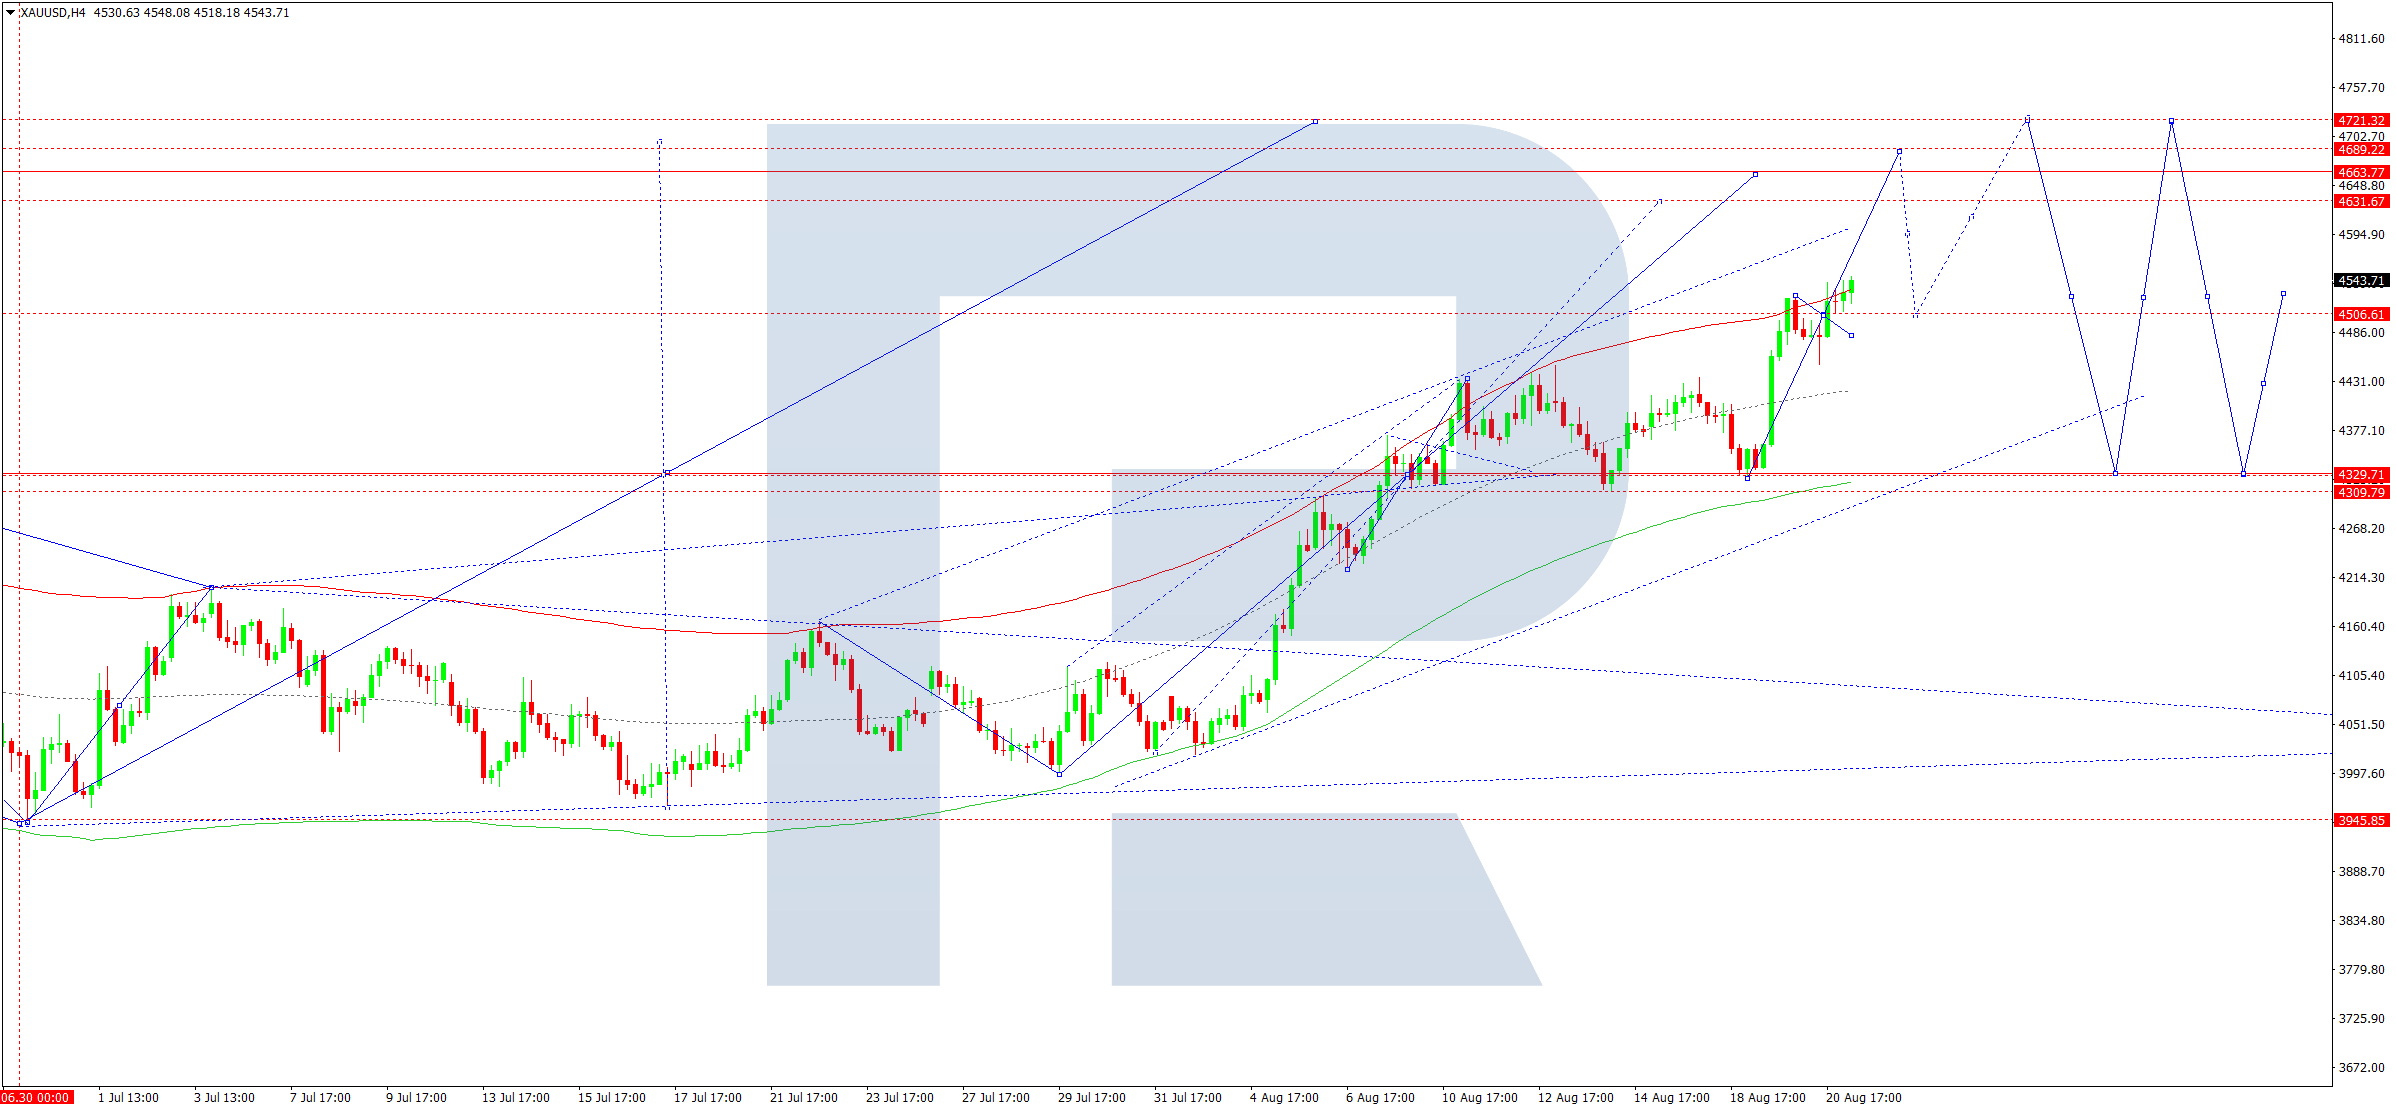
On the H4 chart, XAUUSD is consolidating in the 4,506–4,555 area after a strong upward wave.
The key level of the wave matrix is 4,506. As long as prices hold above this area, the upward wave structure remains intact.
The primary scenario is a breakout above 4,567, followed by continued growth first towards 4,663 and then towards the upper boundary of the structure at 4,721.
If a correction develops, the 4,448 area is considered the central line of the Price Envelope and a potential support zone.
The fundamental backdrop remains favourable for gold: US dollar weakness, growing concerns about US debt, and geopolitical risks are supporting demand for safe-haven assets. Reuters notes that gold has gained more than 3% over the week.
Trading scenario: BUY
- Price: 4,555
- Entry price: 4,567
- Stop loss: 4,506
- Take profit: 4,721
- Risk-to-reward ratio: 1:2.52
US 500 forecast
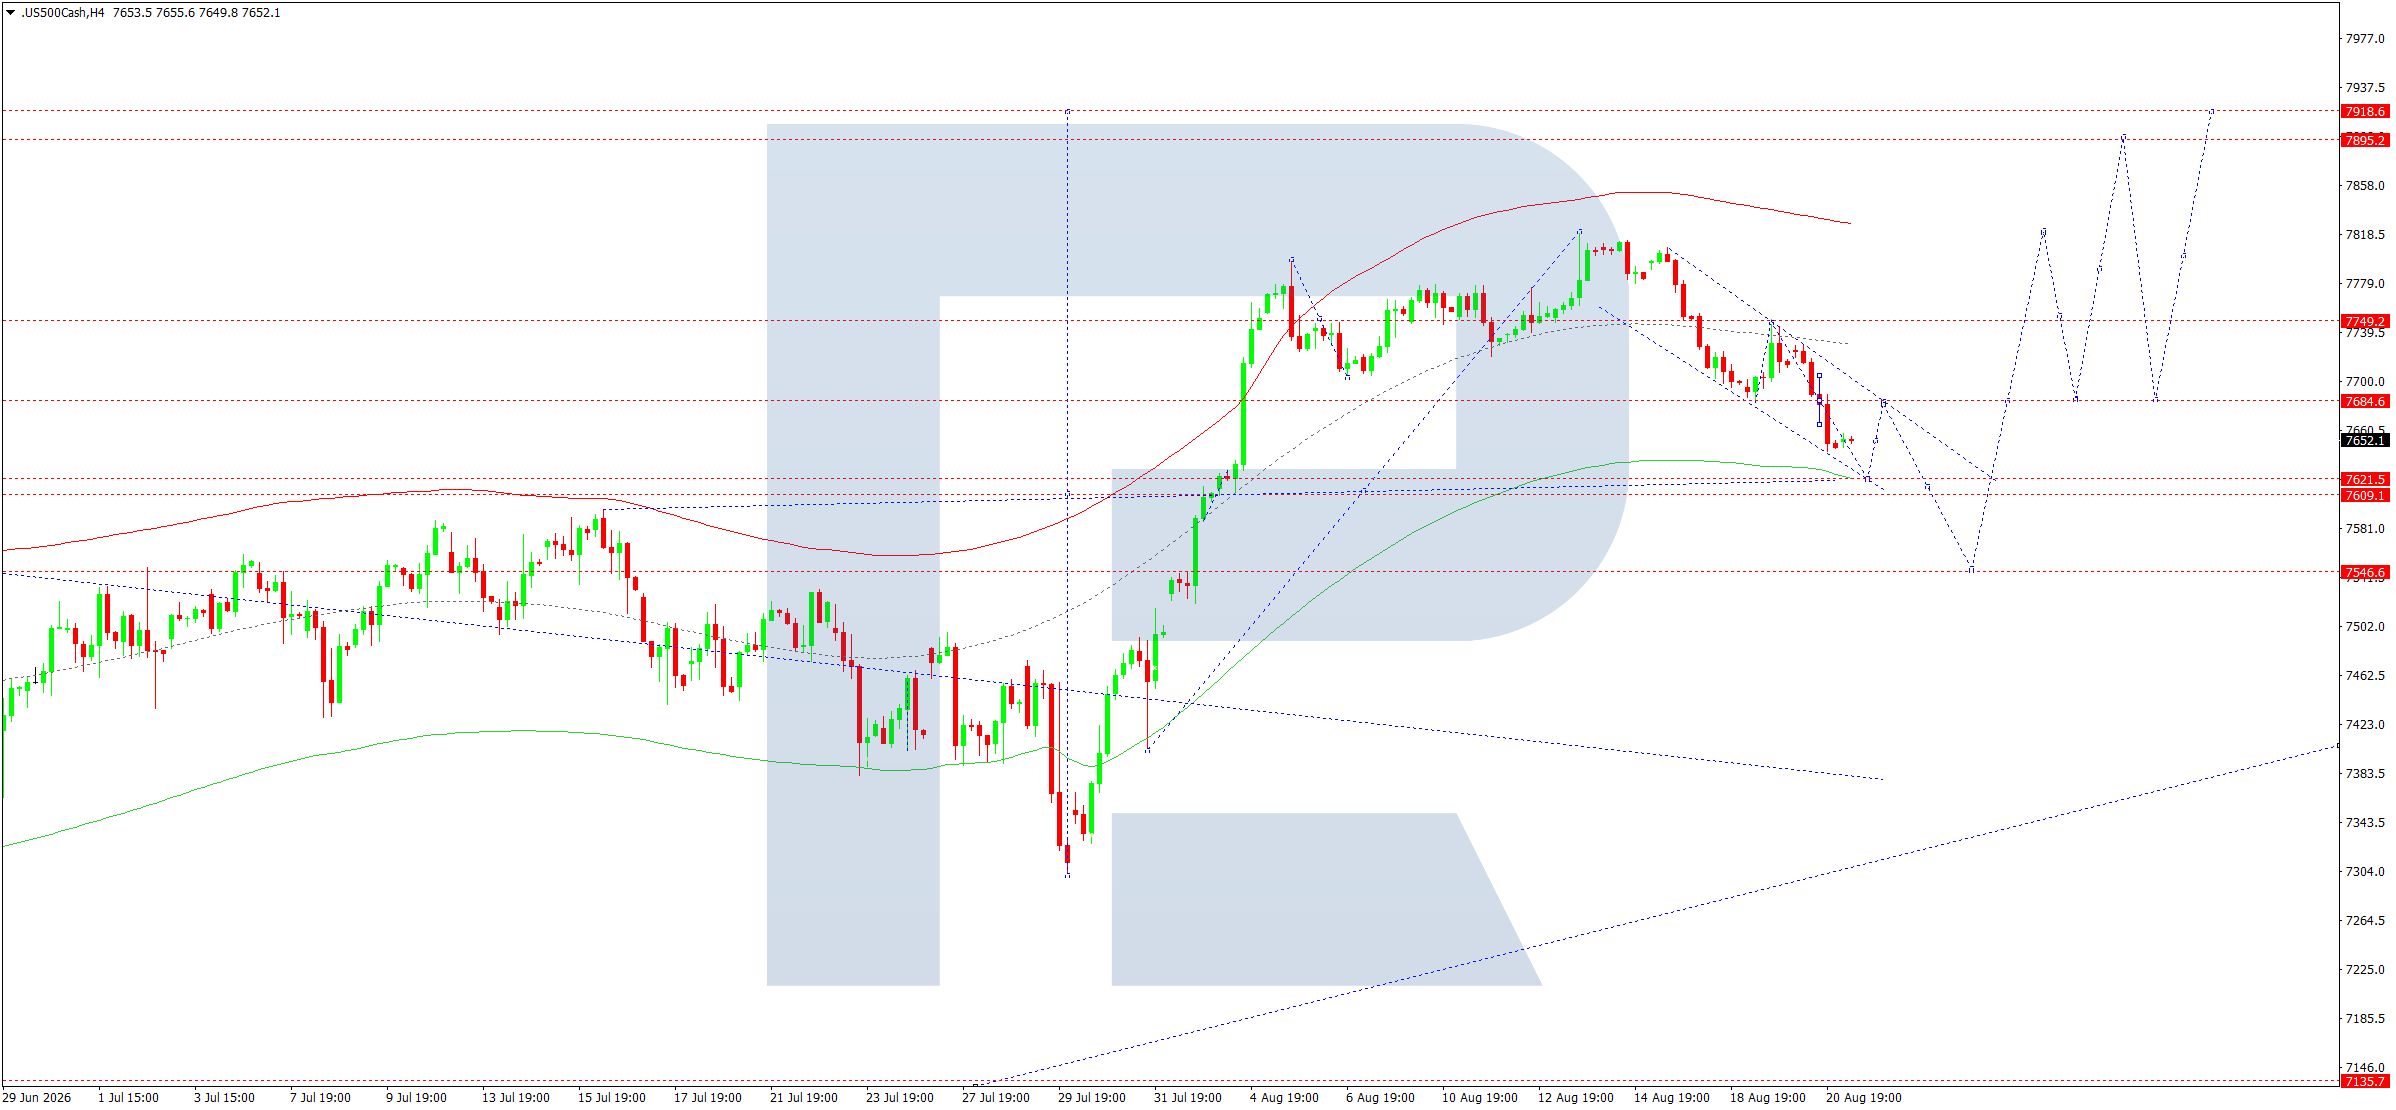
On the H4 chart, the US 500 formed a downward wave and approached the 7,621–7,643 area.
The pivot point of the wave matrix is located around 7,684, making this area key to determining the next direction.
Given the current structure, the main scenario is a corrective rise towards 7,684, followed by a continued downward move towards 7,621 and then 7,546.
Therefore, opening a sell position immediately at the current price around 7,656 is considered less efficient. A better entry point may emerge if the price returns to 7,684 and subsequently confirms a reversal to the downside.
A rise above 7,749 would signal a weakening of this scenario.
Trading scenario: SELL
- Price: 7,656
- Entry price: 7,684
- Stop loss: 7,749
- Take profit: 7,546
- Risk-to-reward ratio: 1:1.69
BTCUSD forecast
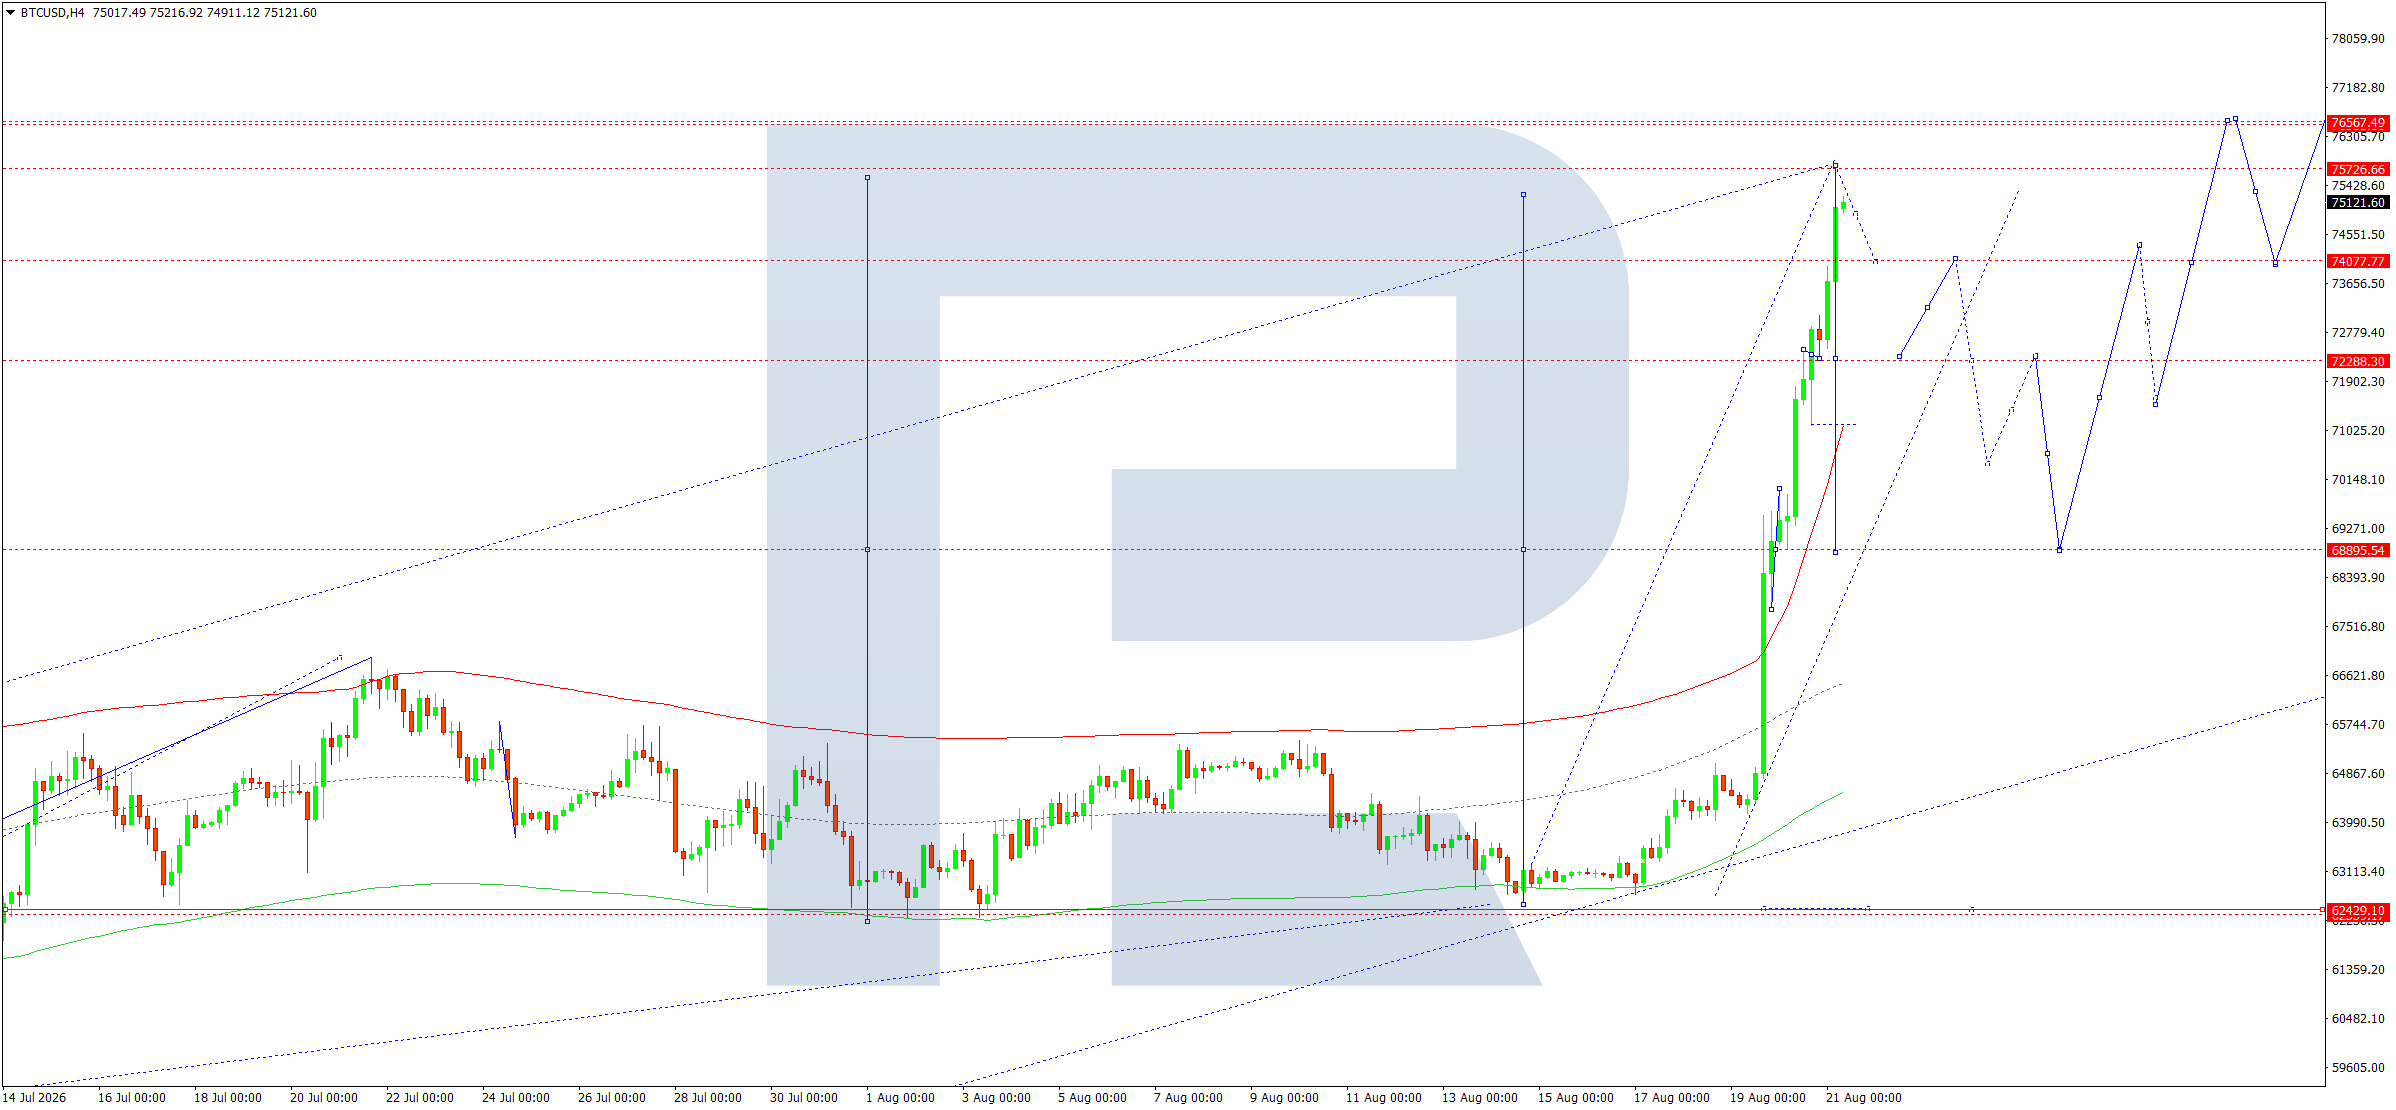
On the H4 chart, BTCUSD completed a strong upward wave towards 75,726 before entering a consolidation phase.
The key pivot point of the wave matrix is located around 68,895. However, the 74,078–75,726 area is the most important zone for the current momentum.
The price currently remains within this range. Therefore, opening a buy position at the current price after the impulse has already occurred is considered inappropriate.
The main scenario is a breakout below the lower boundary of the current range at 74,078, followed by a corrective wave. The first target is the 72,288 area, while a deeper correction could extend towards the central line of the wave matrix around 68,895.
The fundamental backdrop remains supportive for BTC: US dollar weakness, growing interest in alternative assets, and the expansion of Treasury operations with long-term bonds are supporting demand for cryptoassets. However, after the sharp weekly rise, the risk of a technical correction has increased significantly.
Trading scenario: SELL
- Price: 75,500
- Entry price: 74,078
- Stop loss: 75,726
- Take profit: 68,895
- Risk-to-reward ratio: 1:4.22
Editors’ picks
 EURUSD forecast 2026–2027: technical analysis, price levels & predictions
EURUSD has pulled back from the 2026 high of 1.1915 and is now trading near 1.1450 — below both EMA65 and EMA200 — with the active scenario shifting from bullish to bearish. The ECB raised rates to 2.40%, but the Fed holds at 3.75%, and US inflation (3.5%) continues to outpace the eurozone (2.8%). A confirmed break below 1.1280 opens the next downward wave toward 1.1080. We break down the key levels, three trading scenarios with entry triggers, and what Deutsche Bank, Morgan Stanley and UBS are forecasting for EURUSD in 2026.
 Gold (XAUUSD) forecast 2026: predictions based on fundamental and technical analysis
Gold has corrected over 25% from its all-time high of 5,597 USD and is now trading near 4,100 USD — testing a critical support zone. Is this the bottom, or will the downtrend continue? We break down the key levels (support 3,920 USD, breakout trigger 4,500 USD), three trading scenarios with entry levels, and what J.P. Morgan, Goldman Sachs and Deutsche Bank are forecasting for gold in 2026.
Forecasts presented in this section only reflect the author’s private opinion and should not be considered as guidance for trading. RoboForex bears no responsibility for trading results based on trading recommendations described in these analytical reviews.