
Daily technical analysis and forecast for 24 August 2026
Daily technical analysis and forecast for EURUSD, USDJPY, GBPUSD, AUDUSD, USDCAD, XAUUSD, US 500, and BTCUSD for 24 August 2026.
Each scenario on this page reflects the H4 market structure as of 24 August 2026 and stays relevant for the current trading day. It closes once the price reaches the take-profit or stop-loss level, or once the trading day ends with neither level reached. A new analysis with updated levels is published every trading day, so check the latest version rather than an older one.
EURUSD forecast
The euro starts the new week amid improving business activity in the eurozone. The preliminary PMI rose to 52.1 in August, reaching its highest level since November, with a particularly noticeable recovery in the manufacturing sector. At the same time, inflation remains elevated and above the European Central Bank’s target. At its latest meeting, the ECB kept its key interest rates unchanged, but persistent inflation risks and improving economic activity are supporting expectations of possible policy tightening later on.
The US dollar, meanwhile, remains under pressure. The market is assessing risks related to the high US debt burden and rising government bond yields. At the same time, uncertainty over the Federal Reserve’s future policy remains ahead of Fed Chairman Kevin Warsh’s speech in Jackson Hole. Therefore, the fundamental backdrop remains broadly supportive for the euro, although it may trigger sharp short-term moves.
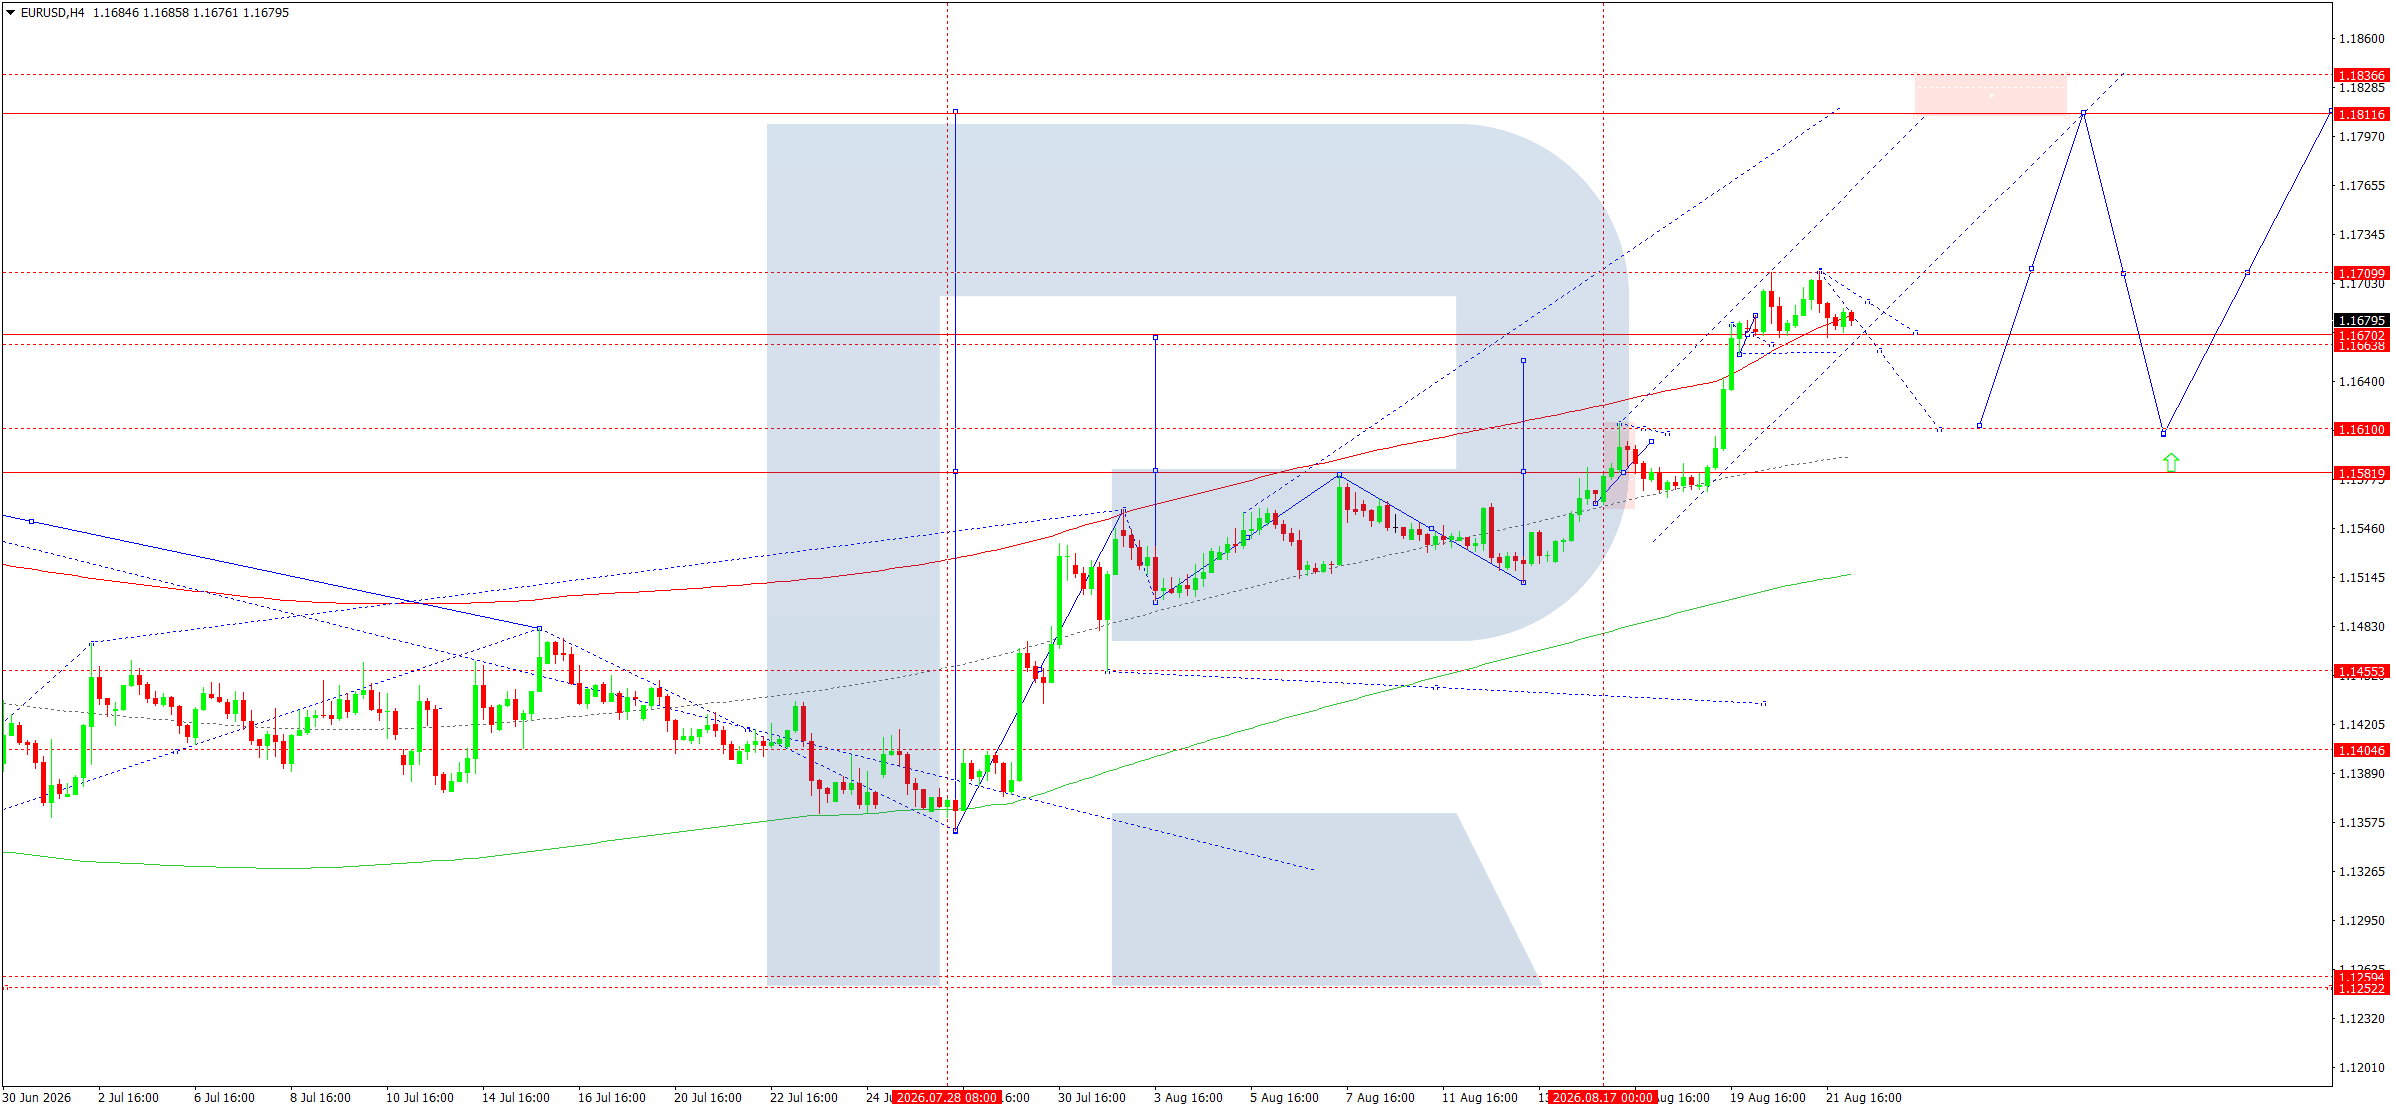
On the H4 chart, the EURUSD pair formed an upward wave towards 1.1710, after which the market entered a consolidation phase directly below the upper boundary of the Price Envelope. The pivot point of the matrix is located at 1.1581 and continues to serve as the key support area for the entire upward structure.
The main trend remains upward, although a short-term correction is likely within the current range. As long as the price remains below 1.1709, the preferred scenario for the day ahead is a move towards the central line of the Price Envelope at 1.1611. A breakout above 1.1709 would invalidate this short-term scenario and open the way towards 1.1760.
Trading scenario: SELL
Price at the time of writing: 1.1678
Entry price: 1.1678
Stop loss: 1.1715
Take profit: 1.1611
Risk-to-reward ratio: 1:1.81
USDJPY forecast
The yen is receiving additional support from growing expectations of further policy tightening by the Bank of Japan. Japan’s core inflation accelerated to 1.8% year-on-year in July, while the core measure excluding fresh food and fuel reached 1.9%. This data is strengthening expectations of a BoJ rate hike in September and limiting the potential for further yen weakness.
At the same time, the US dollar remains relatively weak in the global market. As a result, fundamental pressure on the USDJPY pair is gradually increasing. However, the technical structure still suggests a short-term recovery, as the market remains above the 158.20–158.68 area.
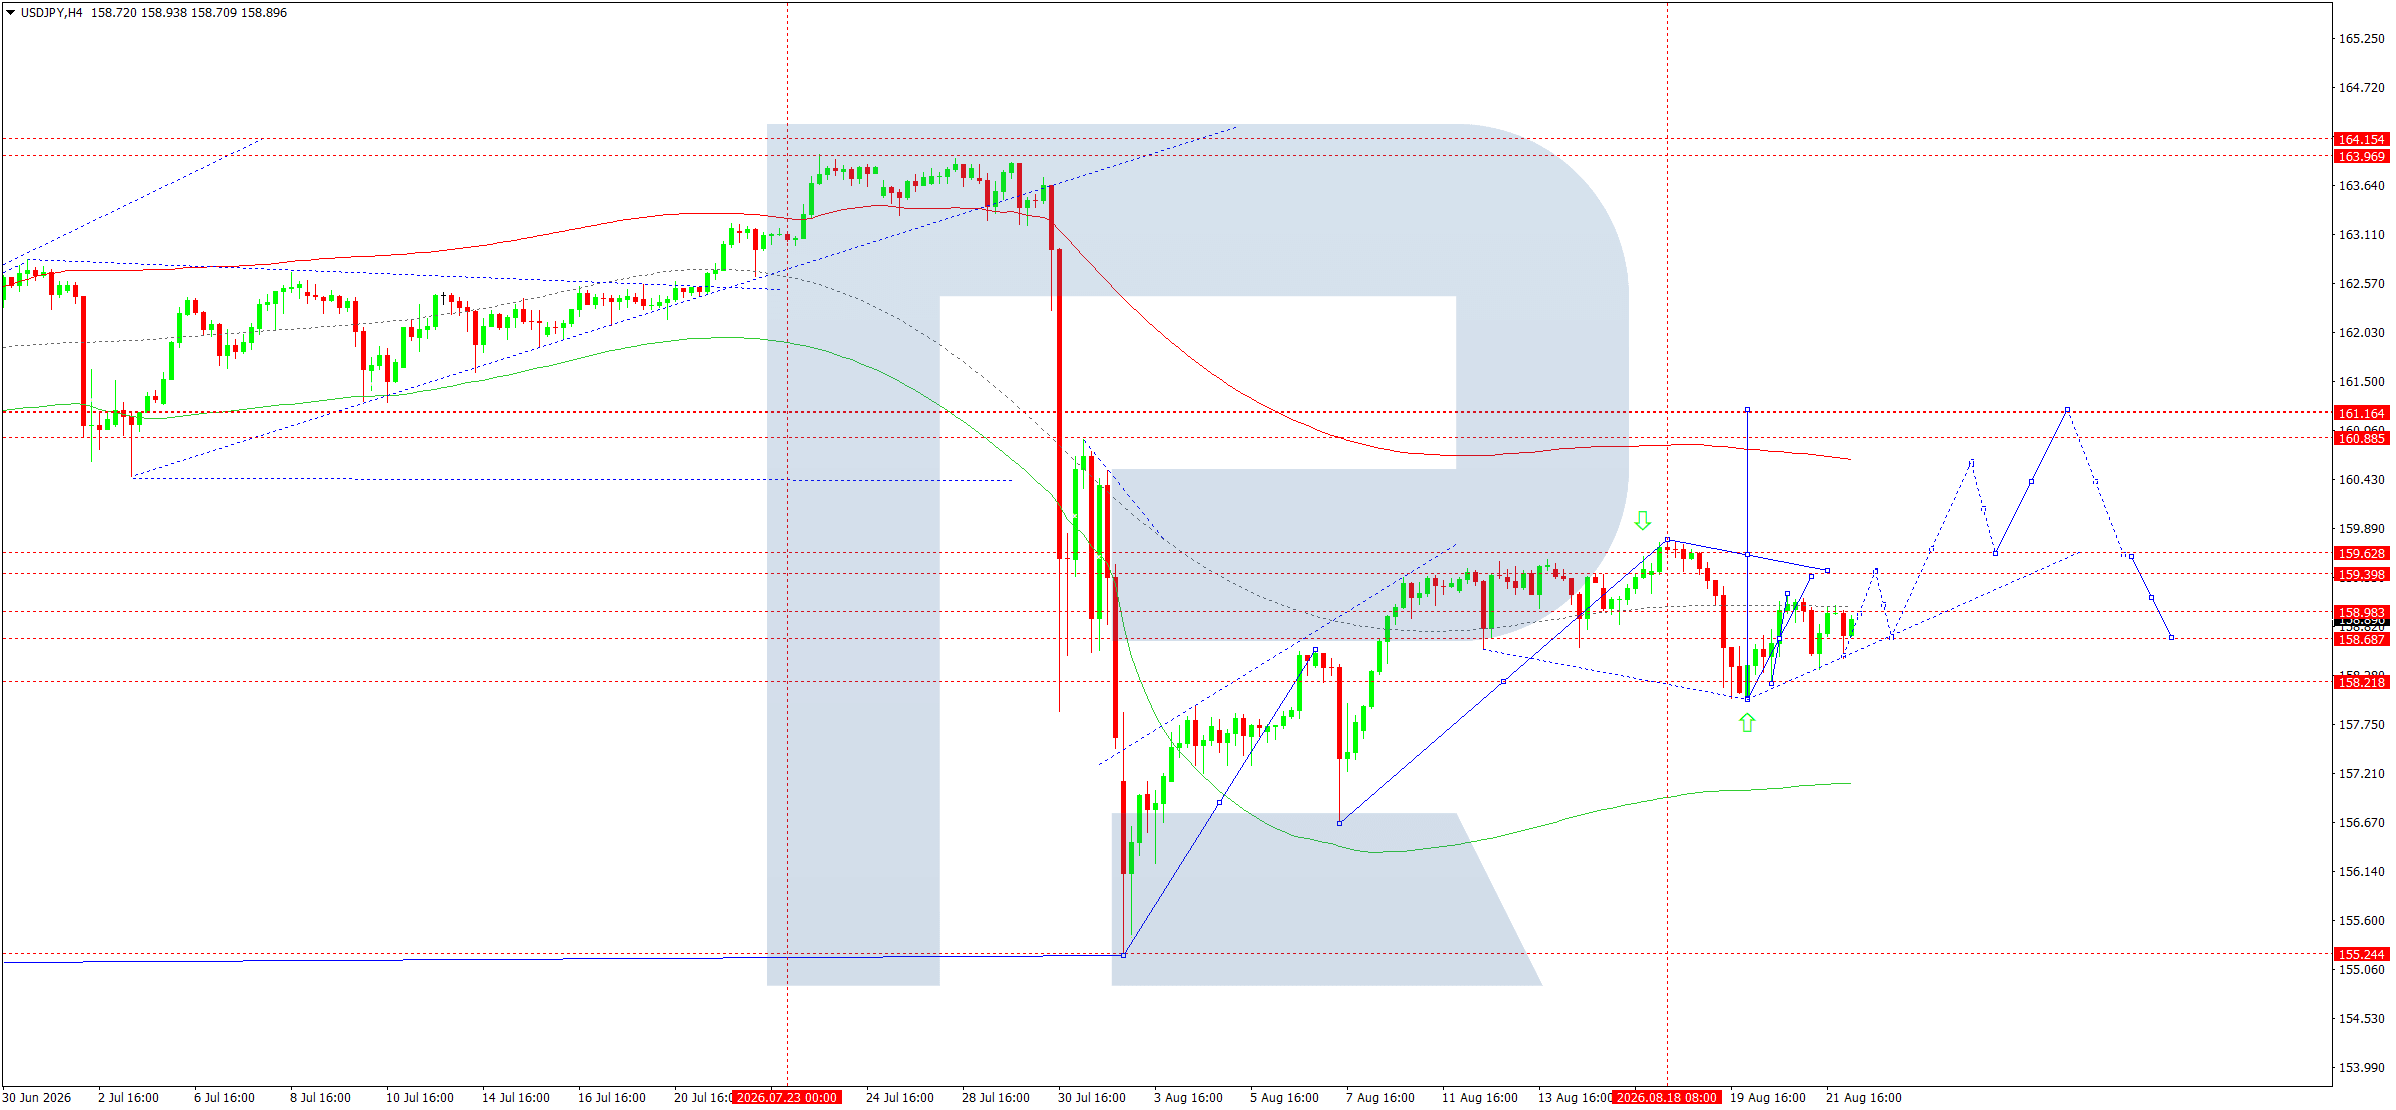
On the H4 chart, the market formed an upward wave towards 159.00 after a corrective decline to 157.48. The price is currently consolidating around the central line of the Price Envelope, with the matrix pivot point at 158.20.
The main medium-term trend remains uncertain after the sharp decline, but the current H4 structure suggests the continuation of the local upward wave. As long as 158.68 holds as support, the price retains the potential to move towards 159.40. A breakout above 159.40 would create the preconditions for a further move towards 161.16. For the coming trading day, the bullish scenario from the current area is preferred.
Trading scenario: BUY
Price at the time of writing: 158.88
Entry price: 158.88
Stop loss: 158.55
Take profit: 159.40
Risk-to-reward ratio: 1:1.58
GBPUSD forecast
The fundamental backdrop for the pound remains relatively favourable. UK inflation rose to 2.9% in July, limiting the scope for the Bank of England to ease policy quickly. In July, the BoE kept the interest rate at 3.75%, with some committee members voting for a rate hike. At the same time, the UK economy is showing resilience, although retail sales fell by 0.5% month-on-month in July.
The GBPUSD pair is also receiving additional support from US dollar weakness. As a result, the fundamental backdrop is currently likely to support the pound’s uptrend, although high energy costs and inflation risks are limiting its upside potential.
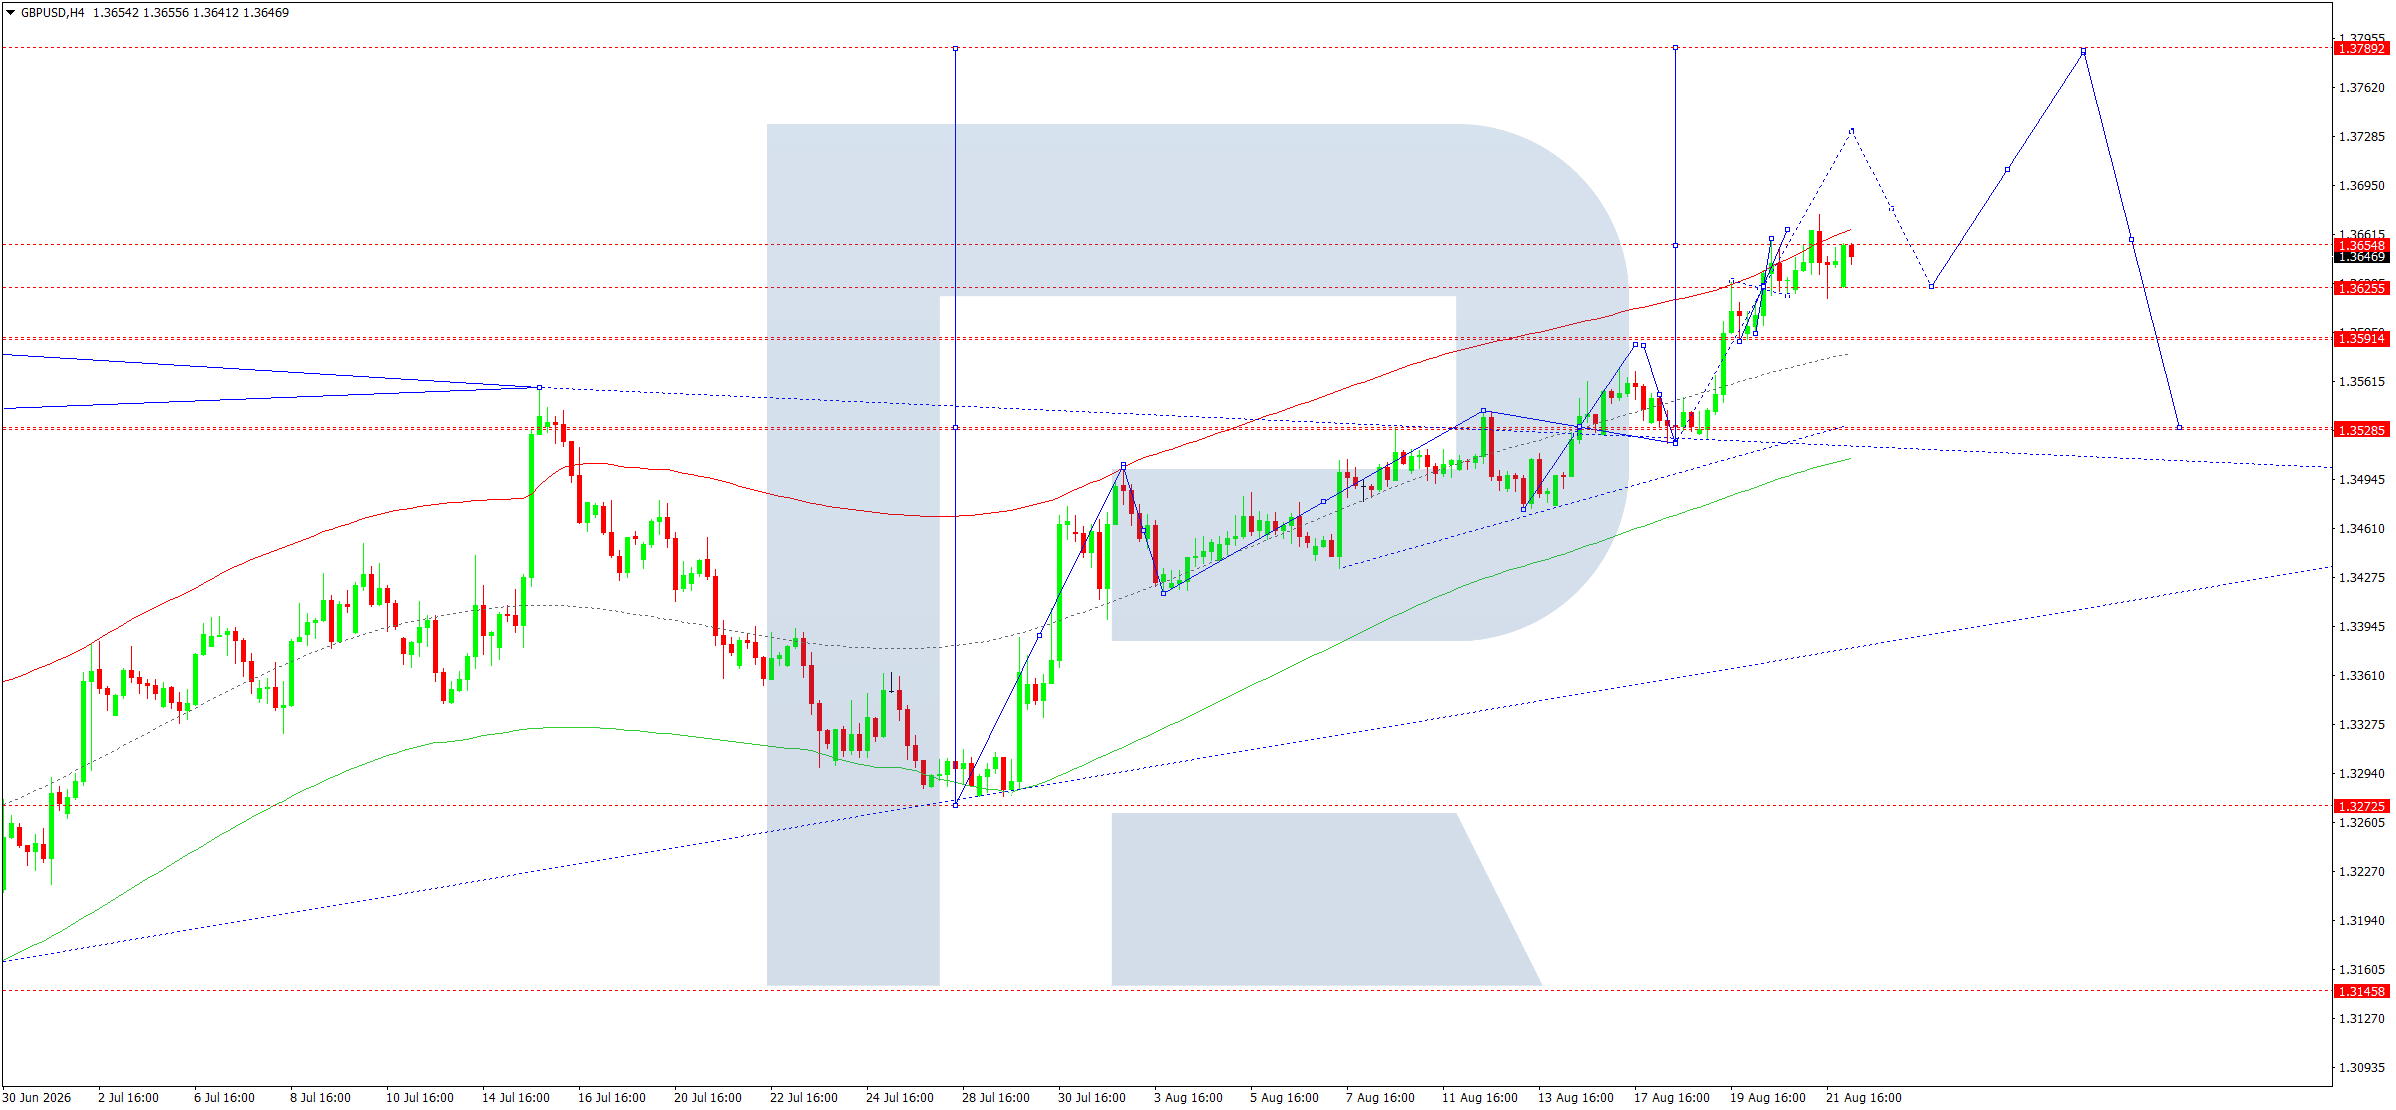
On the H4 chart, the GBPUSD pair formed upward momentum, followed by a consolidation range around 1.3626. The price is trading directly below the upper boundary of the Price Envelope at 1.3656. The matrix pivot point is located at 1.3528 and remains the key level for the entire upward structure.
The underlying trend remains upward. The most likely scenario for the coming trading day is an upside breakout from the current consolidation range, followed by a move towards 1.3734. If momentum persists, the next target will be 1.3788. As long as the price remains above 1.3605, the bullish structure retains the advantage.
Trading scenario: BUY
Price at the time of writing: 1.3644
Entry price: 1.3644
Stop loss: 1.3605
Take profit: 1.3734
Risk-to-reward ratio: 1:2.31
AUDUSD forecast
The Australian dollar remains bolstered by the Reserve Bank of Australia’s high interest rate, currently at 4.35%. Inflation also remains elevated: the June reading was 3.8%, while the next CPI figure is due on 26 August. At its August meeting, the RBA kept the rate unchanged and noted that inflation risks remained elevated.
Commodity prices and the state of the Chinese economy are also important for the AUD. Despite geopolitical tensions and instability in global demand, the Australian dollar’s current dynamics remain constructive. US dollar weakness provides additional support for the AUDUSD rate.
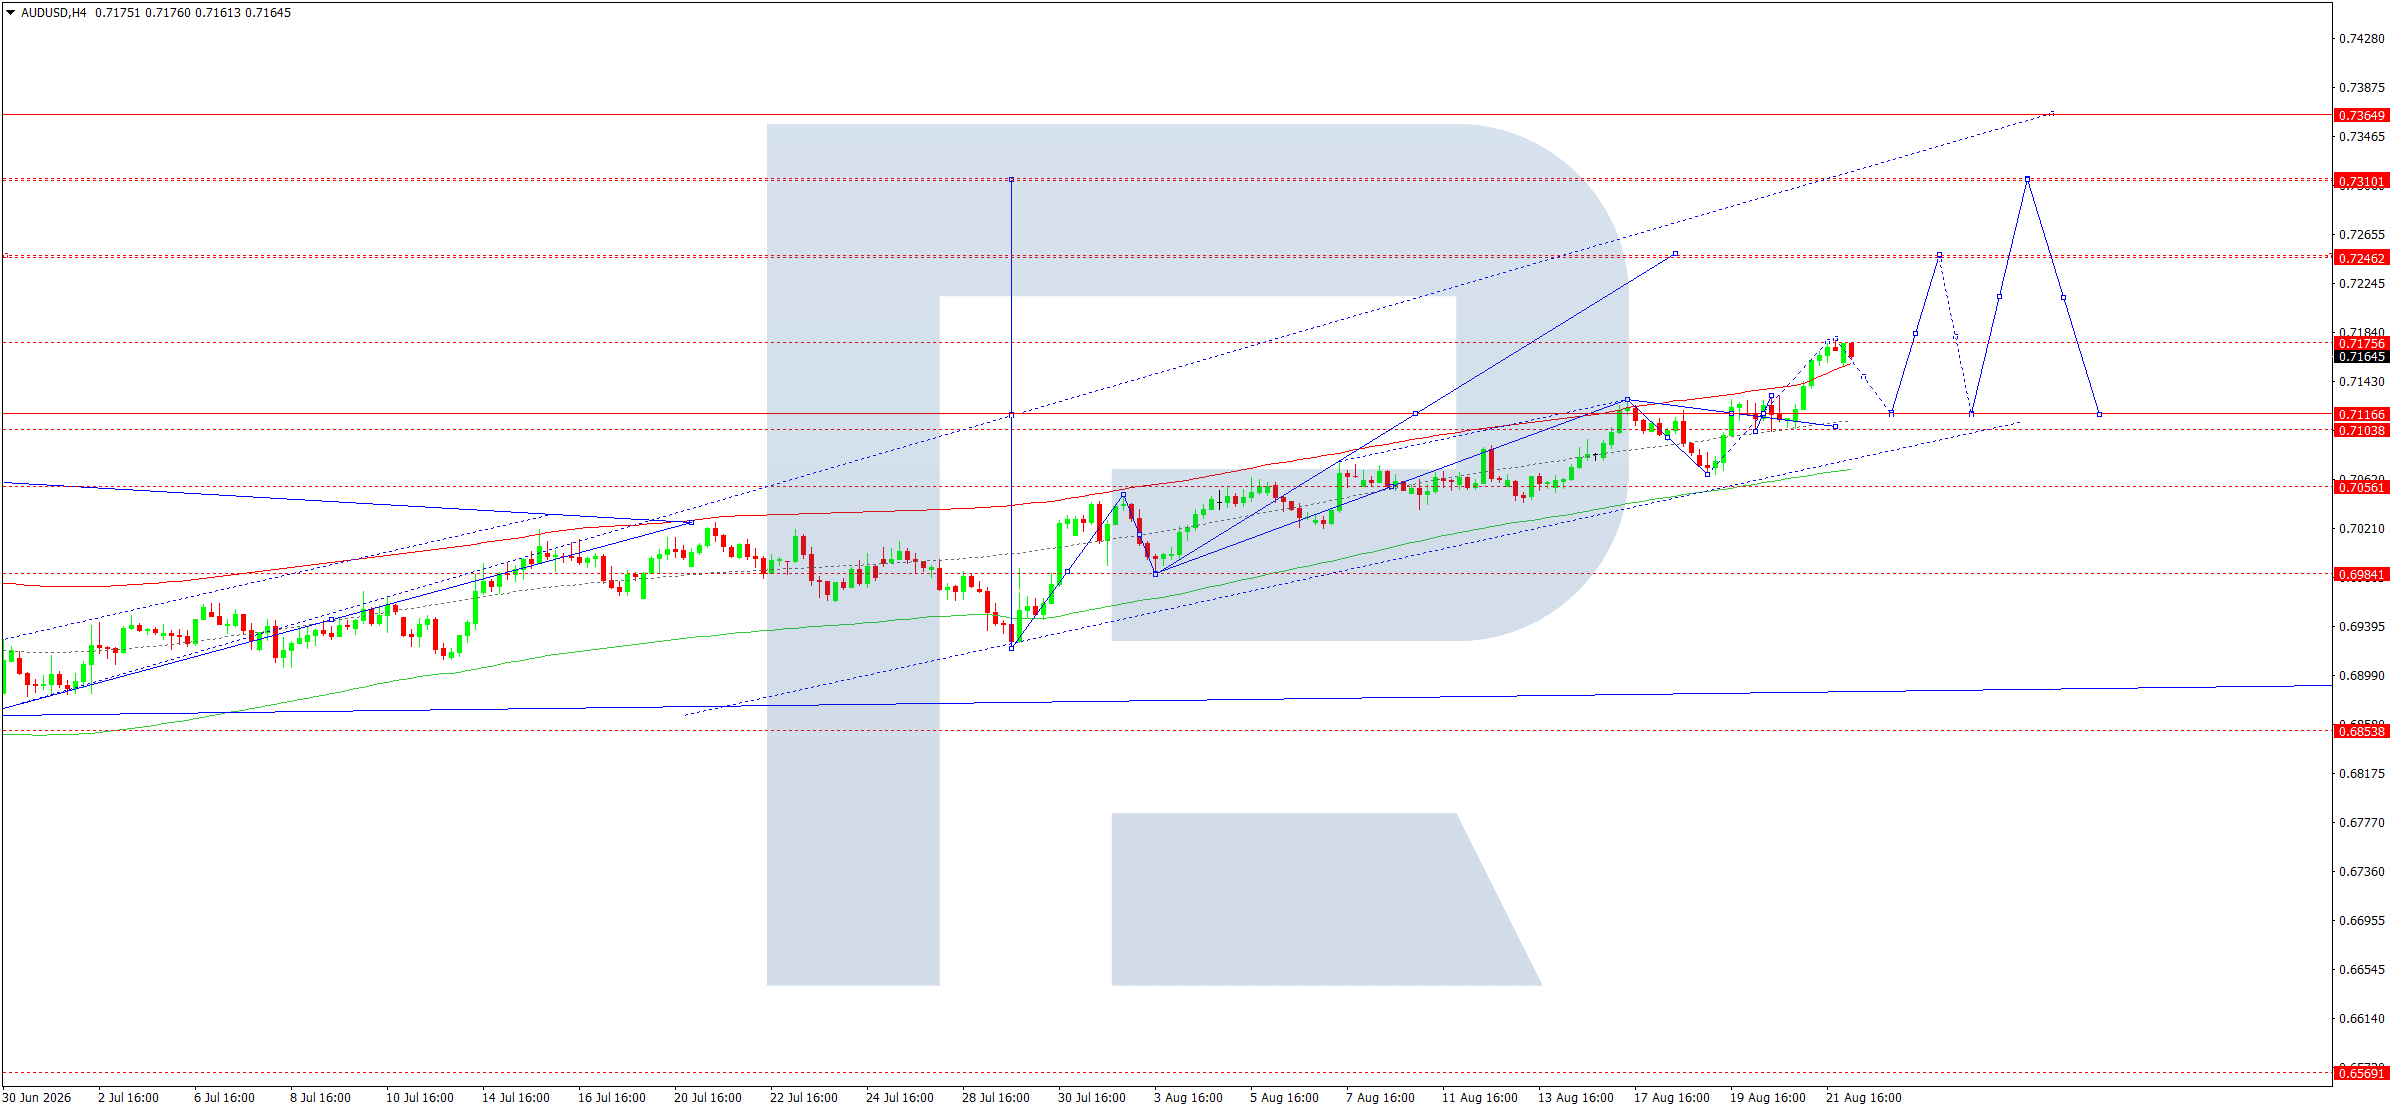
On the H4 chart, the AUDUSD pair formed a sustained upward structure and reached 0.7177. The market is currently consolidating directly below the resistance level. The pivot point of the matrix is at 0.7116 and serves as the main support area for the upward wave.
The main trend remains upward. The nearest target after a breakout from consolidation is 0.7276, followed by 0.7320 if momentum persists. A corrective decline towards 0.7116 is considered a support area from which the upward structure could gain fresh momentum.
Trading scenario: BUY
Price at the time of writing: 0.7166
Entry price: 0.7166
Stop loss: 0.7110
Take profit: 0.7276
Risk-to-reward ratio: 1:1.96
USDCAD forecast
The fundamental backdrop for the Canadian dollar changed sharply after trade relations between the US and Canada deteriorated. The US imposed 50% tariffs on approximately 20 billion USD of Canadian imports, after which Canada announced preparations for retaliatory measures. This creates additional pressure on Canada’s economic outlook and is a risk factor for the CAD.
The Bank of Canada is keeping its policy rate at 2.25% and assesses the economy as weak, although signs of recovery have already emerged. Meanwhile, oil prices remain high due to the geopolitical conflict surrounding Iran, which limits USDCAD’s upside potential. The fundamental backdrop is therefore mixed, although the trade dispute is a short-term argument in favour of the US dollar against the CAD.
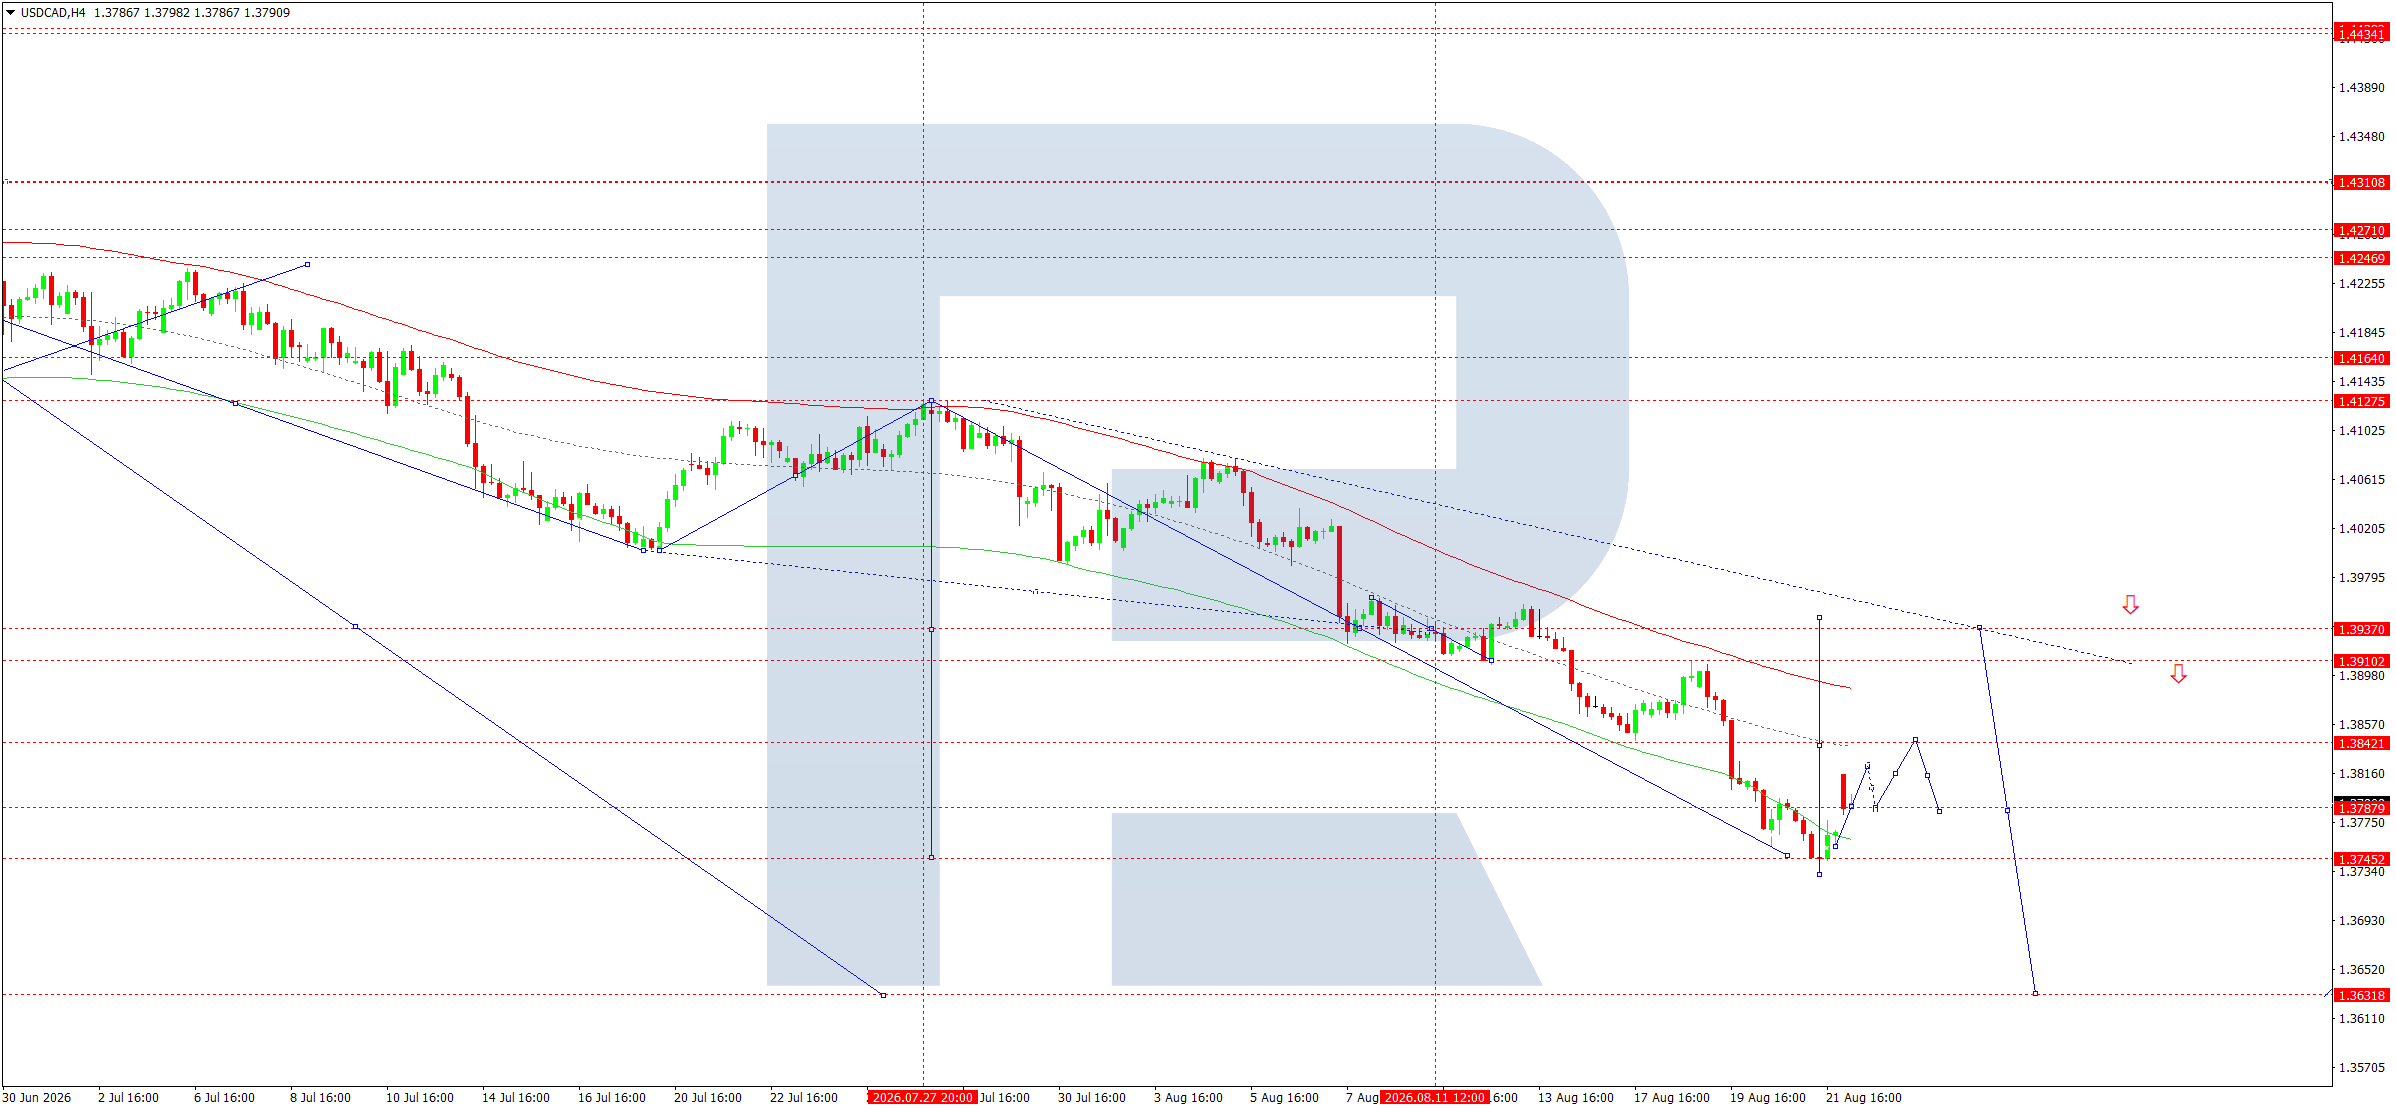
On the H4 chart, the USDCAD pair completed a downward wave towards 1.3732 and formed a consolidation area. The pivot point of the wave matrix is at 1.3937. Although the higher-order bearish structure remains intact, the current setup suggests a corrective upward wave.
The main short-term scenario suggests a move towards 1.3842, followed by a test of the 1.3910 level. Holding above 1.3732 supports this scenario. Therefore, a buy position from the current area is preferred for the coming trading day.
Trading scenario: BUY
Price at the time of writing: 1.3795
Entry price: 1.3795
Stop loss: 1.3730
Take profit: 1.3910
Risk-to-reward ratio: 1:1.77
XAUUSD forecast
Gold enters the new week amid a strong fundamental backdrop. The metal has risen above 4,600 USD per ounce, bolstered by US dollar weakness, high uncertainty in the US debt market, and persistent geopolitical risks. The conflict between the US and Iran and uncertainty surrounding the Strait of Hormuz remain additional factors. Meanwhile, the market is awaiting new US inflation data and Federal Reserve Chairman Kevin Warsh’s speech in Jackson Hole.
The strategic fundamental backdrop for gold therefore remains bullish. However, after the sharp upward momentum, the likelihood of a technical correction has increased significantly.
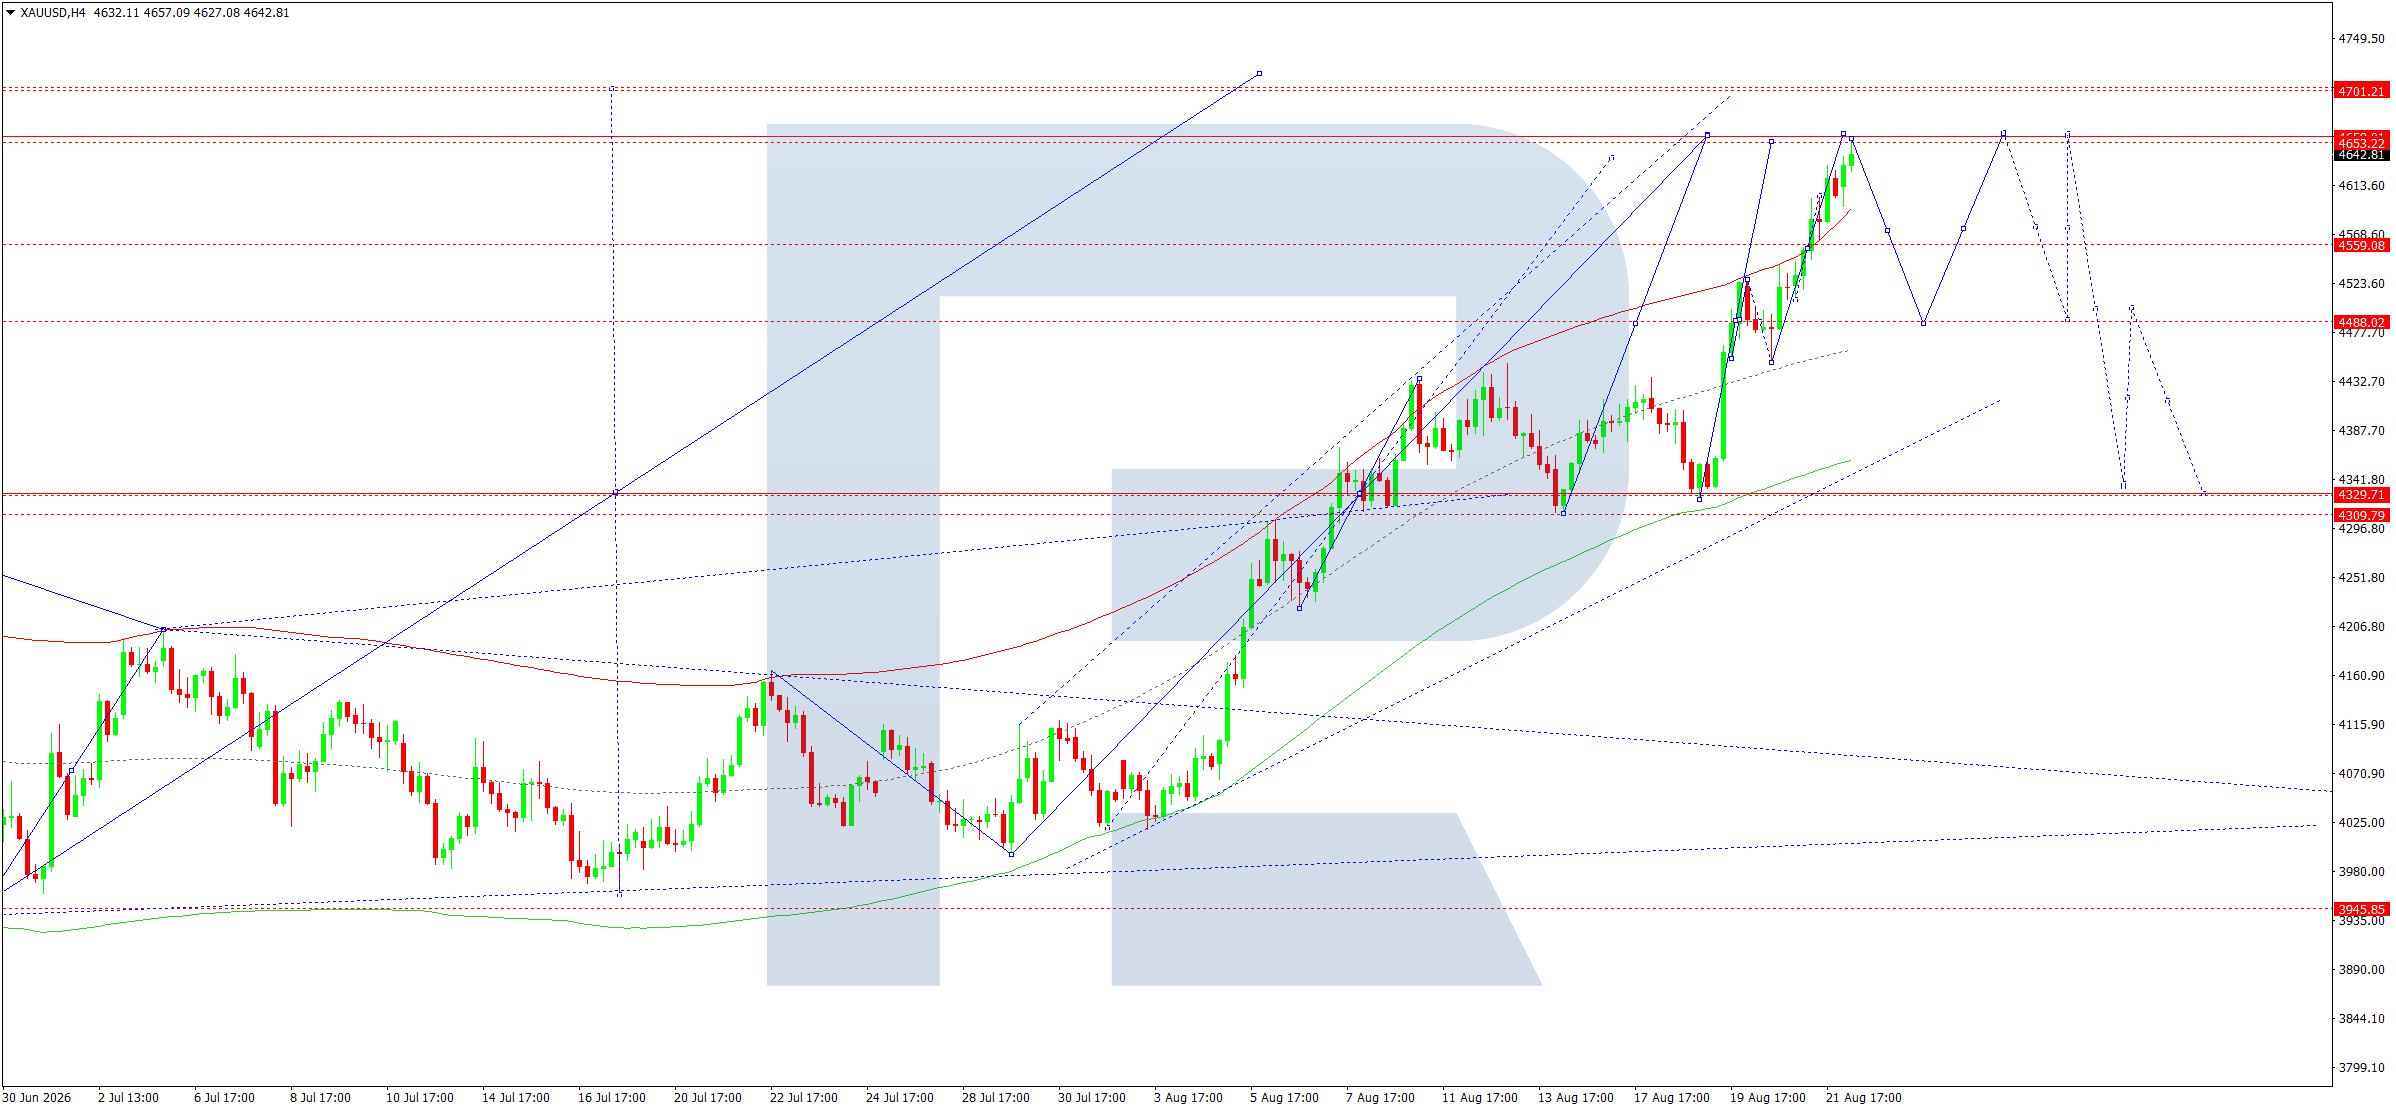
On the H4 chart, XAUUSD formed a strong upward wave from the 4,330 area and reached the upper boundary of the Price Envelope around 4,652–4,657. Following this momentum, the market began to consolidate below the resistance level. The wave matrix has a pivot point at 4,330, while the nearest central line of the Price Envelope is located around 4,488.
Despite the overall uptrend, the corrective scenario is preferred for the coming trading day. If prices move below the current area, the market could form a downward wave towards 4,488. Once the correction is complete, the upward structure may resume with a target of retesting 4,660.
Trading scenario: SELL
Price at the time of writing: 4,639
Entry price: 4,639
Stop loss: 4,670
Take profit: 4,488
Risk-to-reward ratio: 1:4.87
US 500 forecast
The US stock market starts the week amid heightened uncertainty. Prices are being affected simultaneously by high Treasury yields, geopolitical tensions surrounding Iran, the US-Canada trade dispute, and expectations ahead of Federal Reserve Chairman Kevin Warsh’s speech in Jackson Hole. NVIDIA’s results, due on 26 August, are an additional risk factor. Last week, the US 500 ended lower, breaking a three-week winning streak.
Elevated bond yields are weighing on technology company valuations and are limiting the broader stock market’s upside potential. Therefore, the fundamental backdrop at the start of the week is broadly neutral to negative.
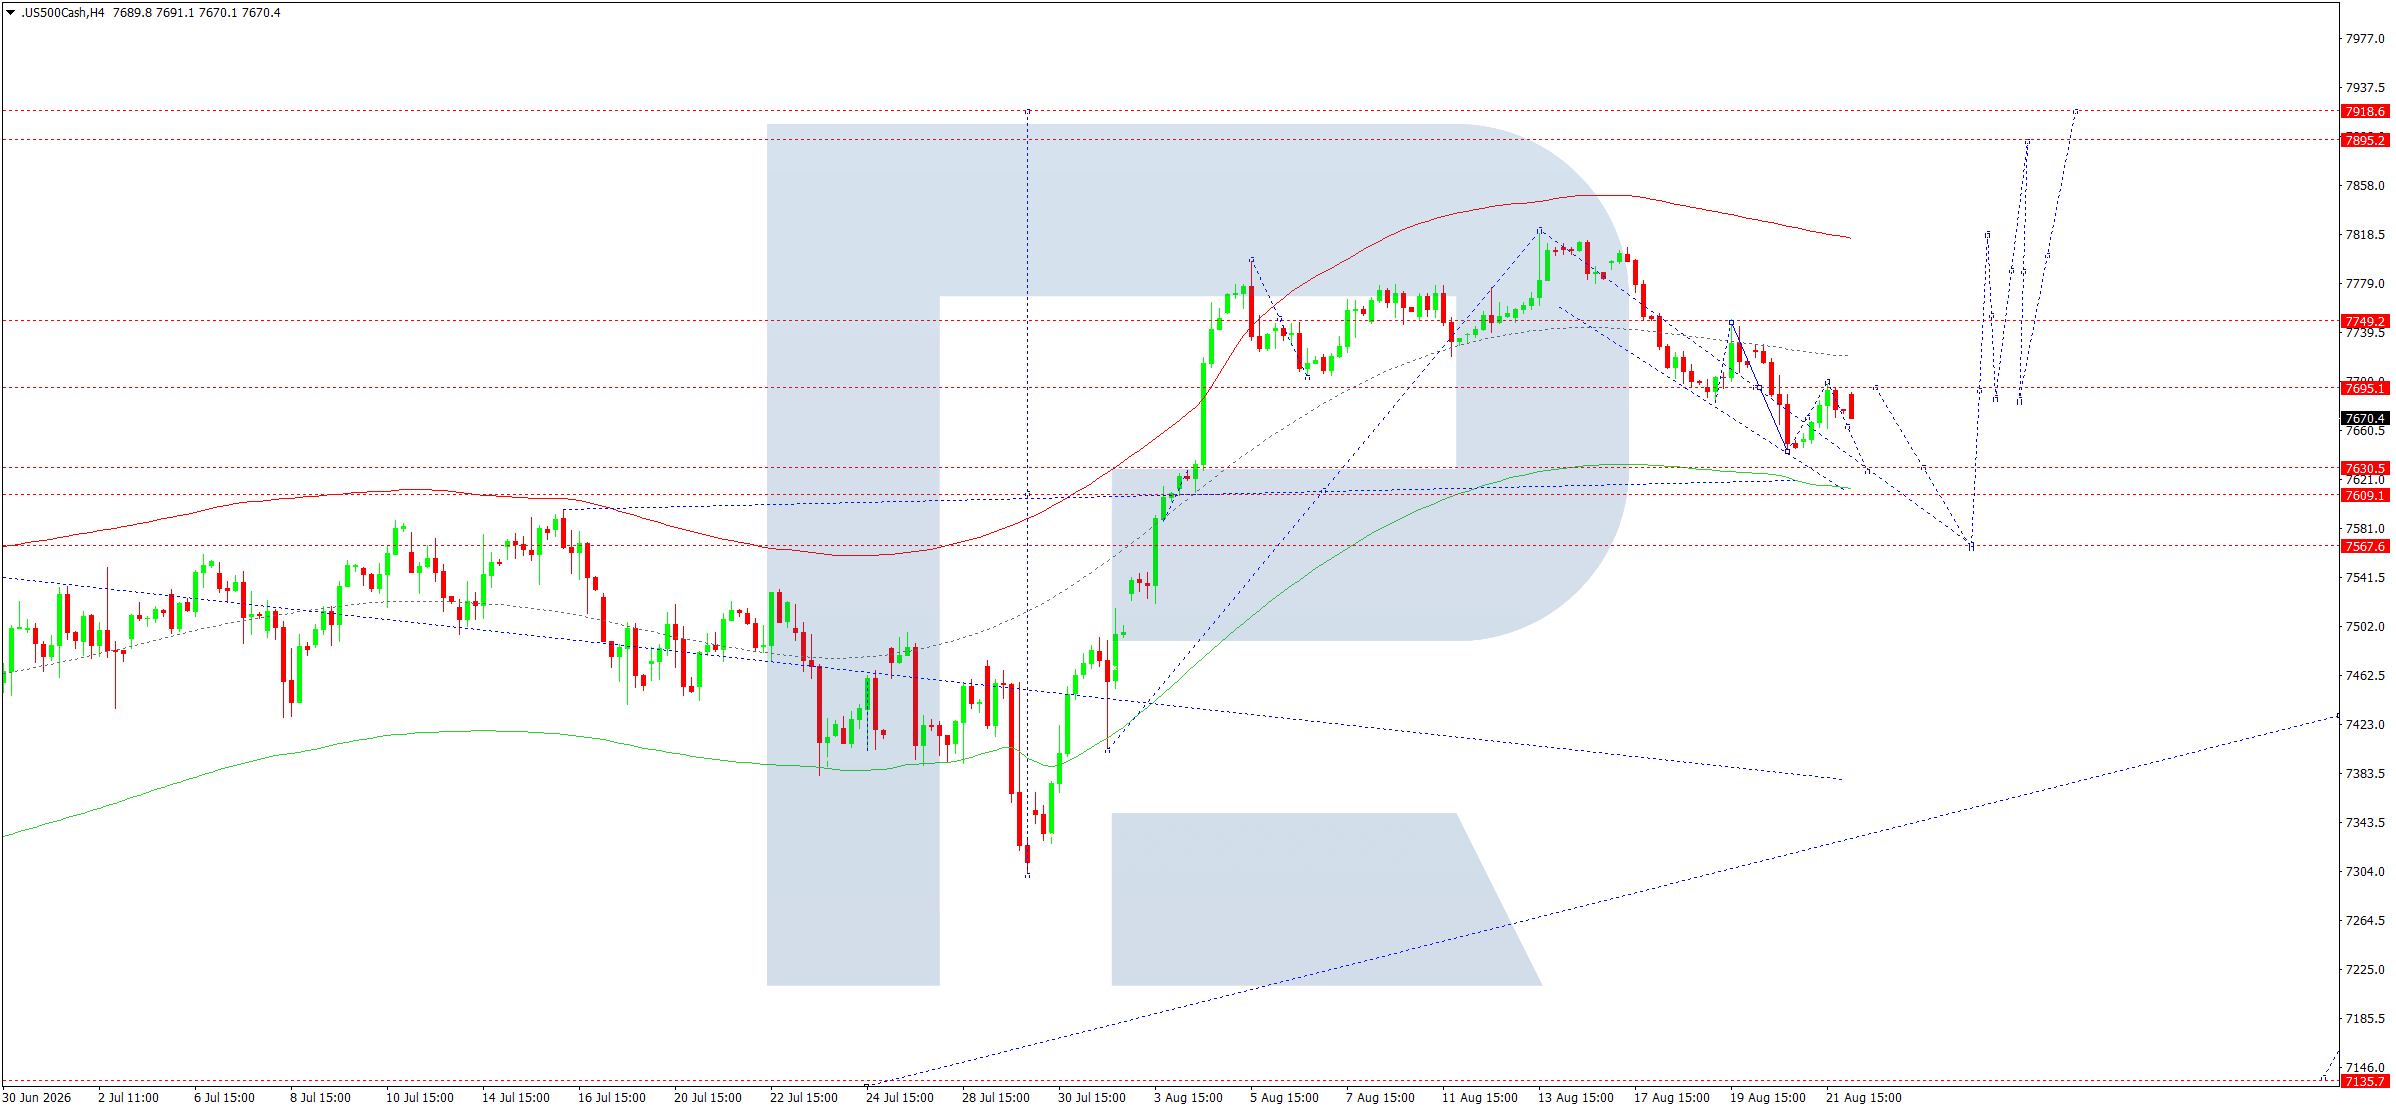
On the H4 chart, the US 500 completed an upward wave towards 7,695 before moving into a downward corrective structure. The price is trading around 7,671, below the key 7,695 area. The chart indicates potential for a move towards the lower boundary of the Price Envelope around 7,567.
The main short-term trend is downward, with the first downside target at 7,630 and the primary target at 7,567. A return above 7,695 would weaken the bearish scenario, but as long as the market remains below this area, sellers retain the advantage.
Trading scenario: SELL
Price at the time of writing: 7,671
Entry price: 7,671
Stop loss: 7,750
Take profit: 7,567
Risk-to-reward ratio: 1:1.32
BTCUSD forecast
Bitcoin starts the week after one of the strongest weekly rallies of the year. The price had previously risen to almost 80,000 USD, while inflows into US spot Bitcoin ETFs totalled around 1.9 billion USD over the week. The cryptocurrency market also received support from US dollar weakness, the US Treasury’s buyback program for long-term government bonds, and expectations of further developments in cryptocurrency regulation.
The strategic fundamental backdrop for BTCUSD therefore remains positive. However, after gaining more than 20% in a week, the market has entered an area of heightened profit-taking risk. As a result, a technical correction is becoming more likely over the coming trading day.
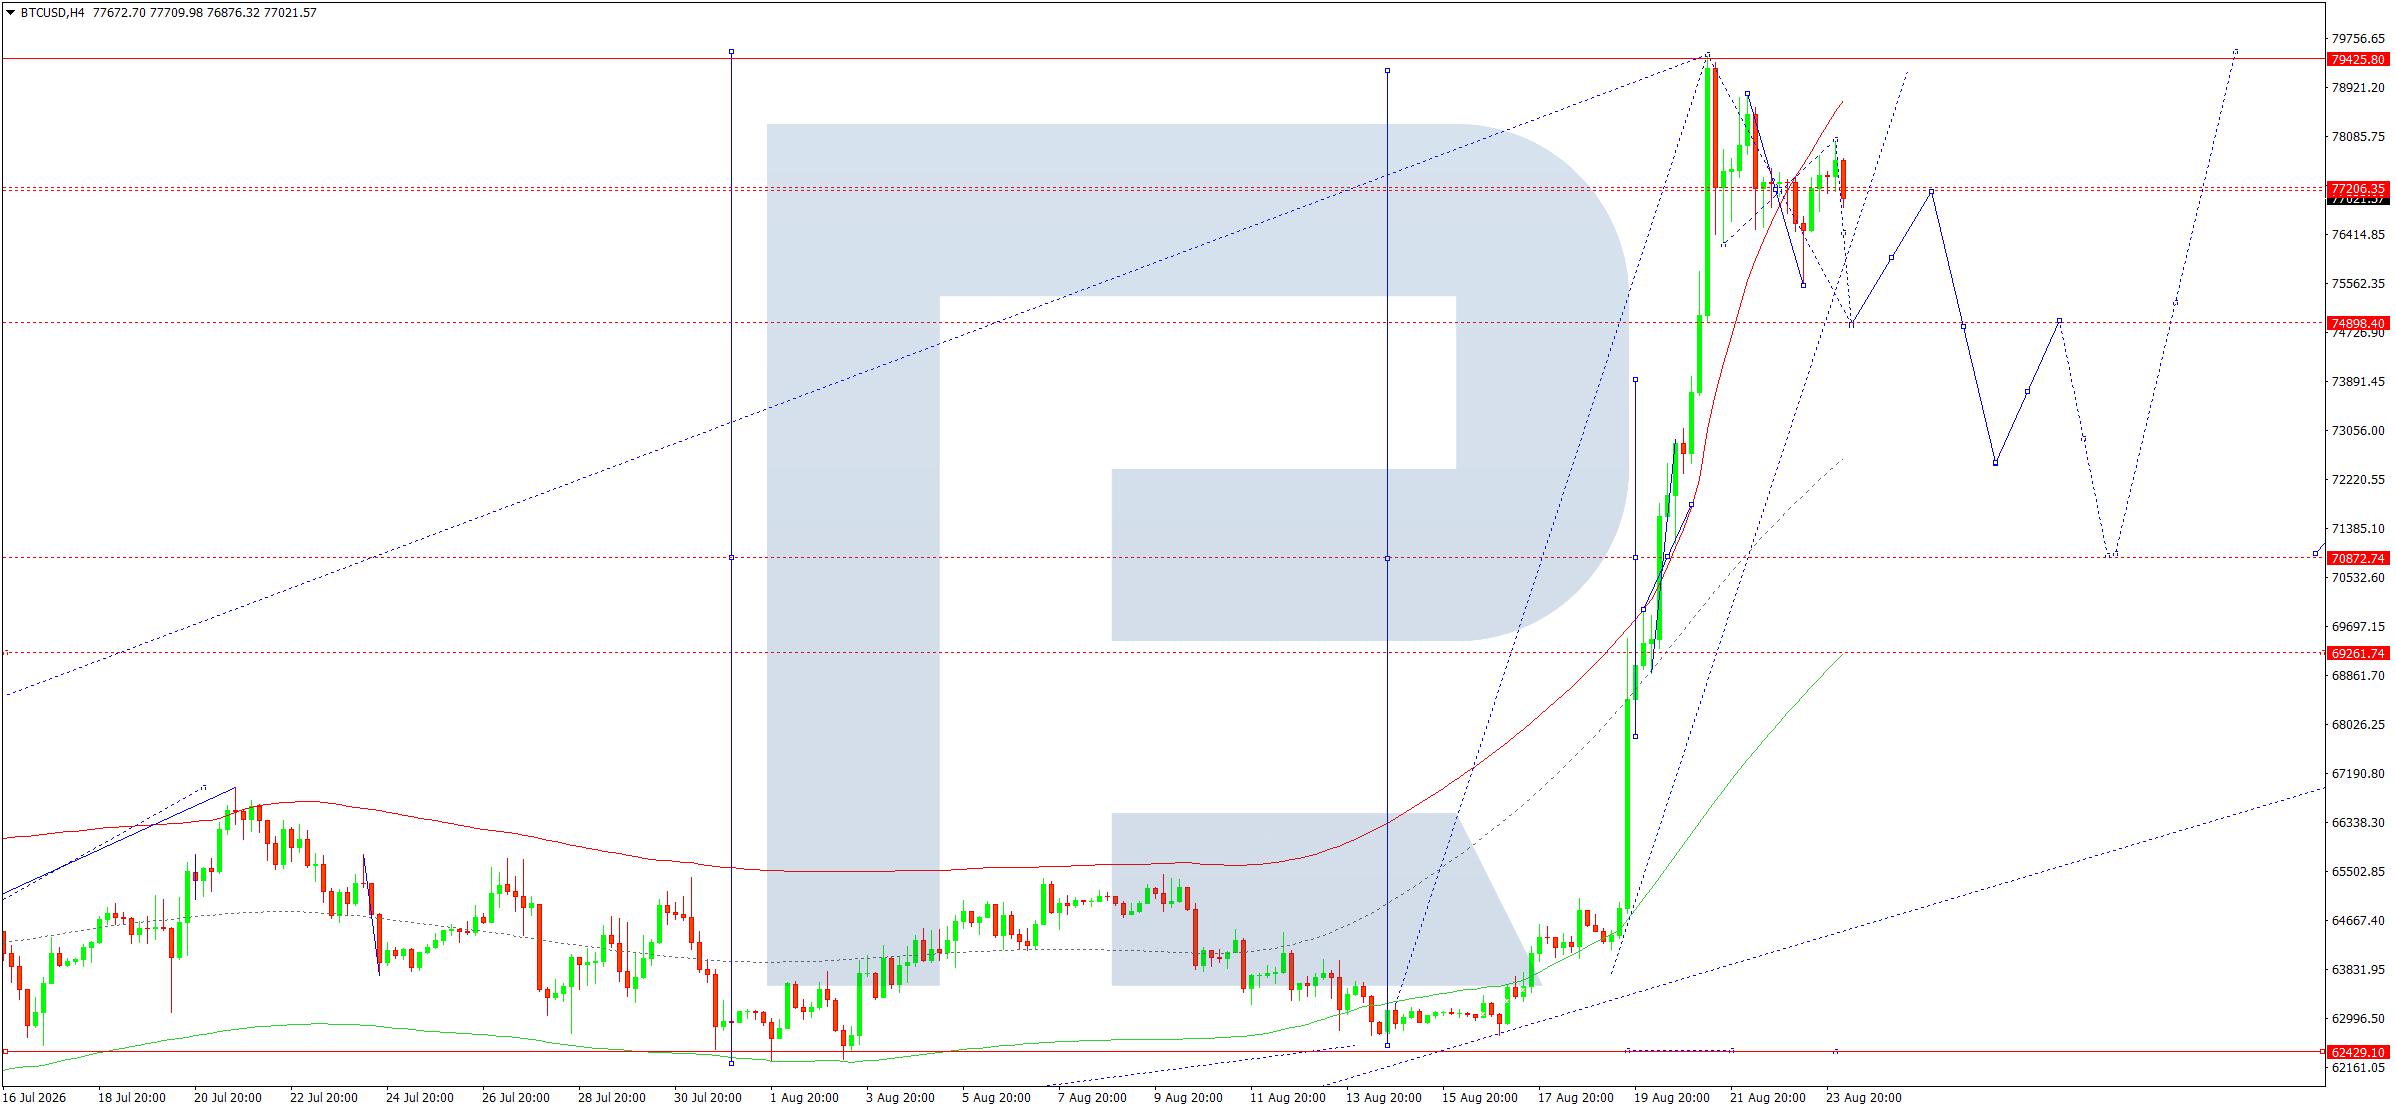
On the H4 chart, BTCUSD formed a strong upward wave from the 62,429 area towards 79,425. After reaching the upper boundary of the Price Envelope, the market began to form a corrective structure. The price is currently hovering around 77,000, while the nearest key resistance level is located at 79,425.
The pivot point of the wave matrix is at 70,872. The central line of the current Price Envelope is located around 74,898. Therefore, after the strong upward impulse, the most logical scenario for the coming trading day is a corrective decline towards 74,900. At the same time, the overall medium-term trend remains upward.
Trading scenario: SELL
Price at the time of writing: 77,000
Entry price: 77,000
Stop loss: 77,900
Take profit: 74,900
Risk-to-reward ratio: 1:2.33
Editors’ picks
 EURUSD forecast 2026–2027: technical analysis, price levels & predictions
EURUSD has pulled back from the 2026 high of 1.1915 and is now trading near 1.1450 — below both EMA65 and EMA200 — with the active scenario shifting from bullish to bearish. The ECB raised rates to 2.40%, but the Fed holds at 3.75%, and US inflation (3.5%) continues to outpace the eurozone (2.8%). A confirmed break below 1.1280 opens the next downward wave toward 1.1080. We break down the key levels, three trading scenarios with entry triggers, and what Deutsche Bank, Morgan Stanley and UBS are forecasting for EURUSD in 2026.
 Gold (XAUUSD) forecast 2026: predictions based on fundamental and technical analysis
Gold has corrected over 25% from its all-time high of 5,597 USD and is now trading near 4,100 USD — testing a critical support zone. Is this the bottom, or will the downtrend continue? We break down the key levels (support 3,920 USD, breakout trigger 4,500 USD), three trading scenarios with entry levels, and what J.P. Morgan, Goldman Sachs and Deutsche Bank are forecasting for gold in 2026.
Forecasts presented in this section only reflect the author’s private opinion and should not be considered as guidance for trading. RoboForex bears no responsibility for trading results based on trading recommendations described in these analytical reviews.