
Daily technical analysis and forecast for 25 August 2026
Daily technical analysis and forecast for EURUSD, USDJPY, GBPUSD, AUDUSD, USDCAD, XAUUSD, US 500, and BTCUSD for 25 August 2026.
Each scenario on this page reflects the H4 market structure as of 25 August 2026 and stays relevant for the current trading day. It closes once the price reaches the take-profit or stop-loss level, or once the trading day ends with neither level reached. A new analysis with updated levels is published every trading day, so check the latest version rather than an older one.
EURUSD forecast
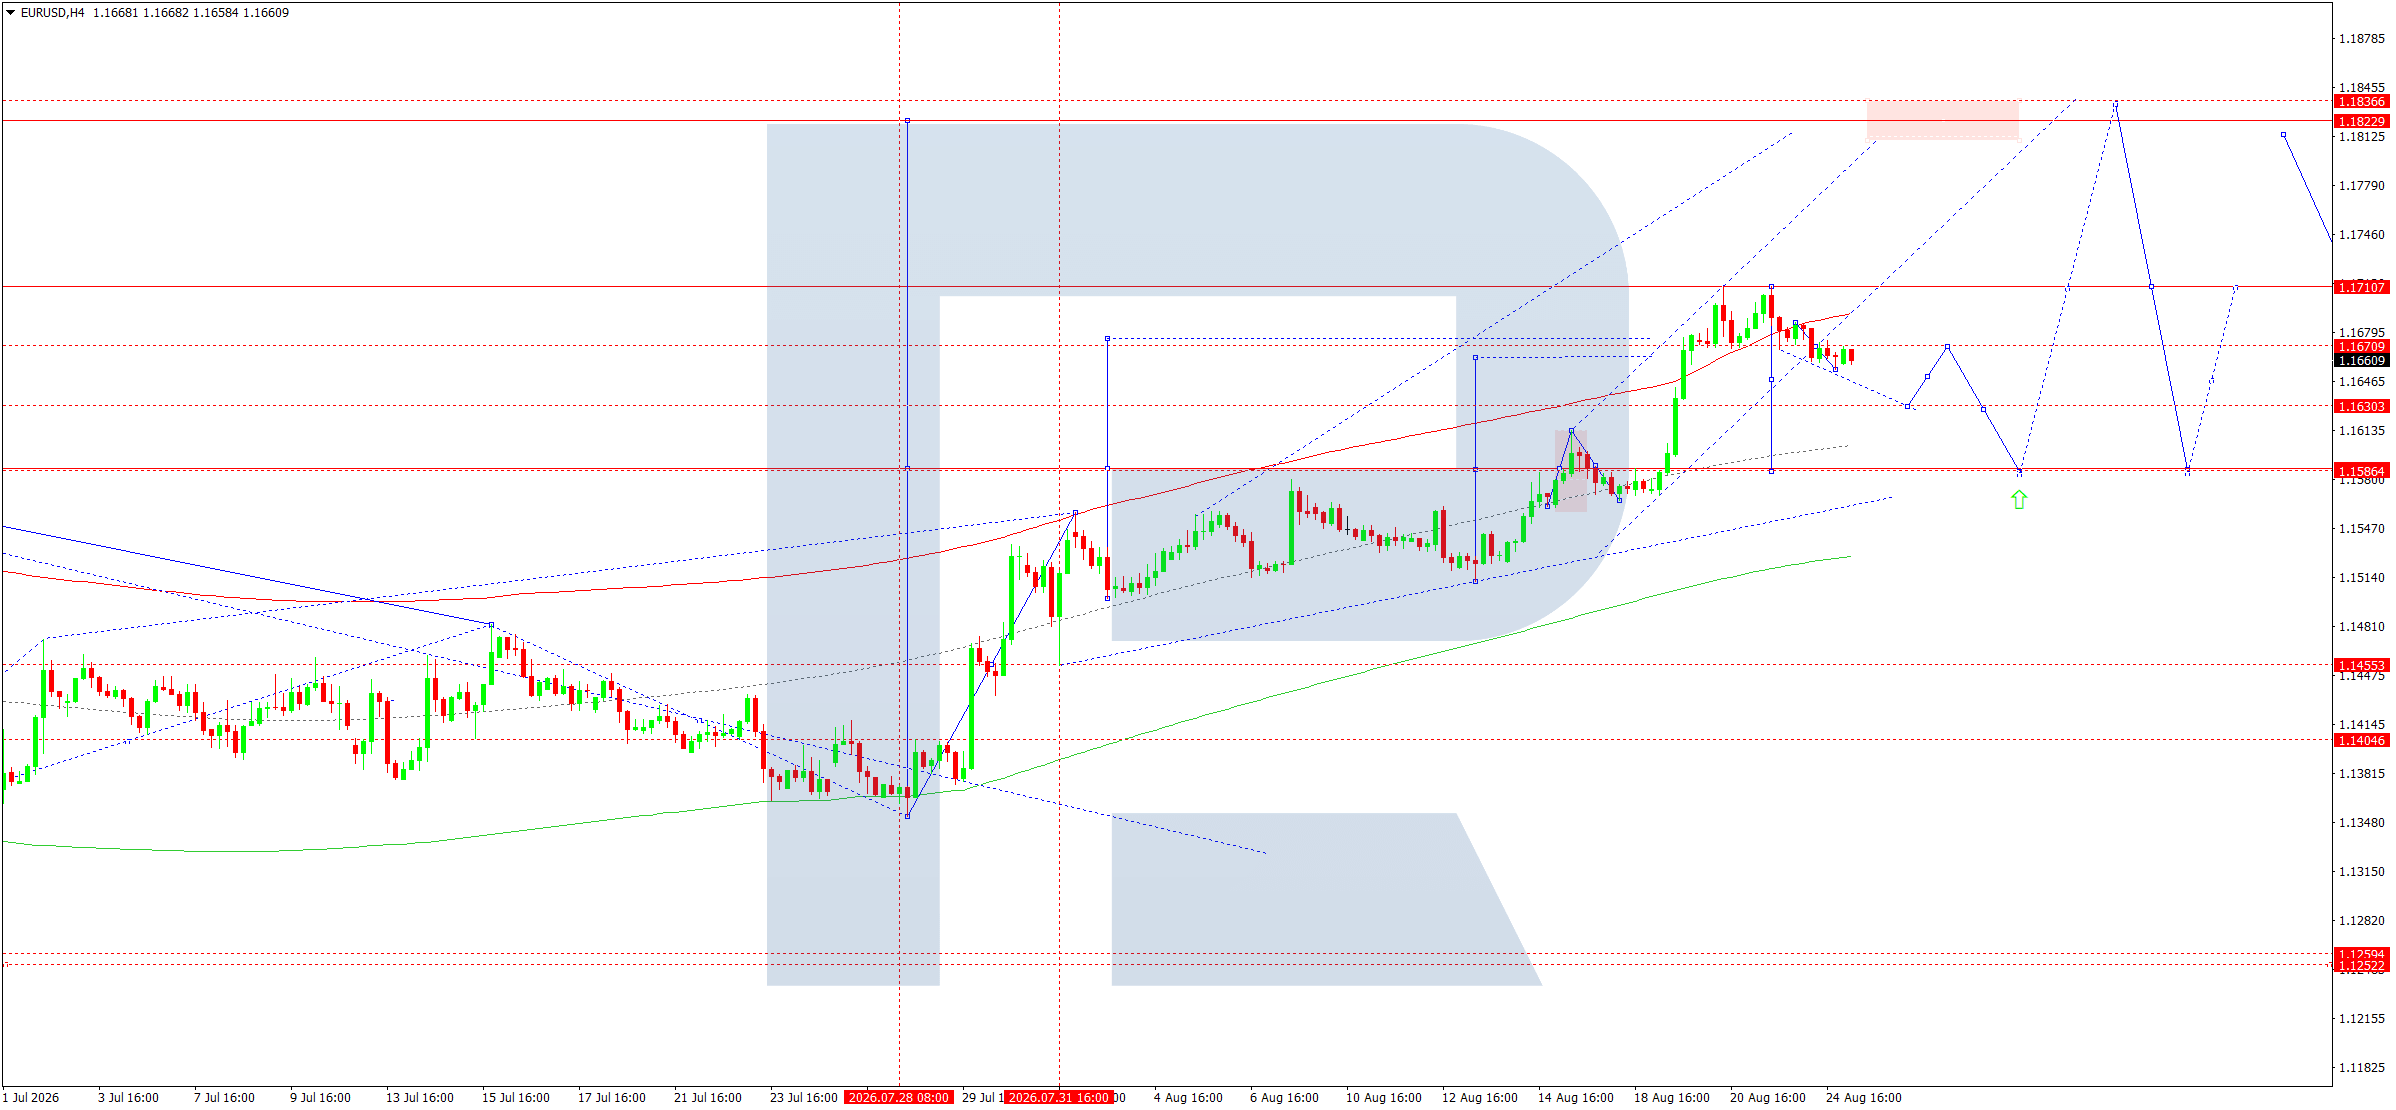
On the H4 chart, the EURUSD pair maintains an upward medium-term structure, but after reaching the 1.1710–1.1711 area, the market entered a local corrective phase. The price is currently hovering around 1.1655, while the sellers’ nearest technical objective is a decline towards 1.1630. A breakout below this level would open the way towards the central area of the matrix around 1.1586–1.1581.
The fundamental backdrop on 25 August remains mixed. At its latest meeting, the European Central Bank kept interest rates unchanged and continues to base its decisions on incoming data. At the same time, elevated energy prices due to the geopolitical conflict continue to pose a risk of renewed inflationary pressure in the eurozone. Meanwhile, the US dollar is receiving short-term support from increased demand for safe-haven assets and expectations ahead of key US inflation data, as well as Federal Reserve Chairman Kevin Warsh’s speech in Jackson Hole.
From a technical perspective, the main trend remains upward, but the current phase is corrective. The price has formed a consolidation range below the upper boundary of the Price Envelope at 1.1710. As long as the market remains below this area, the probability of a test of 1.1630 and then 1.1586 remains elevated. A return above 1.1710 would invalidate the local bearish scenario and create conditions for further growth towards 1.1830.
Trading scenario: SELL
- Price at the time of writing: 1.1655
- Entry price: 1.1650
- Stop loss: 1.1685
- Take profit: 1.1586
- Risk-to-reward ratio: 1:1.83
USDJPY forecast
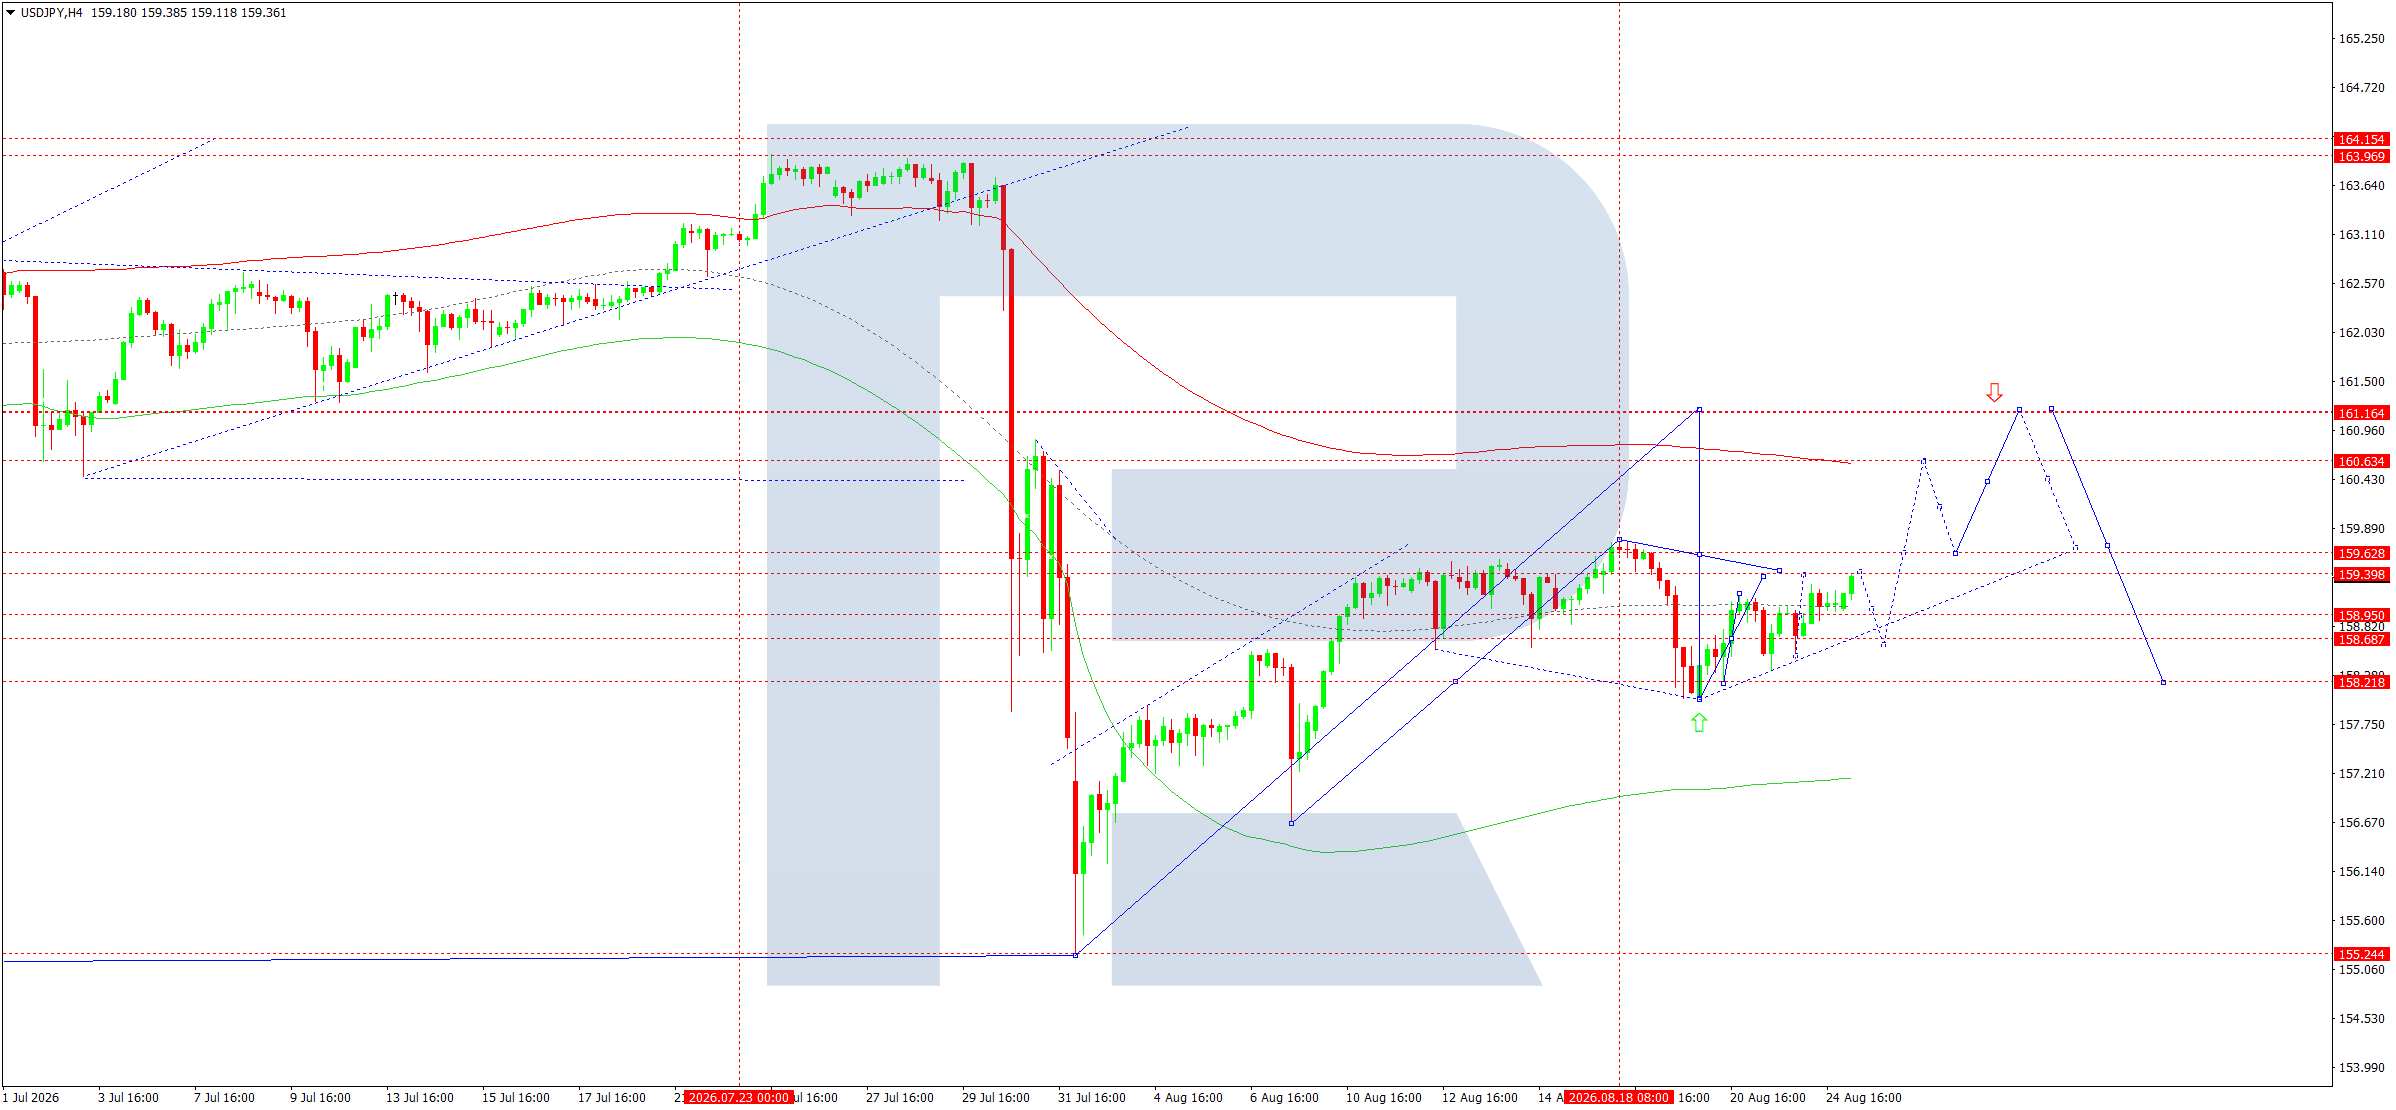
On the H4 chart, after a sharp decline, the USDJPY pair formed a recovery wave and approached the 159.30–159.40 area. The price is currently consolidating near this zone. The structure suggests a local reversal followed by a decline towards 158.68 and then 158.20, which is the key pivot point of the wave matrix.
The fundamental backdrop for the Japanese yen is gradually becoming more constructive. The Bank of Japan is keeping its policy rate around 0.75%, while the market continues to price in the possibility of further monetary policy tightening. Recent Japanese inflation data supports expectations of further policy normalisation, although the wide yield differential between the US and Japan continues to limit the yen’s upside potential. An additional risk factor remains the possibility of currency intervention by the Japanese authorities if the yen weakens excessively.
Technically, the main trend following the July sell-off remains a recovery, but the 159.40 area is a crucial resistance zone. As long as the price fails to consolidate above 159.40–160.00, a local correction remains the preferred scenario. A breakout below 158.68 would strengthen the move towards 158.20. Conversely, consolidation above 160.63 would bring the 161.16 target and higher levels back into play.
Trading scenario: SELL
- Price at the time of writing: 159.30
- Entry price: 159.35
- Stop loss: 159.75
- Take profit: 158.68
- Risk-to-reward ratio: 1:1.68
GBPUSD forecast
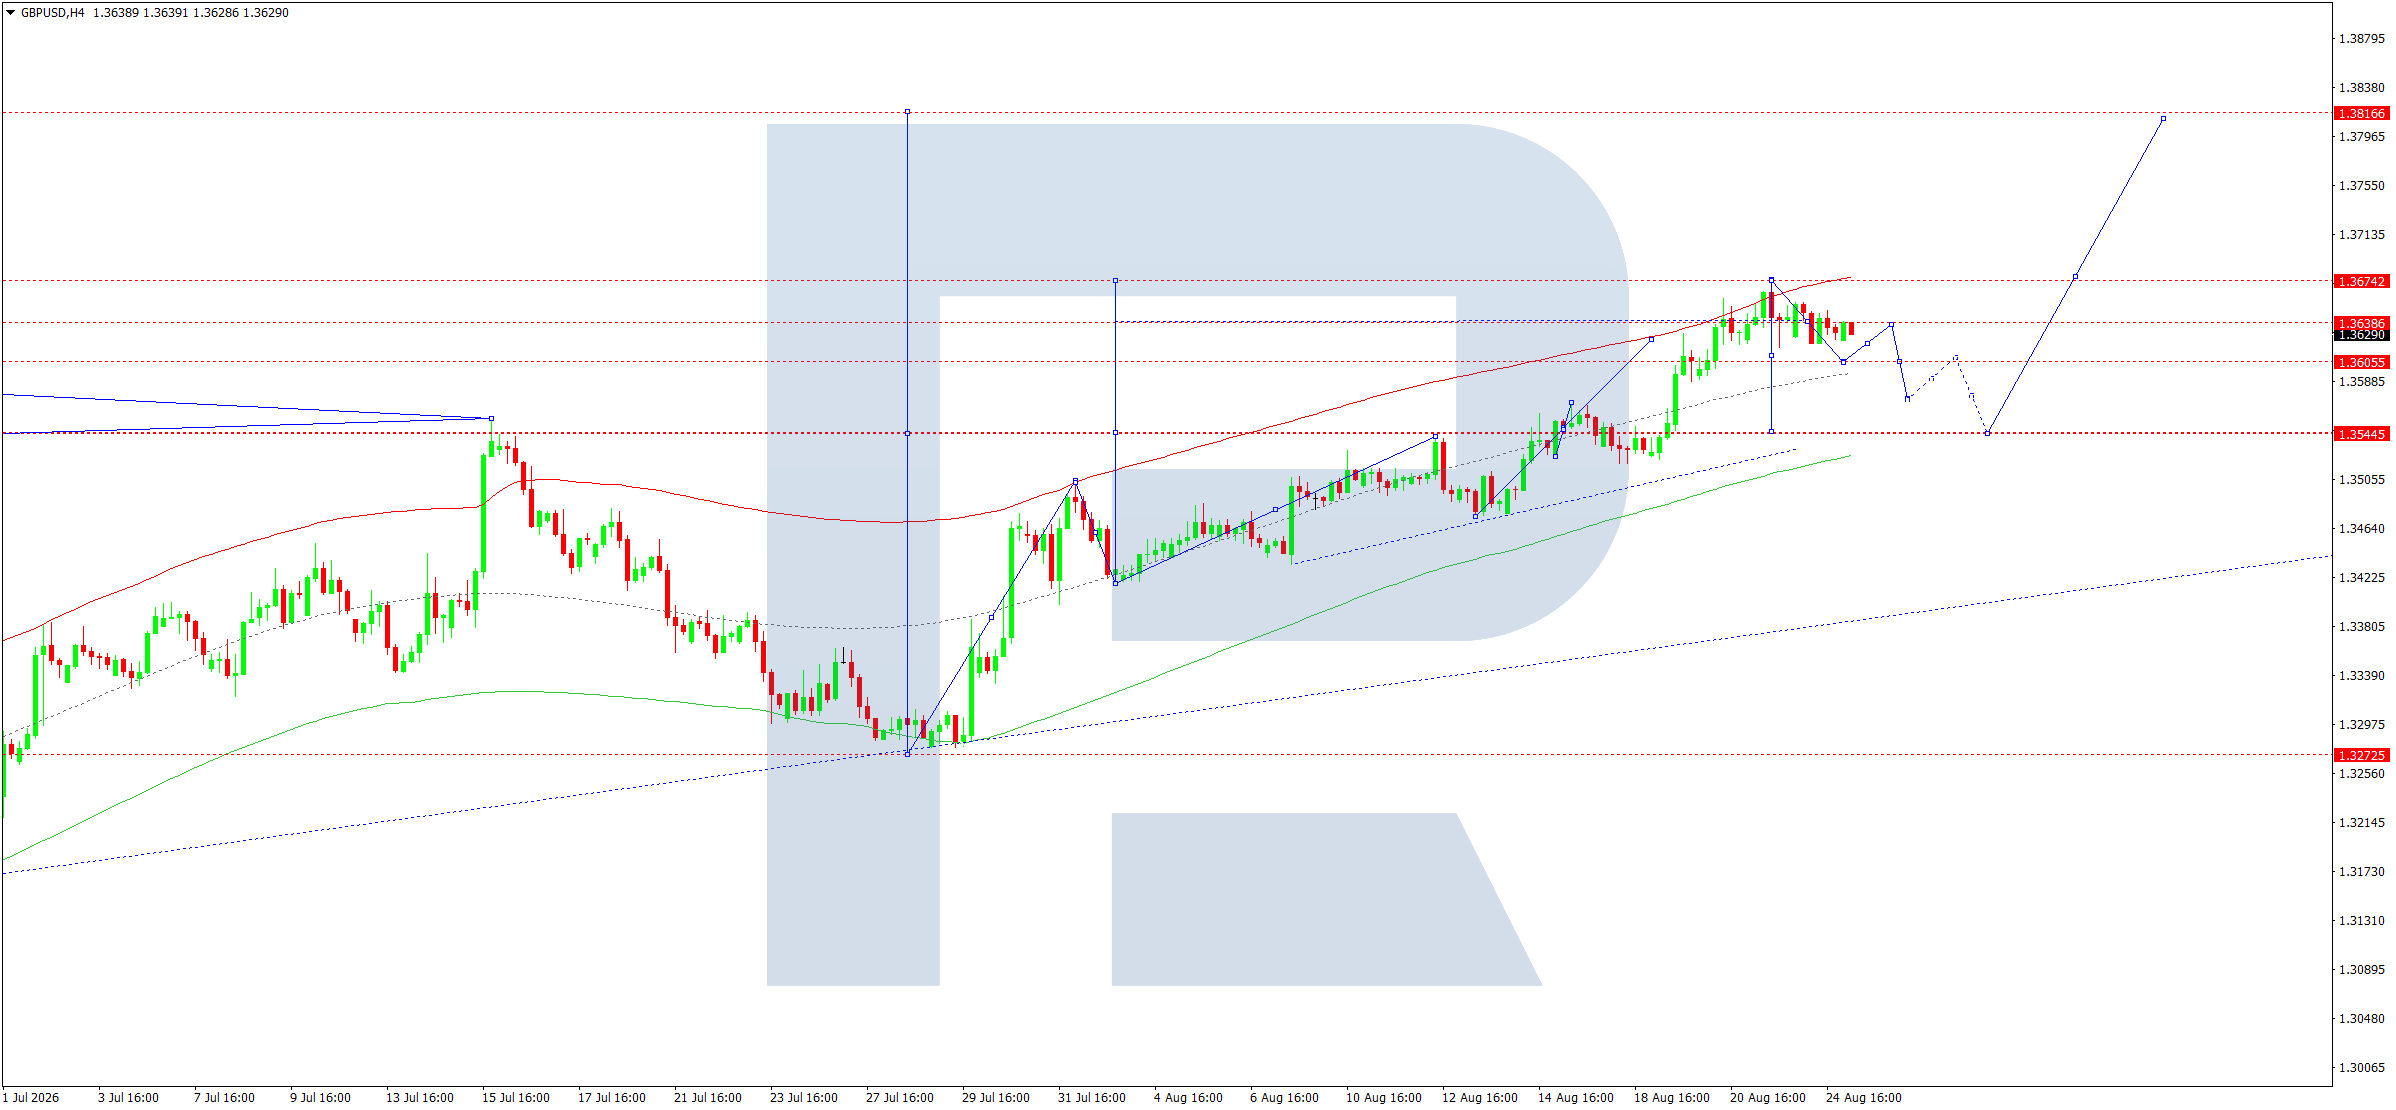
On the H4 chart, the GBPUSD pair maintains an upward structure, but after reaching 1.3674, the market formed a local consolidation range. The price is currently hovering around 1.3626, while the nearest support zone is located near 1.3600. A breakout below this level would create conditions for a corrective wave towards 1.3544, where an important matrix area and the central zone of the previous upward wave are located.
The fundamental backdrop for the pound remains relatively strong. The Bank of England is keeping the interest rate at 3.75%, while UK inflation remains above the 2% target. On the one hand, persistently elevated inflationary pressure leaves room for tighter policy. On the other hand, a gradual weakening of the labour market and slower wage growth limit the scope for further tightening. The pound is also being influenced by broader US dollar movements ahead of the Federal Reserve Chairman’s speech in Jackson Hole.
The main technical trend remains upward. However, after the strong rally, the likelihood of profit-taking has increased. The chart shows a consolidation range below 1.3674–1.3686. Therefore, a local correction towards 1.3600 and 1.3544 is likely to develop during the day. If the price holds above 1.3544, a new upward wave towards 1.3816 is then possible.
Trading scenario: SELL
- Price at the time of writing: 1.3626
- Entry price: 1.3631
- Stop loss: 1.3675
- Take profit: 1.3544
- Risk-to-reward ratio: 1:1.98
AUDUSD forecast
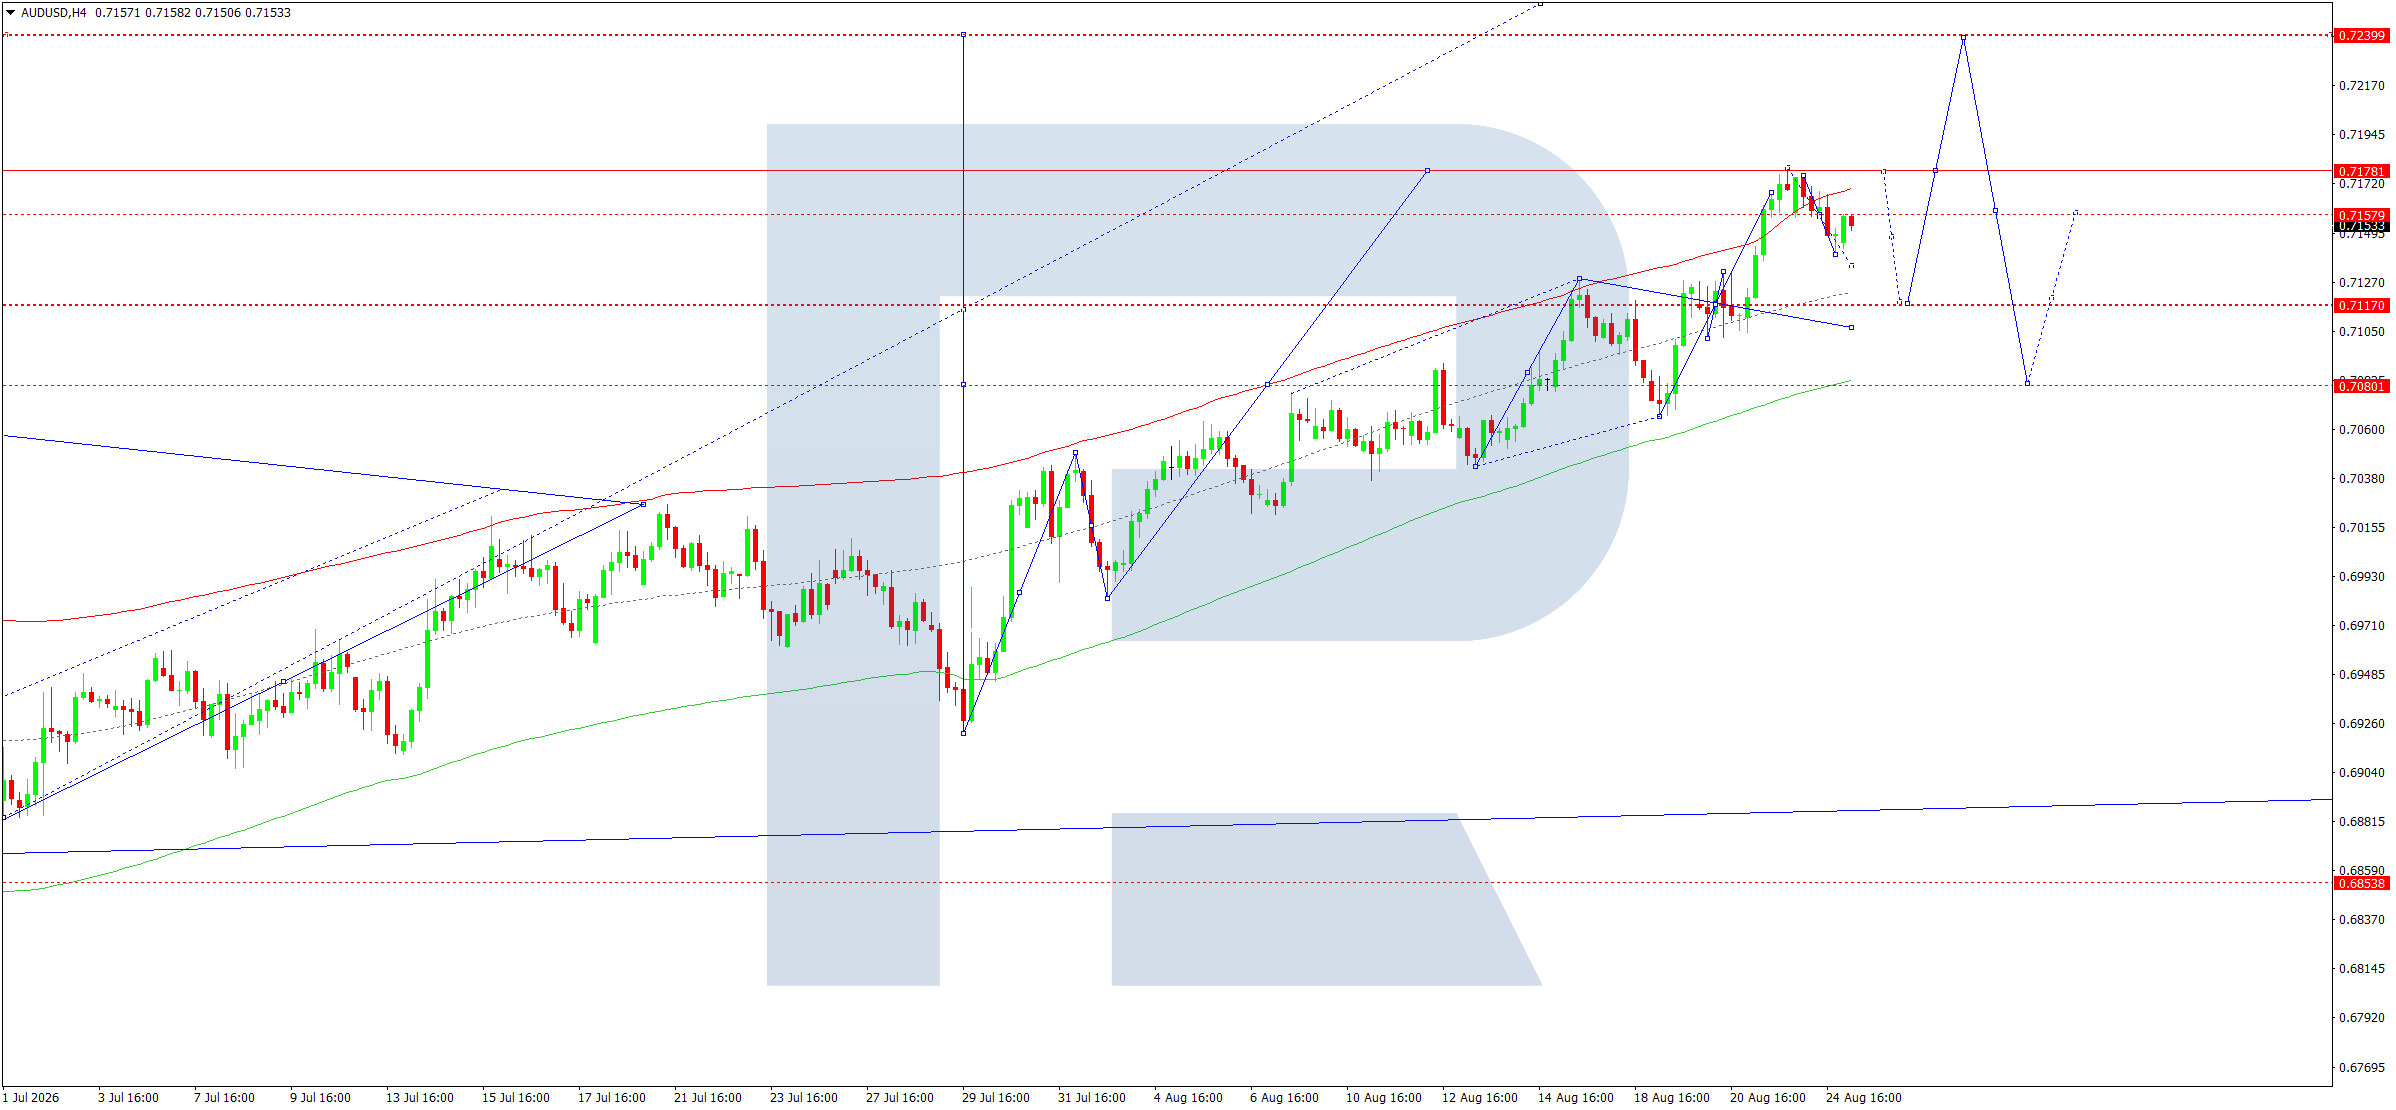
On the H4 chart, the AUDUSD pair maintains an upward structure. After reaching the 0.7178 area, the market entered a consolidation phase below resistance at 0.7178–0.7180. At the same time, the price remains above the key matrix level at 0.7117, so the current phase should primarily be viewed as a local correction within a broader upward move.
The fundamental backdrop for the Australian dollar received additional support today. The Reserve Bank of Australia kept the rate at 4.35% at its August meeting, but the minutes published today showed that the Board seriously considered a rate hike due to the risk of accelerating inflation. As a result, RBA monetary policy remains relatively tight. Elevated commodity prices provide additional support for the AUD, although persistent geopolitical tensions and the Australian economy’s dependence on external demand remain risk factors.
From a technical perspective, the main trend remains upward. At the same time, the price is trading directly below the upper boundary of the current Price Envelope. Therefore, the most likely intraday scenario is a correction towards 0.7134 and 0.7117. Holding 0.7117 would suggest a move towards 0.7178, while a breakout above this resistance level would open the way towards 0.7239.
Trading scenario: SELL
- Price at the time of writing: 0.7150
- Entry price: 0.7155
- Stop loss: 0.7185
- Take profit: 0.7117
- Risk-to-reward ratio: 1:1.27
USDCAD forecast
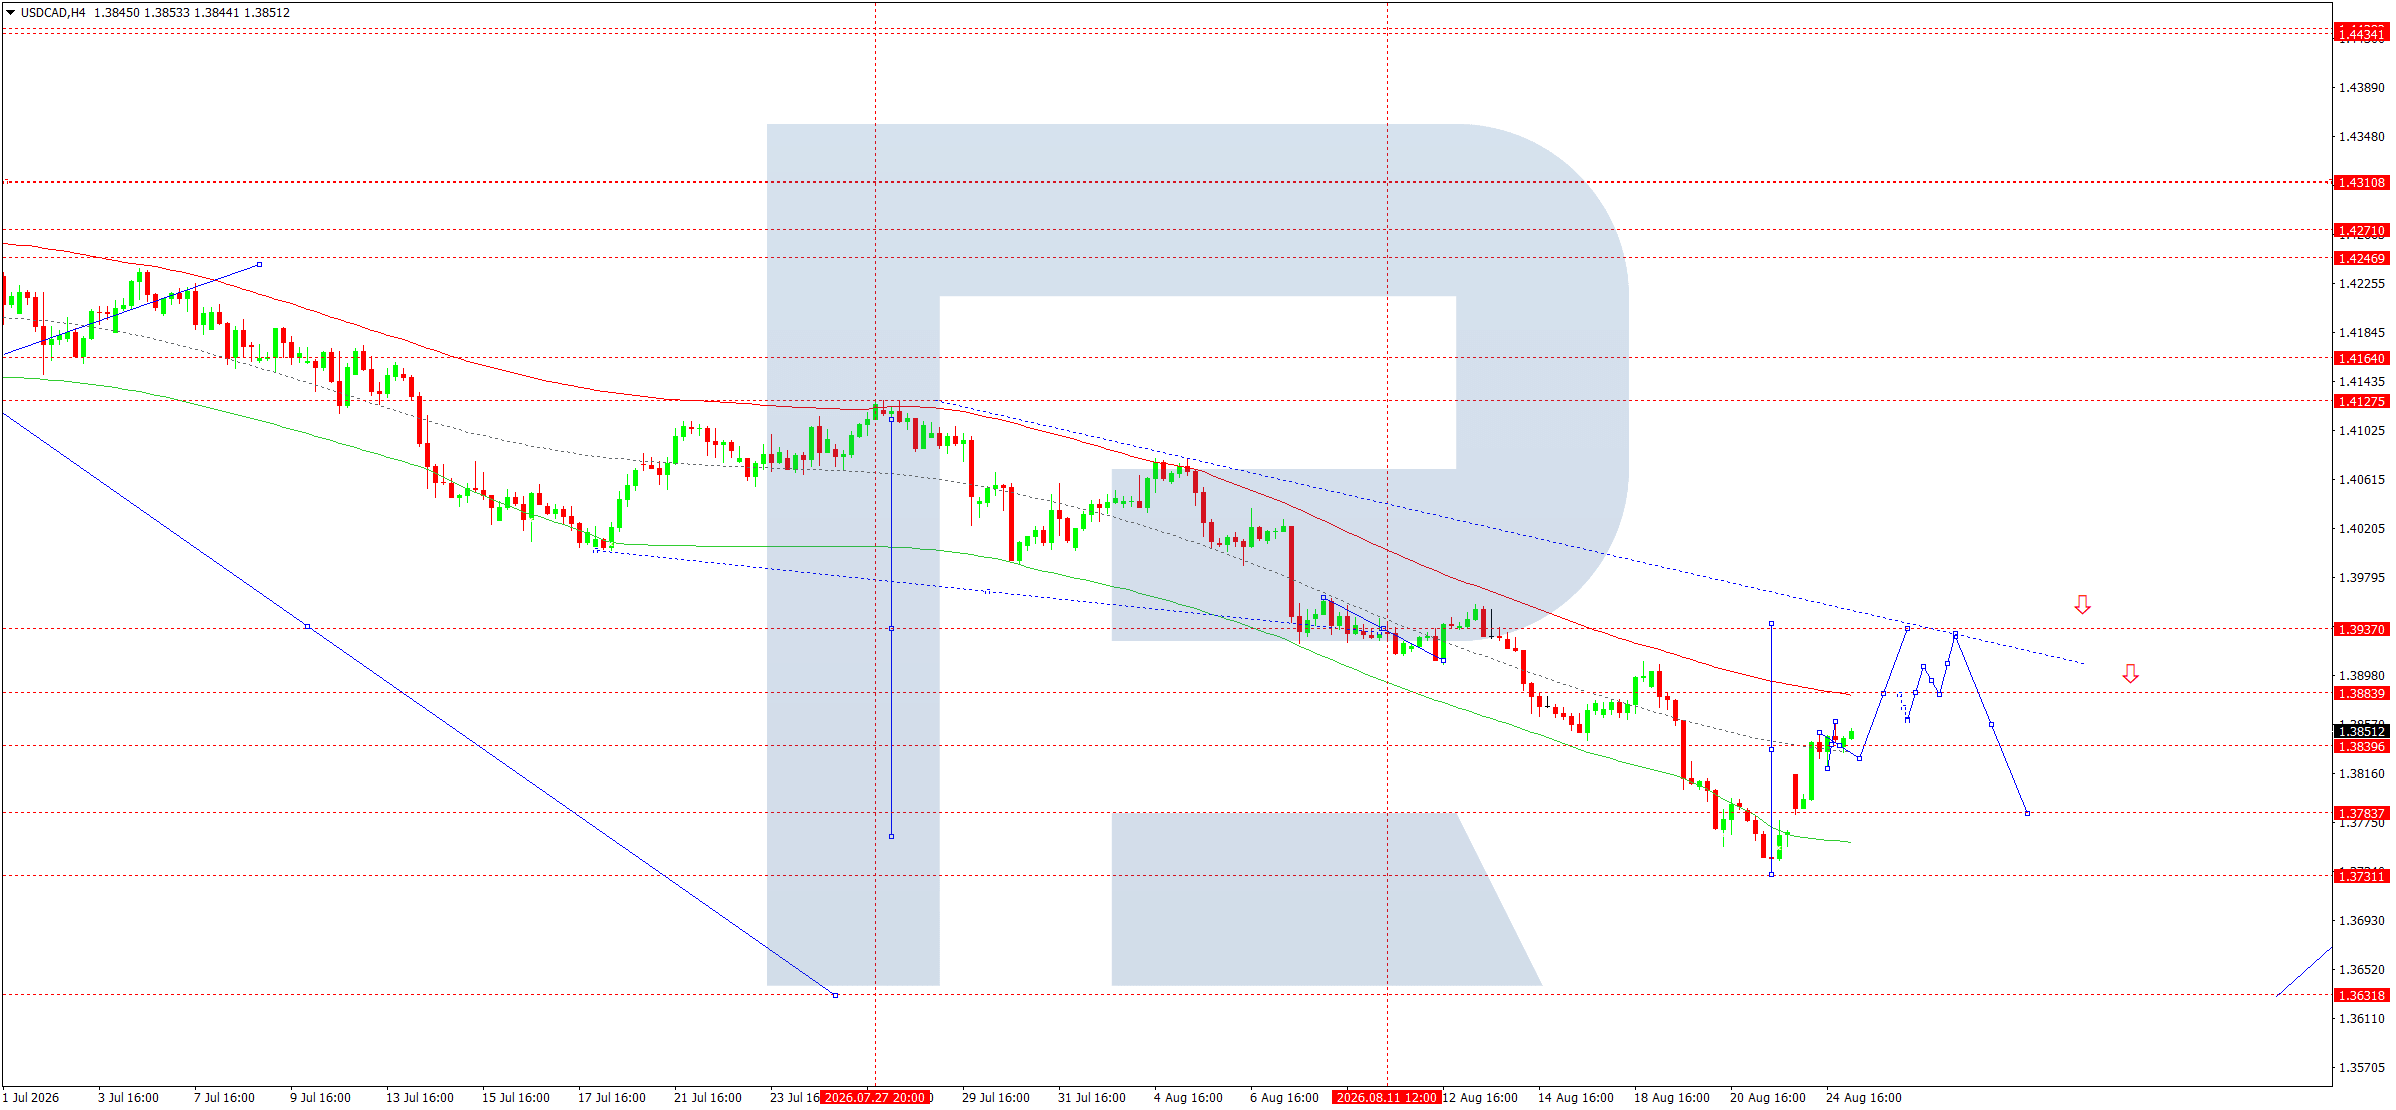
On the H4 chart, the USDCAD pair formed a reversal upward wave after declining to 1.3731 and returned to the 1.3850 area. The price has consolidated above the nearest support level at 1.3839, maintaining the potential for a move towards 1.3888 and then 1.3937–1.3939.
The fundamental backdrop is currently clearly supportive of USDCAD growth. The Canadian dollar is under pressure due to a sharp deterioration in trade relations between the US and Canada. After negotiations broke down, Washington increased tariff pressure, while Canada announced retaliatory measures. At the same time, oil prices remain high, traditionally supporting the Canadian currency. However, in the current environment, the impact of the trade conflict and overall demand for the US dollar has proved stronger. On 25 August, the USDCAD pair is trading around the mid-1.3800 area.
Technically, a reversal structure is forming after a prolonged decline. The pivot point of the wave matrix is located near 1.3937. As long as the price remains above 1.3839, the main scenario remains a continued recovery towards 1.3888 and then 1.3937. A return below 1.3784 would invalidate the current scenario and redirect the market towards 1.3731.
Trading scenario: BUY
- Price at the time of writing: 1.3850
- Entry price: 1.3855
- Stop loss: 1.3815
- Take profit: 1.3937
- Risk-to-reward ratio: 1:2.05
XAUUSD forecast
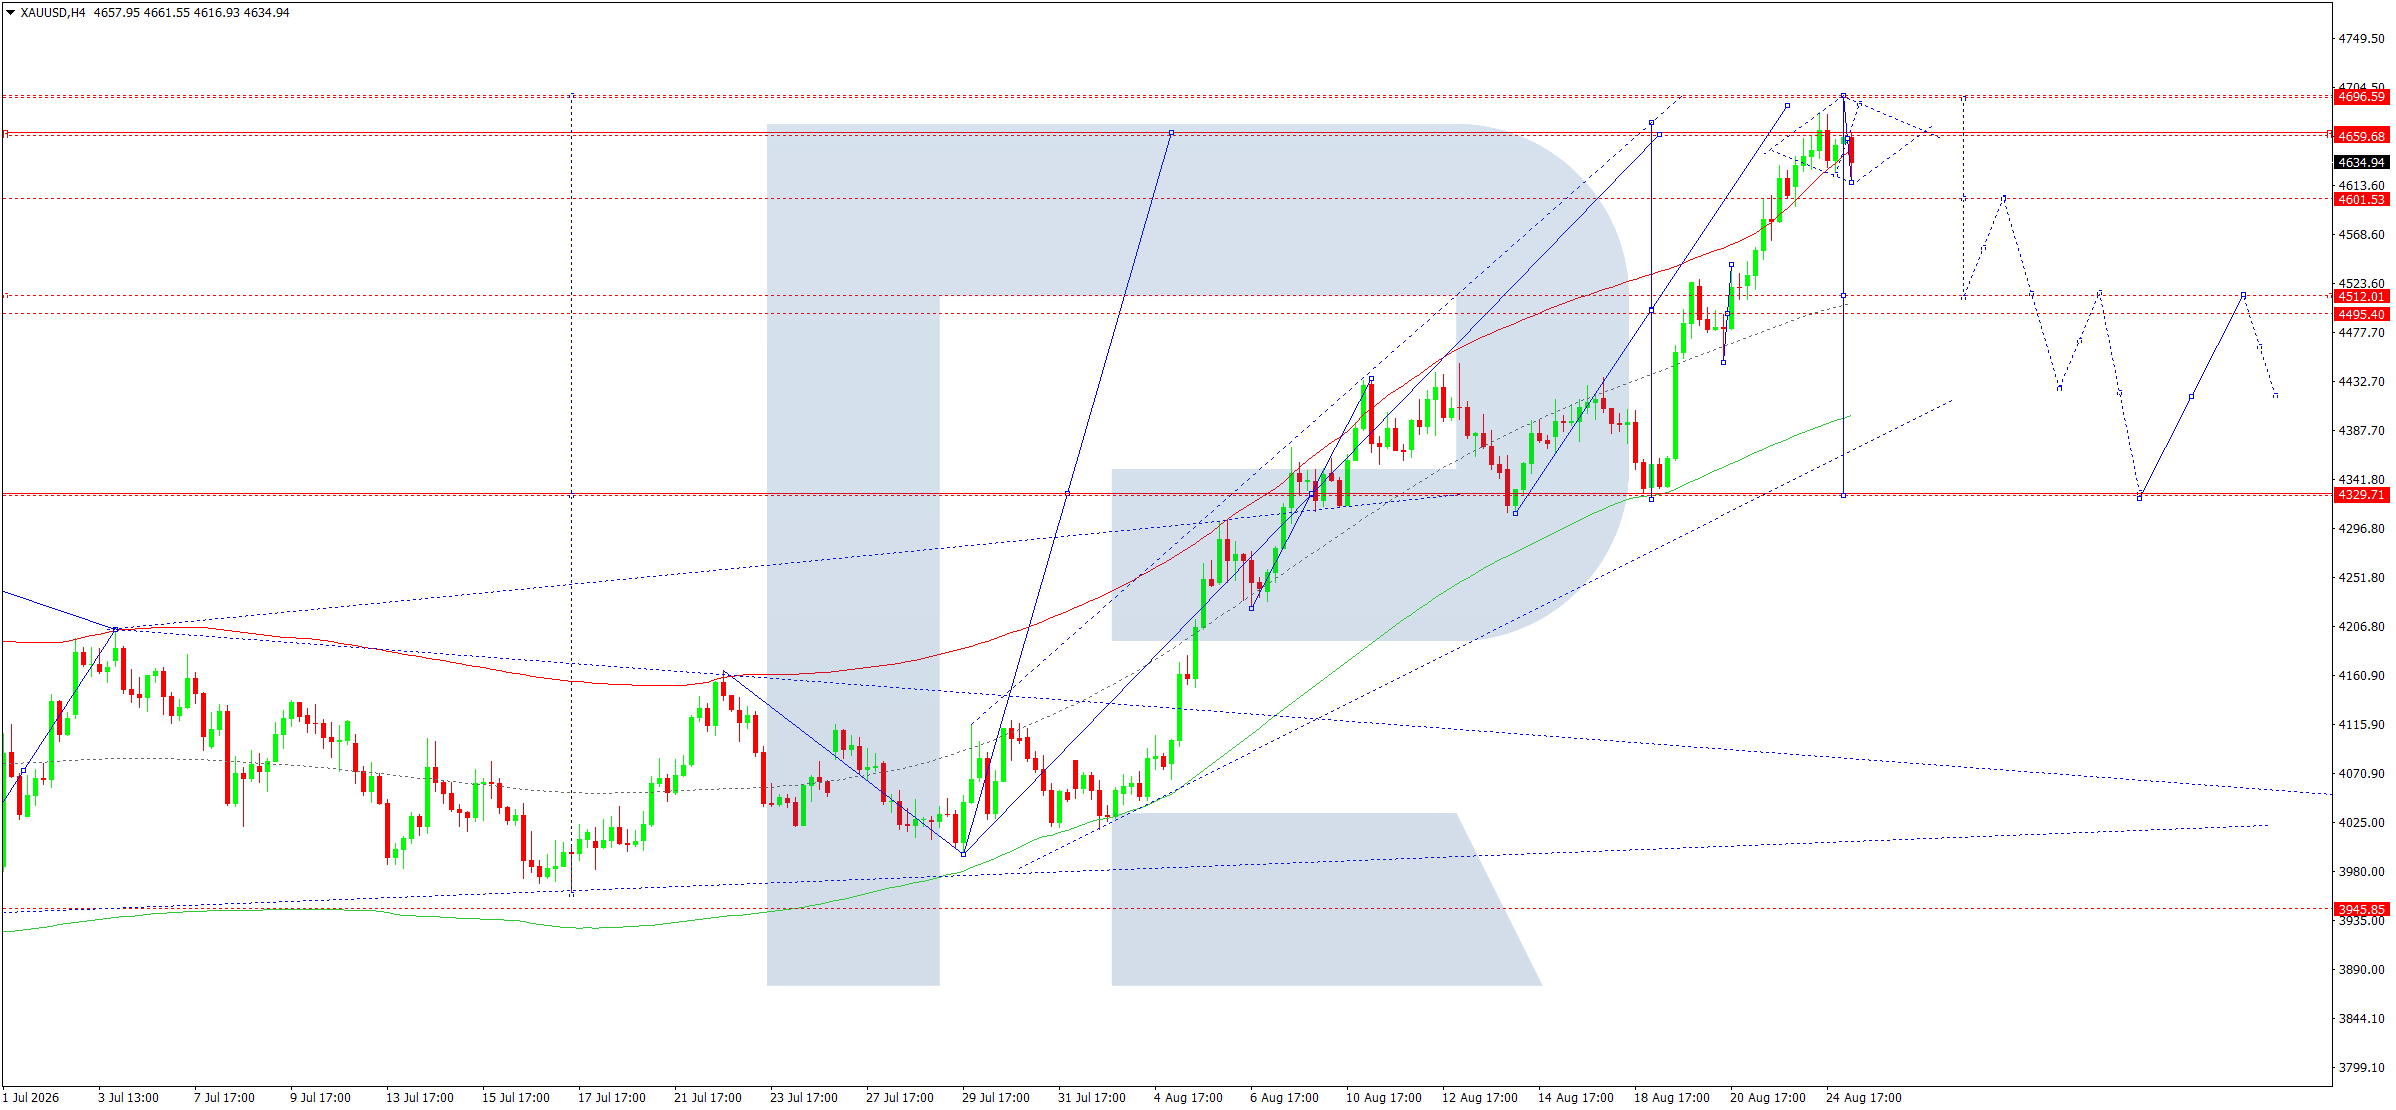
On the H4 chart, XAUUSD reached the 4,659–4,696 area after a strong upward wave and formed a consolidation range near a historically high resistance zone. The current price is around 4,635. The nearest target of the corrective move is the 4,600 area, followed by 4,512 and 4,495. A deeper correction could take the market towards 4,330, where the key pivot point of the wave matrix is located.
The fundamental backdrop for gold remains predominantly positive. Geopolitical tensions in the Middle East, elevated energy prices, and uncertainty surrounding the US debt market continue to support demand for safe-haven assets. Falling US bond yields following reports of an expanded buyback program for long-term Treasuries provide additional support. At the same time, gold is likely to remain sensitive in the coming days to US dollar movements and expectations regarding Fed policy ahead of Kevin Warsh’s speech in Jackson Hole.
The main trend in gold remains upward. Therefore, the sell position in this case is viewed solely as a short-term corrective scenario after a strong upward momentum. As long as prices hold below 4,696, a decline towards 4,512 remains likely. A sustained move above 4,696 would invalidate the corrective scenario and open the way for further growth.
Trading scenario: SELL
- Price at the time of writing: 4,635
- Entry price: 4,640
- Stop loss: 4,675
- Take profit: 4,512
- Risk-to-reward ratio: 1:3.66
US 500 forecast
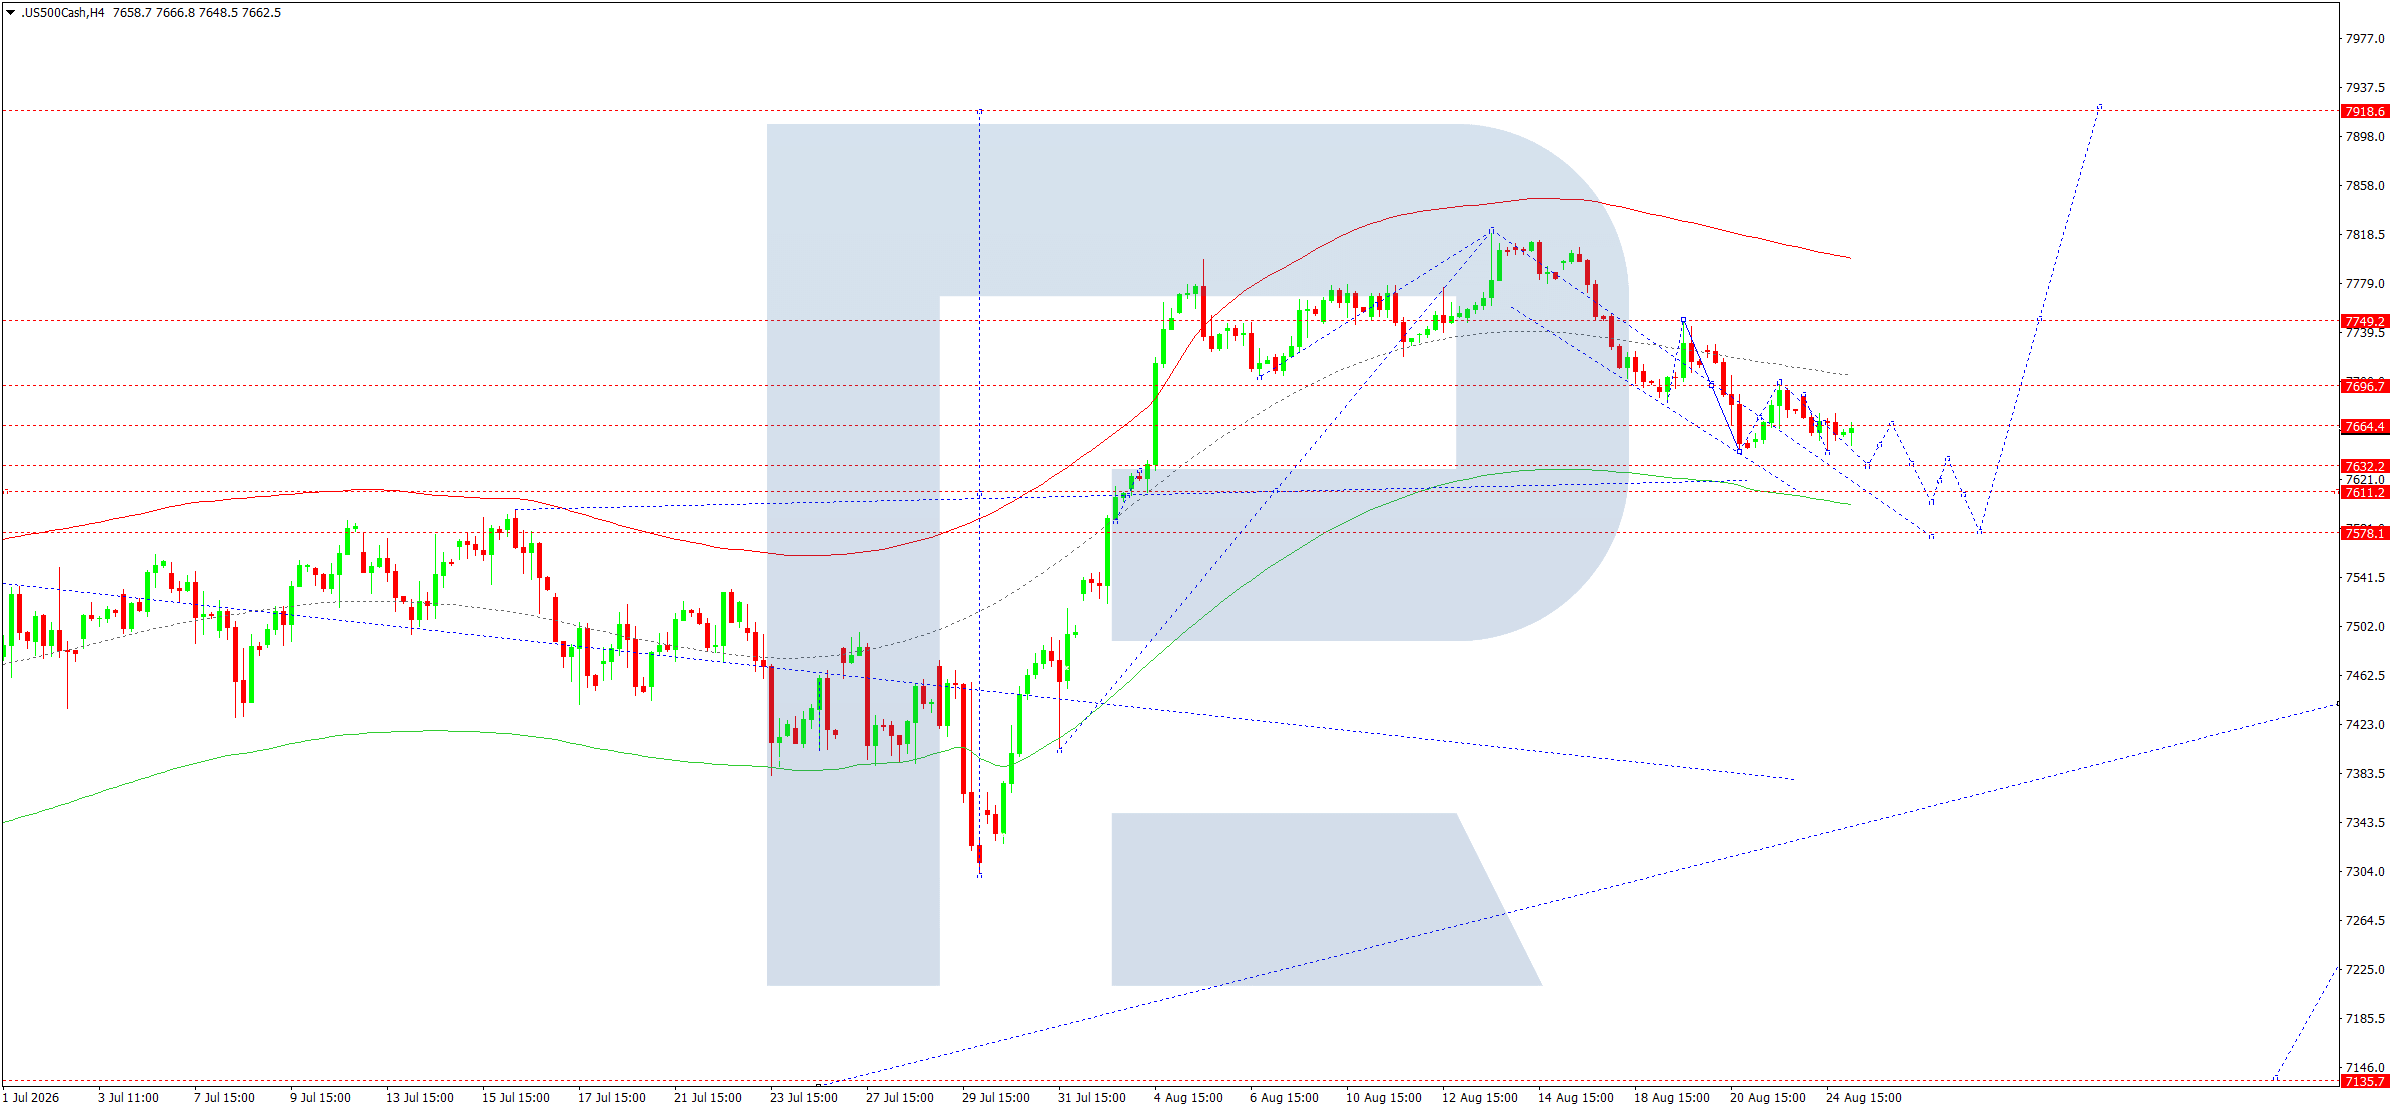
On the H4 chart, after forming a high near 7,818, the US 500 entered a corrective wave. The current price is around 7,666, while the nearest resistance level is located near 7,696. Downside targets remain at 7,644, 7,611, and 7,578, with the main near-term target of the current correction at the 7,578 level.
The fundamental backdrop for the US stock market remains mixed on 25 August. Investors are awaiting the release of US PCE inflation data and Federal Reserve Chairman Kevin Warsh’s speech in Jackson Hole. At the same time, market attention is focused on NVIDIA’s upcoming earnings, which could materially alter the outlook for the technology sector and the broader stock market. US futures remain relatively resilient, although high technology-sector valuations make the index more sensitive to any disappointment.
The main trend remains upward, but the short-term structure is corrective. As long as the index remains below 7,696, a further decline towards 7,644 and 7,578 remains likely. A sustained breakout above 7,696 would bring a move towards 7,749 and then 7,918 back into play. The intraday risk balance ahead of key US data remains tilted towards a correction.
Trading scenario: SELL
- Price at the time of writing: 7,662.5
- Entry price: 7,667.5
- Stop loss: 7,705.0
- Take profit: 7,578.1
- Risk-to-reward ratio: 1:2.38
BTCUSD forecast
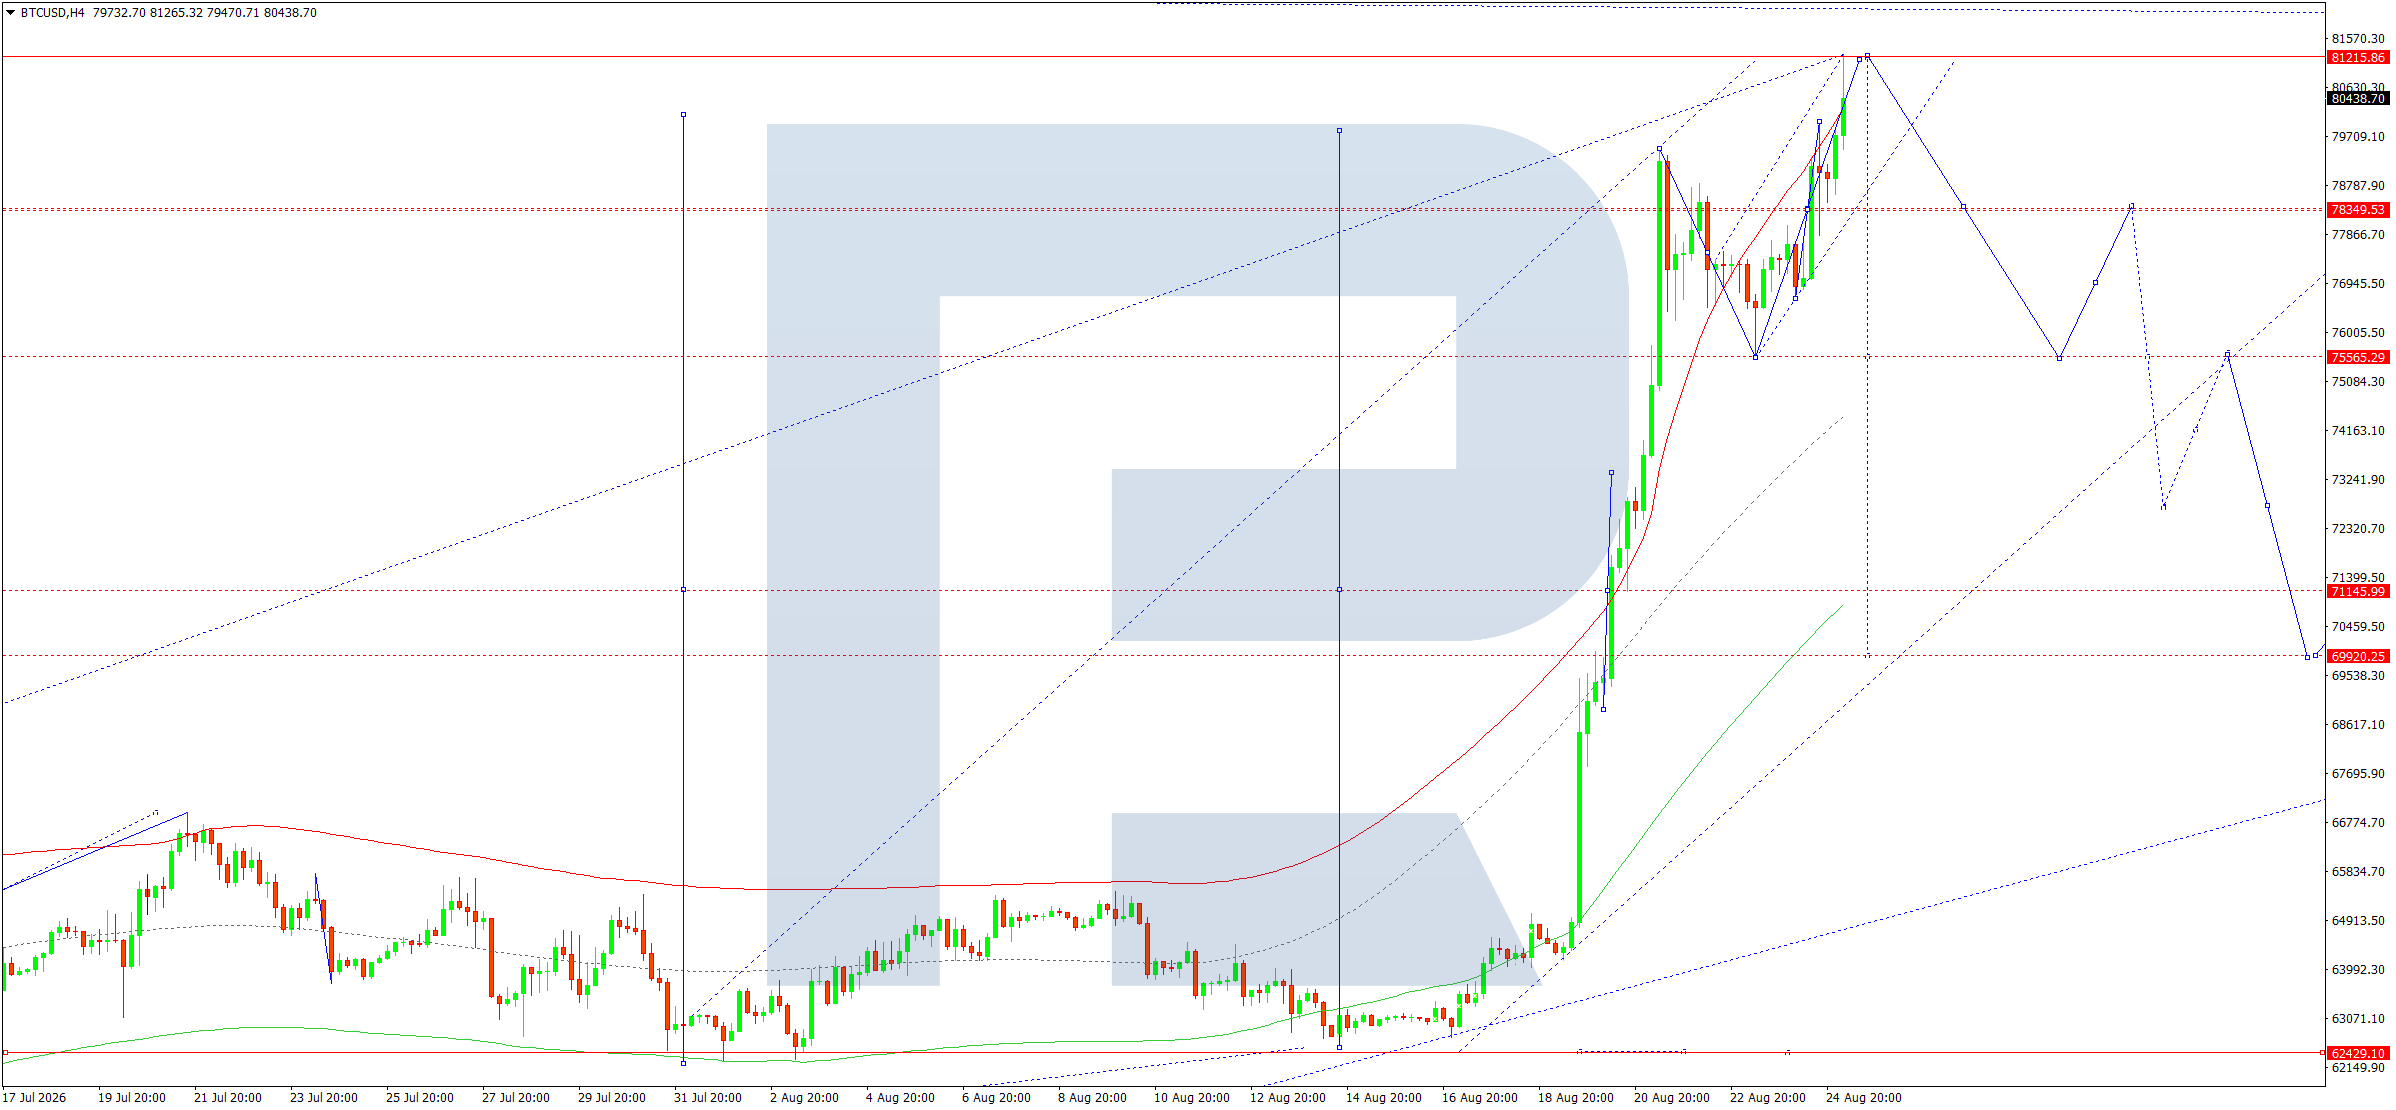
On the H4 chart, BTCUSD completed a powerful impulsive upward wave towards 81,215 and formed a consolidation range directly below this resistance. The price is currently hovering around 80,439. After such a strong vertical move, the likelihood of profit-taking is increasing. The nearest correction zone is around 78,400–78,550, while the main technical downside target is located near 75,565. A deeper correction could take the market towards 71,145.
The fundamental backdrop for the cryptocurrency remains positive. Bitcoin rose above 80,000 on Tuesday and reached a high near 81,238, supported by US dollar weakness, expectations regarding US debt policy, and increased interest in alternative assets. Further discussion of clearer cryptocurrency regulation in the US remains an additional factor. However, after gaining approximately 28% in August, the market is becoming vulnerable to profit-taking and sharp shifts in sentiment.
The main BTCUSD trend remains upward. The current sell position is viewed as a short-term correction from strong resistance rather than a reversal of the long-term trend. As long as the price holds below 81,215, a move towards 78,400 and 75,565 remains likely. A consolidation above 81,215 would invalidate the corrective scenario and open the way for further growth towards 85,000 and above.
Trading scenario: SELL
- Price at the time of writing: 80,439
- Entry price: 80,444
- Stop loss: 81,250
- Take profit: 75,565
- Risk-to-reward ratio: 1:6.05
Editors’ picks
 EURUSD forecast 2026–2027: technical analysis, price levels & predictions
EURUSD has recovered from the July lows and is trading near 1.1545 — back in bullish territory. The pair has reclaimed EMA65 on the daily, formed a bullish EMA crossover on H4, and the US-eurozone GDP gap has narrowed sharply (US 1.5% vs eurozone 1.0%). Goldman Sachs and Deutsche Bank both now target 1.2500 by year-end. A confirmed close above 1.1700 opens the path to 1.1805. We break down the key levels, three trading scenarios, and what the unprecedented 9-3 FOMC dissent vote means for EURUSD.
 Gold (XAUUSD) forecast 2026: technical analysis, price levels & predictions
Gold has reversed its downtrend and is trading near 4,360 USD, back above both EMA65 and EMA200. ETF flows turned positive in July with 3 billion USD of net inflows, and central banks bought 288.9 tonnes in Q2 — up 62% year-on-year. A breakout above 4,500 USD opens the path to 4,855 USD and the 5,597 USD all-time high. We break down the key levels, three trading scenarios with entry triggers, and what J.P. Morgan, Deutsche Bank and Goldman Sachs are forecasting for gold in 2026.
Forecasts presented in this section only reflect the author’s private opinion and should not be considered as guidance for trading. RoboForex bears no responsibility for trading results based on trading recommendations described in these analytical reviews.