
Daily technical analysis and forecast for 27 August 2026
Daily technical analysis and forecast for EURUSD, USDJPY, GBPUSD, AUDUSD, USDCAD, XAUUSD, US 500, and BTCUSD for 27 August 2026.
Each scenario on this page reflects the market structure on the H4 chart as of 10:00 UTC+3 on 27 August 2026 and remains valid throughout the current trading day. It closes when the price reaches either the take-profit or stop-loss level, or at the end of the trading day if neither level has been reached. The assessment considers the current H4 chart structure, key support and resistance levels, the direction of the medium-term movement, and the prevailing fundamental backdrop.
EURUSD forecast
The fundamental backdrop for EURUSD remains mixed, although in the short term the advantage is gradually shifting towards the US dollar. The European Central Bank kept interest rates unchanged in July, but rising energy prices amid the conflict in the Middle East maintain the risk of accelerating inflation. At the same time, ECB officials have indicated that further policy tightening remains possible, while the market expects the rate to rise to 2.50% in September. This limits the euro’s downside potential.
Meanwhile, the US Federal Reserve is keeping its rate within the 3.50–3.75% range, while data released on 26 August showed headline PCE rising by 3.7% year-on-year and core PCE by 3.3%. This trend keeps the prospect of tighter Fed policy alive. The Federal Reserve Chairman Kevin Warsh’s speech at the Jackson Hole Symposium on 28 August is an additional source of uncertainty.
Against this backdrop, the euro retains fundamental support from expectations of tighter ECB policy. However, over the coming day, the US dollar may gain the advantage due to high US inflation and expectations of signals from the Fed. This creates conditions for a corrective decline in EURUSD.
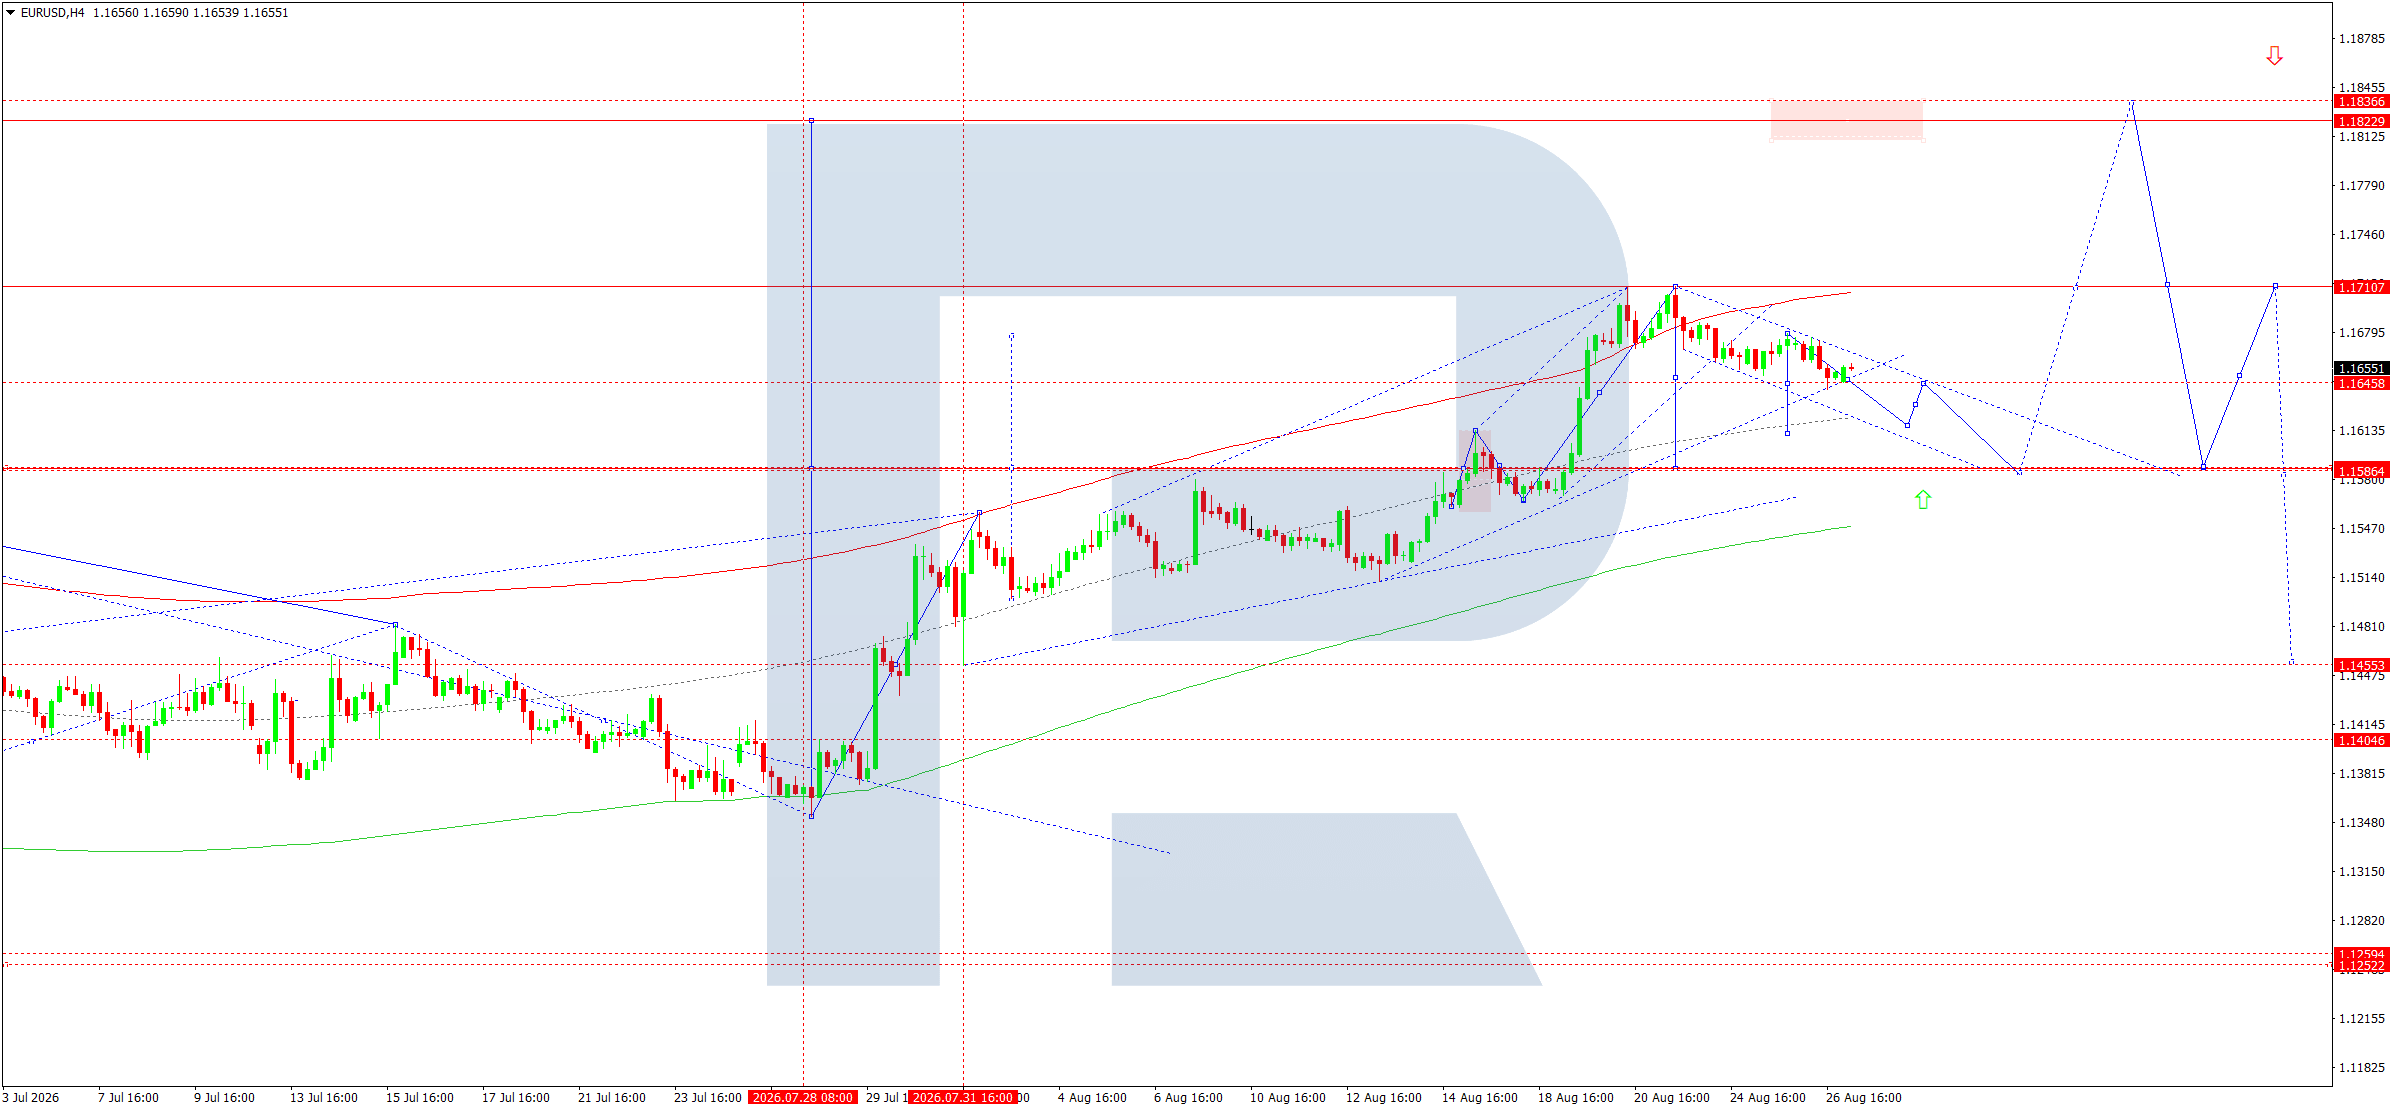
On the H4 chart, the main EURUSD trend remains upward, although the market entered a corrective phase after reaching the 1.1710 area. The current price is near 1.1655, while the structure of the latest candlesticks indicates a downward movement forming from the local high.
The nearest key level is 1.1646. A breakout below it would confirm a corrective wave, with the first target at 1.1586. If the decline intensifies, the next support area is at 1.1555. Meanwhile, 1.1710 remains the main boundary above which the bearish scenario would become invalid.
Given the combination of fundamental factors and technical patterns, a decline towards 1.1586 is more likely for the coming day.
Trading scenario: SELL
- Price at the time of writing: 1.1655
- Entry price: 1.1650
- Stop loss: 1.1710
- Take profit: 1.1586
- Risk-to-reward ratio: 1:1.07
USDJPY forecast
The fundamental backdrop for USDJPY remains mixed. The Federal Reserve is maintaining a relatively high interest rate, while July’s PCE data confirmed persistent inflationary pressure in the US. This continues to support the US dollar and limits the pace of appreciation in the Japanese yen. At the same time, the market is closely assessing the prospects of further monetary policy tightening in Japan.
The Bank of Japan raised its interest rate to 1% in June, while BoJ Deputy Governor Ryozo Himino stated on 27 August that rates should be raised in a timely manner if inflation risks intensify. The market estimates the probability of a rate hike at the September meeting at approximately 86%. However, no direct signal guaranteeing an increase has yet been given.
Fundamentally, the pair therefore remains exposed to heightened volatility. The Fed’s high interest rate supports the US dollar, while expectations of further BoJ policy tightening limit the upside potential for USDJPY. Over the coming day, shifting expectations surrounding the Fed chair’s speech may become the main market driver.
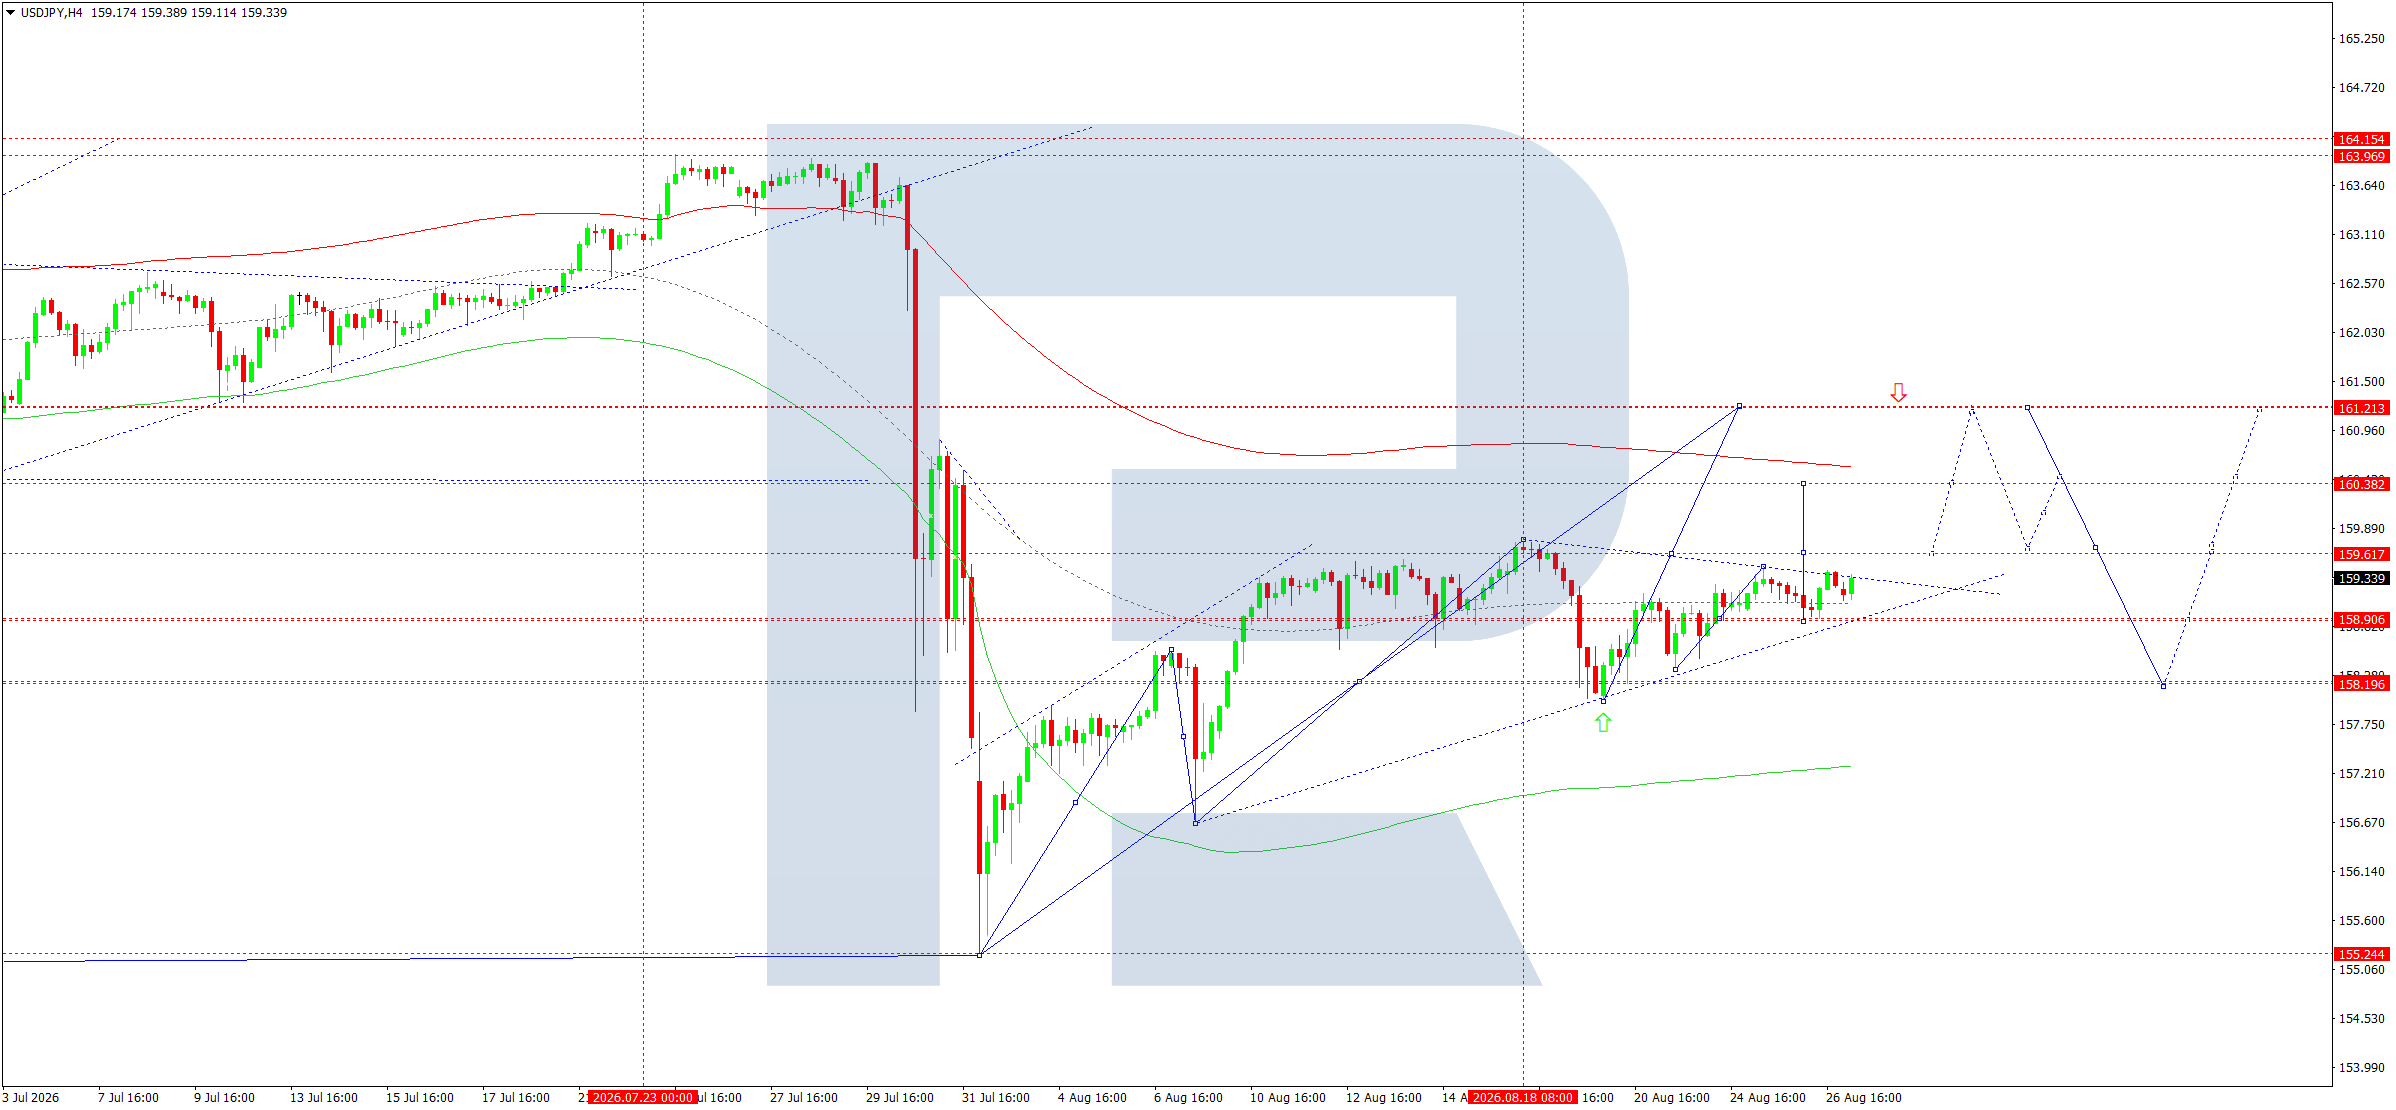
On the H4 chart, USDJPY formed a consolidation range between 158.90 and 159.60 following a sharp decline from higher levels. The main short-term trend remains neutral, with the market attempting to form a new upward wave.
The 158.90 level is the nearest support. As long as the market holds above it, the likelihood of further growth towards 160.38 remains. A breakout above 160.38 would open the way towards 161.21. Meanwhile, a decline below 158.90 would create the risk of a fall towards 158.20 and subsequently 157.70.
Given that support is holding and US interest rates retain their advantage, the growth scenario is preferred for the coming day.
Trading scenario: BUY
- Price at the time of writing: 159.36
- Entry price: 159.41
- Stop loss: 158.80
- Take profit: 160.38
- Risk-to-reward ratio: 1:1.59
GBPUSD forecast
The fundamental backdrop for GBPUSD is characterised by relative resilience in the British pound, although in the short term it remains unfavourable for further growth. The Bank of England keeps its interest rate at 3.75%. UK inflation accelerated to 2.9% in July from 2.6% a month earlier, while energy prices pose a risk of a further increase in inflation in the second half of the year. However, the BoE has not yet signalled the need for an immediate rate hike.
More hawkish expectations for the Federal Reserve continue to support the US dollar. The US core PCE remains at 3.3%, while the headline measure stands at 3.7%, well above the Fed’s target. As a result, the market is once again assessing the likelihood of a US rate hike, with attention focused on the Fed chair’s speech at Jackson Hole.
Thus, the UK economy remains relatively resilient, but in the short term, the interest rate differential and expectations of more hawkish Fed rhetoric create conditions for a GBPUSD correction.
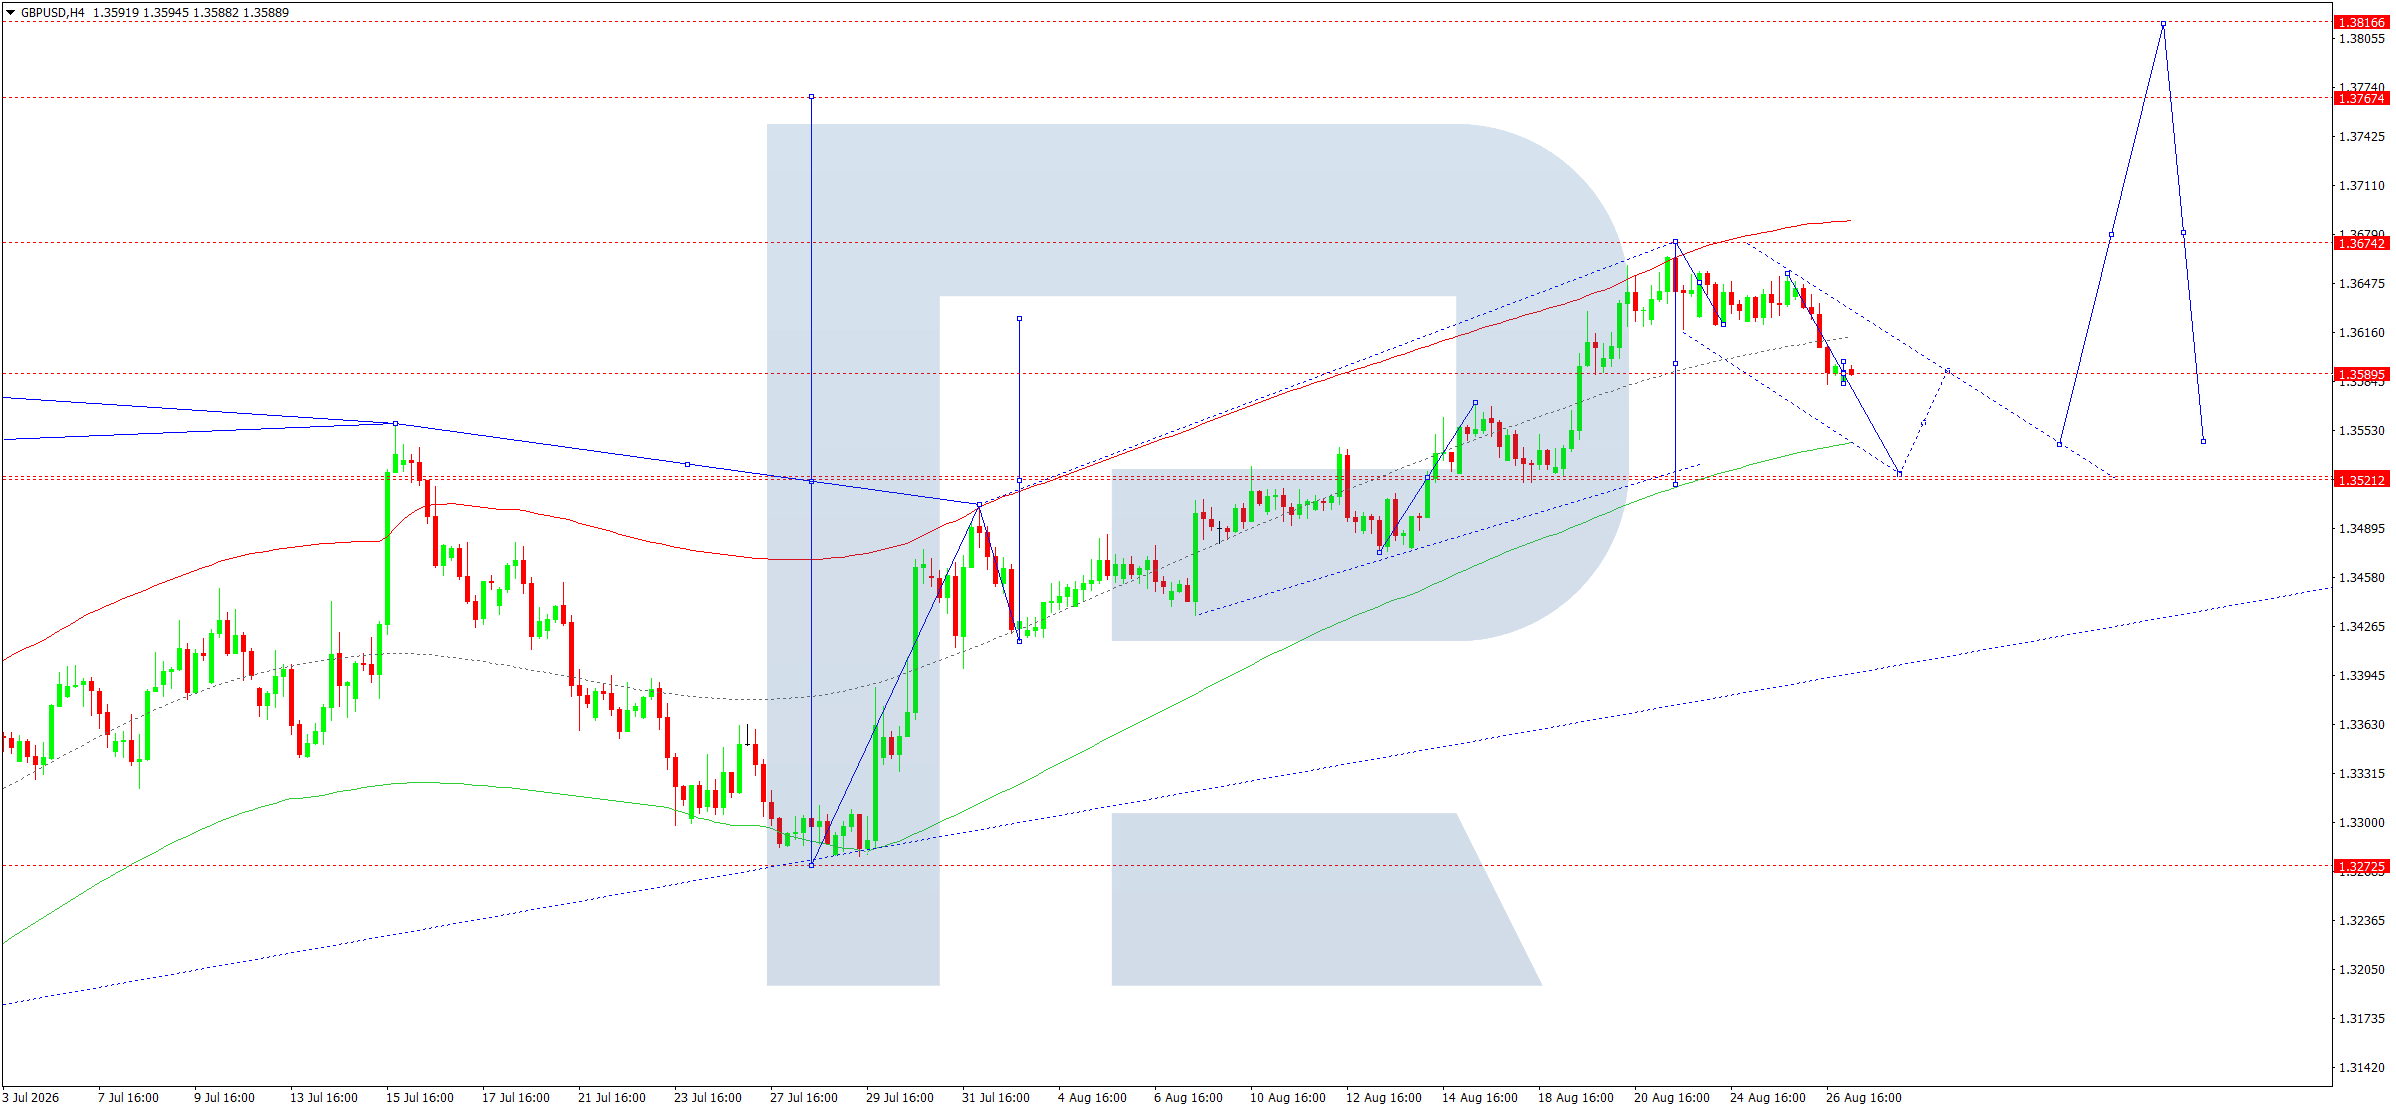
On the H4 chart, GBPUSD formed a downward wave from the 1.3674 area and is currently consolidating near 1.3590. The price remains below the local resistance area at 1.3640–1.3674, keeping the corrective scenario relevant.
The nearest downside target is 1.3521. A breakout below this level would expose the next support near 1.3515. If 1.3521 holds, the market may subsequently form a new upward wave towards 1.3674 and then 1.3767.
The main scenario for the coming day suggests a continued downward correction.
Trading scenario: SELL
- Price at the time of writing: 1.3589
- Entry price: 1.3584
- Stop loss: 1.3630
- Take profit: 1.3521
- Risk-to-reward ratio: 1:1.37
AUDUSD forecast
The fundamental backdrop remains favourable for the Australian dollar. The Reserve Bank of Australia kept its interest rate unchanged at 4.35% on 11 August but noted persistent inflationary pressure. Headline inflation slowed to 3.5% in July, while the trimmed mean measure remained at 3.6%, well above the target range.
Domestic demand data provided additional support for the Australian dollar. Household spending rose by 1.1% month-on-month and 7% year-on-year in July, reinforcing expectations of another RBA rate hike. The probability of a rate increase as early as September is estimated at approximately 47%, while a hike by year-end is effectively priced into market expectations.
Fundamentally, this supports AUDUSD. However, the strong rally in recent weeks has brought the pair to a technically important resistance area, so the likelihood of a short-term correction remains high over the coming day.
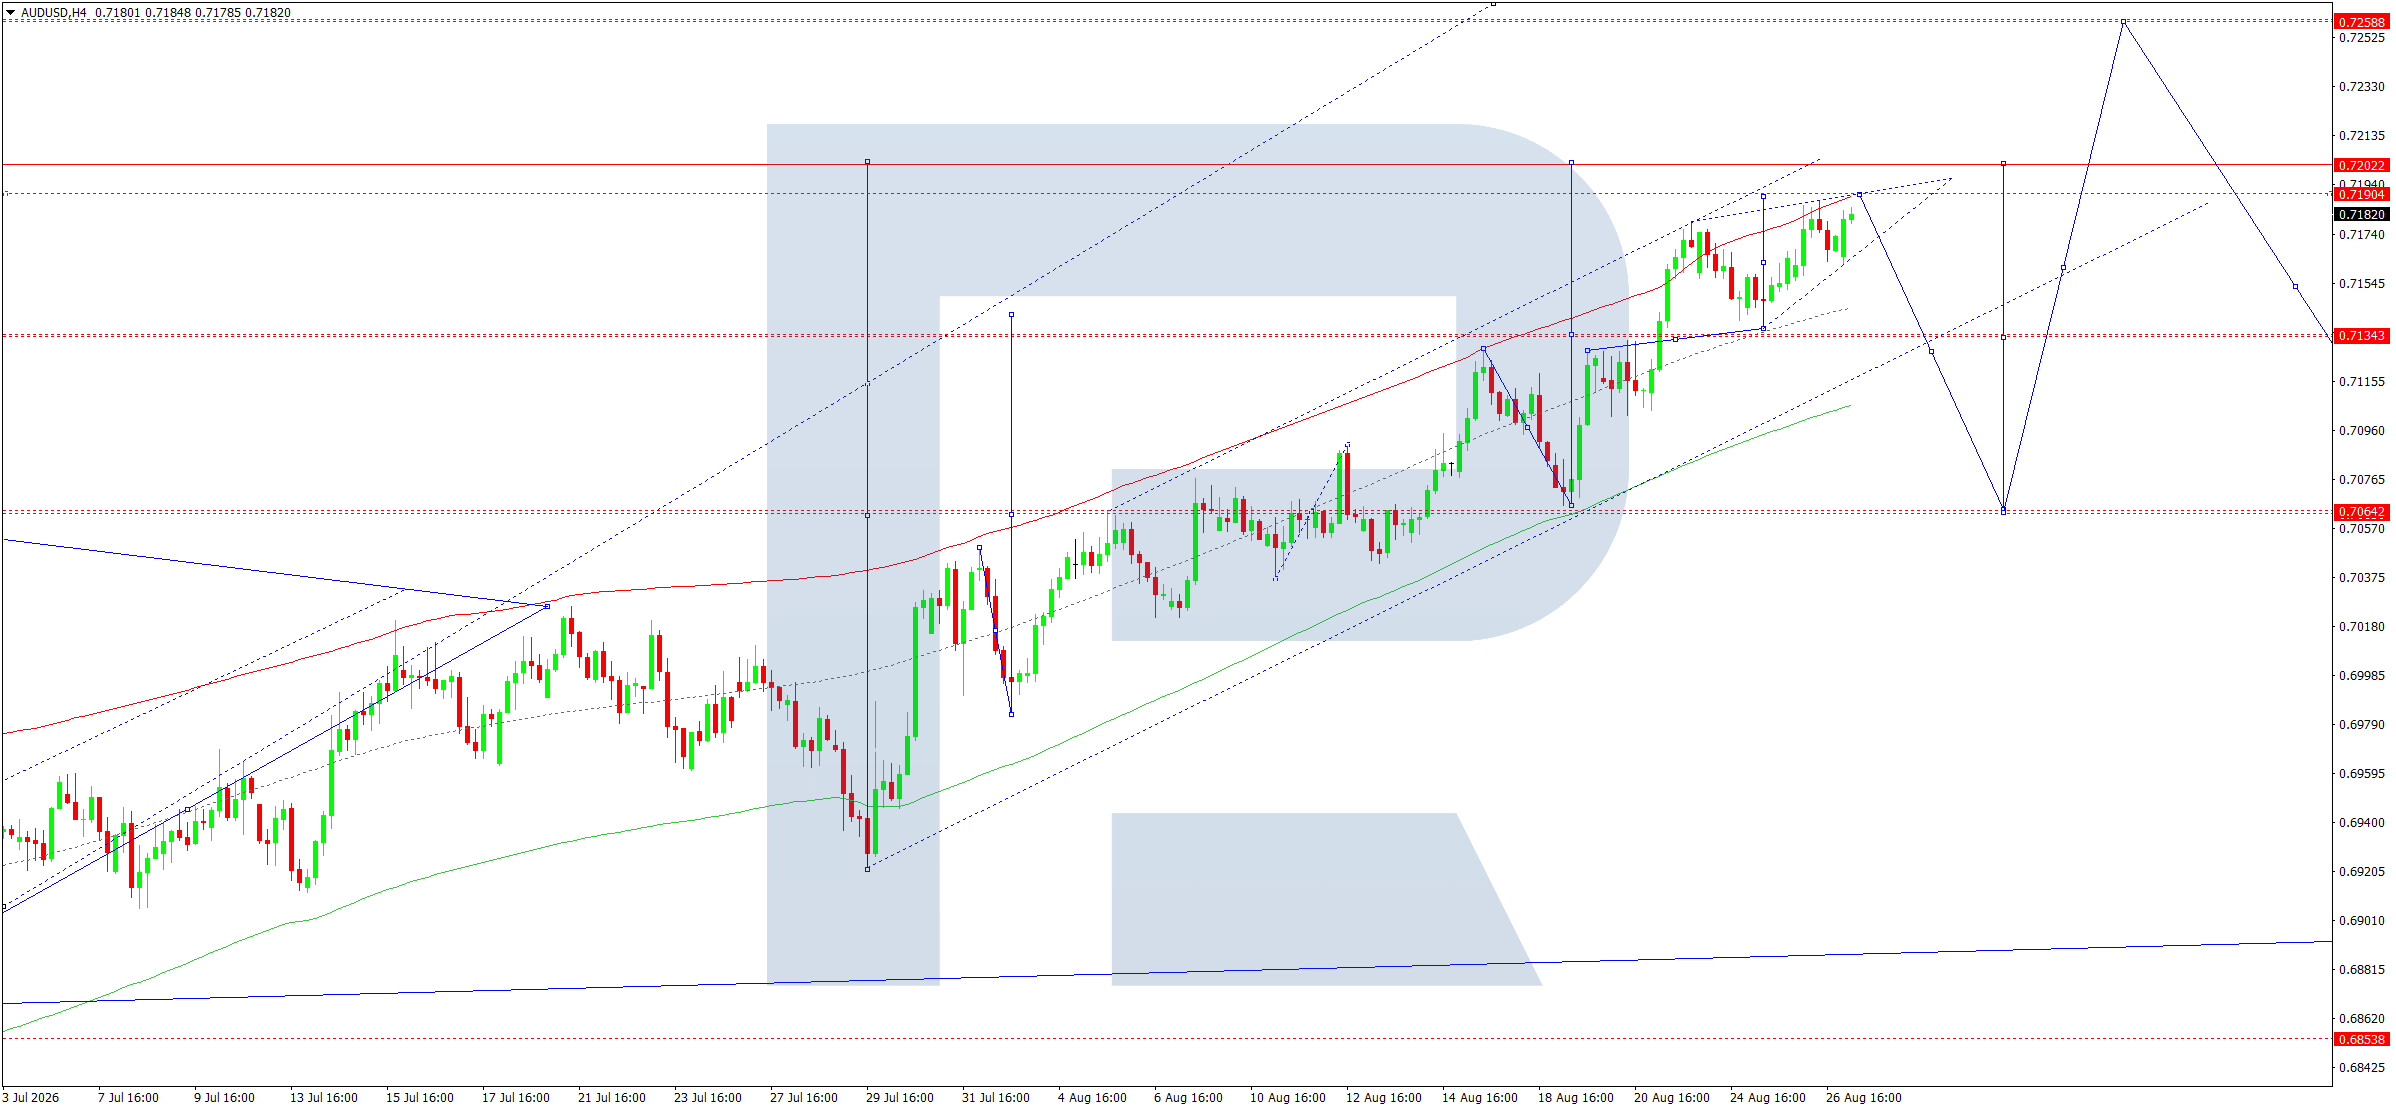
On the H4 chart, AUDUSD retains an upward structure. The market continues to form higher lows and higher highs and remains above the central line of the ascending Price Envelope.
The price has approached the 0.7190–0.7202 area. The 0.7187 level is the upper boundary of the current movement, while 0.7202 is the next resistance area. Meanwhile, the formation of local consolidation near the high increases the likelihood of a corrective wave towards 0.7134.
If the 0.7134 support level holds, the medium-term bullish scenario will remain intact, with the prospect of another move towards 0.7202 and subsequently 0.7259. Given the technically overbought conditions, a corrective decline is preferred for the coming day.
Trading scenario: SELL
- Price at the time of writing: 0.7182
- Entry price: 0.7177
- Stop loss: 0.7205
- Take profit: 0.7134
- Risk-to-reward ratio: 1:1.54
USDCAD forecast
The fundamental backdrop remains favourable for USDCAD growth. The Bank of Canada is keeping its interest rate at 2.25%, while the Canadian economy continues to face trade uncertainty and weak growth. The BoC expects the economy to improve gradually but also points to elevated risks associated with trade relations with the US.
The trade conflict between the US and Canada has escalated sharply in recent days. Following the breakdown of negotiations, the US announced 50% tariffs on a range of Canadian goods, while Canada prepared retaliatory measures. This puts additional pressure on the Canadian dollar and increases the risk of a deterioration in Canada’s trade balance and economic activity.
Lower oil prices are another factor. Brent fell below 90 USD per barrel amid hopes that traffic through the Strait of Hormuz would resume. Lower oil prices limit fundamental support for the CAD as a commodity currency.
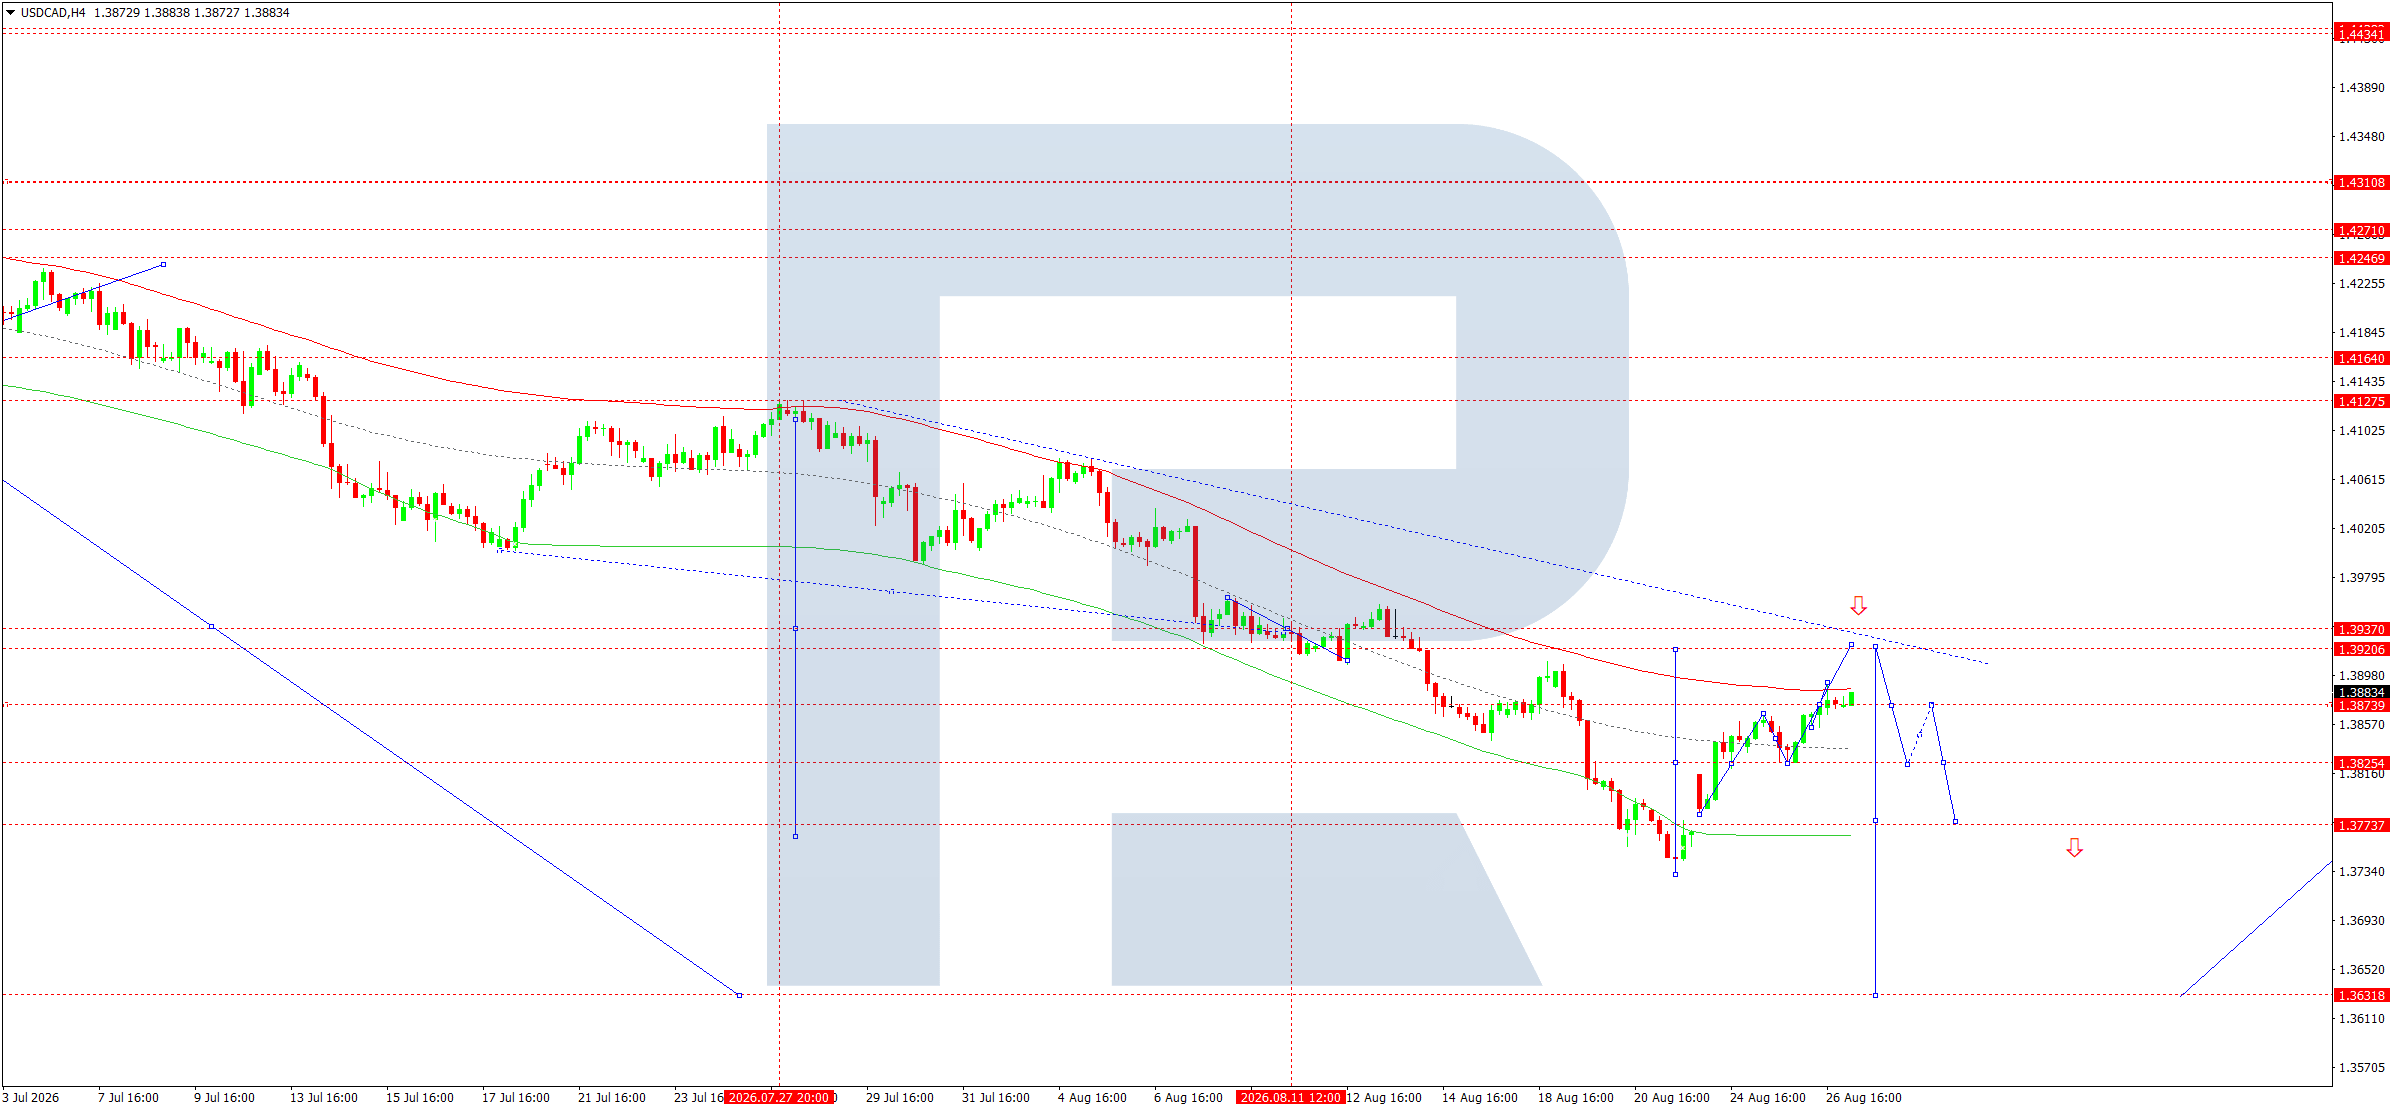
On the H4 chart, USDCAD remains in a medium-term downtrend, although the market staged a strong rebound from 1.3774 and returned to the 1.3878–1.3920 area. The price is currently consolidating near 1.3880 in an attempt to extend the upward correction.
The nearest resistance level is located at 1.3920. A breakout above this mark would open the way towards 1.3940 and subsequently 1.3970. The 1.3840–1.3850 area remains support. As long as the market holds above this zone, the short-term upside scenario remains more likely.
Given the increased trade risks for Canada and the market’s technical hold above support, BUY is preferred for the coming day.
Trading scenario: BUY
- Price at the time of writing: 1.3883
- Entry price: 1.3888
- Stop loss: 1.3850
- Take profit: 1.3940
- Risk-to-reward ratio: 1:1.37
XAUUSD forecast
The fundamental backdrop for XAUUSD remains predominantly positive. Gold is supported by persistent geopolitical risks, concerns about the sustainability of US public finances, and expectations of further US dollar weakness over the medium term. Elevated demand for safe-haven assets provides additional support.
At the same time, high US inflation limits gold’s upside potential. Headline PCE rose by 3.7% in July, while the core measure increased by 3.3%, and the probability of a Federal Reserve rate hike remains significant. The Fed chair’s speech at Jackson Hole could trigger a sharp shift in interest rate expectations. Gold may therefore remain within a broad range over the coming day.
Lower oil prices amid diplomatic contacts concerning the Strait of Hormuz have somewhat eased inflationary pressure, but geopolitical uncertainty remains high. Over the medium term, this continues to support demand for gold.
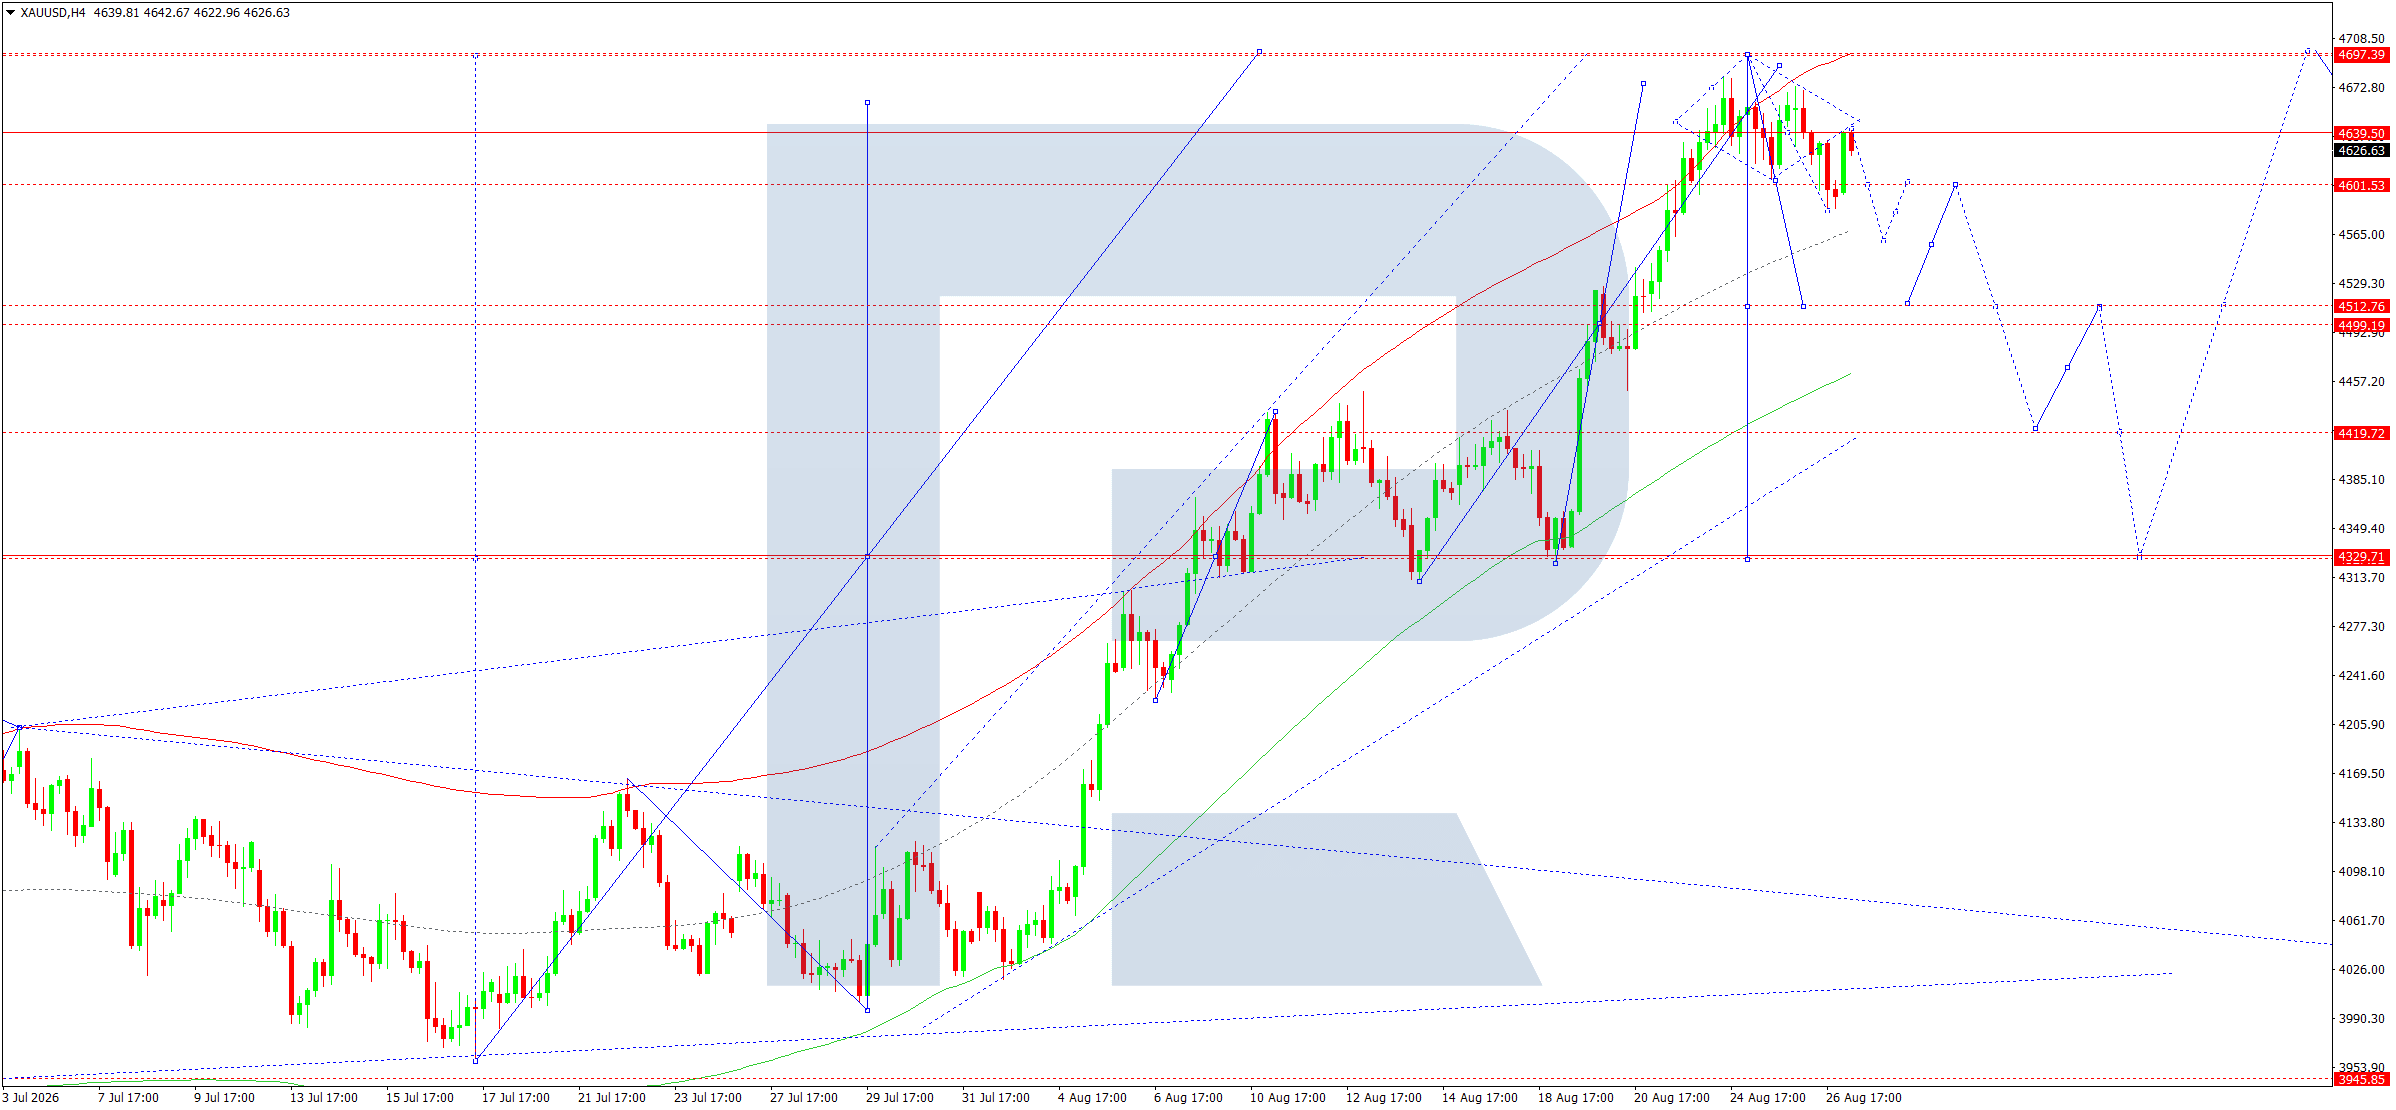
On the H4 chart, XAUUSD retains an upward structure. The market formed an upward wave towards the 4,697 area before entering consolidation. The current price is near 4,627, below the upper boundary of the Price Envelope.
The 4,510–4,512 area is key support, while 4,697 remains resistance. As long as the price holds above the central area at 4,510, the main upward structure remains intact.
Buying after the current area holds is preferred for the coming day. A breakout above 4,697 would create scope for further growth, while a sustained move below 4,510 would shift the short-term structure towards a deeper correction.
Trading scenario: BUY
- Price at the time of writing: 4,627
- Entry price: 4,632
- Stop loss: 4,588
- Take profit: 4,697
- Risk-to-reward ratio: 1:1.48
US 500 forecast
The fundamental backdrop for the US stock market remains constructive despite heightened sensitivity to interest rates. Strong results from technology companies have been the key positive driver. Nvidia’s report once again confirmed robust demand for artificial intelligence infrastructure, while the company’s guidance exceeded market expectations. At the same time, aggregate second-quarter earnings for S&P 500 companies remain significantly above last year’s level.
US inflation is a restraining factor. The rise in headline PCE to 3.7% and core PCE to 3.3% increases the likelihood of tighter Federal Reserve policy. The equity market therefore remains sensitive to government bond yields and the Federal Reserve chairman’s rhetoric at Jackson Hole.
Despite this risk, persistently strong corporate earnings growth and robust demand for technology continue to support overall risk appetite. The fundamental backdrop for the US 500 remains moderately positive for the coming day, although the likelihood of heightened volatility ahead of the Fed chair’s speech remains high.
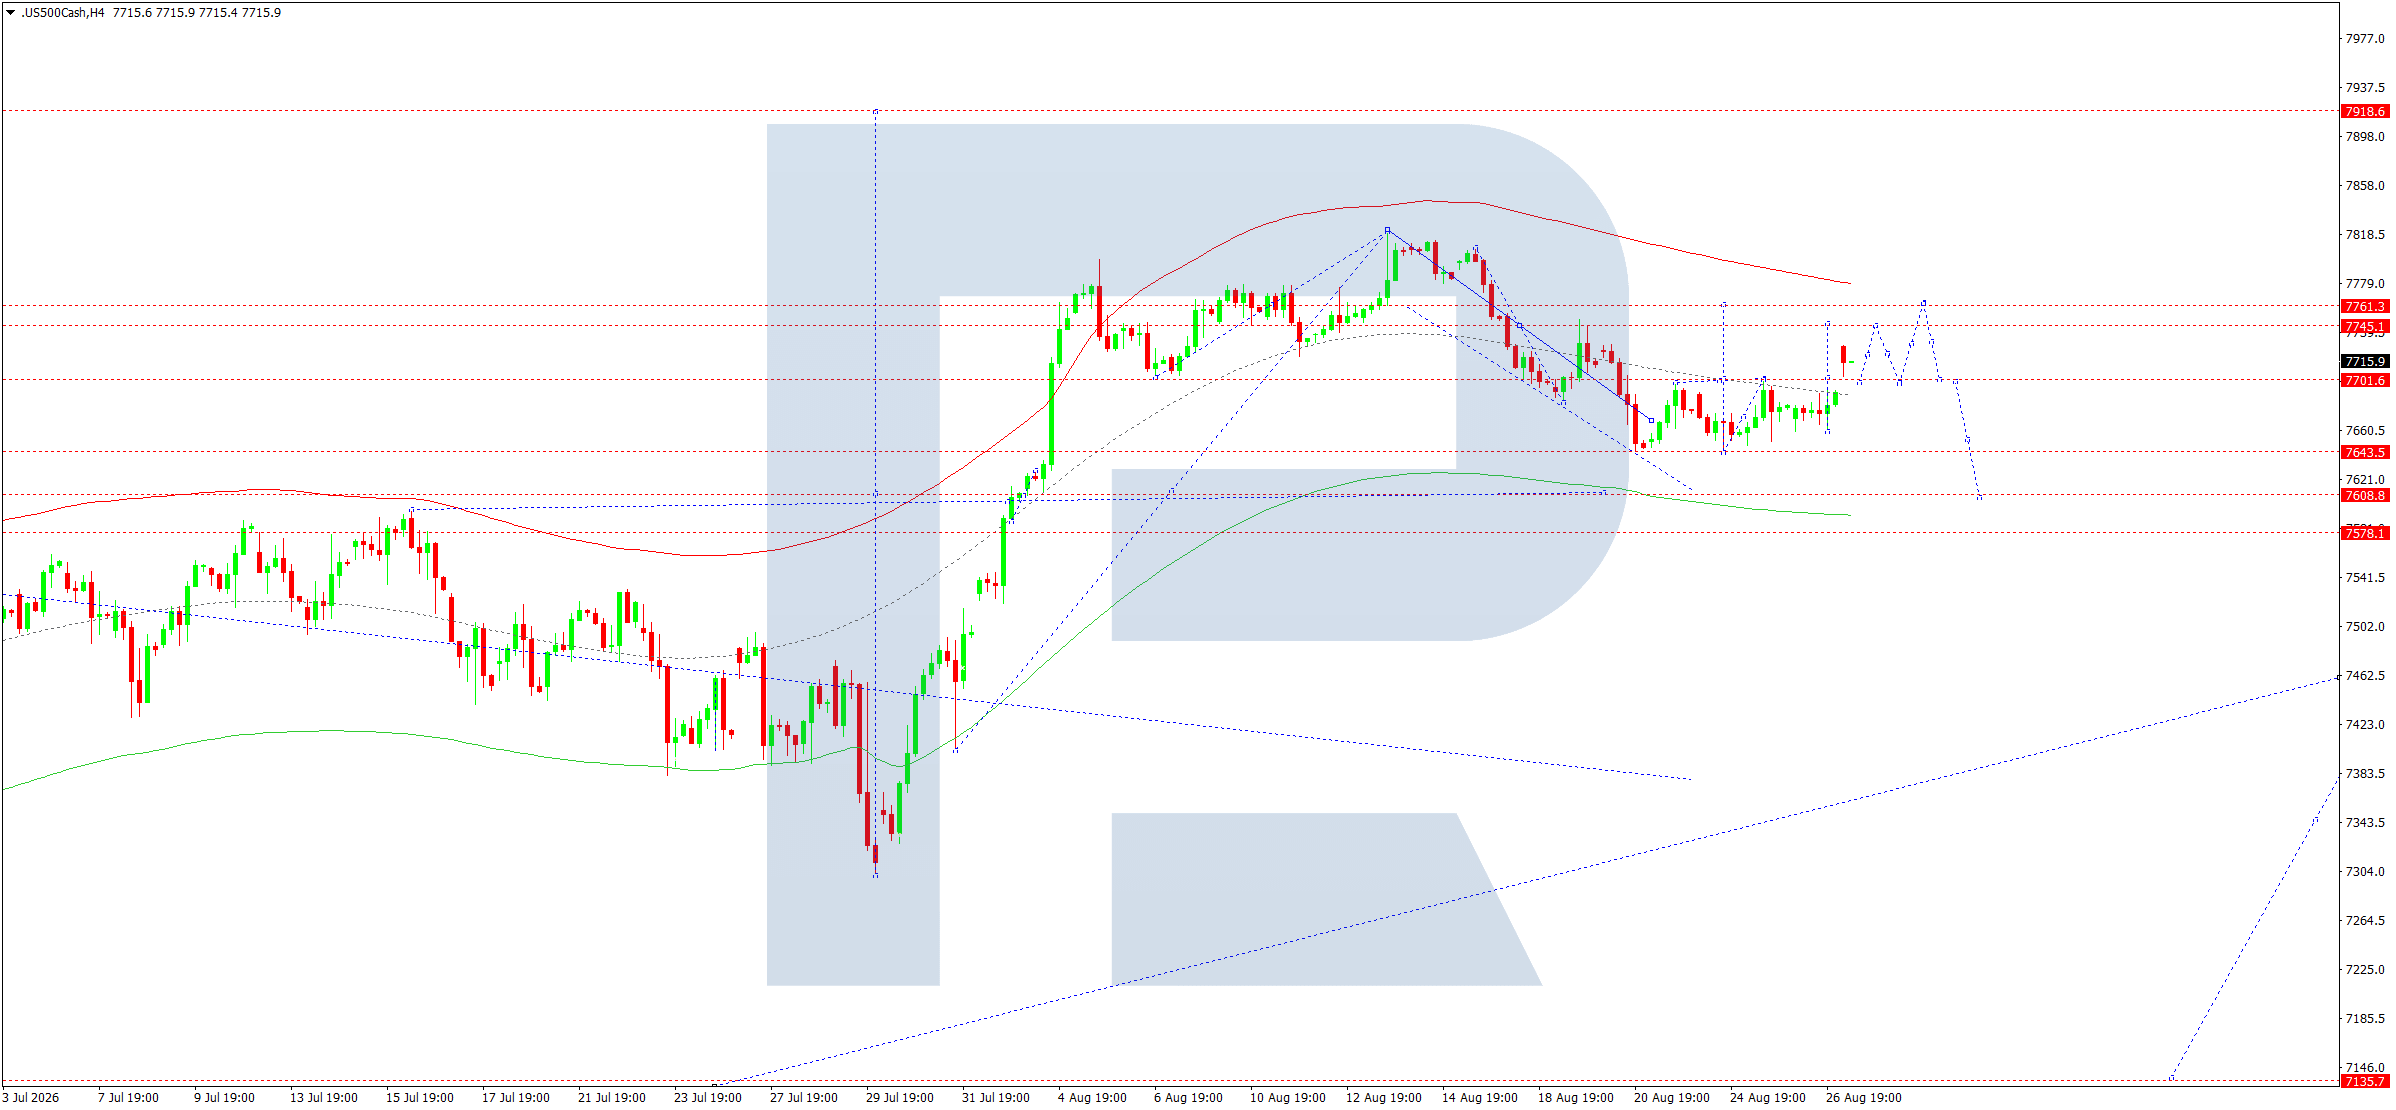
On the H4 chart, following a strong upward wave, the US 500 entered a correction and then began to consolidate within the 7,700–7,720 area. The price is currently hovering near 7,716 and remains above support at 7,701.
The nearest resistance is located within the 7,745–7,761 area. A breakout above it would open the way for continued growth towards 7,916. Support lies within the 7,608-7,643 area. As long as the market remains above 7,700, the short-term structure retains the potential to develop an upward wave.
Given the strong corporate backdrop and the market’s technical hold above support, the main scenario for the coming day is continued growth.
Trading scenario: BUY
- Price at the time of writing: 7,716
- Entry price: 7,721
- Stop loss: 7,688
- Take profit: 7,761
- Risk-to-reward ratio: 1:1.21
BTCUSD forecast
The fundamental backdrop for BTCUSD remains positive over the medium term. Bitcoin is supported by a weaker US dollar, expectations of a shift in US monetary policy, and growing demand for alternative assets. US Treasury purchases of long-term bonds have provided additional support, fuelling debate about the risk of US dollar depreciation. As a result, Bitcoin previously rose above 81,000.
However, the current environment is characterised by rising yields and considerable uncertainty over the Federal Reserve’s future policy. The PCE measure remains well above the target level, meaning hawkish remarks from the Fed chair could temporarily weaken demand for risk assets. At the same time, Bitcoin remains highly correlated with the stock market, so movements in the US 500 and the technology sector will directly affect BTCUSD.
For the coming day, the fundamental backdrop does not invalidate the positive medium-term scenario but creates conditions for a corrective wave following August’s strong rally.
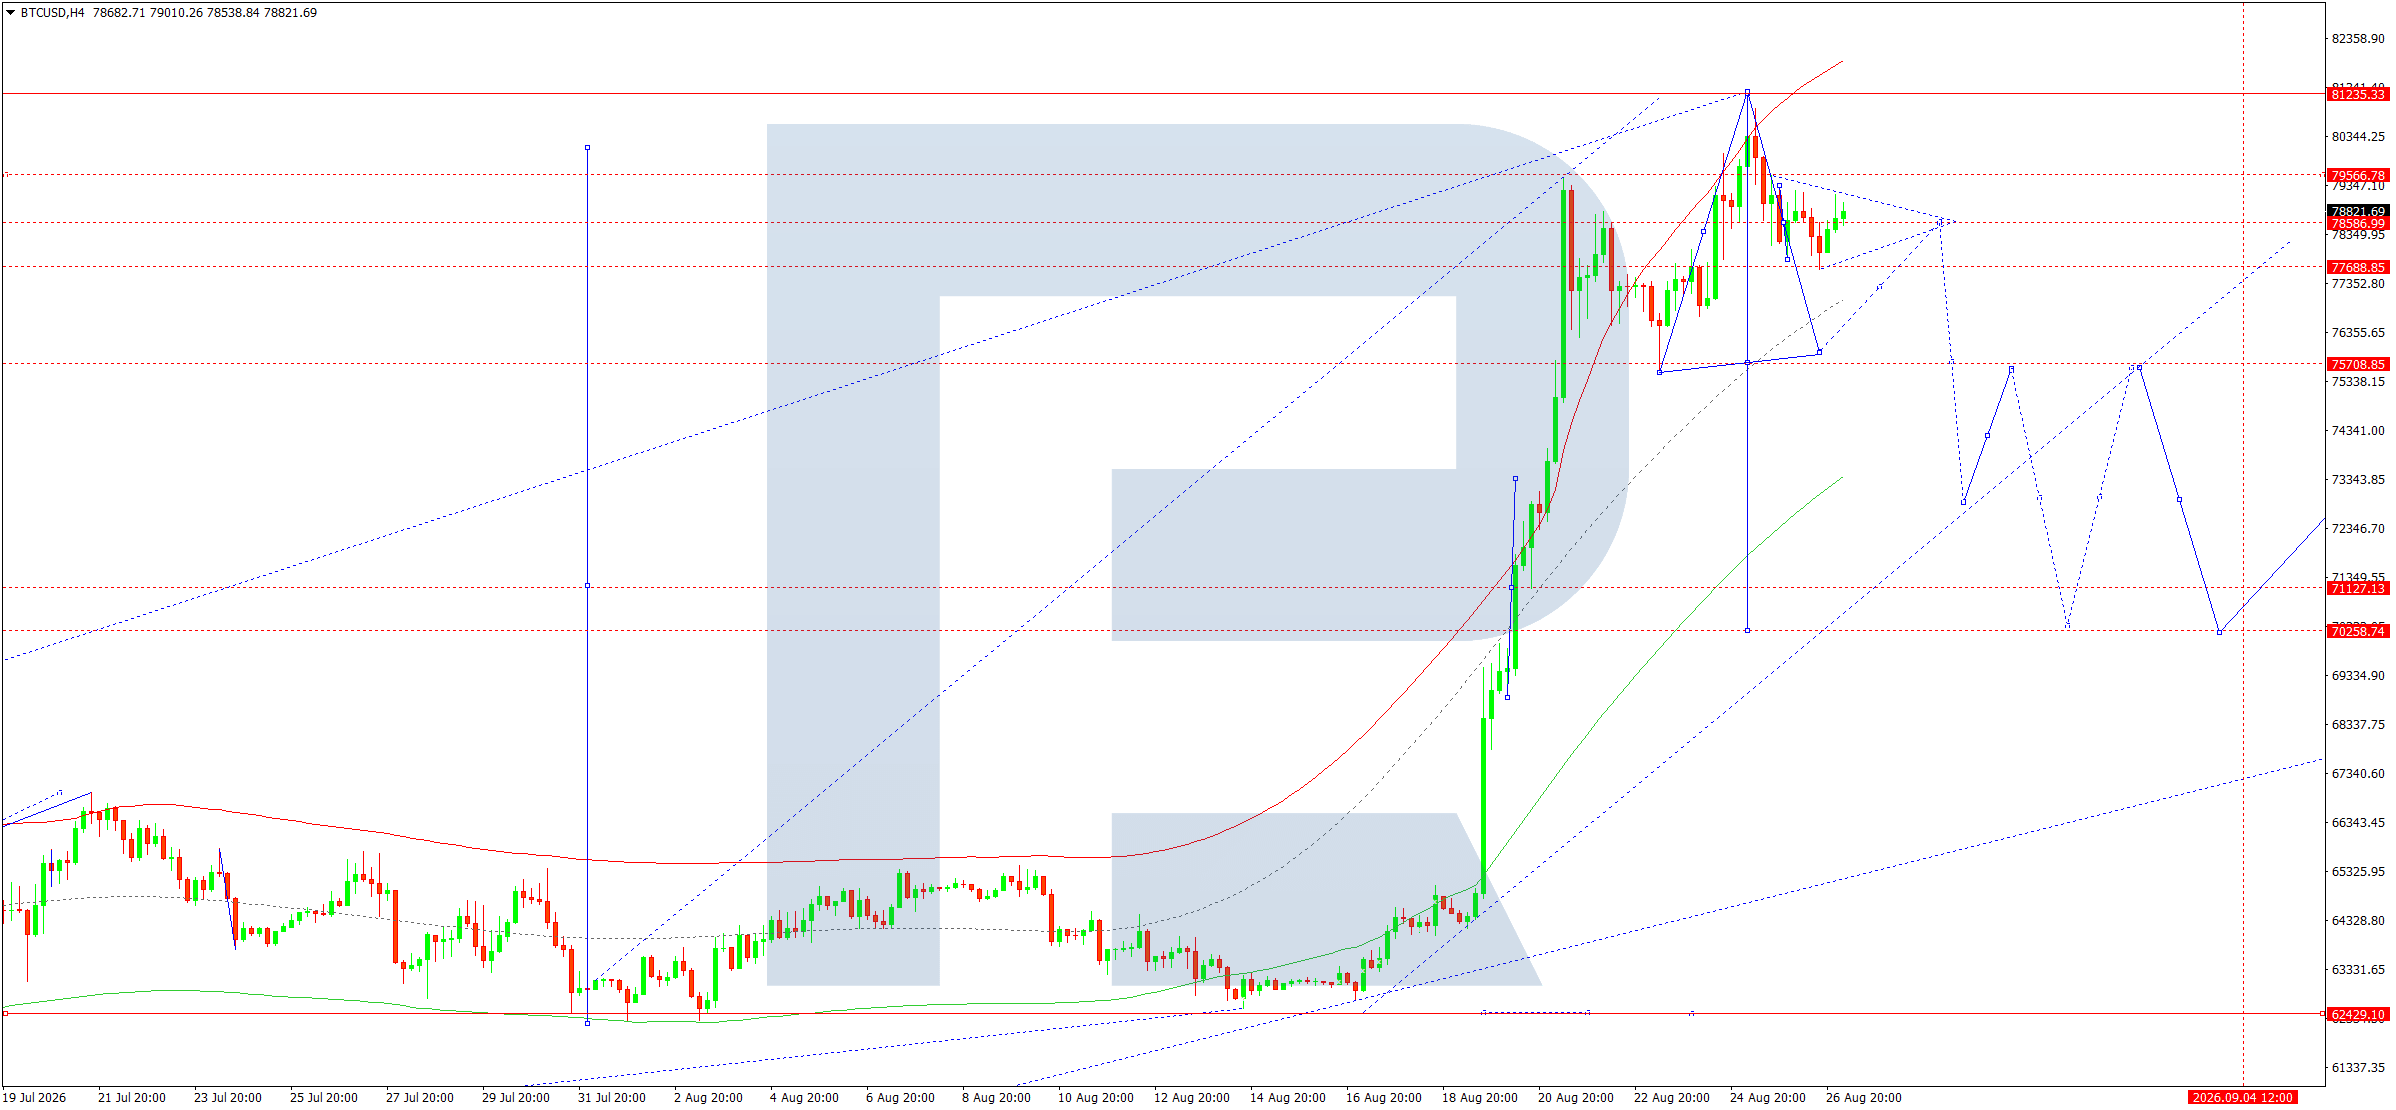
On the H4 chart, BTCUSD formed a powerful upward wave towards 81,235 before entering a correction and declining to the 77,688 area. The price is currently trading near 78,821 and consolidating above 77,688.
The nearest resistance lies within the 79,566–79,600 area. A breakout above this zone would allow the market to retest 81,235. However, while the price remains below this area, the risk of a further correction persists.
A breakout below 77,688 would open the way towards 75,708 and subsequently 72,800. This structure currently appears the most logical short-term trajectory following the completion of the first downward wave.
Given the technical structure, selling from the current area is preferred for the coming day, targeting a continuation of the correction towards 75,708. The medium-term uptrend will remain intact as long as the market holds above 75,708–72,800.
Trading scenario: SELL
- Price at the time of writing: 78,821
- Entry price: 78,816
- Stop loss: 79,600
- Take profit: 75,708
- Risk-to-reward ratio: 1:3.98
Editors’ picks
 EURUSD forecast 2026–2027: technical analysis, price levels & predictions
EURUSD has recovered from the July lows and is trading near 1.1545 — back in bullish territory. The pair has reclaimed EMA65 on the daily, formed a bullish EMA crossover on H4, and the US-eurozone GDP gap has narrowed sharply (US 1.5% vs eurozone 1.0%). Goldman Sachs and Deutsche Bank both now target 1.2500 by year-end. A confirmed close above 1.1700 opens the path to 1.1805. We break down the key levels, three trading scenarios, and what the unprecedented 9-3 FOMC dissent vote means for EURUSD.
 Gold (XAUUSD) forecast 2026: technical analysis, price levels & predictions
Gold has reversed its downtrend and is trading near 4,360 USD, back above both EMA65 and EMA200. ETF flows turned positive in July with 3 billion USD of net inflows, and central banks bought 288.9 tonnes in Q2 — up 62% year-on-year. A breakout above 4,500 USD opens the path to 4,855 USD and the 5,597 USD all-time high. We break down the key levels, three trading scenarios with entry triggers, and what J.P. Morgan, Deutsche Bank and Goldman Sachs are forecasting for gold in 2026.
Forecasts presented in this section only reflect the author’s private opinion and should not be considered as guidance for trading. RoboForex bears no responsibility for trading results based on trading recommendations described in these analytical reviews.