
Daily technical analysis and forecast for 28 August 2026
Daily technical analysis and forecast for EURUSD, USDJPY, GBPUSD, AUDUSD, USDCAD, XAUUSD, US 500, and BTCUSD for 28 August 2026.
Each scenario on this page reflects the market structure on the H4 chart as of 10:00 UTC+3 on 28 August 2026 and remains valid throughout the current trading day. It closes when the price reaches either the take-profit or stop-loss level, or at the end of the trading day if neither level has been reached. The assessment considers the current H4 chart structure, key support and resistance levels, the direction of the medium-term movement, and the prevailing fundamental backdrop.
EURUSD forecast
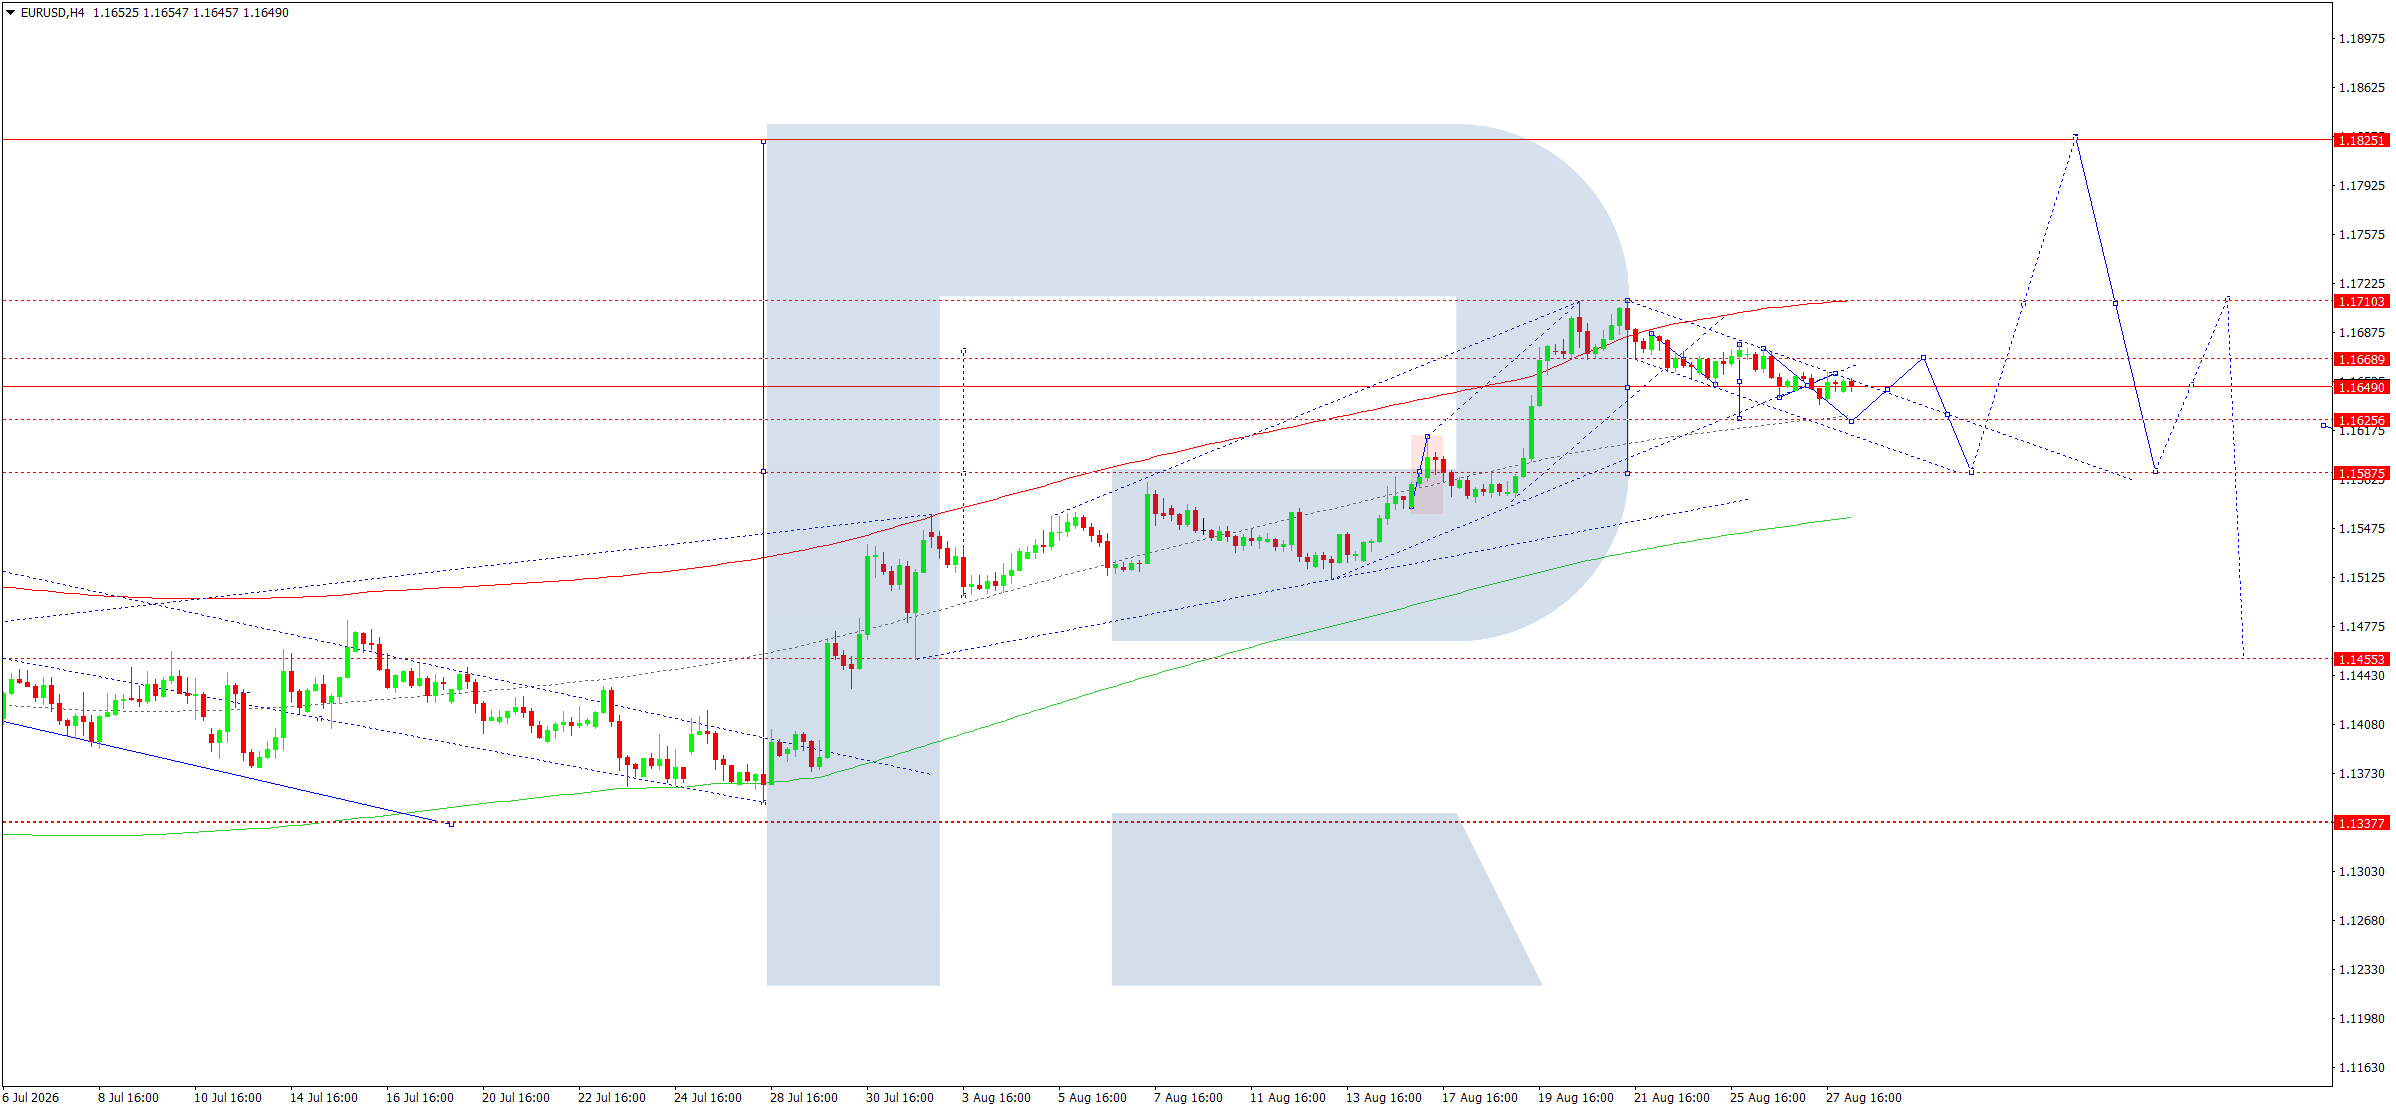
On the H4 chart, after a prolonged upward move, the EURUSD pair formed a high around 1.1710 and entered a corrective phase. The fundamental backdrop remains mixed. On the one hand, expectations of an ECB rate hike in September provide support for the euro. On the other hand, persistent inflation in the US and the possibility of more hawkish Fed rhetoric today could temporarily strengthen the US dollar. Therefore, the fundamental backdrop suggests EURUSD growth in the medium term, but for the coming trading day the corrective scenario still has the advantage.
On the H4 chart, after reaching the 1.1710 area, the market failed to consolidate above the upper boundary of the Price Envelope. The subsequent decline brought the price towards 1.1640–1.1650, where a consolidation range formed. The structure of the latest candlesticks indicates weakening upward momentum: highs are gradually declining, while the price remains below the 1.1669–1.1710 area.
The main support level is around 1.1636. A breakout below it would signal the end of the current consolidation range and open the way towards the central line of the Price Envelope at 1.1624. If sellers consolidate below 1.1624, the next target will be 1.1586. The 1.1586 level is viewed as a crucial reference point for the entire current upward wave and a potential area where the first part of the correction could end.
At the same time, a decline towards 1.1586 would not automatically mean that a new long-term downtrend has formed. Buyers may emerge at this level, leading to a recovery towards 1.1624–1.1669. An alternative scenario would be activated by sustained consolidation above 1.1669, after which the market could test 1.1710 again.
The most likely scenario for 28 August remains a continued downward correction, with an initial target at 1.1624 followed by a test of 1.1586.
Trading scenario: SELL
- Price at the time of writing: 1.1649
- Entry price: 1.1644
- Stop loss: 1.1680
- Take profit: 1.1586
- Risk-to-reward ratio: 1:2
USDJPY forecast
On the H4 chart, USDJPY maintains a complex structure after the sharp decline at the end of July. The fundamental factor is gradually shifting in favour of the yen. Accelerating inflation in Tokyo fuels expectations of further BoJ tightening, while in the US the possibility of a Fed rate hike remains due to persistent inflation. Thus, both sides of the currency pair are receiving support from their respective monetary policies, but in the short term, the decisive factors remain US bond yields and expectations surrounding the Fed’s speech.
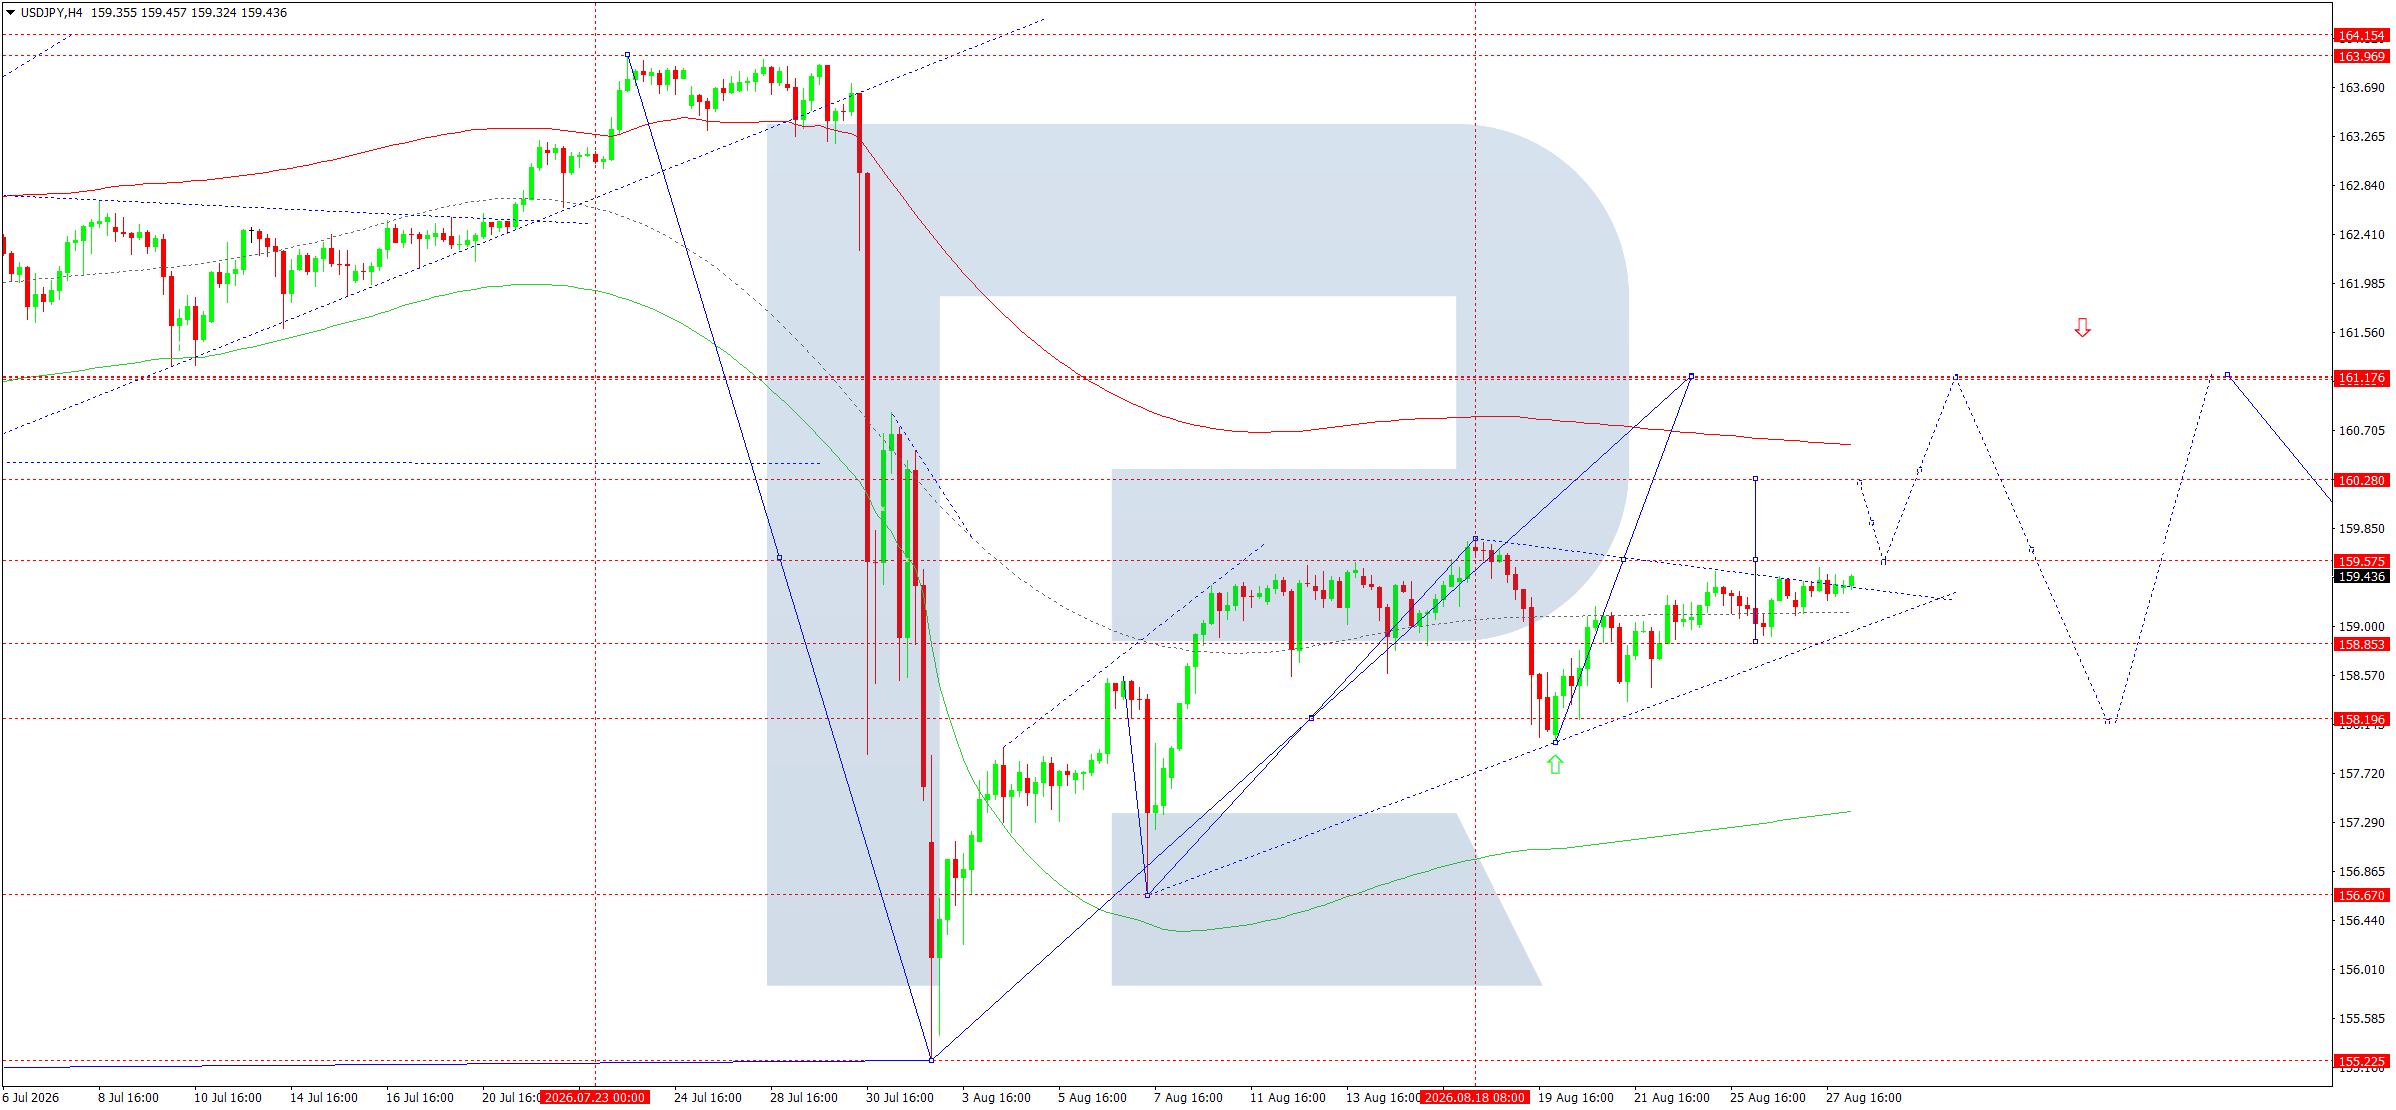
After falling towards 158.20, the market formed a steady recovery wave. On the H4 chart, a sequence of higher local lows emerged, while the price returned to the 159.40–159.60 area. The market is now forming a consolidation range around the central line of the Price Envelope.
The key resistance level is 159.57. Consolidation above this mark would confirm continued short-term upward momentum and suggest a move towards 160.28. The next target is 161.16, which is also the upper boundary of the established upward structure and a significant resistance area.
On the other hand, the 158.85 level is the first significant support. A breakout below this mark would return the market to a downward phase and increase the probability of a move towards 158.20. Below 158.20, the next target would be 157.70, where deeper support for the current structure is located.
Given the established sequence of lows, the main scenario suggests a continuation of the recovery. However, buying directly in the middle of the range is risky, so an entry after a small pullback while the price remains above 158.85 is preferable.
For the coming trading day, an attempt to continue the rise is expected, with an initial target at 160.28 and further potential towards 161.16.
Trading scenario: BUY
- Price at the time of writing: 159.44
- Entry price: 159.49
- Stop loss: 158.85
- Take profit: 161.16
- Risk-to-reward ratio: 1:3
GBPUSD forecast
The fundamental backdrop for GBPUSD remains mixed, but in the short term, it favours the US dollar. UK inflation accelerated to 2.9% in July, limiting the scope for a rapid BoE rate cut. At the same time, core and services inflation remain significantly more subdued, while the state of the economy does not support expectations of a prolonged tightening cycle. In the US, PCE inflation remains above the target level, so Fed rhetoric may prove more hawkish. This creates an additional risk of a GBPUSD decline in the near term.
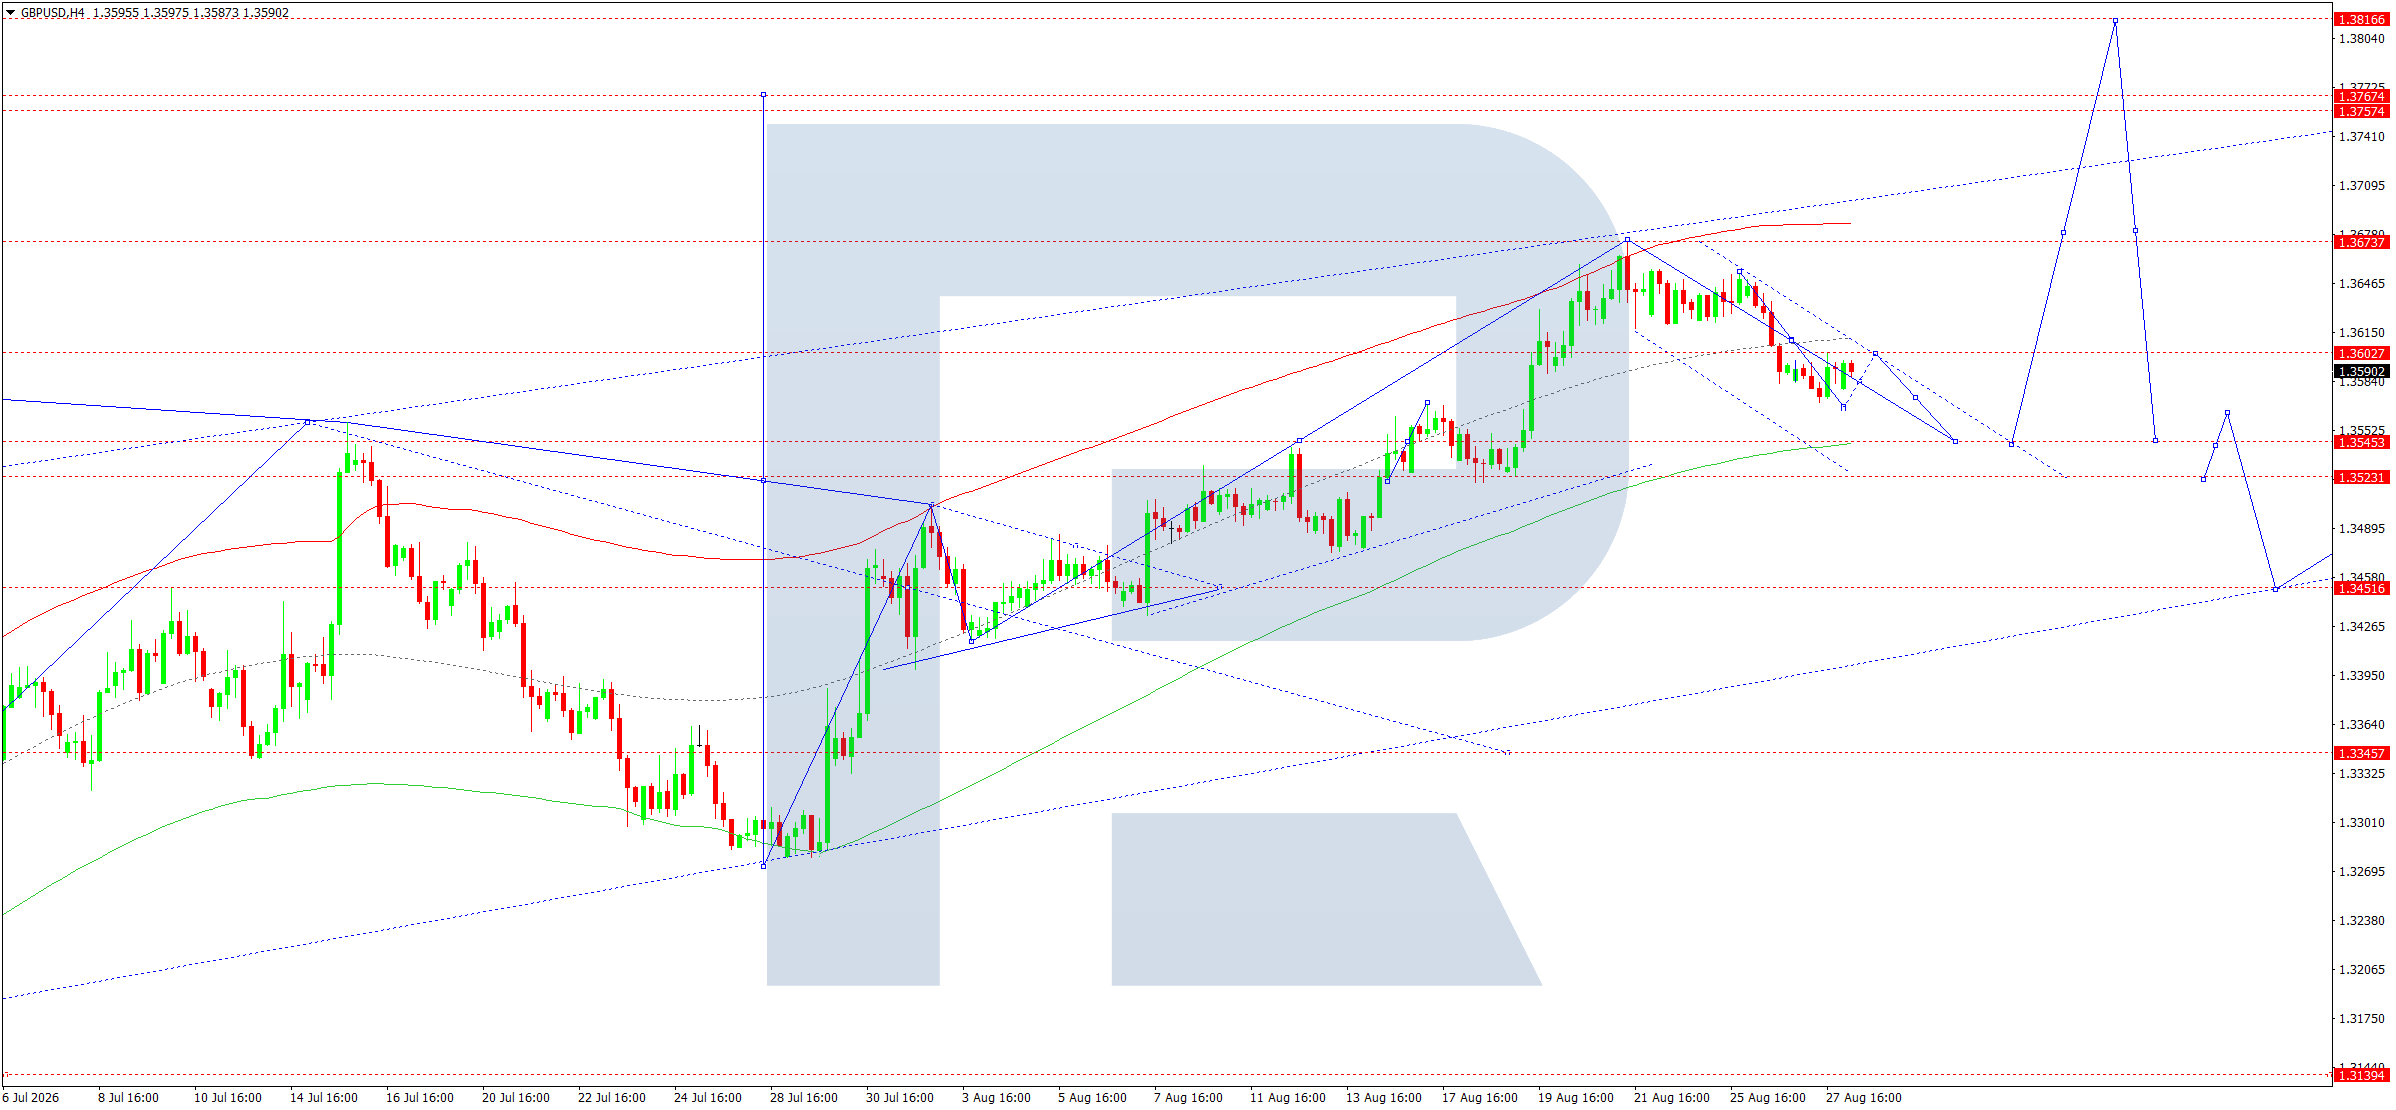
On the H4 chart, after forming a high around 1.3674, GBPUSD entered a downward correction. The sequence of local highs shows a gradual weakening of buyers. The price is currently around 1.3590 and consolidating below the 1.3602 resistance level.
The 1.3600–1.3602 area acts as the central line of the current structure. As long as the price remains below this area, the likelihood of a continued correction remains. The first target is 1.3545, where the lower boundary of the nearest Price Envelope is located.
A breakout below 1.3545 would increase selling pressure and enable a further decline towards 1.3523. Below this level, the way opens towards 1.3452, although reaching this target would require the formation of a stronger downward wave.
At the same time, buyers may emerge around 1.3545. Therefore, after the first test of this level, a technical rebound towards 1.3600 cannot be ruled out. Such a rebound would fit the corrective structure and would not invalidate the main bearish scenario as long as the price remains below 1.3637.
Consolidation above 1.3637 would signal weakening selling pressure and suggest another test of 1.3674. However, at this stage, the probability of an immediate continuation of the decline appears higher.
Trading scenario: SELL
- Price at the time of writing: 1.3590
- Entry price: 1.3585
- Stop loss: 1.3625
- Take profit: 1.3523
- Risk-to-reward ratio: 1:2
AUDUSD forecast
The fundamental backdrop for the Australian dollar remains relatively strong. The RBA kept its interest rate at 4.35%, while explicitly stating that inflation remains too high and that risks to the inflation outlook are tilted to the upside. This limits the likelihood of rapid policy easing and supports the AUD. At the same time, the global economic environment and commodity market dynamics continue to play an important role. However, after a strong rise in AUDUSD, the current technical picture creates conditions for a correction regardless of the Australian dollar’s medium-term fundamental advantage.
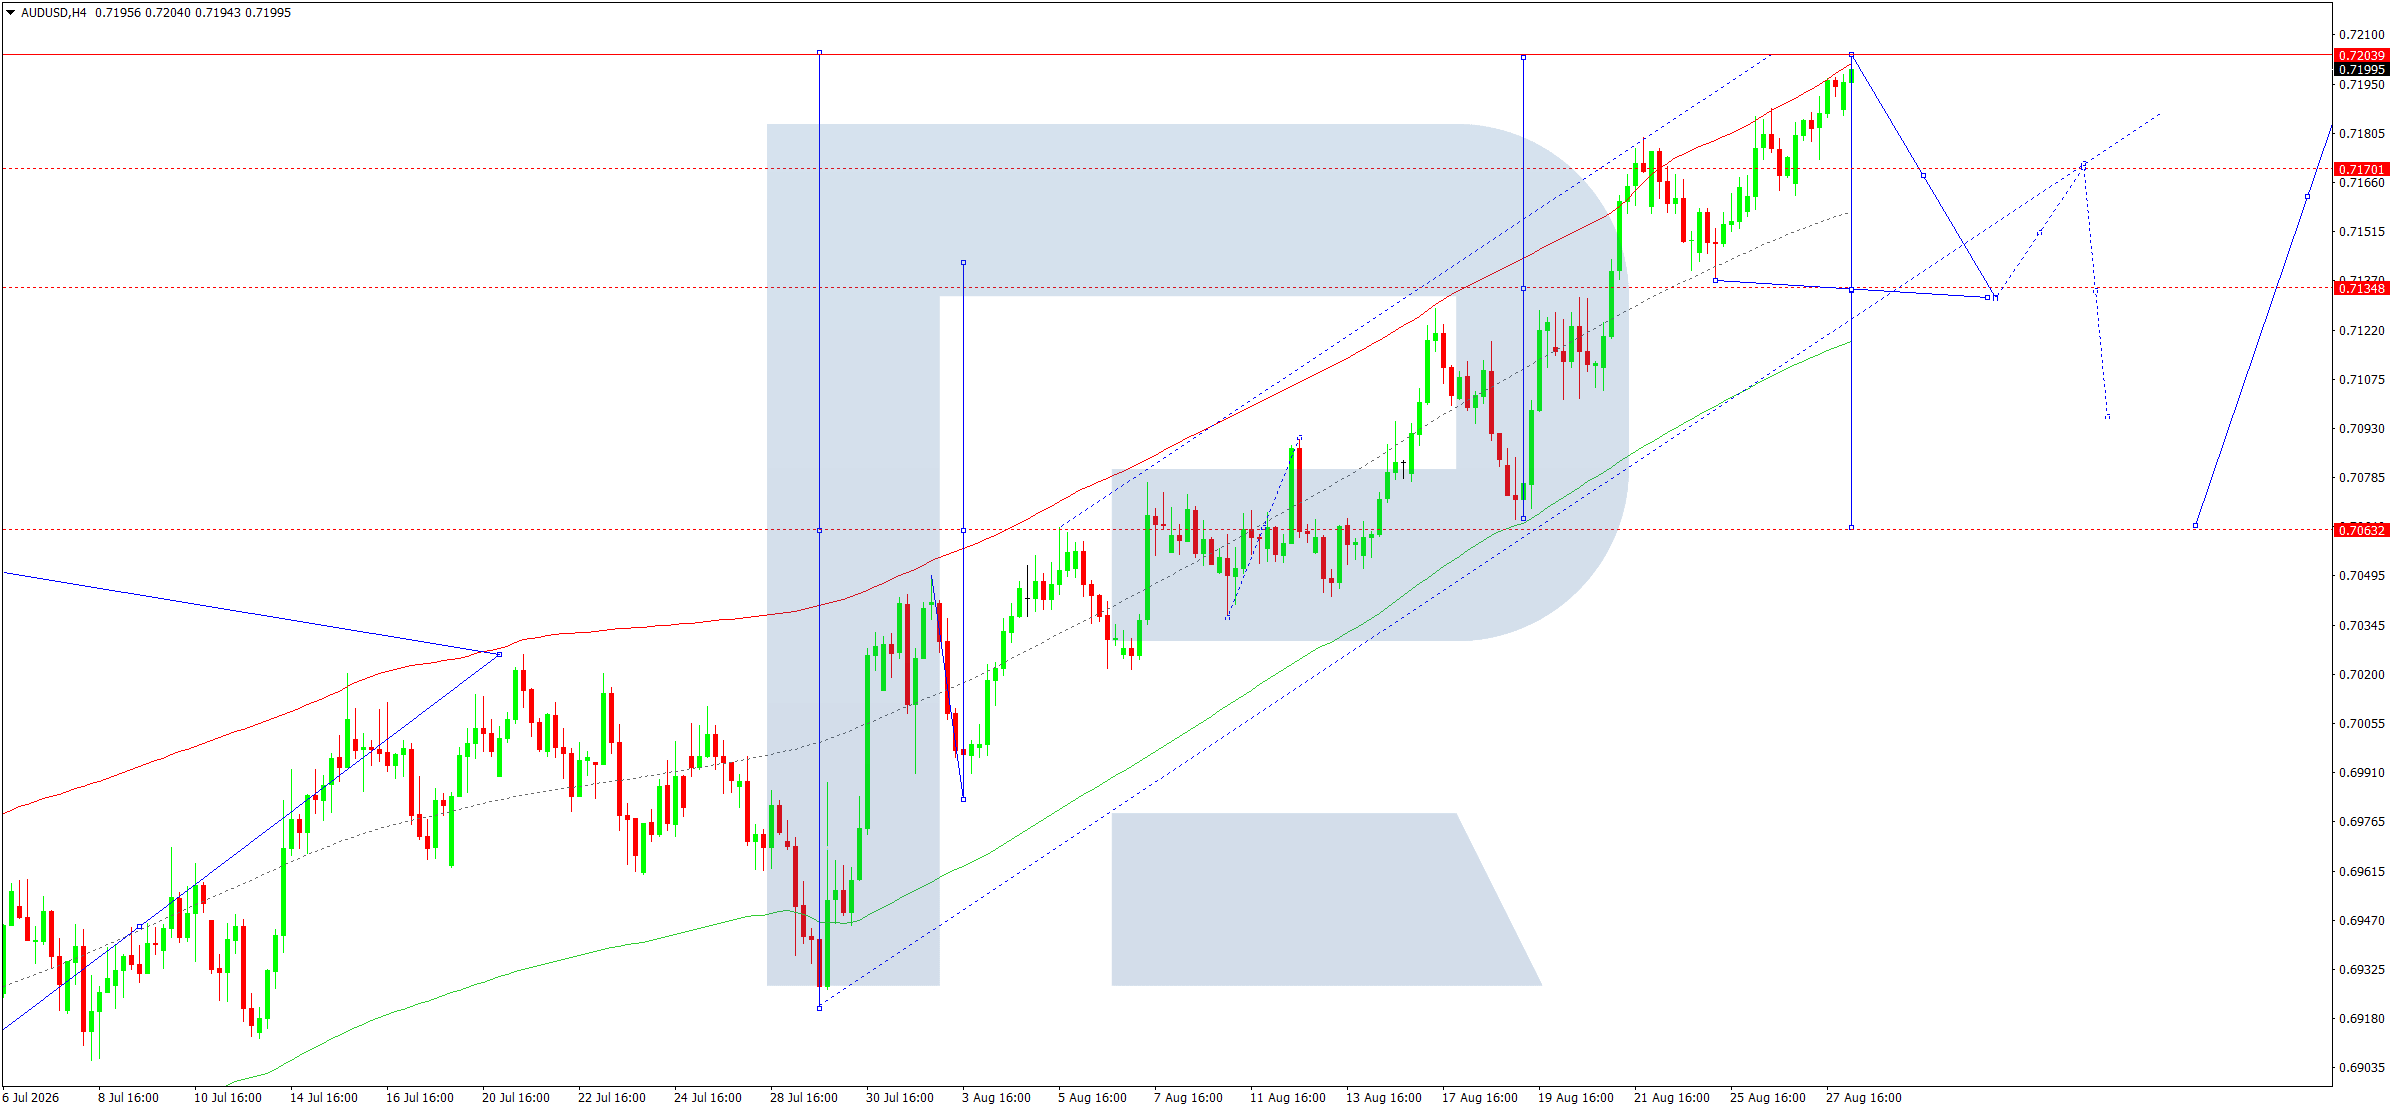
On the H4 chart, AUDUSD maintains a pronounced upward trend. After forming a low around 0.6918, the market consistently formed a series of higher lows and higher highs. The latest upward wave took the price towards 0.7200, where the upper boundary of the Price Envelope and strong horizontal resistance are located.
Around 0.7200, the market began to show signs of the upward move stalling. This is particularly important after a prolonged sequence of bullish candlesticks. Therefore, the likelihood of a technical correction over the coming day has increased significantly.
The first downside target is 0.7138, the central line of the current Price Envelope. Holding this level could lead to a new upward impulse and another test of 0.7200. However, a breakout below 0.7138 would open the way towards 0.7064, which is viewed as the next important support level.
A deeper correction towards 0.7064 would not invalidate the medium-term upward structure if the price holds this level as support. Only sustained consolidation below 0.7064 would indicate that the market is entering a deeper downward phase.
The main scenario for the coming trading day remains a correction from the 0.7200 area towards 0.7138. Given the price’s position near the upper boundary of the Price Envelope, preference is given to selling.
Trading scenario: SELL
- Price at the time of writing: 0.7200
- Entry price: 0.7195
- Stop loss: 0.7210
- Take profit: 0.7138
- Risk-to-reward ratio: 1:4
USDCAD forecast
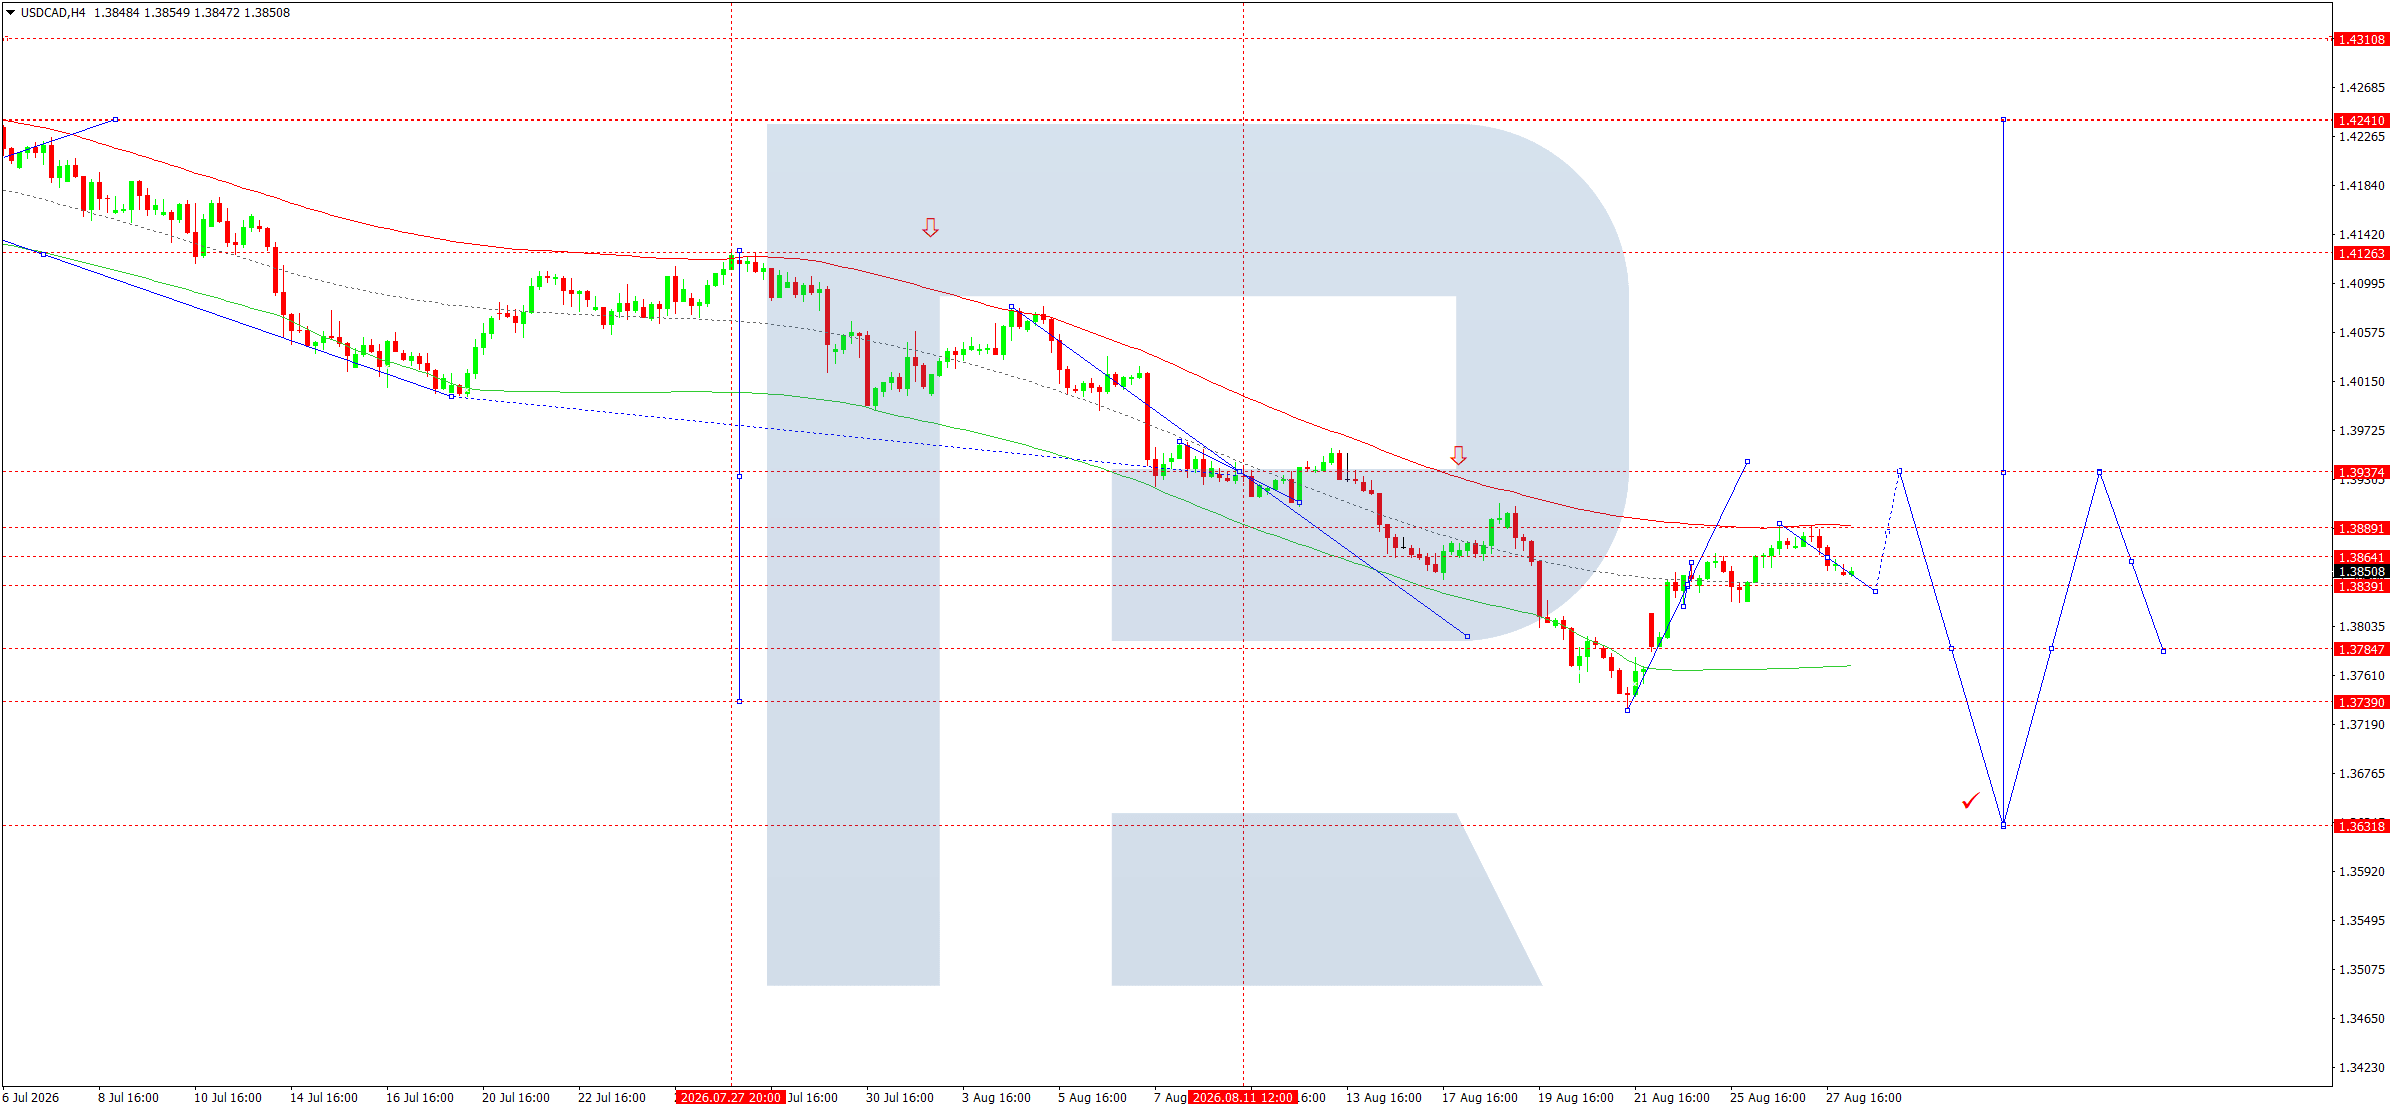
USDCAD remains sensitive to the divergence between US and Canadian monetary policy, as well as to the oil market. The BoC is in a significantly more dovish position than the Fed, which limits the Canadian dollar’s upside potential. At the same time, lower oil prices following some easing of geopolitical tensions reduce support for CAD as a commodity currency. In the near term, Canadian economic data and expectations regarding further BoC decisions also remain important. Therefore, the fundamental backdrop still suggests a continued USDCAD recovery.
On the H4 chart, after a prolonged downward move, USDCAD formed a low around 1.3739 and began to recover. The subsequent structure indicates the formation of an upward correction, with local lows rising consistently.
The price approached the 1.3889 resistance level and then formed a consolidation range. The 1.3838–1.3860 area now acts as central support. As long as the market holds above 1.3838, the recovery structure remains intact.
A breakout above 1.3889 would be an important technical signal and open the way towards 1.3937. If a strong impulse develops, the next target could be 1.3949. This area is viewed as the upper boundary of the current structure.
If the price fails to consolidate above 1.3889 and falls below 1.3838, the upward wave will weaken. In this case, a move towards 1.3785 and then 1.3739 is likely.
At this stage, the market is closer to resistance, so entering at market requires caution. A more preferable scenario would be to buy after a small pullback while support at 1.3838 remains intact.
The main forecast for 28 August suggests an attempt to break above 1.3889, followed by a move towards 1.3937.
Trading scenario: BUY
- Price at the time of writing: 1.3851
- Entry price: 1.3856
- Stop loss: 1.3815
- Take profit: 1.3920
- Risk-to-reward ratio: 1:2
XAUUSD forecast
Gold remains in a strong medium-term upward structure, although the short-term fundamental backdrop creates conditions for a correction. The main factor today is Federal Reserve Chairman Kevin Warsh’s speech in Jackson Hole. Persistent PCE inflation and the possibility of a Fed rate hike in September could support the US dollar and bond yields, which traditionally puts pressure on gold. At the same time, geopolitical risks and strong demand from ETFs and central banks limit the potential for a deep decline.
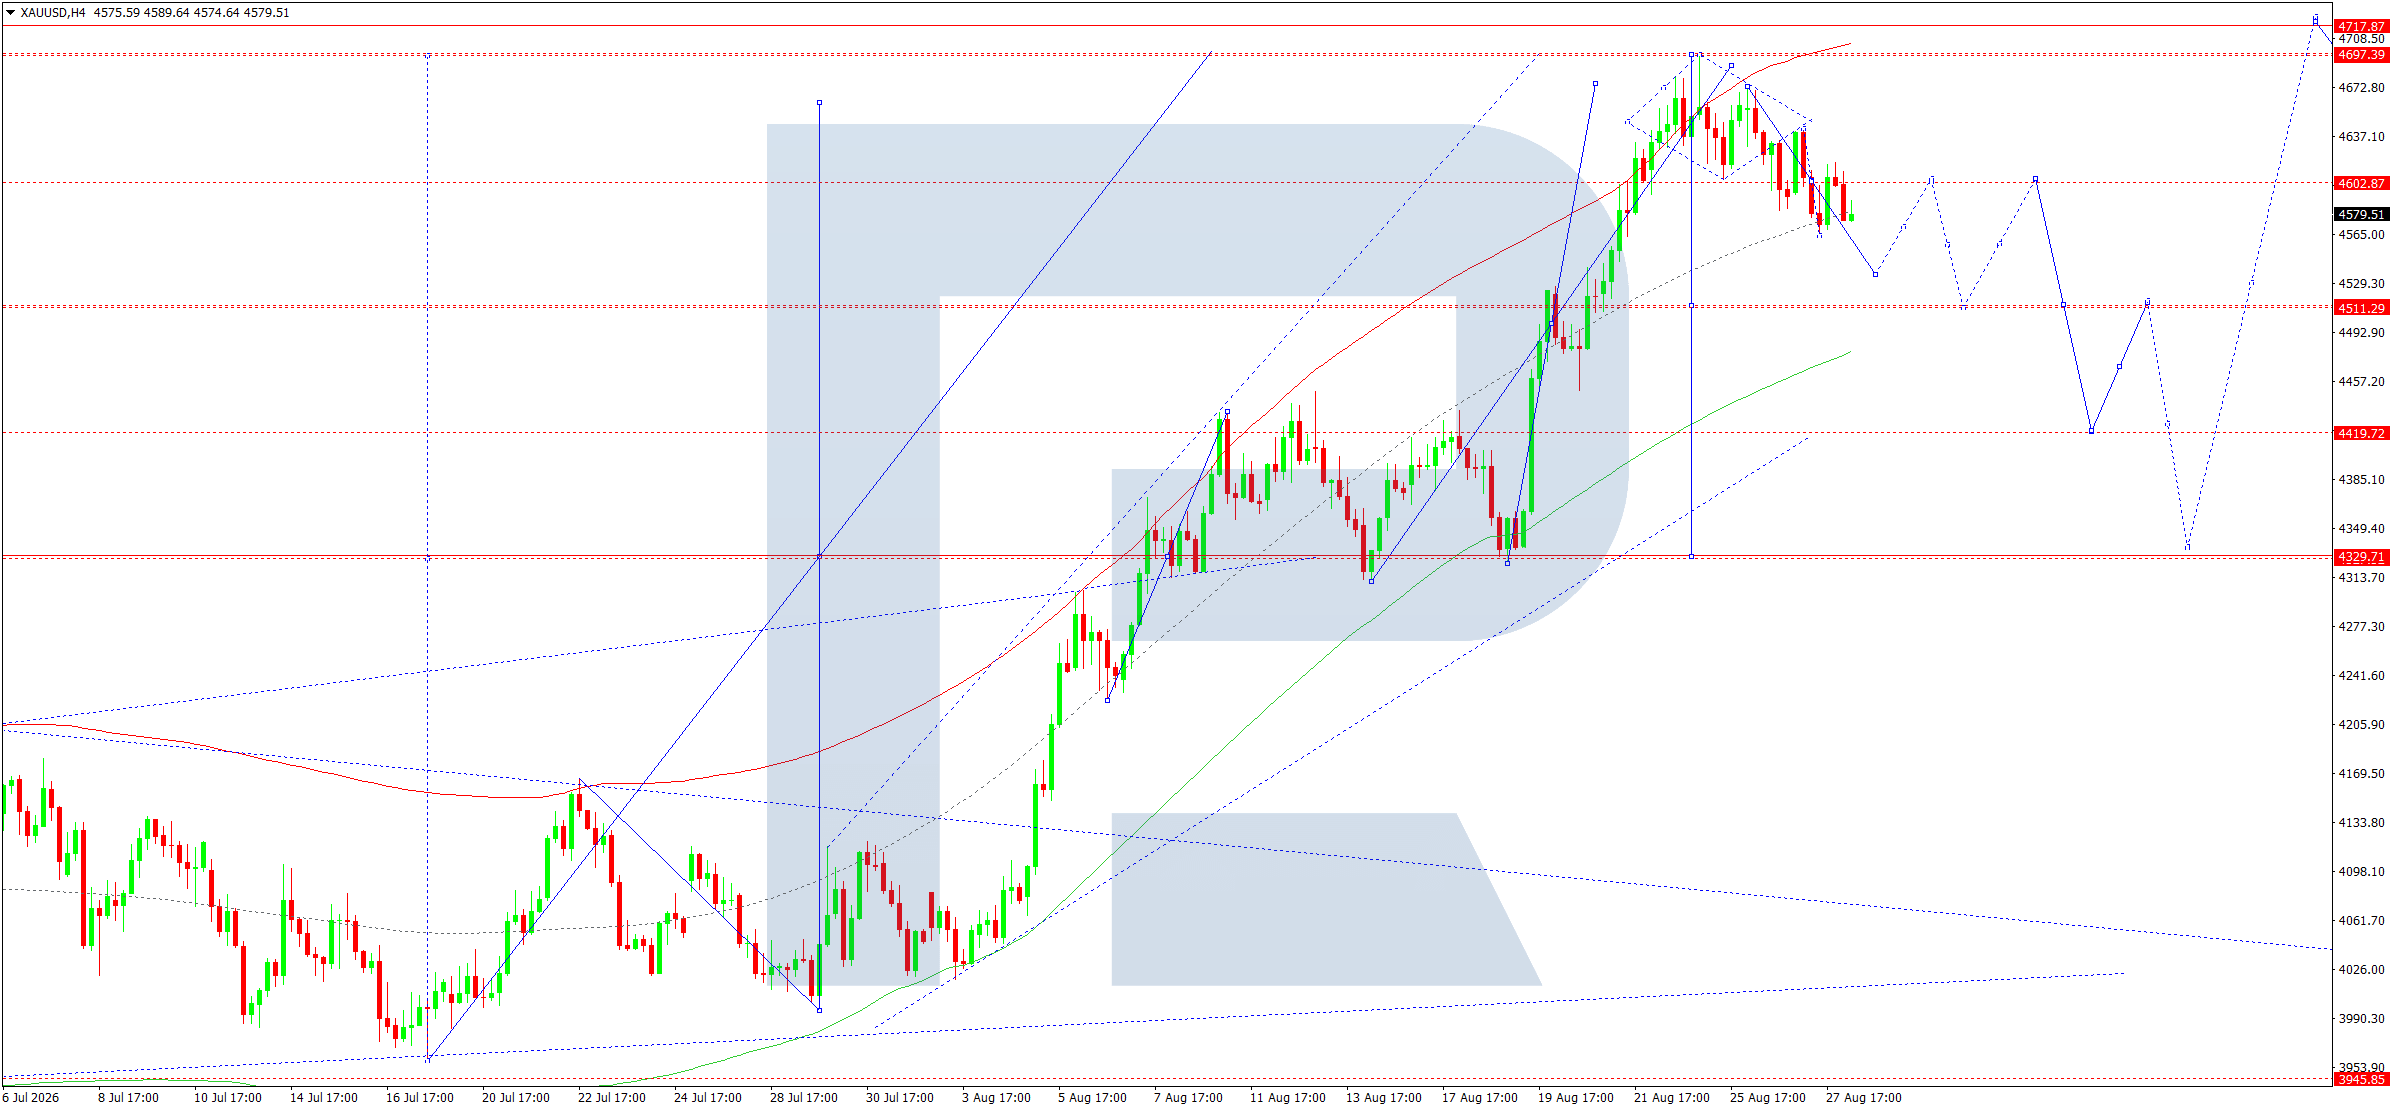
On the H4 chart, after a strong upward move, XAUUSD reached the 4,697–4,717 area and began a corrective wave. The current price is around 4,580, while the structure of the latest candlesticks indicates a gradual decline from the local high.
The first significant support area is 4,565, which corresponds to the central line of the Price Envelope. As long as prices remain directly around this area, the market may form a short-term consolidation range. A breakout below 4,565 would signal a continued correction towards 4,511.
The 4,511 level is the first significant target of the downward wave. After it is tested, a technical rebound towards 4,600 is possible. If the recovery proves weak and sellers regain control, the next target will be the 4,330 area.
At the same time, the long-term upward structure remains intact as long as prices hold well above 4,330. Therefore, the current sell trade should be viewed specifically as a corrective trade within a broader upward trend.
A return above 4,602 would be the first signal of weakening selling pressure. Consolidation above 4,697 would completely change the short-term picture and bring the 4,717 area back into focus.
The most likely scenario for 28 August remains a continued correction, with an initial target at 4,511.
Trading scenario: SELL
- Price at the time of writing: 4,580
- Entry price: 4,575
- Stop loss: 4,610
- Take profit: 4,511
- Risk-to-reward ratio: 1:2
US 500 forecast
The US stock market is supported by strong corporate results, particularly in the technology sector. Nvidia’s latest results have once again strengthened interest in shares of companies linked to artificial intelligence and helped the S&P 500 end the previous session higher. However, the market remains sensitive to Fed policy. An acceleration in PCE inflation to 3.7% creates a risk of tighter monetary policy, so Warsh’s speech today could trigger a significant increase in volatility. At the same time, lower oil prices reduce inflation risks and provide partial support to equities.
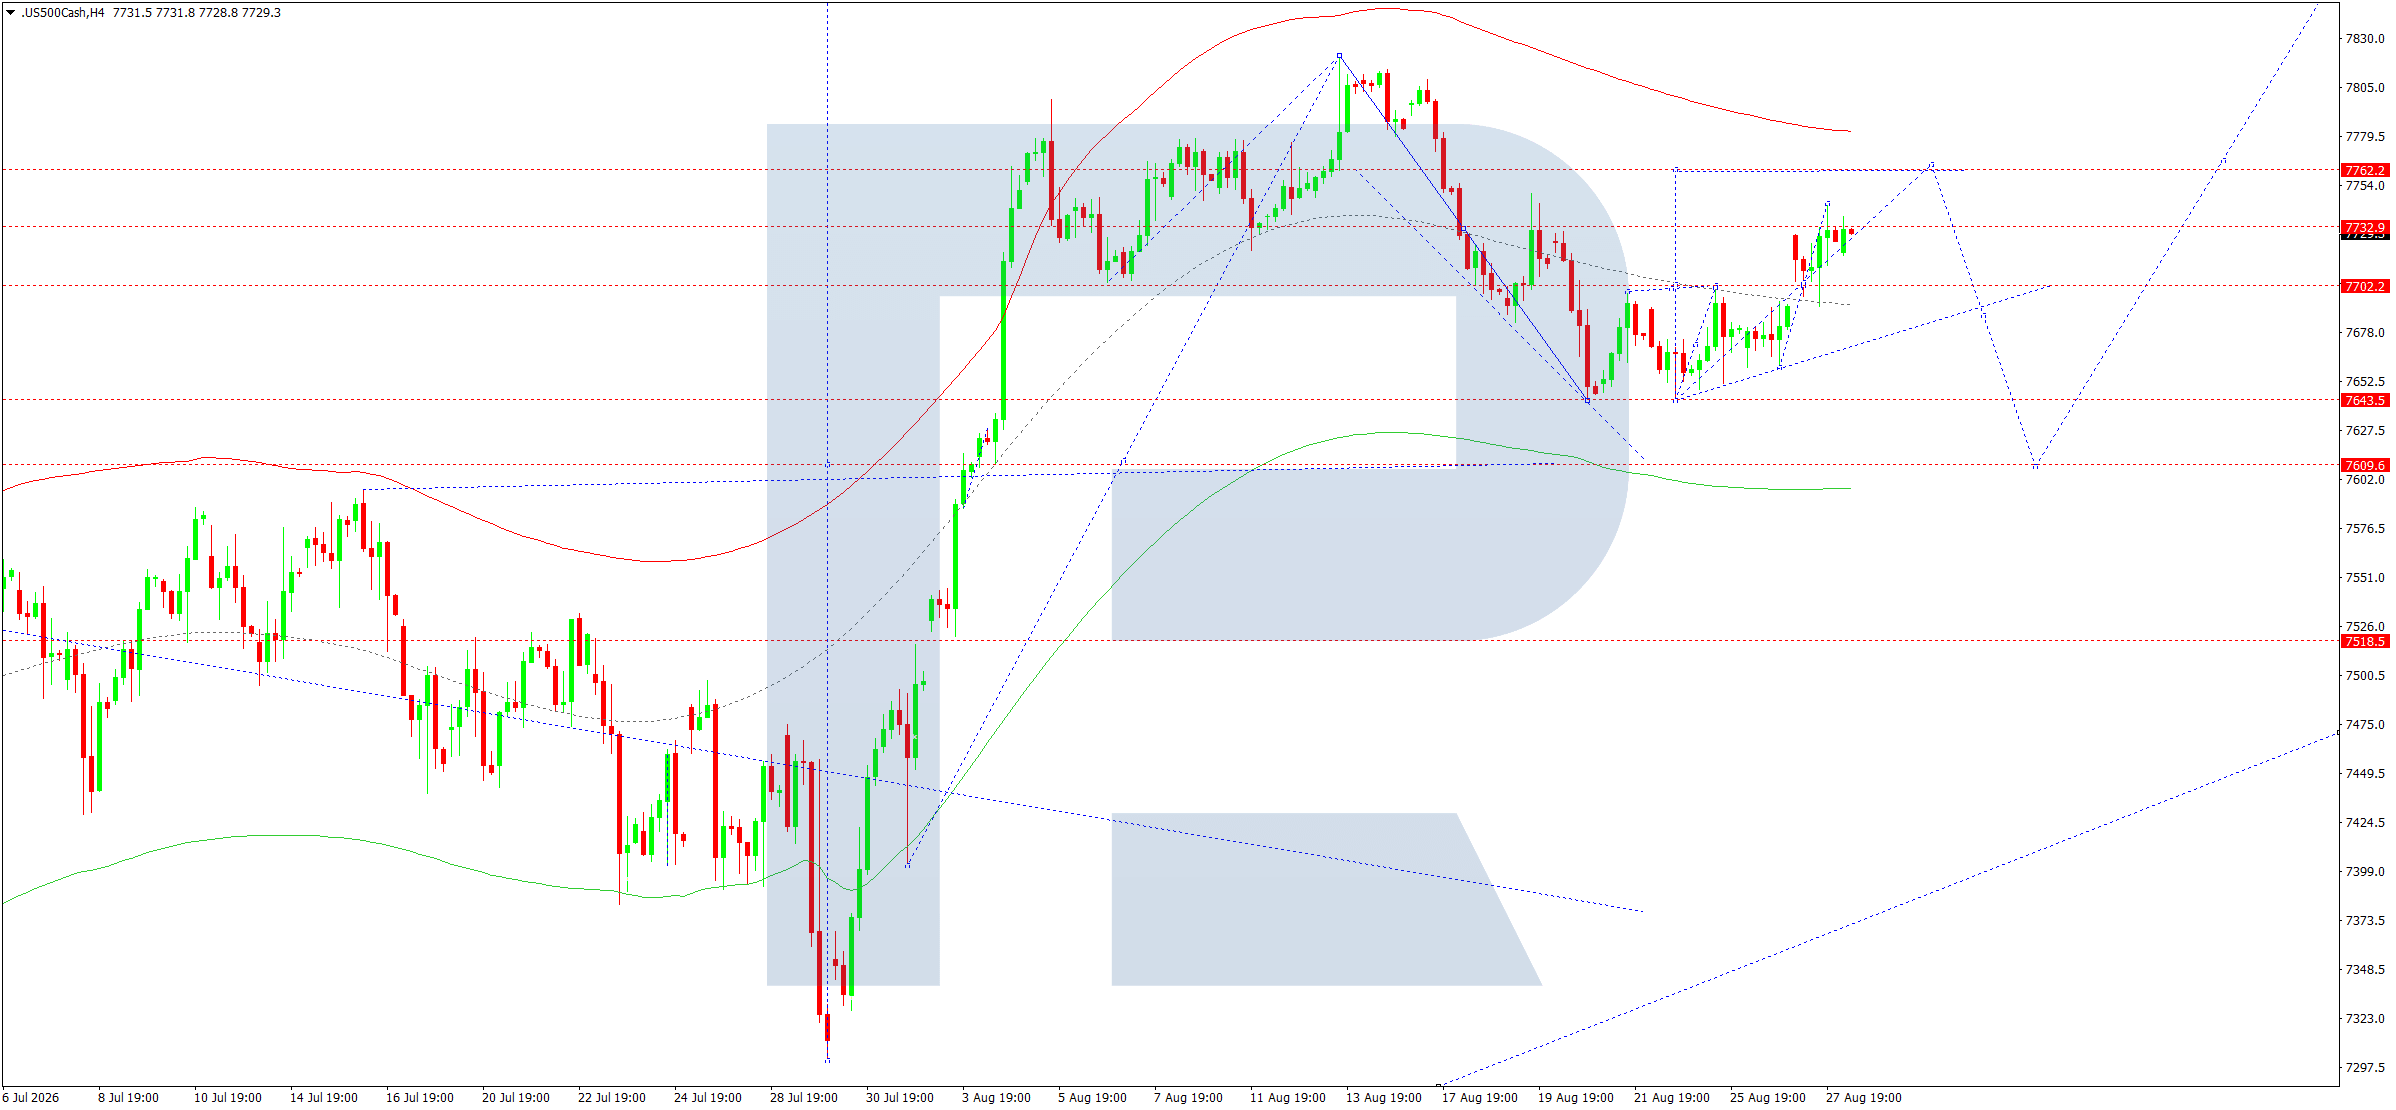
On the H4 chart, after correcting towards 7,645, the US 500 formed a steady upward wave. The market recovered consistently above 7,700 and reached the 7,733–7,744 area. The latest candlesticks show continued buying pressure, although the price has already approached important resistance.
The key 7,700 level now acts as central support. As long as the price remains above it, the recovery structure stays intact. The first resistance is at 7,733, followed by 7,762. A breakout above 7,762 could open the way towards 7,800 and then 7,830.
If an attempt to break above 7,762 fails, the market may return towards 7,700. If this support is broken, the correction could extend towards 7,645. Therefore, 7,700 becomes the main reference level for determining the short-term direction.
At this stage, the H4 structure remains bullish, and the recovery after the decline looks consistent. Therefore, as long as the price remains above 7,700, preference is given to buying.
The main scenario for 28 August is a continuation of the move towards 7,762, followed by a test of 7,800–7,830. At the same time, the elevated risk of a sharp move during the Fed Chair’s speech should be taken into account.
Trading scenario: BUY
- Price at the time of writing: 7,729
- Entry price: 7,734
- Stop loss: 7,690
- Take profit: 7,830
- Risk-to-reward ratio: 1:2
BTCUSD forecast
BTCUSD maintains a strong medium-term structure amid sustained inflows into US spot ETFs. Over eight consecutive sessions, ETF inflows totalled around 2.8 billion USD, providing fundamental support for Bitcoin. At the same time, the market is being influenced by an opposing factor — elevated US inflation and rising expectations of a Fed rate hike. Therefore, Bitcoin can maintain strong demand, but after a sharp weekly rise, the likelihood of profit-taking is increasing.
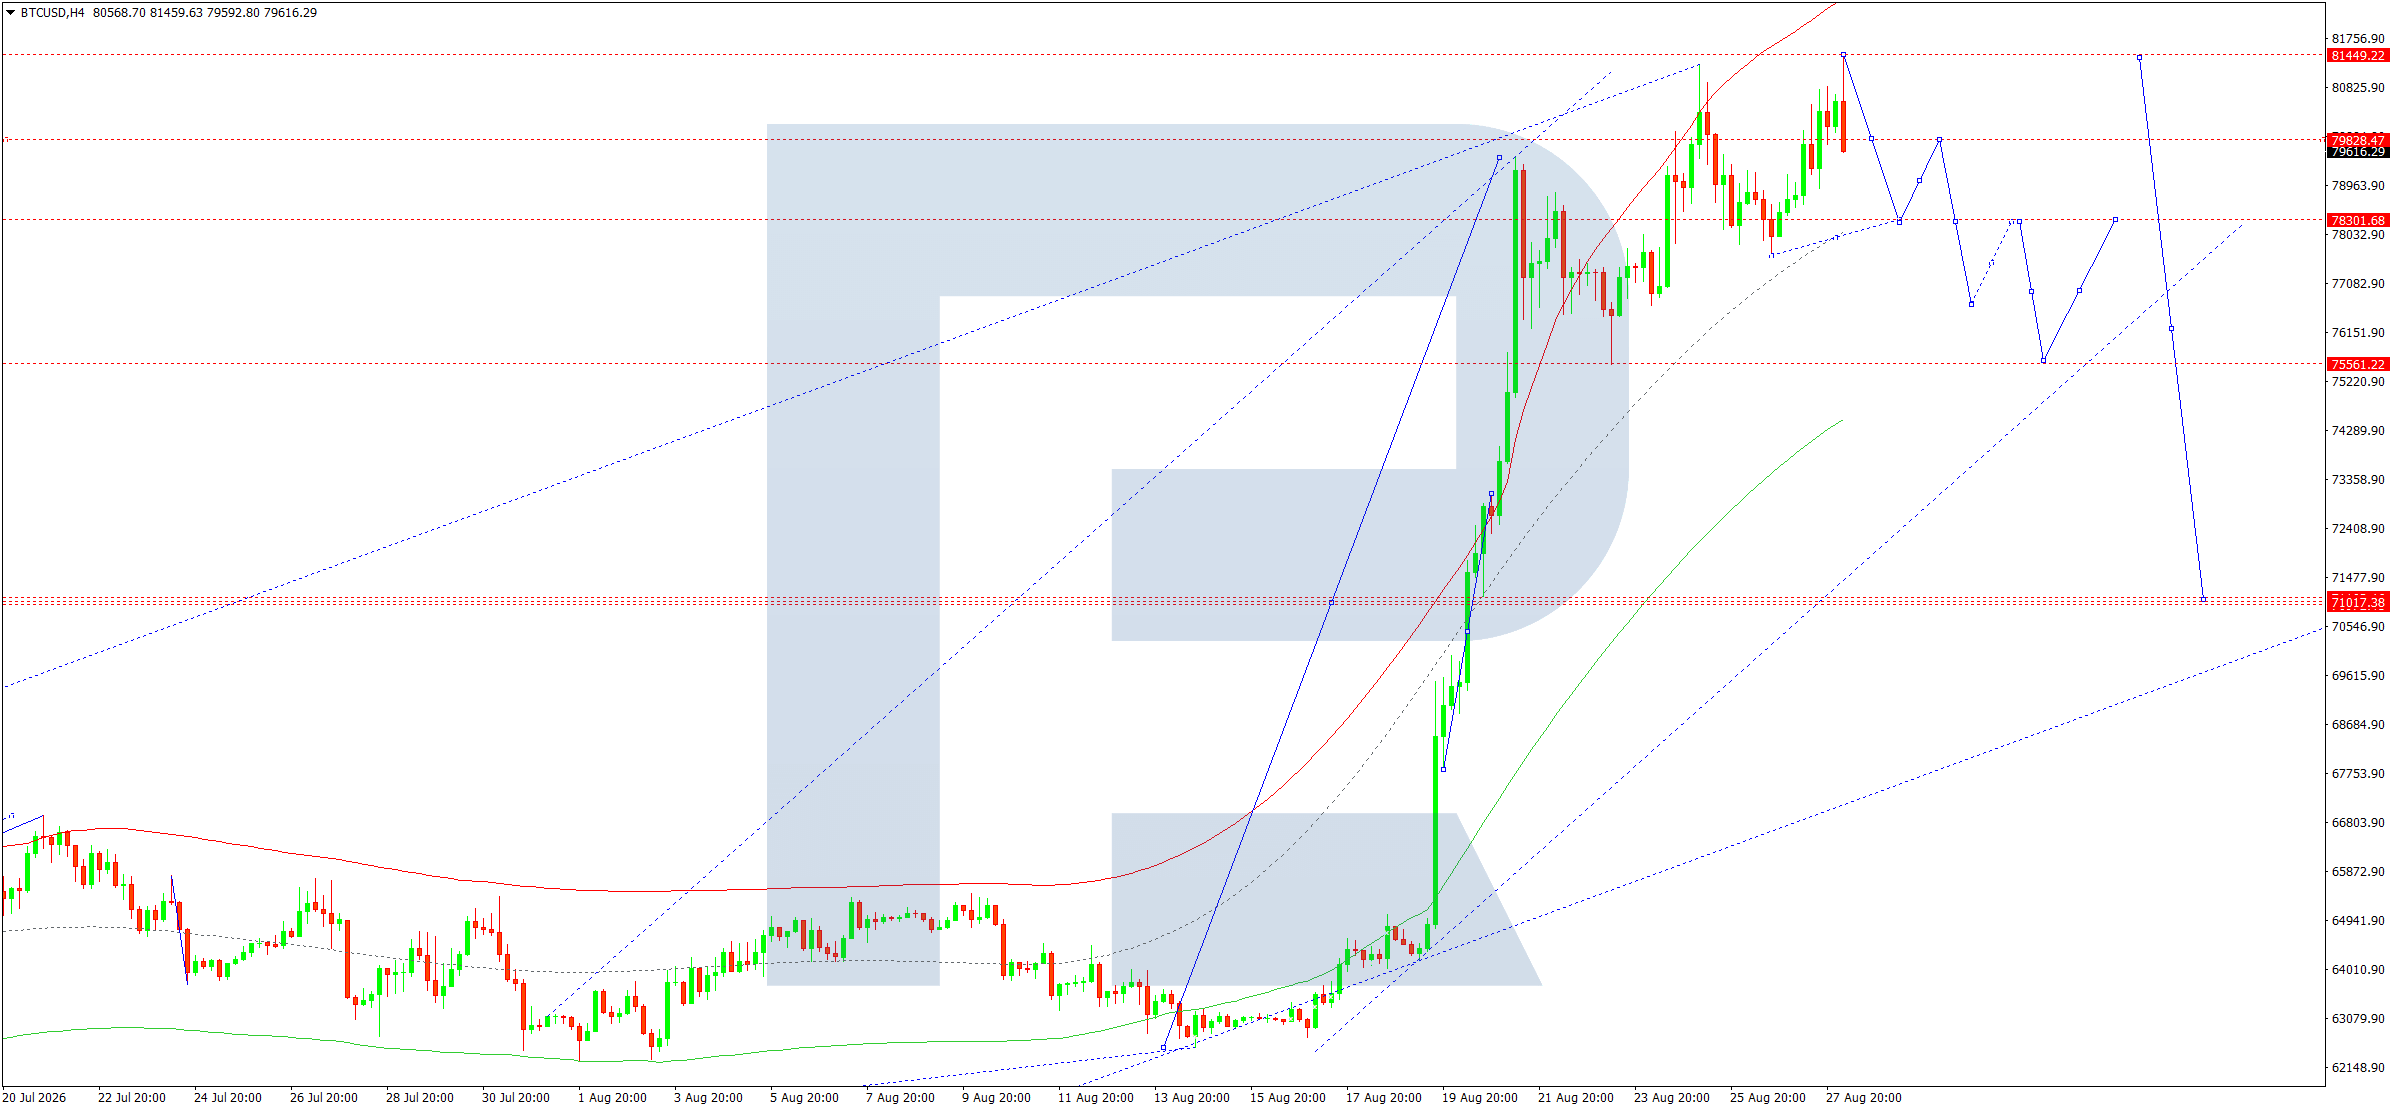
On the H4 chart, BTCUSD maintains a pronounced upward trend. After a strong impulse, the market reached 81,449 and then formed a consolidation range below this area. The current price around 79,600 is directly below the 79,828 resistance level.
Despite the intact upward structure, the move towards 81,449 was accompanied by signs of weakening momentum. Therefore, the most likely short-term scenario is a correction. The central line of the current Price Envelope is around 78,300.
A breakout below 78,300 would signal a deeper corrective wave. In this case, the first major target would be 75,561. If selling pressure persists, the decline could continue towards 71,017–70,870, where an important medium-term support area is located.
At the same time, holding above 78,300 could lead to a recovery towards 79,800. Consolidation above 79,828 would reopen the way towards 81,449. A breakout above the latter level would indicate a resumption of the main upward wave, with the potential to form new highs.
Therefore, the current sell trade is viewed solely as a short-term correction within the prevailing upward trend. The main scenario for the coming day is a decline from the 79,800–81,449 area towards 78,300, followed by an assessment of buyers’ reaction.
Trading scenario: SELL
- Price at the time of writing: 79,616
- Entry price: 79,611
- Stop loss: 80,100
- Take profit: 75,561
- Risk-to-reward ratio: 1:8
Editors’ picks
 EURUSD forecast 2026–2027: technical analysis, price levels & predictions
EURUSD has recovered from the July lows and is trading near 1.1545 — back in bullish territory. The pair has reclaimed EMA65 on the daily, formed a bullish EMA crossover on H4, and the US-eurozone GDP gap has narrowed sharply (US 1.5% vs eurozone 1.0%). Goldman Sachs and Deutsche Bank both now target 1.2500 by year-end. A confirmed close above 1.1700 opens the path to 1.1805. We break down the key levels, three trading scenarios, and what the unprecedented 9-3 FOMC dissent vote means for EURUSD.
 Gold (XAUUSD) forecast 2026: technical analysis, price levels & predictions
Gold has reversed its downtrend and is trading near 4,360 USD, back above both EMA65 and EMA200. ETF flows turned positive in July with 3 billion USD of net inflows, and central banks bought 288.9 tonnes in Q2 — up 62% year-on-year. A breakout above 4,500 USD opens the path to 4,855 USD and the 5,597 USD all-time high. We break down the key levels, three trading scenarios with entry triggers, and what J.P. Morgan, Deutsche Bank and Goldman Sachs are forecasting for gold in 2026.
Forecasts presented in this section only reflect the author’s private opinion and should not be considered as guidance for trading. RoboForex bears no responsibility for trading results based on trading recommendations described in these analytical reviews.