
Daily technical analysis and forecast for 4 September 2026
Daily technical analysis and forecast for EURUSD, USDJPY, GBPUSD, AUDUSD, USDCAD, XAUUSD, US 500, and BTCUSD for 4 September 2026.
Each scenario on this page reflects the market structure on the H4 chart as of 10:00 UTC+3 on 4 September 2026 and remains valid throughout the current trading day. It closes when the price reaches either the take-profit or stop-loss level, or at the end of the trading day if neither level has been reached. The assessment considers the current H4 chart structure, key support and resistance levels, the direction of the medium-term movement, and the prevailing fundamental backdrop.
EURUSD forecast
The euro is receiving local support from weaker demand for the US dollar ahead of the release of US labour market data. The Federal Reserve maintains a cautious approach, with the market assessing incoming data based on its impact on the future interest rate path. A weak employment report could fuel expectations of a more accommodative Fed policy and support EURUSD, while strong figures would restore demand for the US dollar and limit the pair’s advance.
For the euro, German factory orders and eurozone retail sales data are crucial. The European Central Bank approaches its upcoming meeting amid more resilient activity, but with ongoing risks from energy prices and geopolitics. This reduces the likelihood of a one-sided move in the euro and increases the importance of the technical boundaries of the range.
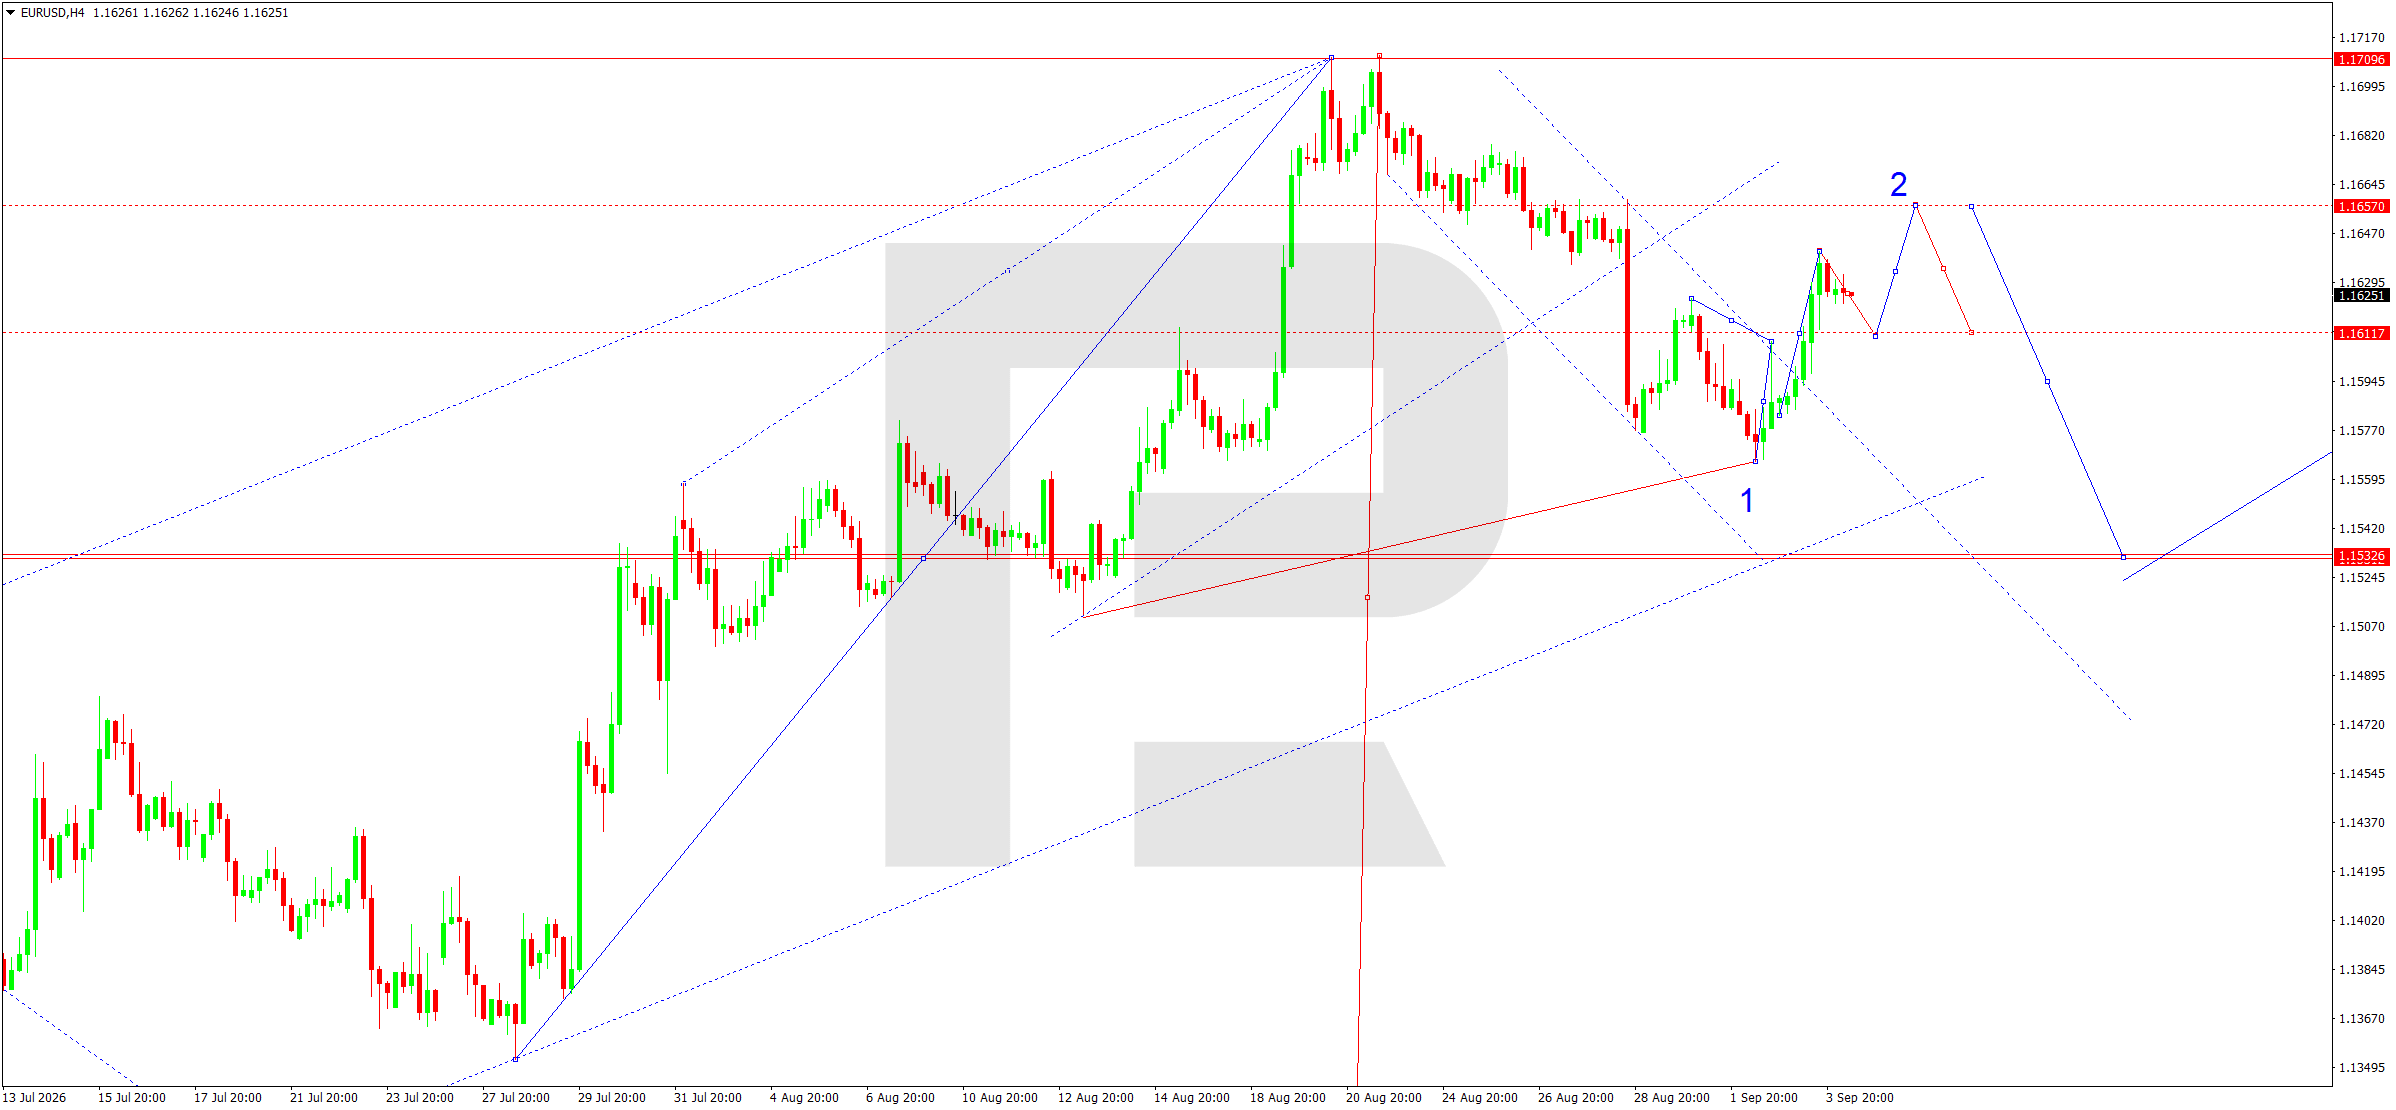
On the H4 chart, the market completed a decline towards the 1.1555–1.1560 area and formed a strong rebound towards 1.1625. The upward momentum is currently developing within a corrective structure after the decline from 1.1709. The nearest resistance level is located at 1.1657; a test of this mark is the base scenario as long as the price remains above 1.1611. However, the 1.1657 area coincides with the upper boundary of the local correction and may trigger a new wave of selling.
The main scenario for the day is to sell after the price consolidates below 1.1620. In this case, the target will be a return towards 1.1533. The scenario would be invalidated by a confident H4 consolidation above 1.1657, which would increase the probability of further growth towards 1.1709.
Trading scenario: SELL
- Price at the time of writing: 1.1625
- Entry price: 1.1620
- Stop loss: 1.1664
- Take profit: 1.1533
- Risk-to-reward ratio: 1:1.98
USDJPY forecast
For USDJPY, the key factor remains the yield differential between US and Japanese bonds. Lower US yields reduce support for the US dollar, although a sharp market reaction to employment data could change the picture during the day. Weak US data would increase pressure on USDJPY, while strong figures would support an attempt by the pair to recover.
The Bank of Japan remains a significant source of risk for the yen, as the market is sensitive to any signals of monetary policy normalisation. Morning data on Japanese household spending and the general trend in demand for safe-haven assets may also support the yen. At the same time, stabilising global risk appetite limits its appreciation.
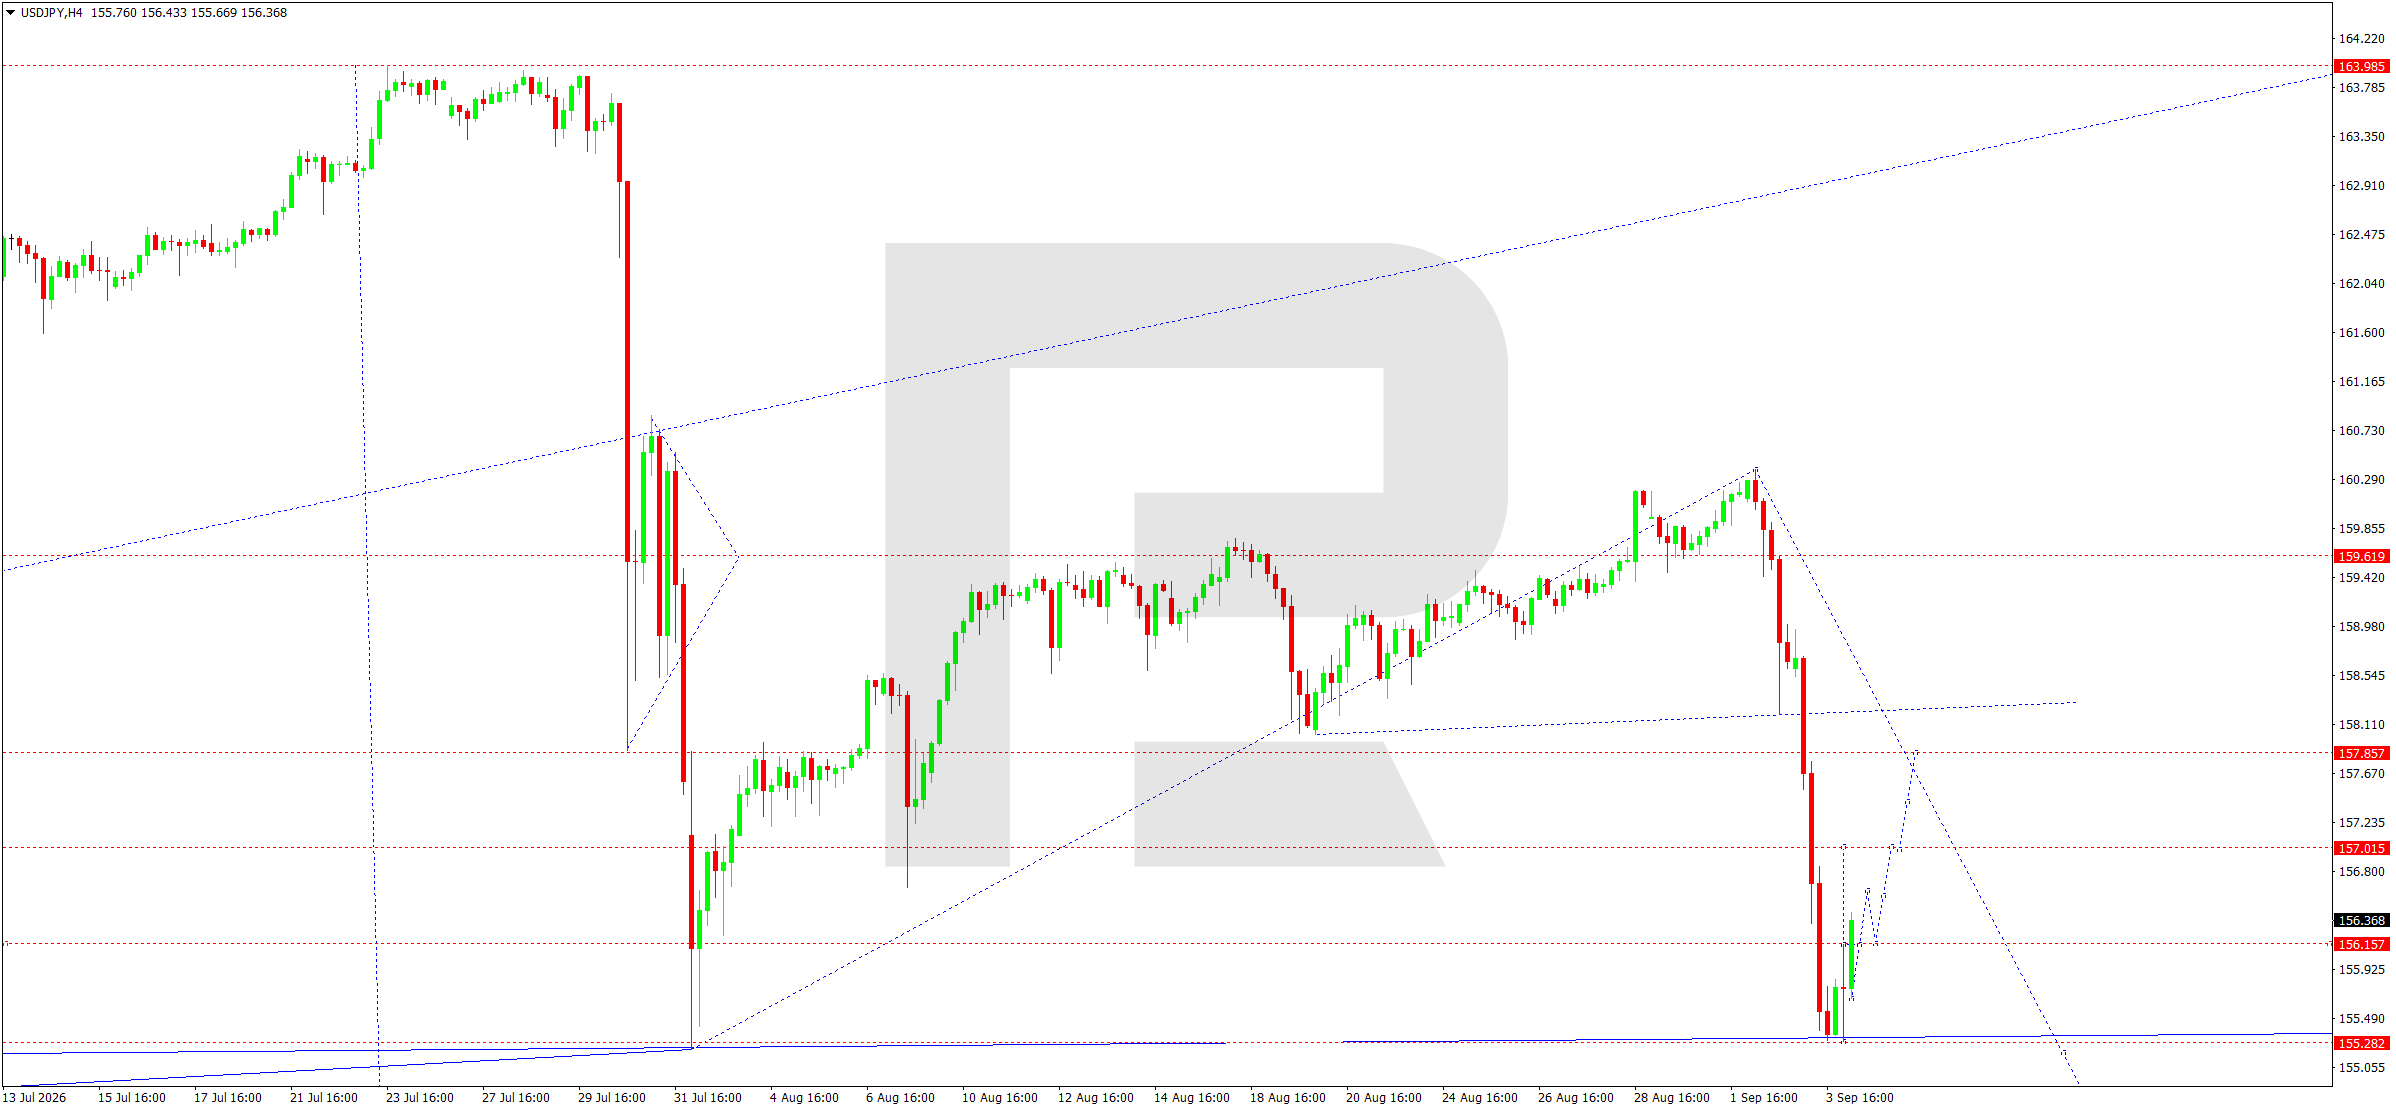
On the H4 chart, a strong downward wave from 160.30 towards 155.28 has been completed. Buyers held the 155.28–155.50 area, after which a recovery impulse formed towards 156.37. The price consolidated above 156.15, preserving the potential for a move towards 157.02. This area is the nearest resistance and also the upper boundary of the current corrective structure.
A buy setup is considered only if the price confirms a hold above 156.15. Consolidation above 156.42 would open the way towards 157.02. A breakout below 155.70 would invalidate the bullish scenario and return the market to a test of 155.28. Given the release of US data, the move may be sharp, so the stop-loss level should remain unchanged.
Trading scenario: BUY
- Price at the time of writing: 156.368
- Entry price: 156.418
- Stop loss: 156.090
- Take profit: 157.015
- Risk-to-reward ratio: 1:1.82
GBPUSD forecast
The pound sterling will react during the day to the UK construction PMI and a speech by the Bank of England governor. The market is focused on assessing the resilience of domestic demand, inflation, and the interest rate outlook. Weak business activity data or cautious BoE rhetoric could limit demand for the pound, while robust data would support a move in GBPUSD towards the nearest resistance level.
The US dollar remains sensitive to expectations ahead of the US employment report. Oil prices and geopolitical uncertainty are supporting inflation risks, so a combination of weak macroeconomic data and calm Fed rhetoric is needed for a sustained weakening of the dollar.
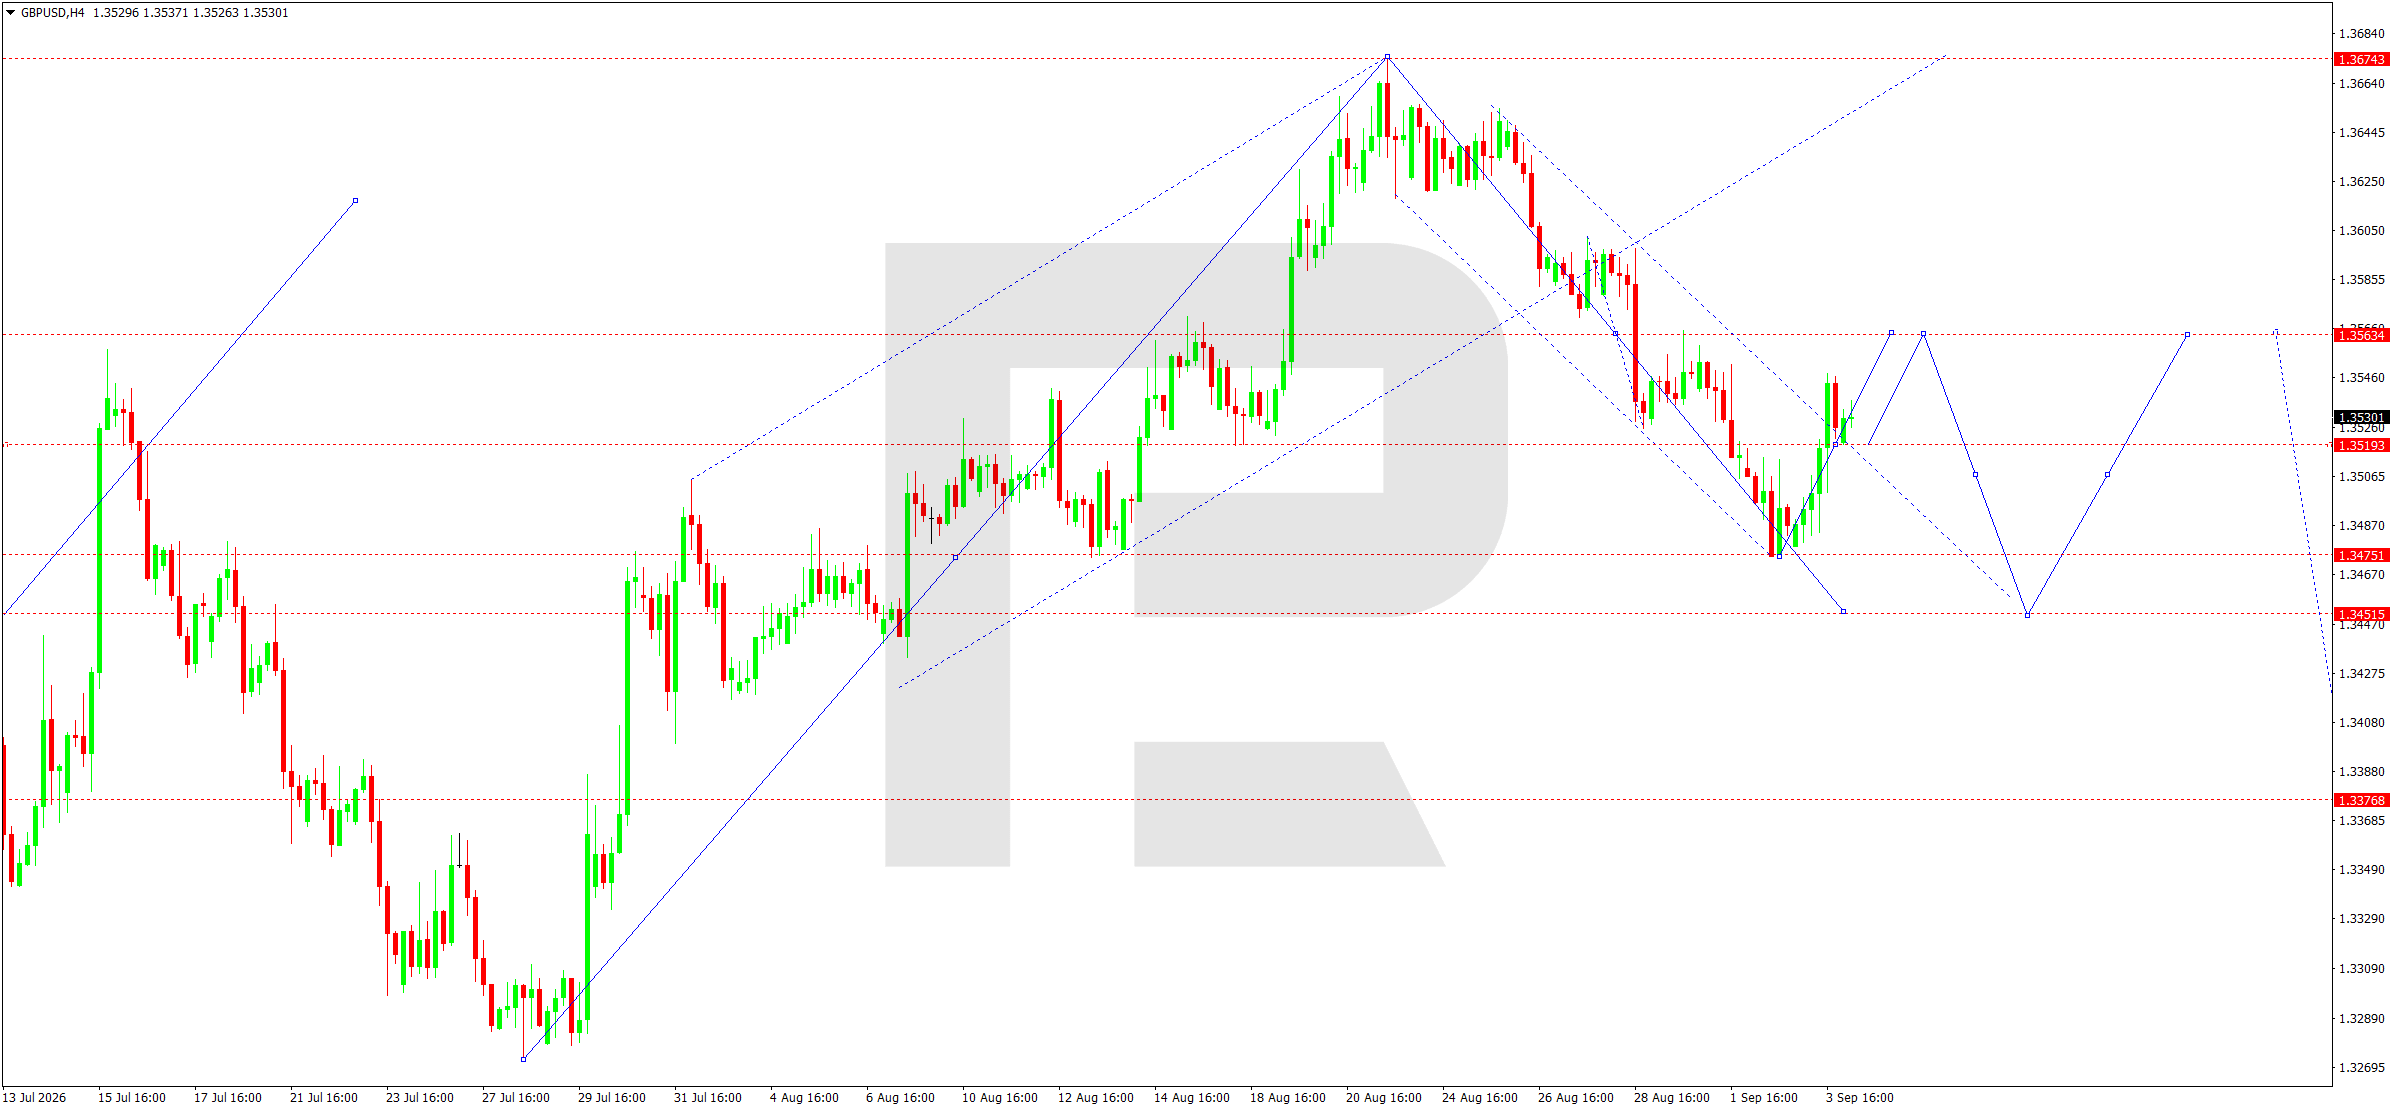
On the H4 chart, GBPUSD declined from 1.3674 towards 1.3475 and then rebounded to 1.3530. The 1.3519 area acts as short-term support, although the rise remains corrective. Resistance at 1.3564–1.3565 remains key: the upper boundary of the downward structure is located here, and active selling previously emerged in this area.
The baseline scenario suggests selling if the price consolidates below 1.3525, targeting 1.3452. If the pair briefly rises towards 1.3564, sellers may become active again. A close of the H4 candlestick above 1.3565 would invalidate the bearish pattern and open the way towards 1.3634. Until the price breaks out of the 1.3519–1.3564 range, elevated volatility without a sustainable direction is likely.
Trading scenario: SELL
- Price at the time of writing: 1.3530
- Entry price: 1.3525
- Stop loss: 1.3566
- Take profit: 1.3452
- Risk-to-reward ratio: 1:1.78
AUDUSD forecast
The Australian dollar is supported by improving global risk appetite and gains in the US technology sector. At the same time, its resilience depends on developments in China, prices for industrial metals, and the overall state of commodity demand. A slowdown in the Chinese economy remains a risk factor for the AUD.
The Reserve Bank of Australia will assess the balance between inflation risks and economic activity. For AUDUSD, the US dollar’s reaction to US data is also critical. Weak US figures could support further gains in the pair, while a strong employment report would create a risk of a return towards support levels.
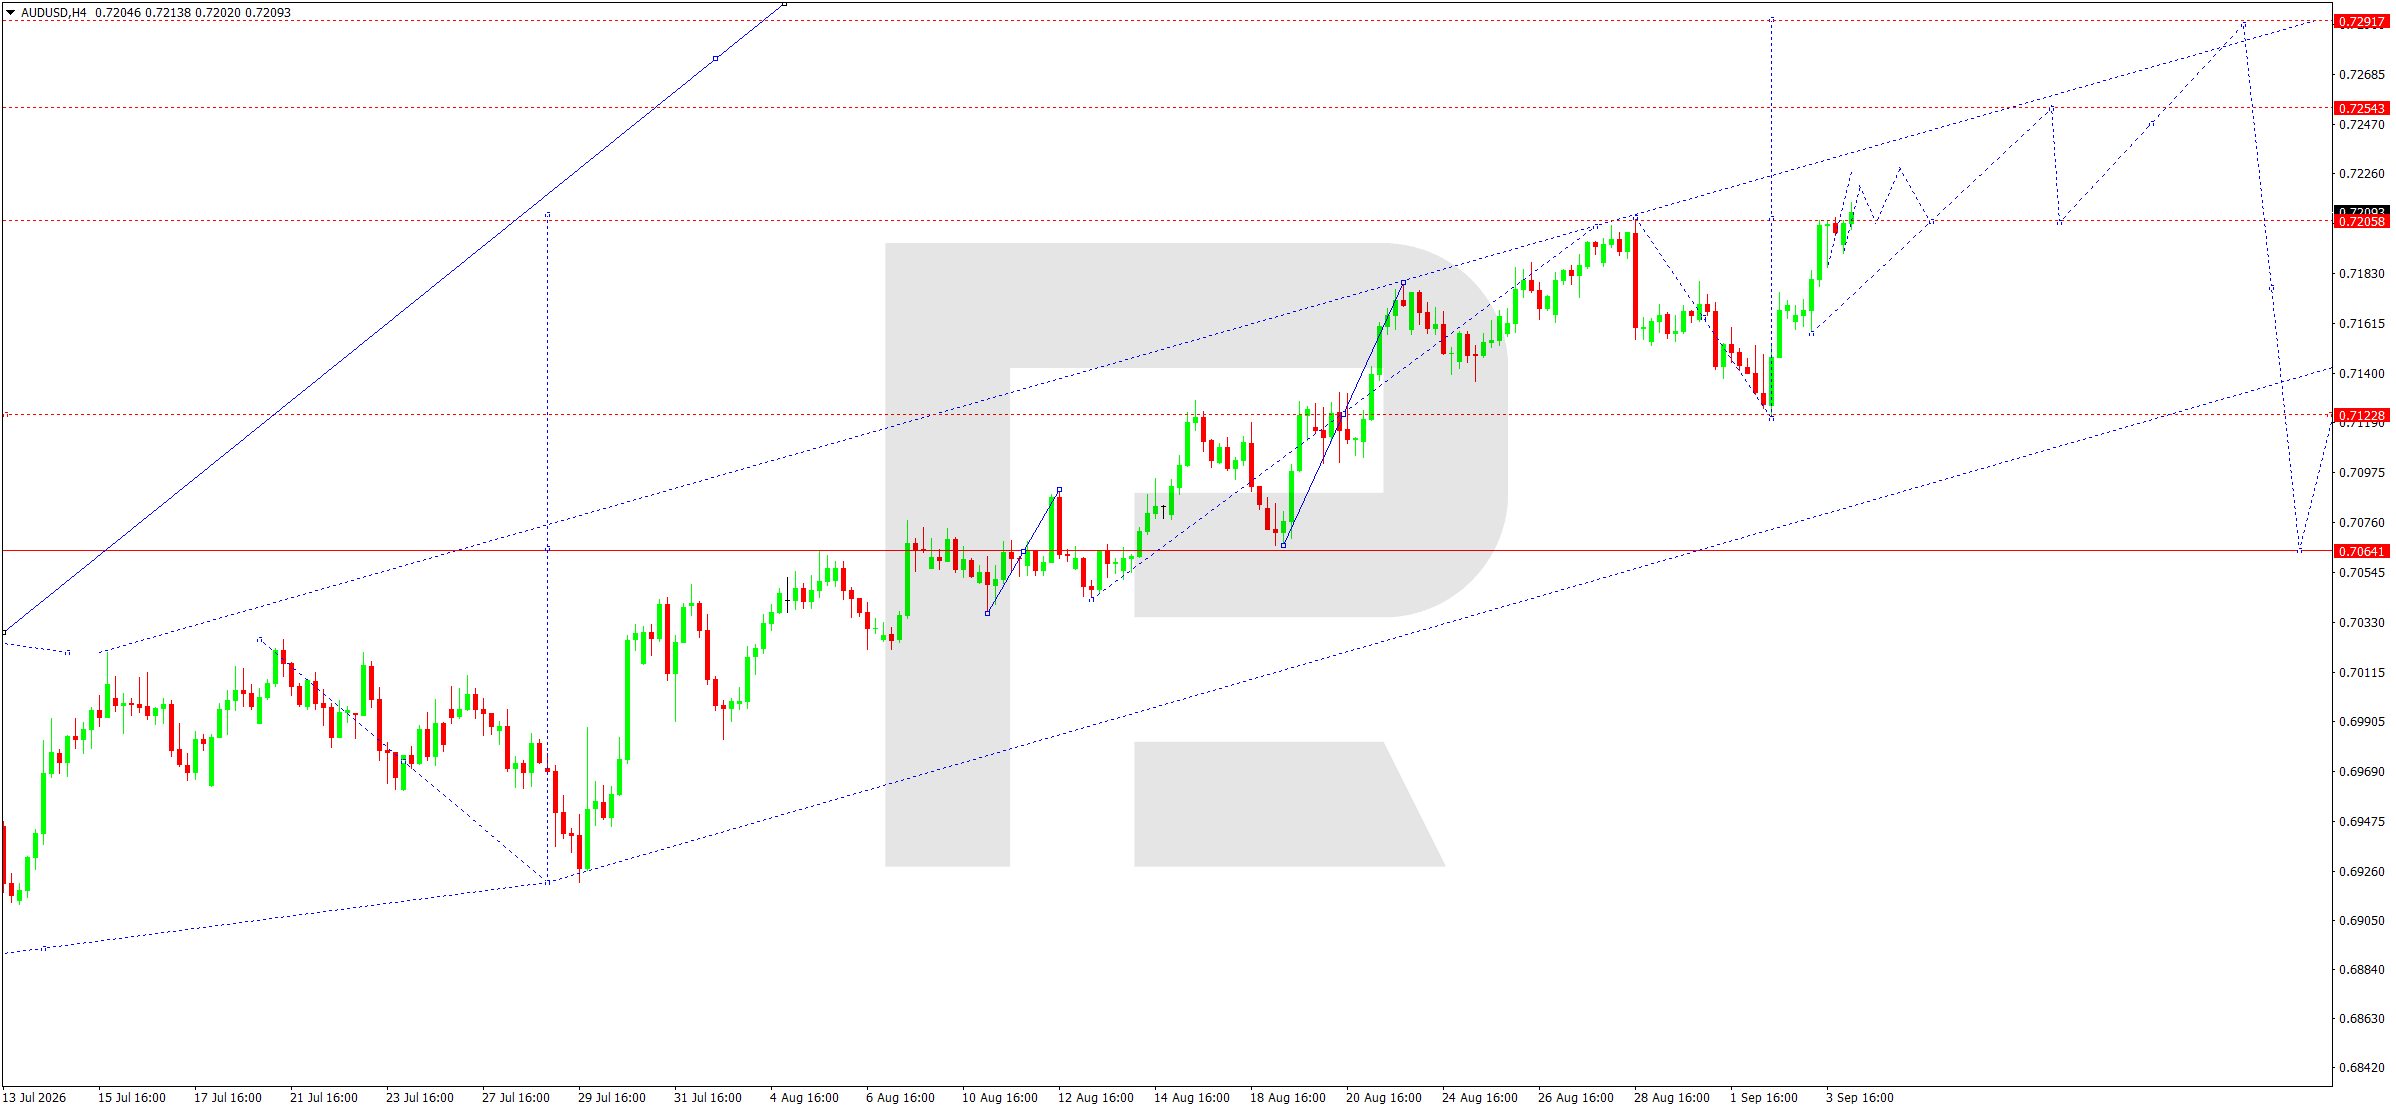
On the H4 chart, AUDUSD retains an upward structure with a sequence of higher lows. After a correction towards 0.7123, the market recovered and consolidated near 0.7209. A breakout above 0.7206 strengthened the bullish momentum. The nearest target is located at 0.7254, followed by resistance at 0.7292.
The 0.7195 level is the nearest technical support. As long as the price holds above it, the upside remains the priority. A move below 0.7195 would open the way towards 0.7170 and reduce the likelihood of reaching 0.7254 during the day. The buy setup requires confirmation that the price has consolidated above the current area rather than entering during a sharp news-driven candlestick.
Trading scenario: BUY
- Price at the time of writing: 0.7209
- Entry price: 0.7214
- Stop loss: 0.7195
- Take profit: 0.7254
- Risk-to-reward ratio: 1:2.11
USDCAD forecast
The Bank of Canada kept the policy rate unchanged at 2.25% on 2 September. The regulator noted the recovery in the Canadian economy, but also highlighted elevated uncertainty, inflation risks caused by high energy prices, and trade-related risks.
For USDCAD, the simultaneous release of employment data from Canada and the US is particularly significant. A strong Canadian labour market would support the CAD, while weak data could trigger a sharp recovery in the pair. High oil prices are generally positive for the Canadian dollar, although they also support global inflation expectations and the US dollar.
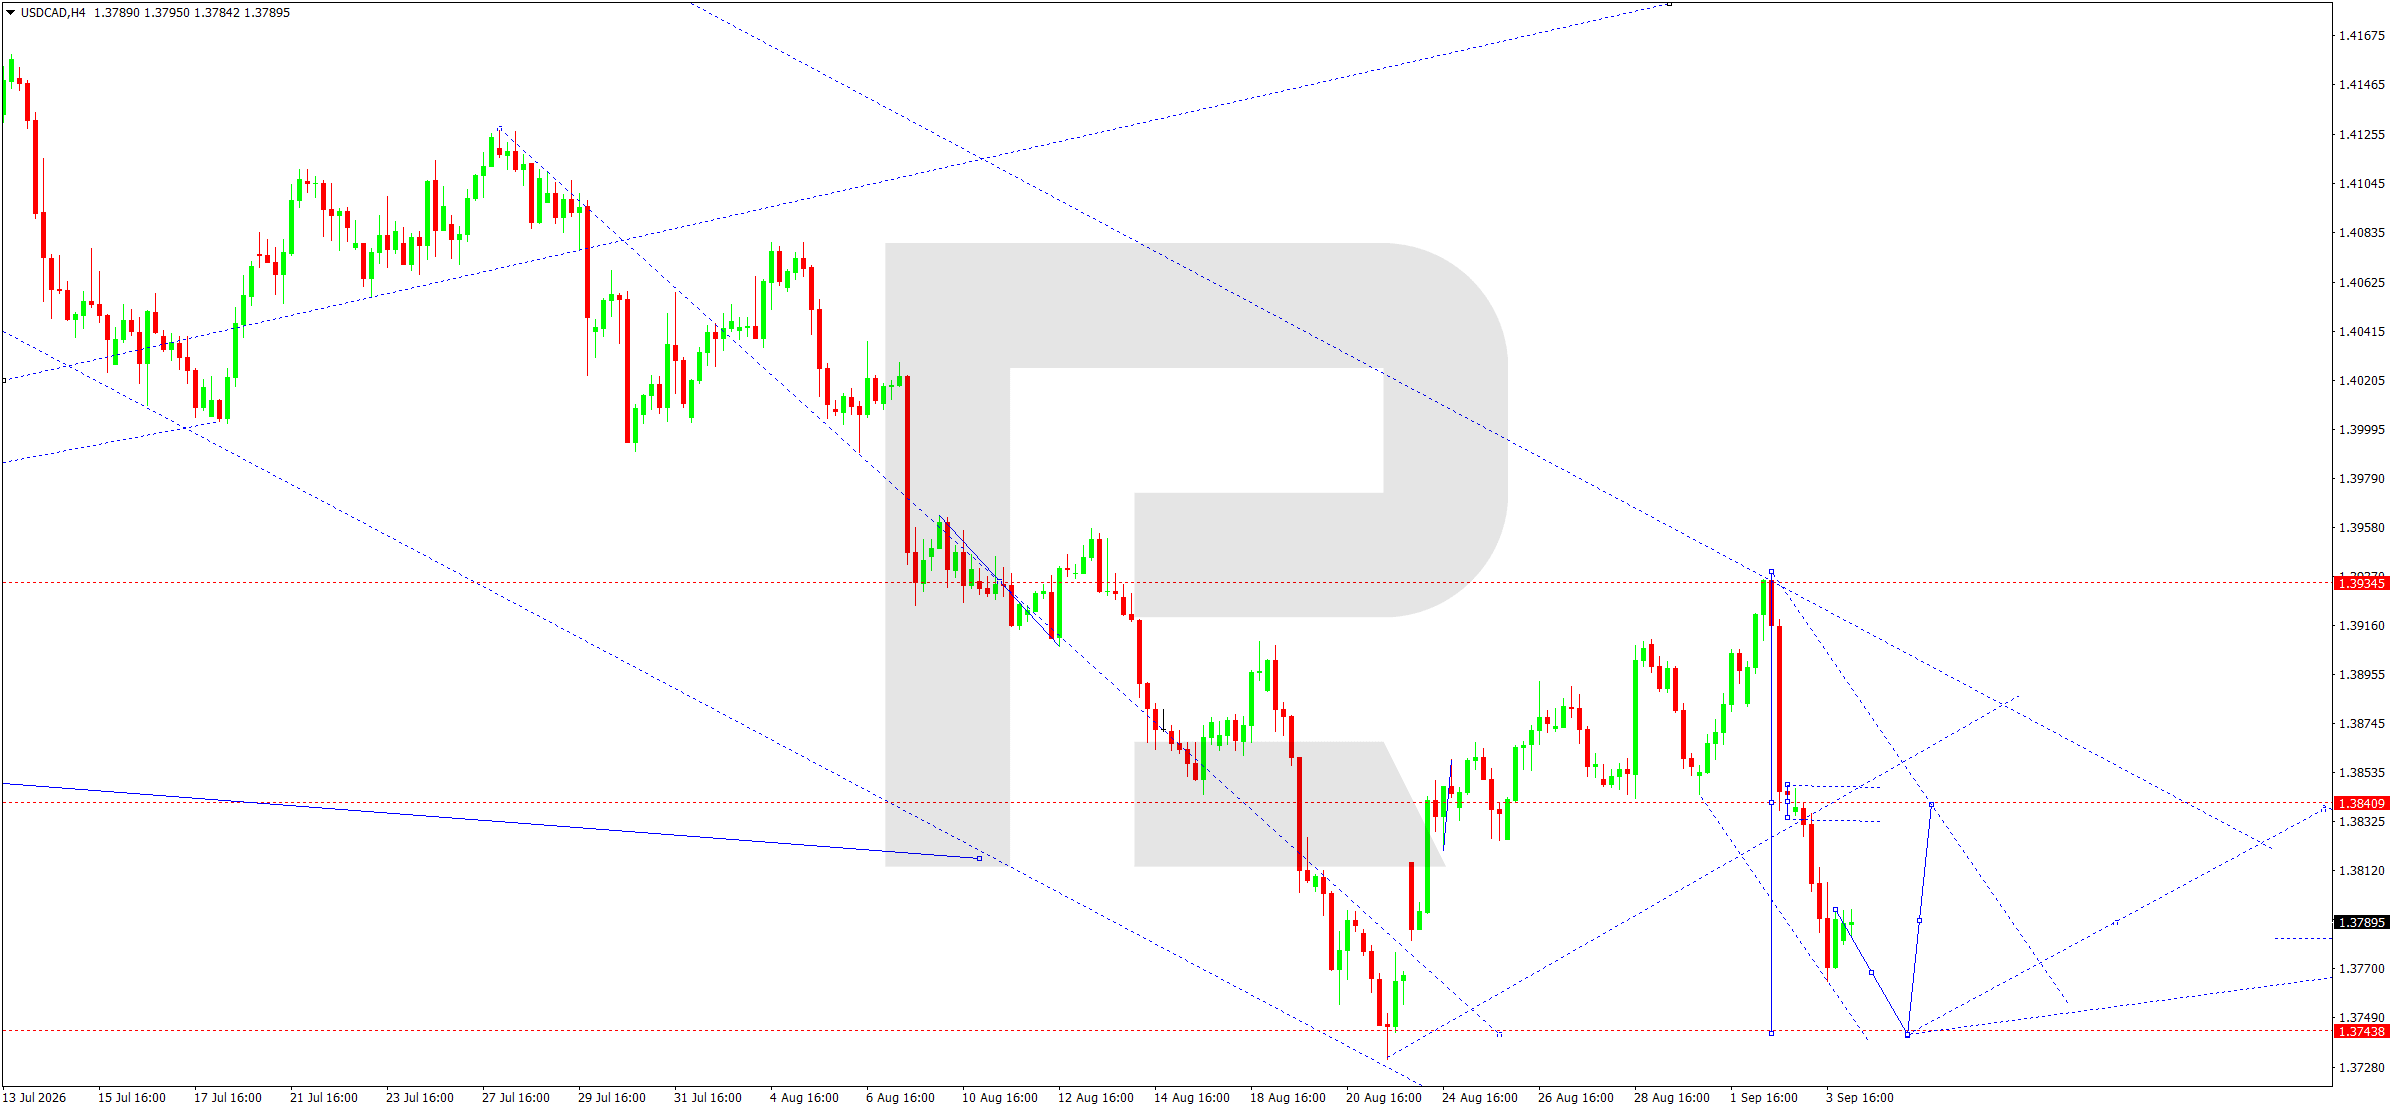
On the H4 chart, USDCAD retains the downward structure from 1.4125. After an unsuccessful attempt to consolidate above 1.3934, the market fell sharply towards 1.3744 and recovered only to 1.3790. The 1.3841 level is the key resistance: a return above it is required to invalidate the current bearish pattern.
As long as the price remains below 1.3841, a retest of the 1.3744 mark remains the priority. An intermediate resistance level is located near 1.3813. A sell setup from 1.3785 suggests the market will not consolidate above this area. A close of the H4 candlestick above 1.3841 would invalidate the downside scenario and create conditions for a move towards 1.3934.
Trading scenario: SELL
- Price at the time of writing: 1.3790
- Entry price: 1.3785
- Stop loss: 1.3813
- Take profit: 1.3744
- Risk-to-reward ratio: 1:1.46
XAUUSD forecast
Gold continues to attract strong demand amid geopolitical tensions, high energy prices, and uncertainty over the future course of Fed policy. Lower US Treasury yields have supported interest in the metal. At the same time, the upcoming US labour market report could sharply alter the short-term balance: weak data would support gold, while strong figures could trigger profit-taking.
Inflation risks stemming from high oil prices limit the likelihood of rapid policy easing by major central banks. As a result, XAUUSD is being influenced by two opposing factors: demand for safe-haven assets and the risk of higher yields if US data comes in strong.
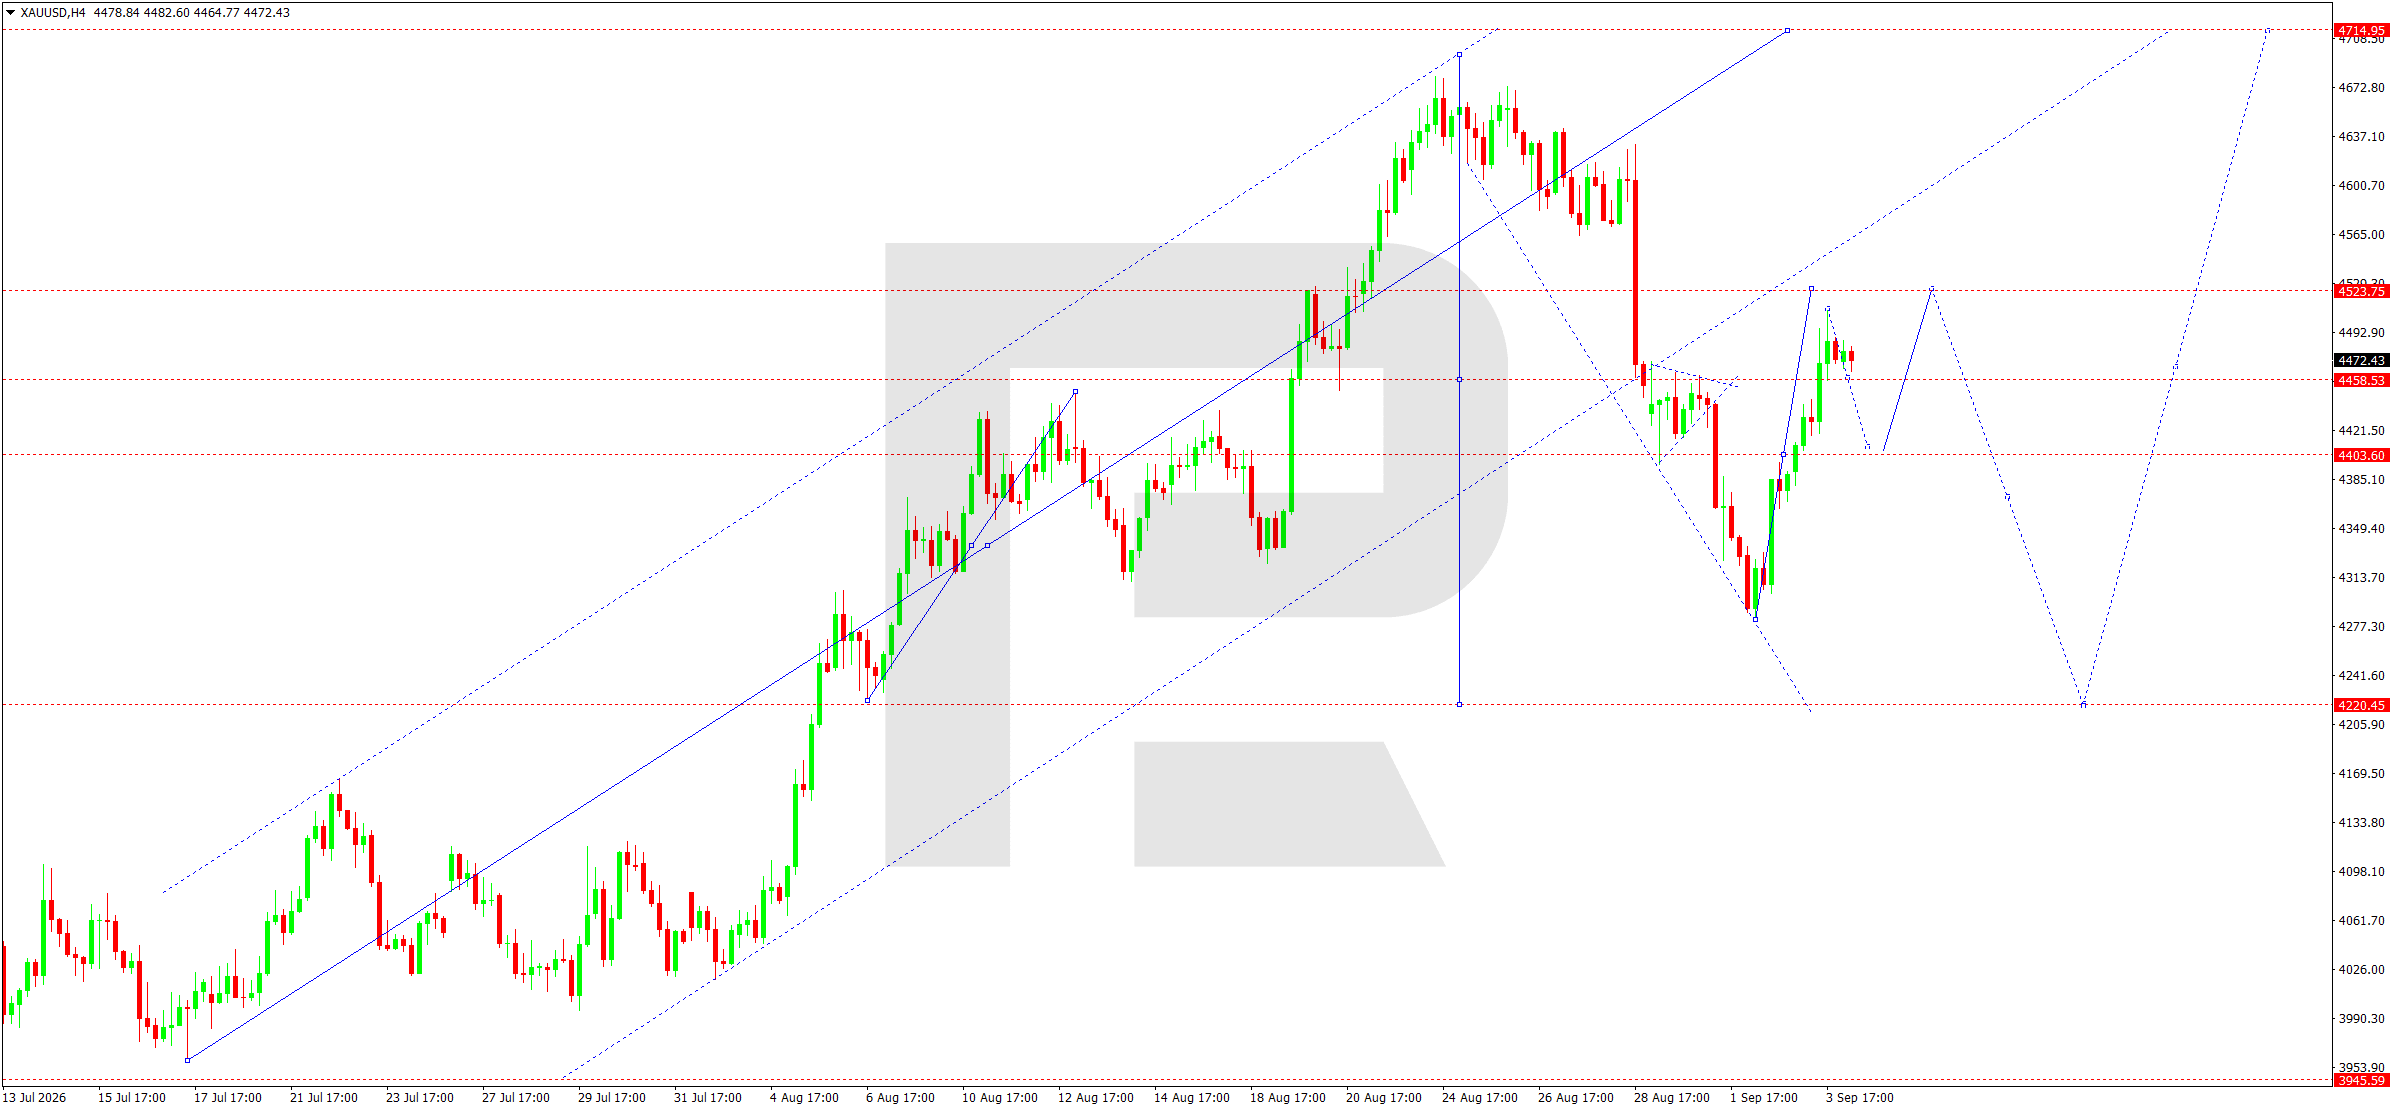
On the H4 chart, XAUUSD rebounded from 4,283 and formed momentum towards 4,500. Prices currently stand at 4,472, above 4,458, preserving the buyers’ short-term advantage. The nearest upside target is 4,523, where a significant resistance level and the central line of the current structure are located. Consolidation above 4,523 would allow the market to consider a move towards 4,715.
The 4,438–4,404 area acts as support. A decline below 4,438 would indicate that the impulse from 4,283 has been exhausted and would increase the likelihood of a correction towards 4,404. The buy setup remains relevant only while the price holds above 4,458. Due to the scheduled US data, the stop-loss level may be reached amid high volatility even if the medium-term bullish structure remains intact.
Trading scenario: BUY
- Price at the time of writing: 4,472
- Entry price: 4,477
- Stop loss: 4,438
- Take profit: 4,523
- Risk-to-reward ratio: 1:1.18
US 500 forecast
The US stock market received support from gains in the technology sector and easing pressure from bond yields. The S&P 500 rose by 1.1% in the previous session, with large technology companies acting as the main driver.
However, the sustainability of the advance will be tested by the US employment report. Weak data could support expectations of a more accommodative Fed stance and trigger a short-term rise in the index. Excessively weak data, however, could increase concerns about the economic cycle. A strong report would raise the risk of higher yields and put pressure on technology sector valuations.
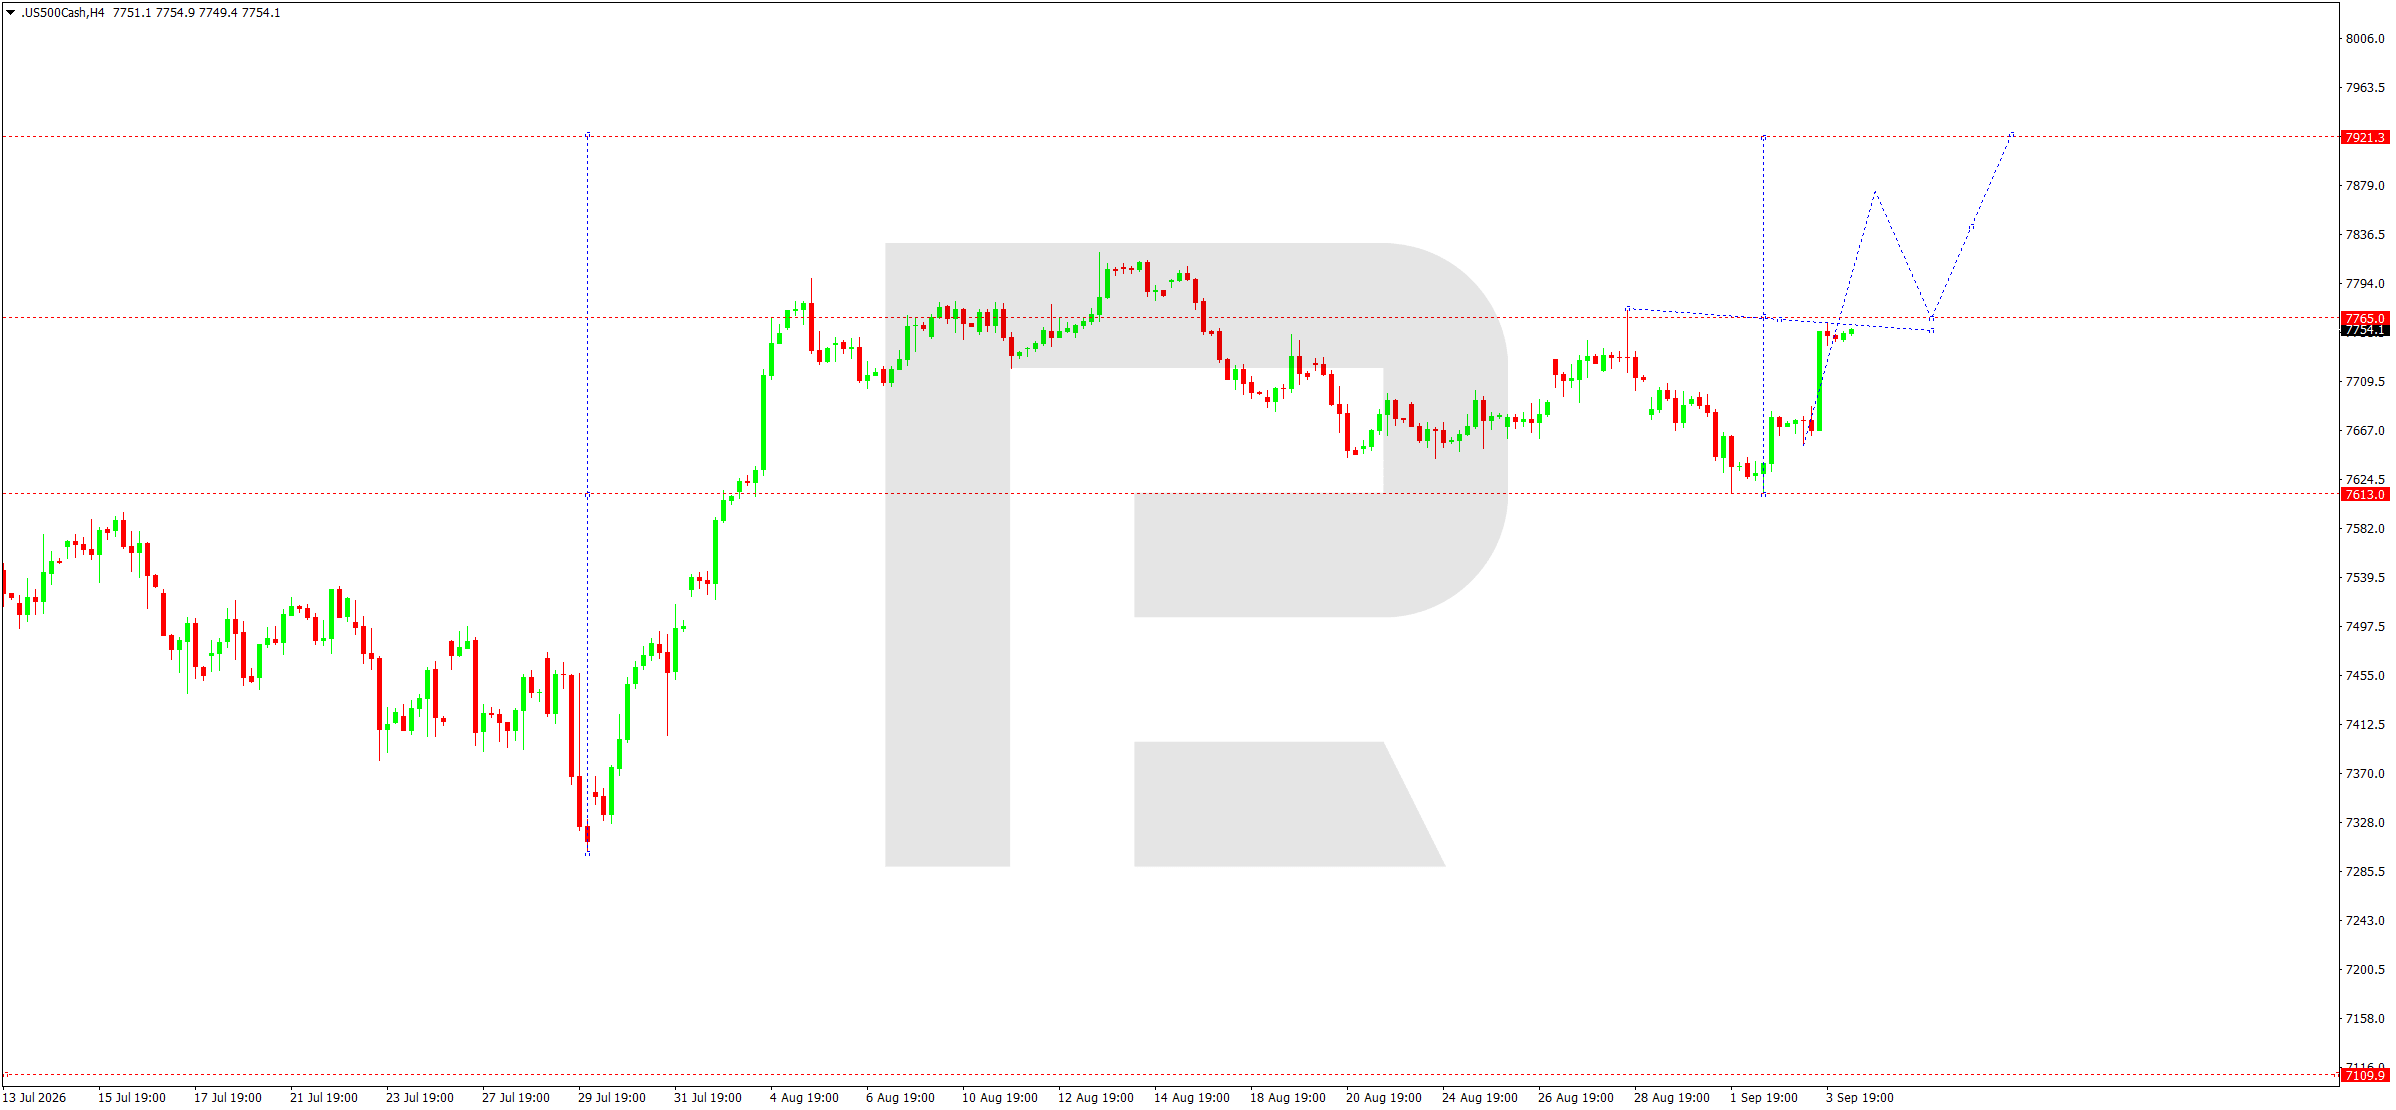
On the H4 chart, the US 500 rebounded from 7,613 and quickly returned to 7,754. The price is testing the 7,765 resistance level. Consolidation above this mark would confirm a breakout from the local range and open the way towards 7,836 and then 7,921. The 7,710–7,765 zone is the working range ahead of a directional move.
A buy setup is justified if the price confirms a hold above 7,759. The stop-loss level is below the nearest consolidation zone. A move below 7,710 would increase the risk of a return to 7,613 and invalidate the upside scenario towards 7,921. On the day of the employment data release, it is preferable to wait for a confirmed breakout, as the market’s initial reaction may prove false.
Trading scenario: BUY
- Price at the time of writing: 7,754
- Entry price: 7,759
- Stop loss: 7,710
- Take profit: 7,921
- Risk-to-reward ratio: 1:3.37
BTCUSD forecast
Following a strong rise in August, BTCUSD is hovering around 80,800, supported by a general recovery in risk appetite, renewed interest in the technology sector, and easing pressure from yields. At the same time, ahead of the US employment data, its performance remains dependent on movements in the US dollar and the bond market.
A robust US report could strengthen the dollar and trigger selling in risk assets, including Bitcoin. Weaker data would bolster expectations of a less restrictive Fed policy and could provide a catalyst for a breakout above the upper boundary of the consolidation range. High intraday volatility means that the risk of moves in both directions should be considered until a sustainable trend is established.
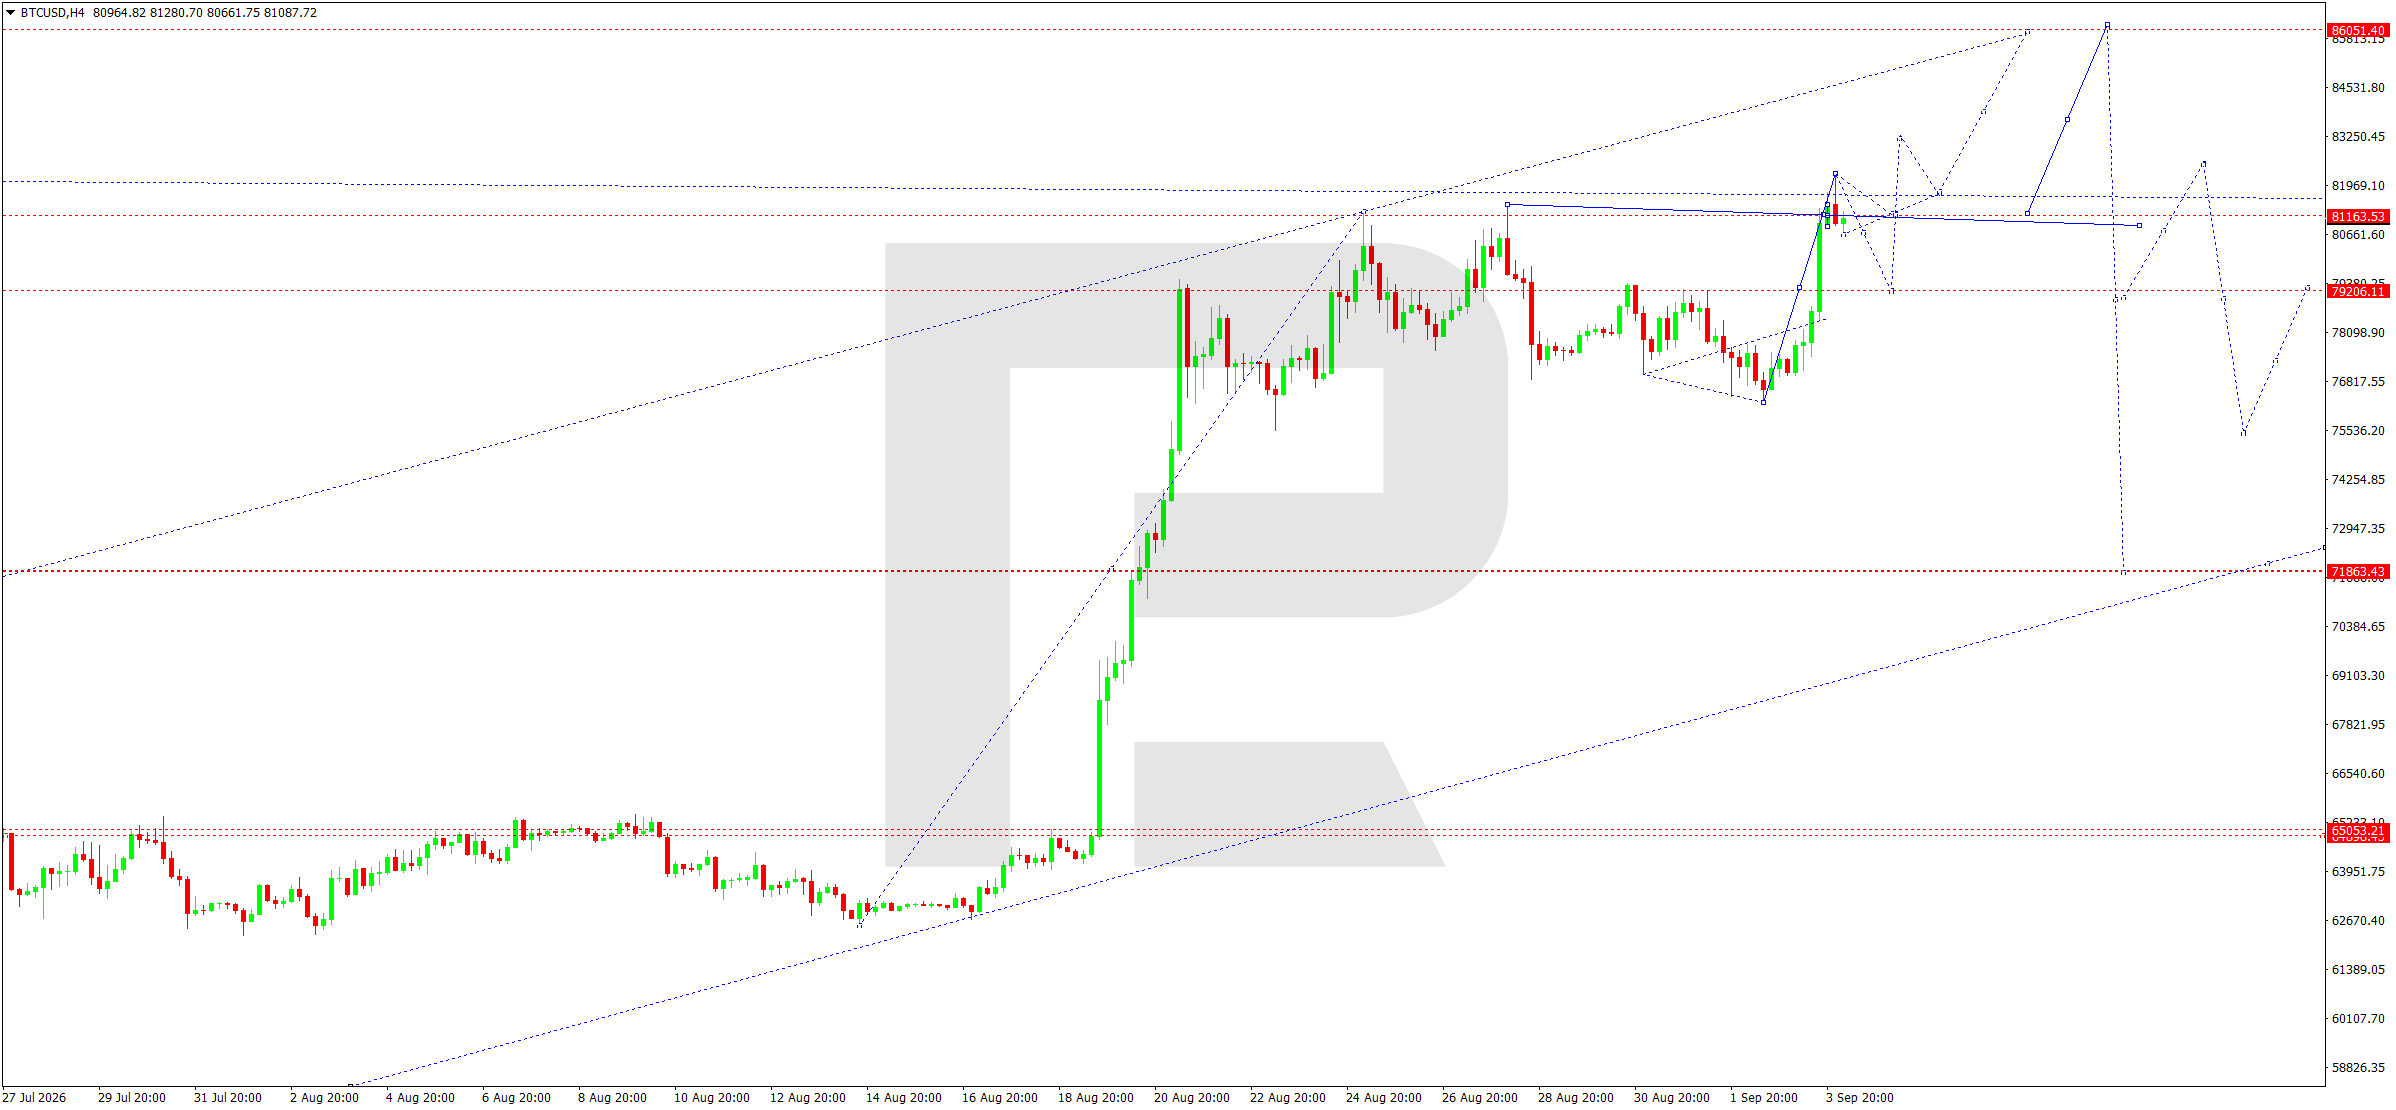
On the H4 chart, the market has formed a broad range between 79,206 and 81,163 after rising from 71,863. The price at 80,818 is directly below the 81,163 resistance level. Consolidation above this mark would open the way towards 81,970 and then 85,050. The medium-term structure remains bullish as long as the price holds above 79,206.
A buy is considered if the price consolidates above 80,823 and demand remains firm above 80,000. The stop-loss level is placed below the lower boundary of the current range. If the market falls below 79,206, a deeper correction towards 75,536 will become more likely. The main scenario suggests continued growth after a breakout from the range, but does not rule out a short-term false breakout ahead of the US data.
Trading scenario: BUY
- Price at the time of writing: 80,818
- Entry price: 80,823
- Stop loss: 79,200
- Take profit: 85,050
- Risk-to-reward ratio: 1:2.60
Editors’ picks
 EURUSD forecast 2026–2027: technical analysis, price levels & predictions
EURUSD has recovered from the July lows and is trading near 1.1545 — back in bullish territory. The pair has reclaimed EMA65 on the daily, formed a bullish EMA crossover on H4, and the US-eurozone GDP gap has narrowed sharply (US 1.5% vs eurozone 1.0%). Goldman Sachs and Deutsche Bank both now target 1.2500 by year-end. A confirmed close above 1.1700 opens the path to 1.1805. We break down the key levels, three trading scenarios, and what the unprecedented 9-3 FOMC dissent vote means for EURUSD.
 Gold (XAUUSD) forecast 2026: technical analysis, price levels & predictions
Gold has reversed its downtrend and is trading near 4,360 USD, back above both EMA65 and EMA200. ETF flows turned positive in July with 3 billion USD of net inflows, and central banks bought 288.9 tonnes in Q2 — up 62% year-on-year. A breakout above 4,500 USD opens the path to 4,855 USD and the 5,597 USD all-time high. We break down the key levels, three trading scenarios with entry triggers, and what J.P. Morgan, Deutsche Bank and Goldman Sachs are forecasting for gold in 2026.
Forecasts presented in this section only reflect the author’s private opinion and should not be considered as guidance for trading. RoboForex bears no responsibility for trading results based on trading recommendations described in these analytical reviews.