
Daily technical analysis and forecast for 7 September 2026
Daily technical analysis and forecast for EURUSD, USDJPY, GBPUSD, AUDUSD, USDCAD, XAUUSD, US 500, and BTCUSD for 7 September 2026.
Each scenario on this page reflects the market structure on the H4 chart as of 10:00 UTC+3 on 7 September 2026 and remains valid throughout the current trading day. It closes when the price reaches either the take-profit or stop-loss level, or at the end of the trading day if neither level has been reached. The assessment considers the current H4 chart structure, key support and resistance levels, the direction of the medium-term movement, and the prevailing fundamental backdrop.
EURUSD forecast
For EURUSD, the key factor at the start of the week is the change in expectations regarding monetary policy in the US and the eurozone. Strong August employment data from the US strengthened the US dollar and prompted market participants to reassess the likelihood of further policy tightening by the Federal Reserve. Higher Treasury yields following the data release are putting additional pressure on the euro by increasing the attractiveness of US dollar assets.
At the same time, the European Central Bank faces an important meeting on 10 September. The market has formed expectations of a rate hike, as energy risks and persistent inflationary pressure limit the ECB’s ability to maintain a neutral stance. Thus, the fundamental picture for EURUSD remains contradictory: expectations of a more hawkish ECB support the euro, while the strong US labour market and rising US yields favour the dollar.
At the start of the week, expectations ahead of US inflation data provide an additional factor. Until the figures are released, the market may avoid establishing a sustained directional momentum. For EURUSD, this increases the likelihood of continued local consolidation, although the H4 technical structure still indicates an advantage for sellers.
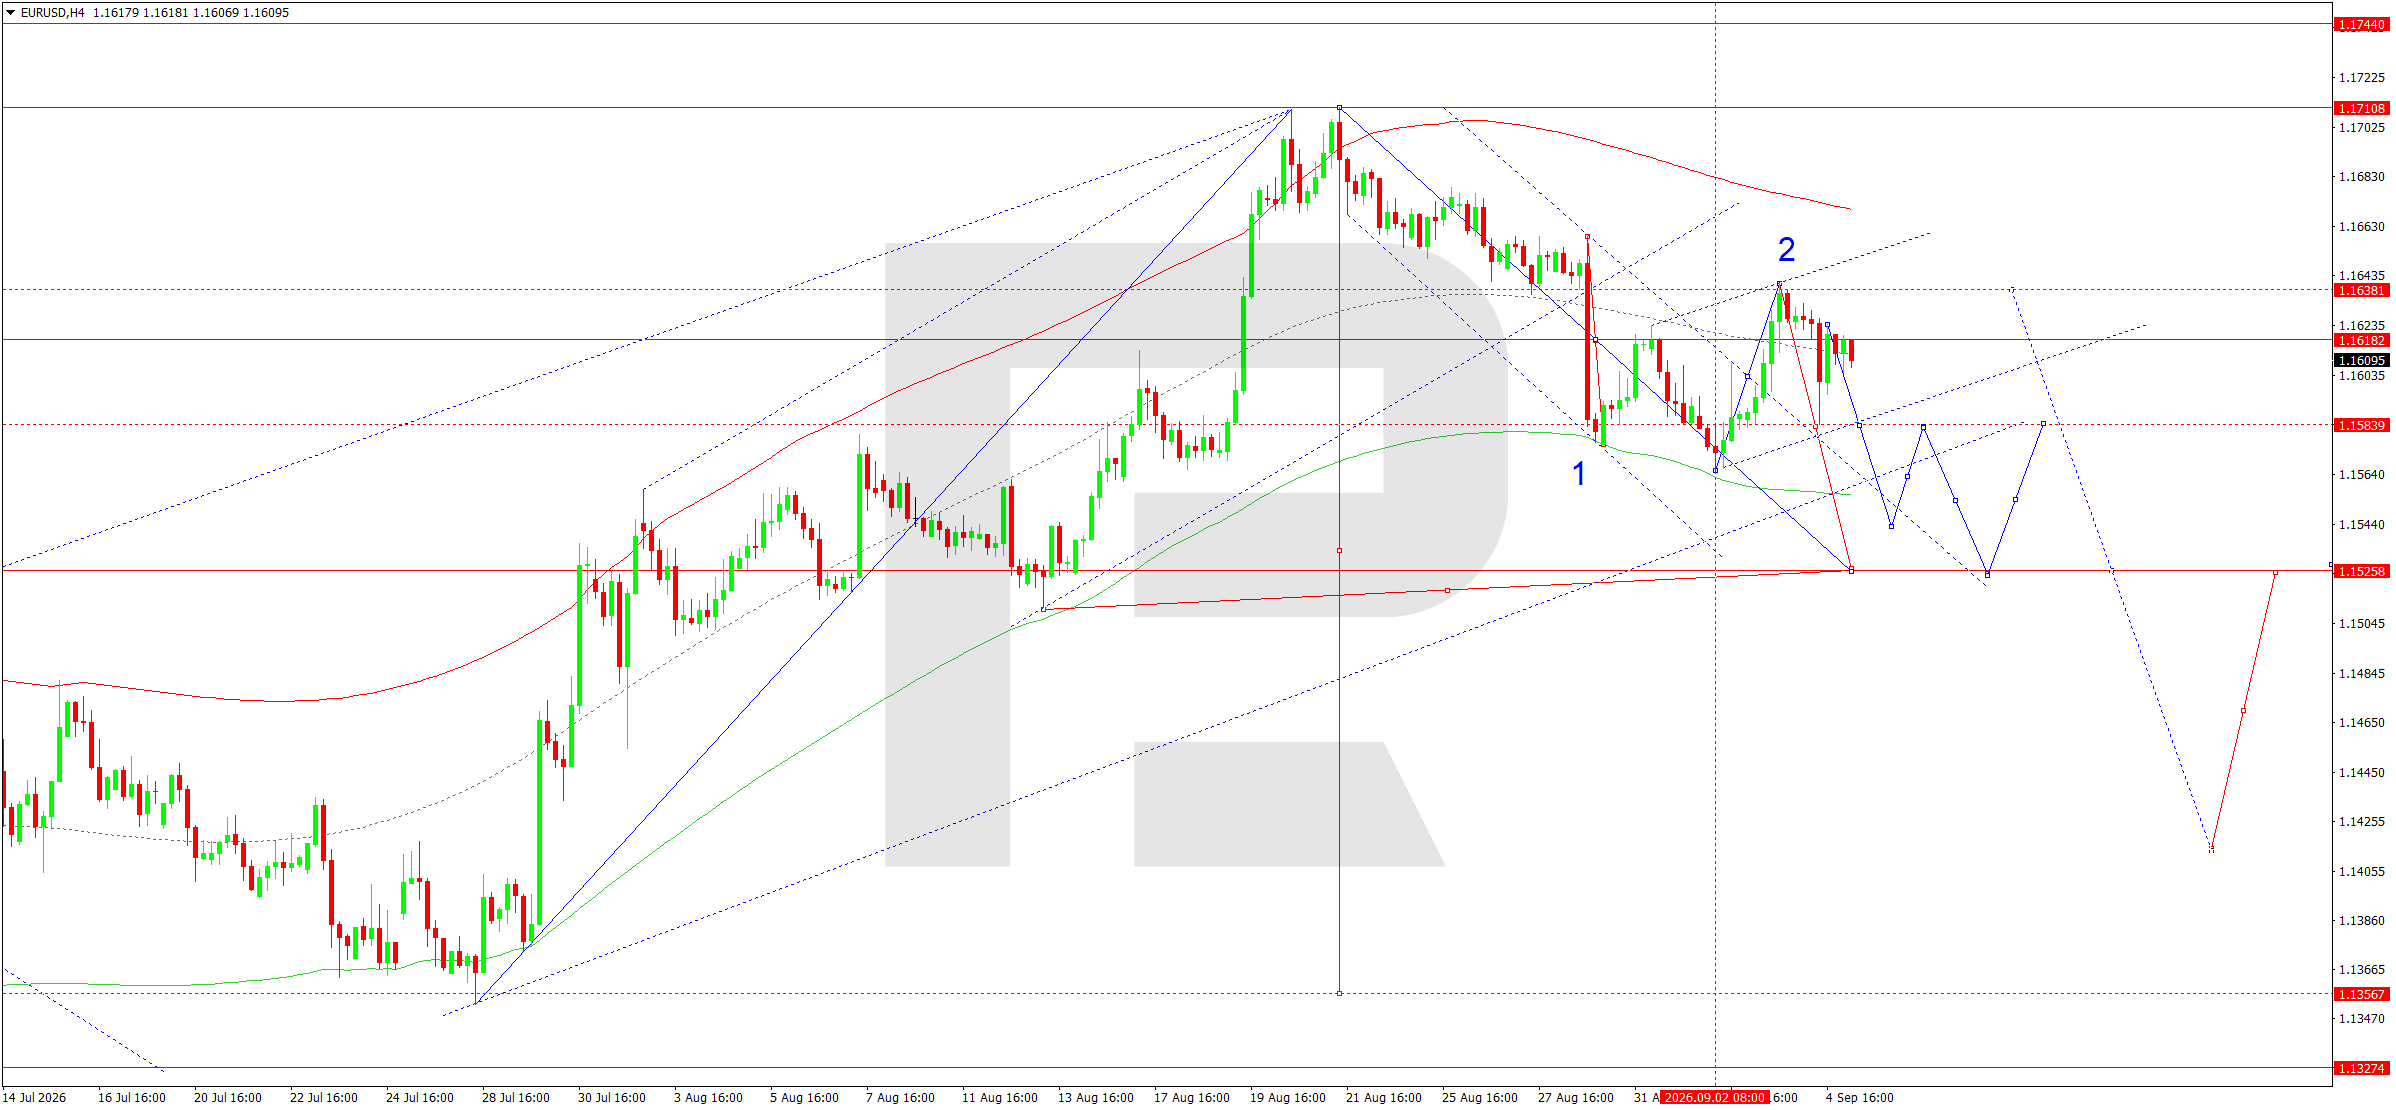
On the EURUSD H4 chart, the market previously formed a high near 1.1711, after which it moved into a downward structure. The first downward wave found support around 1.1583. The subsequent correction formed a second wave with a rise towards 1.1638, but buyers failed to consolidate above this area.
Today, 7 September 2026, the price is consolidating around 1.1618. This area acts both as the matrix pivot and a crucial short-term reference point. As long as the market remains below 1.1638, the development of another downward wave retains priority.
The main scenario suggests a downside breakout from the current range and a decline towards 1.1583. A breakout below this level would open the way towards 1.1544 and then 1.1528. The 1.1528 area is considered the main technical target of the current downward wave and the area of the lower boundary of the Price Envelope.
An alternative scenario would be consolidation above 1.1638. In this case, the correction could extend, although a return above 1.1711 would be required for a significant change in the current structure. Until that happens, any rise is viewed mainly as corrective.
Trading scenario: SELL
- Price at the time of writing: 1.1609
- Entry price: 1.1604
- Stop loss: 1.1640
- Take profit: 1.1528
- Risk-to-reward ratio: 1:2
USDJPY forecast
USDJPY starts the week amid a confrontation between two fairly strong fundamental factors. On the US side, the dollar is supported by the strong August labour market report, after which market participants raised their estimates of the probability of a more hawkish Fed policy. Rising US government bond yields traditionally create a favourable environment for USDJPY.
At the same time, the fundamental situation in Japan has changed noticeably. The Bank of Japan is increasingly signalling that it may raise interest rates further amid persistent inflationary pressure. Market expectations of a possible September rate hike have strengthened significantly. The yen is also receiving additional support from the persistent risk of currency intervention after a prolonged period of weakness.
This is why USDJPY’s reaction to strong US data remains relatively restrained. Even as US yields rise, sellers in the pair remain active. Geopolitical uncertainty may also periodically increase demand for the yen as a safe-haven asset.
As a result, the fundamental balance at the start of the day appears mixed. In the short term, a recovery in the US dollar is possible after the pair’s sharp decline, but medium-term risks for USDJPY remain tilted to the downside.
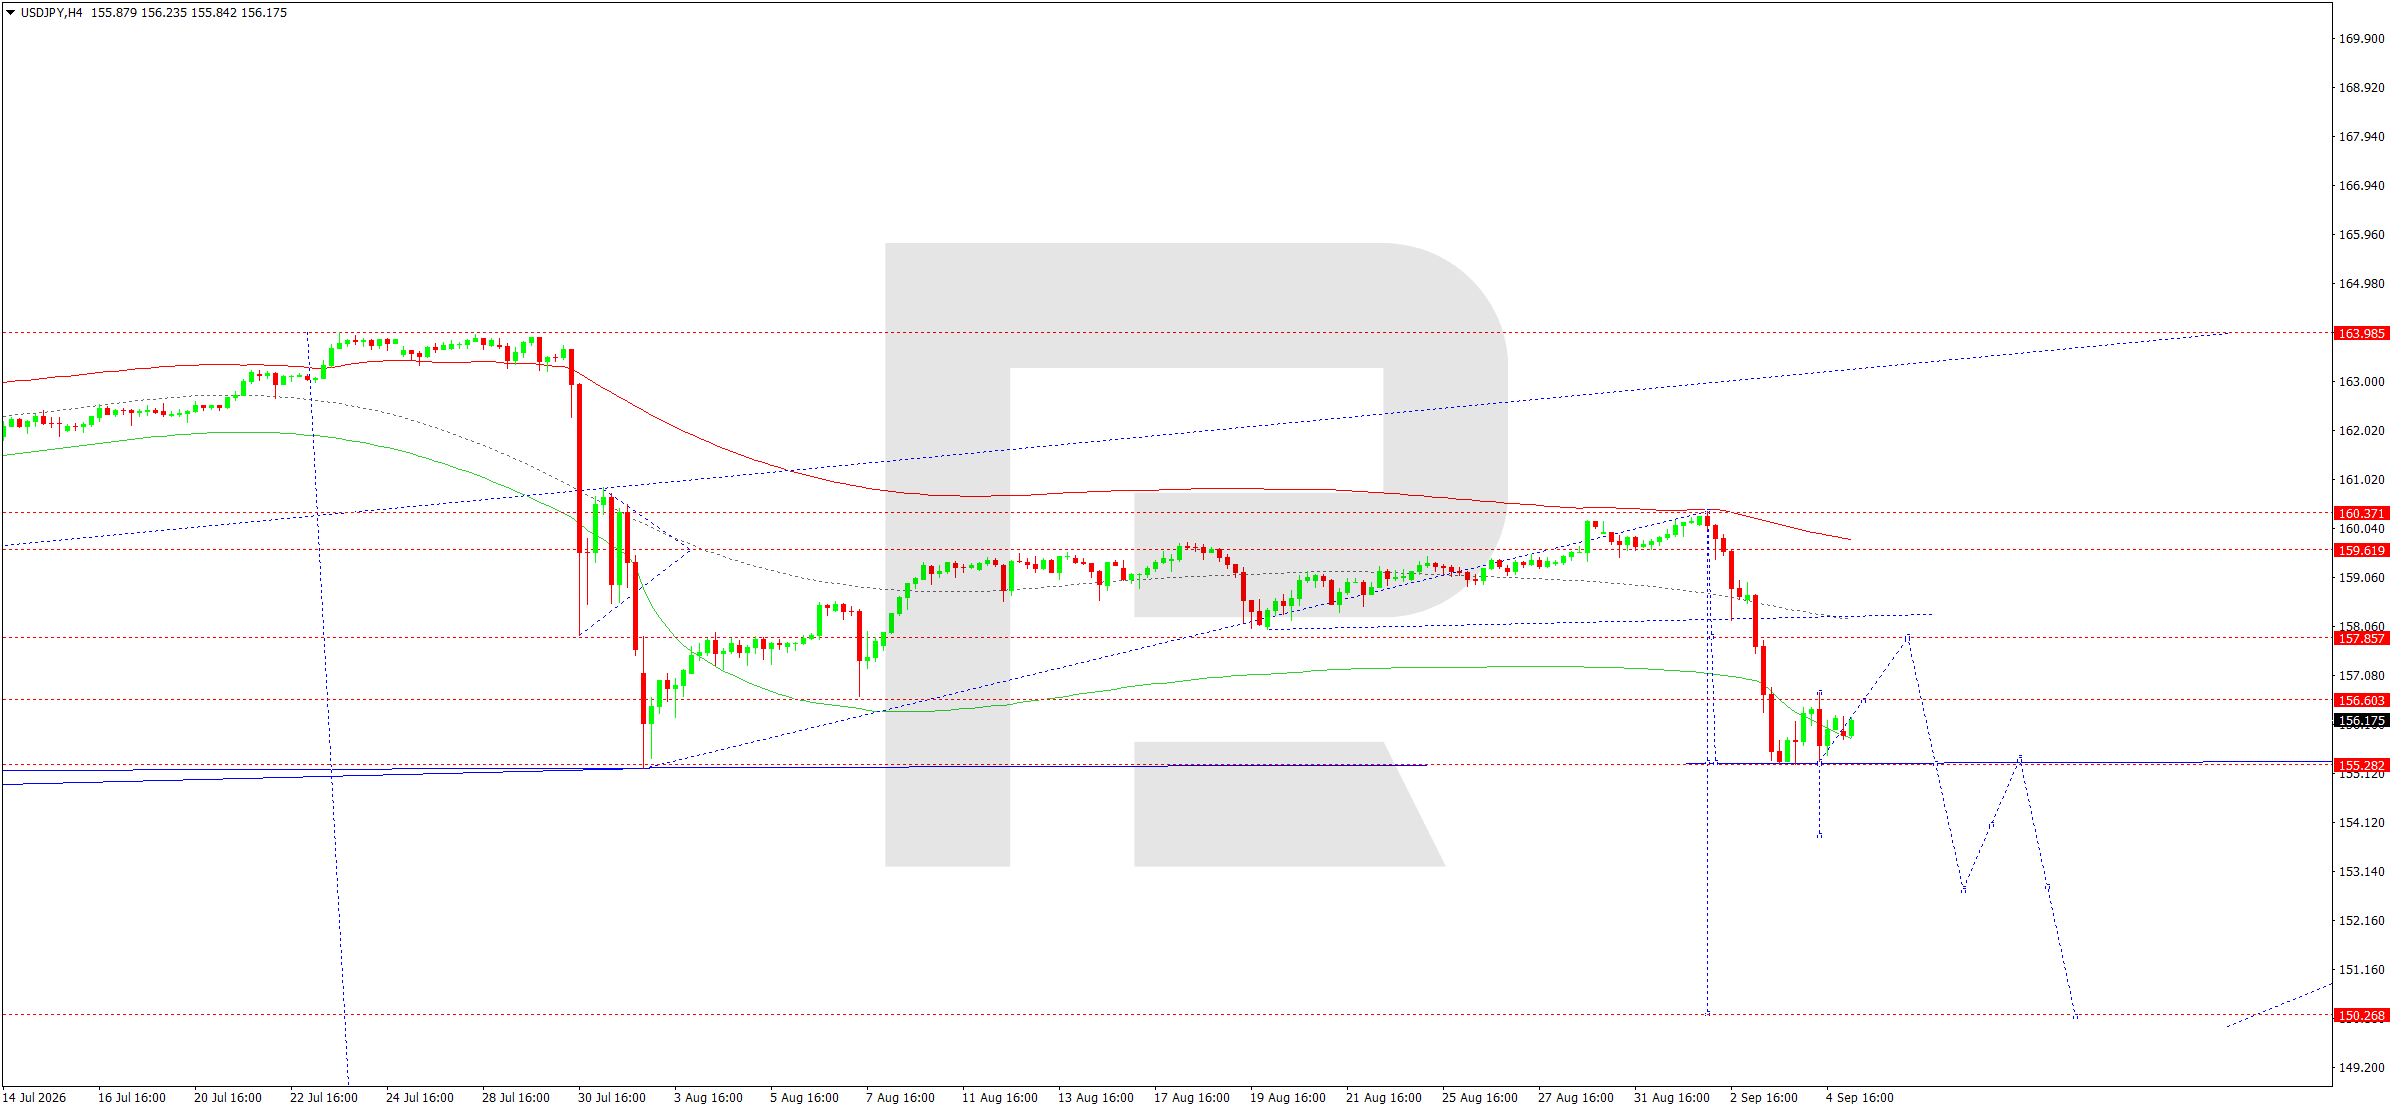
On the H4 chart, the market completed a powerful downward impulse from the 160.37 area, forming a local low near 155.33. After reaching the lower boundary of the Price Envelope, sellers took some profits, allowing the price to form a recovery impulse towards 156.28.
Today, the market corrected towards 155.80, after which signs of stabilisation appeared. Thus, the possibility of another recovery move remains directly from the current levels.
The first target is 156.60. Consolidation above this level would open the way towards 157.87, where a significant technical area and the central part of the current Price Envelope structure are located.
The matrix of the larger wave retains its pivot near 159.00. As long as the price remains well below it, the overall downtrend cannot be considered complete. Therefore, the expected rise towards 156.60–157.87 is viewed specifically as a correction of the previous decline.
Given the proximity of strong support at 155.33 and the impulse already formed from this level, a local buy is preferred at the current stage. A breakout below 155.33 would invalidate this scenario and return the 155.00 area as the main target, with the prospect of further decline.
Trading scenario: BUY
- Price at the time of writing: 156.15
- Entry price: 156.20
- Stop loss: 155.30
- Take profit: 157.87
- Risk-to-reward ratio: 1:2
GBPUSD forecast
GBPUSD starts the week with expectations for interest rates strengthening in both the US and the UK. Following the strong US employment report, the market once again began to price in the likelihood of a prolonged period of restrictive Fed policy. This is a negative factor for the pound, as higher US yields increase the attractiveness of the US dollar.
However, the British currency is receiving support from expectations of further policy tightening by the Bank of England. Officials continue to emphasise the need to keep inflationary pressure under control. In particular, a hawkish stance on the level of interest rates remains in place amid persistent inflation.
Therefore, the US dollar’s fundamental advantage over the pound cannot yet be considered unequivocal. GBPUSD remains sensitive to changes in expectations regarding the interest rate differential between the US and the UK. US inflation figures will also be important this week, as they could either confirm or weaken the expectations of a more hawkish Fed that emerged after the employment report.
At the start of the day, the fundamental backdrop allows for elevated volatility within the established range, while the technical picture still favours the downside scenario.
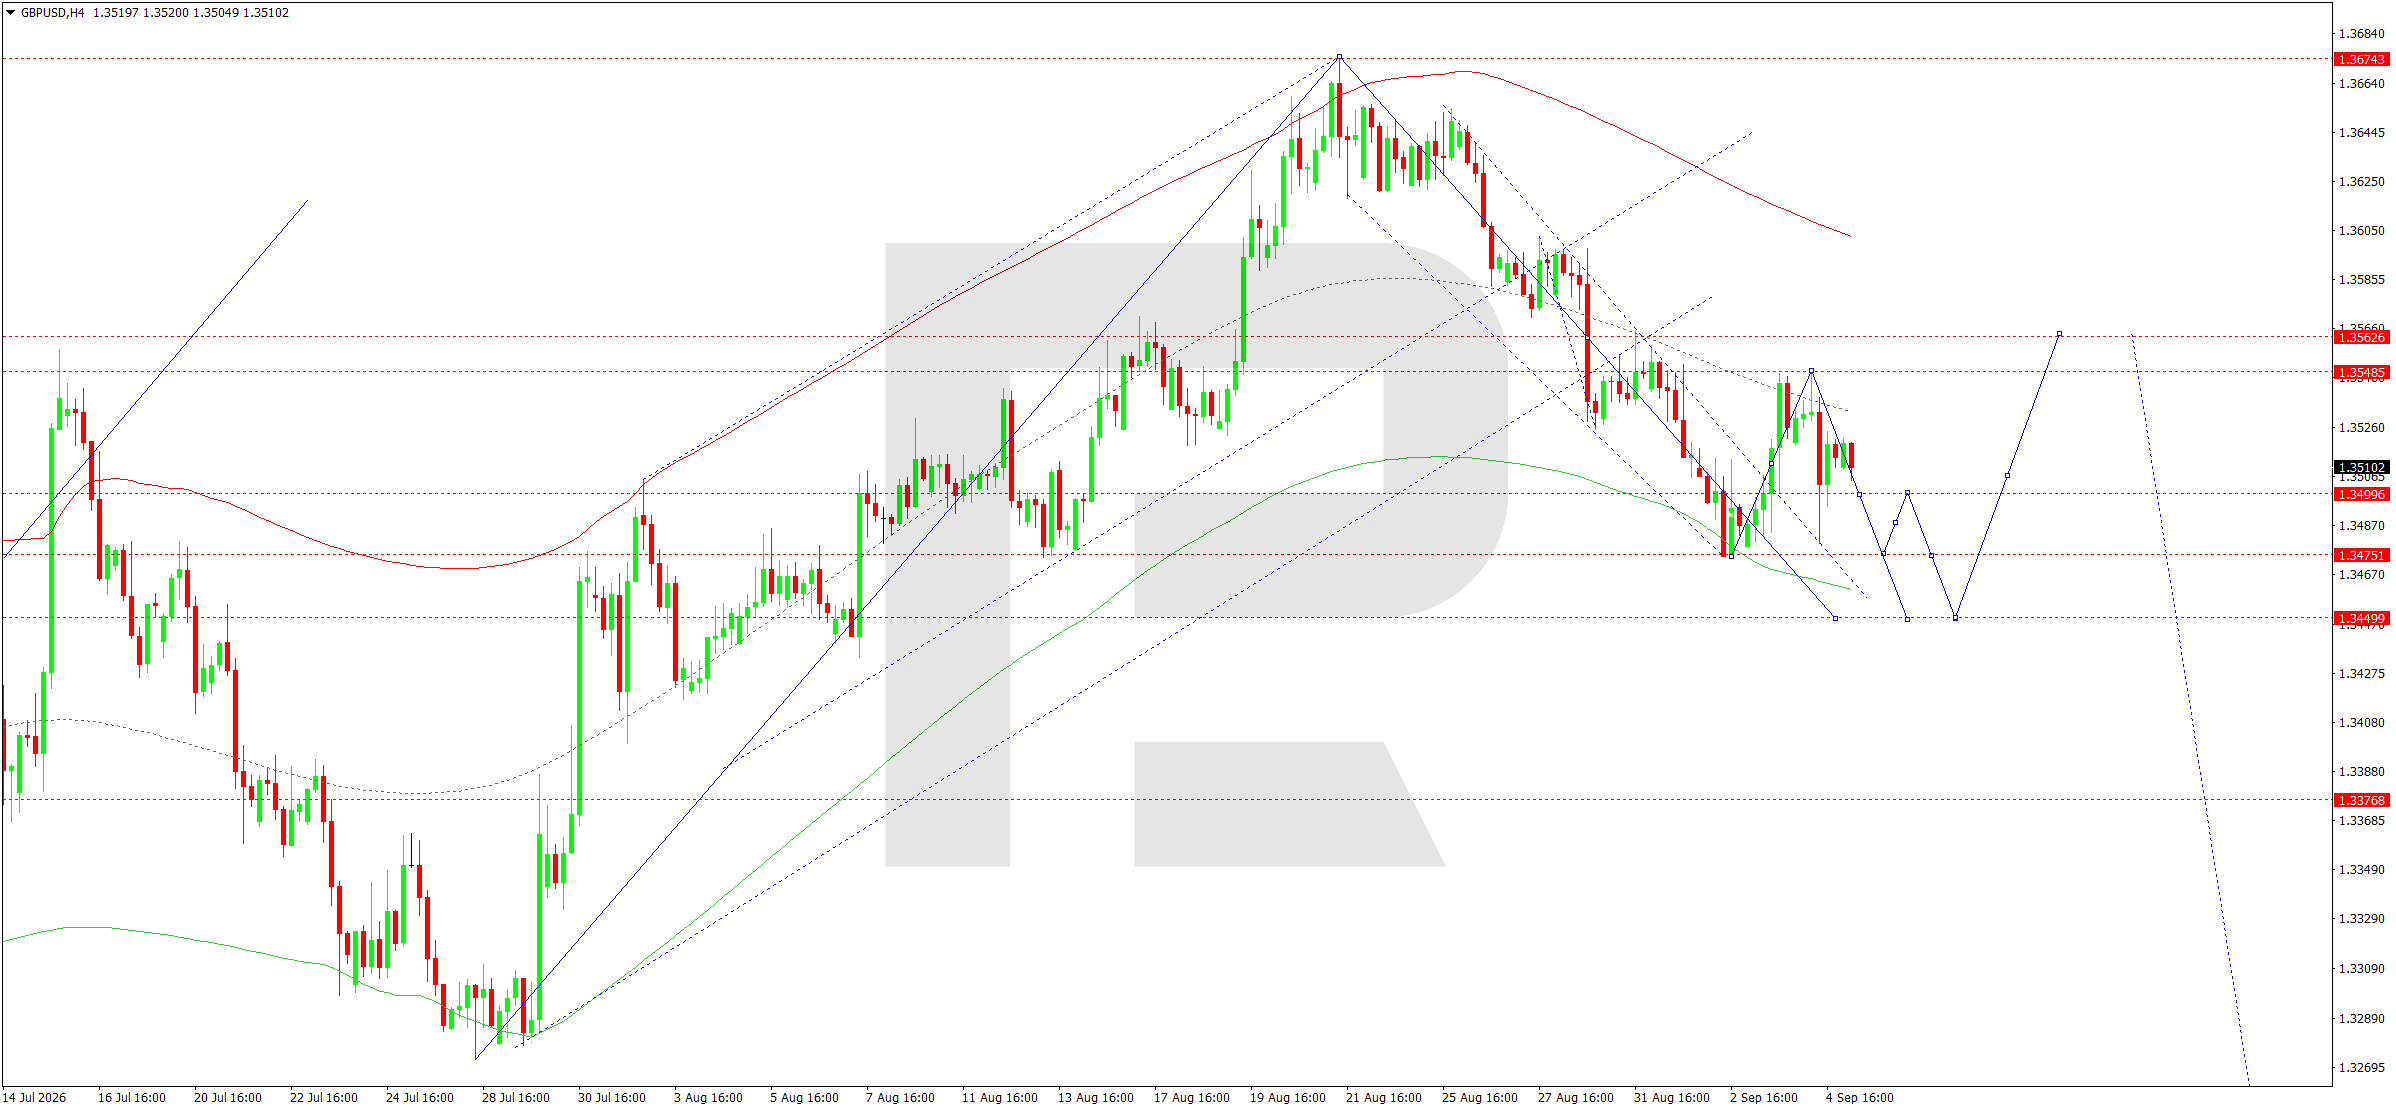
On the H4 chart, GBPUSD has been developing a downward structure consistently after forming a high near 1.3674. The price formed a series of lower highs, while the previous upward structure was broken.
The latest local upward impulse ended near 1.3548. From this resistance, the market declined towards 1.3480 and then formed a correction towards 1.3525. The price is currently near 1.3509 and remains below the centre of the short-term structure.
The matrix of the downward wave has its pivot in the 1.3562 area. As long as the price remains below this level, sellers retain the advantage. The market’s nearest task is to retest 1.3475. A breakout below it would allow the move to continue towards 1.3450–1.3445.
The 1.3445 area coincides with the lower boundary of the Price Envelope and is therefore the main local target of the current decline. Once it is reached, the likelihood of a technical correction will increase.
To invalidate the downward scenario, the price needs to consolidate above 1.3548–1.3562. Until that happens, current recoveries should be viewed as corrections within the established downward structure.
Trading scenario: SELL
- Price at the time of writing: 1.3509
- Entry price: 1.3504
- Stop loss: 1.3549
- Take profit: 1.3445
- Risk-to-reward ratio: 1:1
AUDUSD forecast
For AUDUSD, the fundamental situation remains relatively favourable for the Australian dollar, although strong US data limits the pair’s potential for further gains. The Reserve Bank of Australia continues to operate in an environment of elevated inflationary pressure. Recent consumer activity figures have been fairly resilient, strengthening expectations of a more hawkish stance from the regulator and supporting the Australian dollar.
At the same time, the strong August US labour market report changed expectations regarding Fed policy. The US dollar received support through higher bond yields, preventing AUDUSD from confidently consolidating above 0.7200–0.7210.
Another factor for the Australian currency is the state of global risk appetite and the outlook for the Chinese economy. This week, attention will also focus on inflation data from China and the US. Elevated geopolitical tensions and expensive oil may worsen investor sentiment towards risk assets, which traditionally limits demand for the AUD.
Thus, the fundamental backdrop does not provide a clear signal. RBA policy supports the Australian dollar, but the market’s technical inability to develop a move above 0.7211 increases the likelihood of a correction.
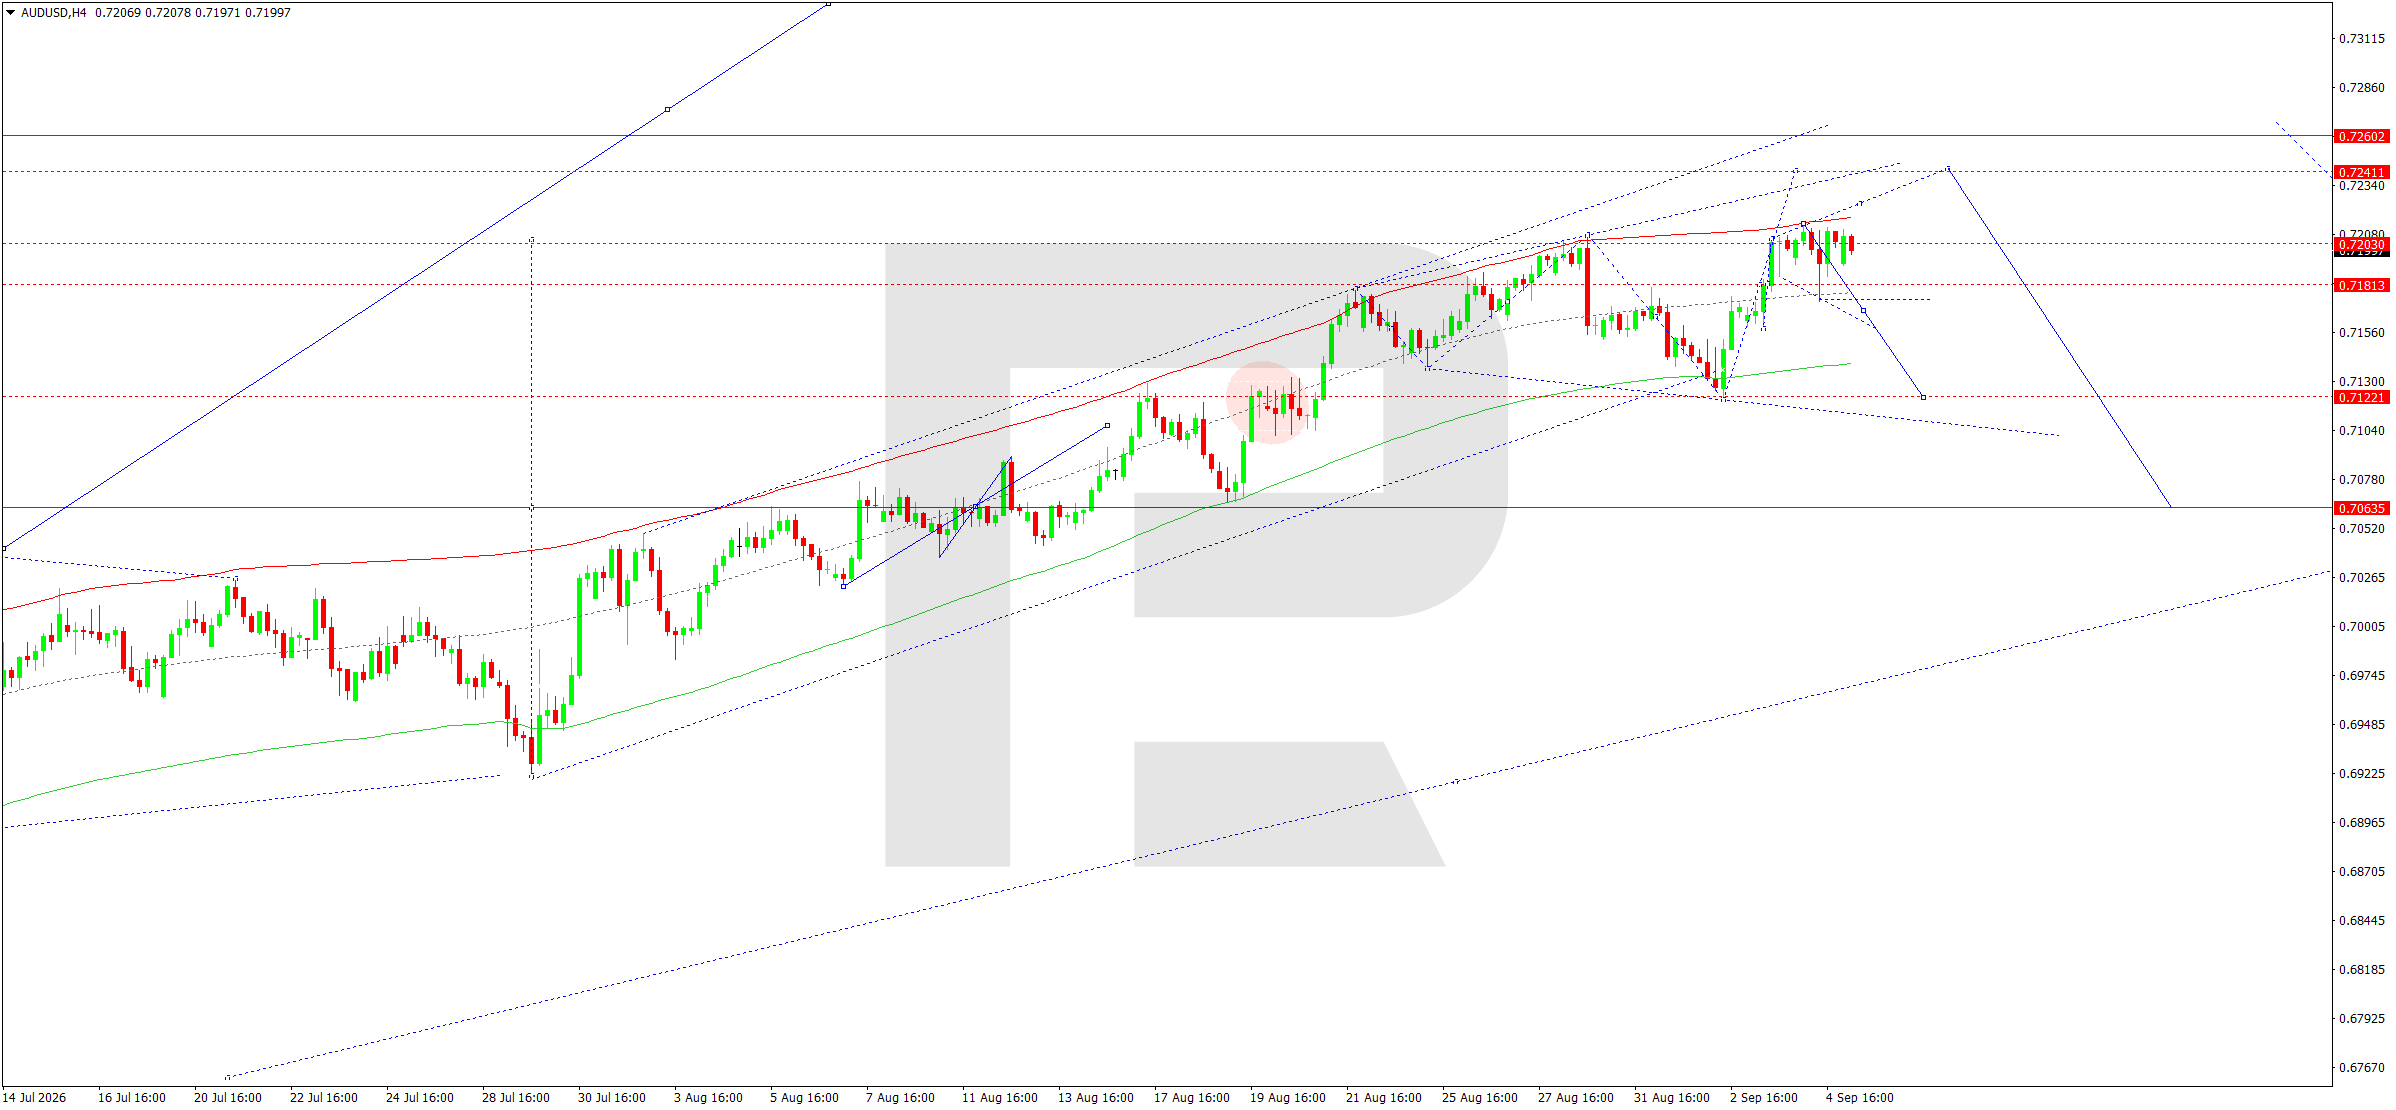
On the H4 chart, AUDUSD remains within the medium-term upward structure formed from the July lows. At the same time, recent moves indicate a loss of momentum directly below a crucial resistance area.
The market previously declined towards 0.7175 and then recovered into the 0.7211–0.7220 area. However, attempts to consolidate above this zone have so far failed to gain traction. The price is forming a compact consolidation near 0.7200.
The upper boundary of the Price Envelope is located in the 0.7211–0.7220 area. Buyers’ failure to consolidate above it creates conditions for a corrective wave.
The main short-term scenario suggests a decline first towards 0.7181–0.7170. A breakout below this area would open the way towards 0.7122, where the next significant support and a potential area for the correction to end are located.
The matrix of the current structure has its pivot near 0.7170. Therefore, a move towards 0.7122 is still viewed as a correction within the broader upward structure. Once this target is reached, a new recovery attempt towards 0.7188 and above may develop.
Trading scenario: SELL
- Price at the time of writing: 0.7204
- Entry price: 0.7199
- Stop loss: 0.7242
- Take profit: 0.7122
- Risk-to-reward ratio: 1:2
USDCAD forecast
USDCAD starts the new week amid a noticeable divergence in fundamental conditions between the US and Canada. The strong August US employment report increased the probability that the Fed will maintain a hawkish stance and supported the US dollar. In Canada, by contrast, the labour market is showing signs of weakness, limiting the Canadian dollar’s ability to strengthen sustainably.
The Bank of Canada is in a difficult position. Inflation risks prevent the regulator from rapidly easing monetary conditions, while weakening economic activity and employment create pressure in the opposite direction. Recently, the market has been pricing in the likelihood that the rate will remain unchanged.
The oil market remains a significant factor for the CAD. Rising geopolitical tensions are keeping oil prices high, which is fundamentally favourable for the Canadian dollar as the currency of a major commodity exporter. At the same time, intensifying trade tensions between the US and Canada increase uncertainty and may limit demand for the CAD.
Thus, the fundamental picture remains mixed. A strong US dollar supports USDCAD, while expensive oil prevents the pair from rising sustainably. Under these conditions, technical levels become increasingly important.
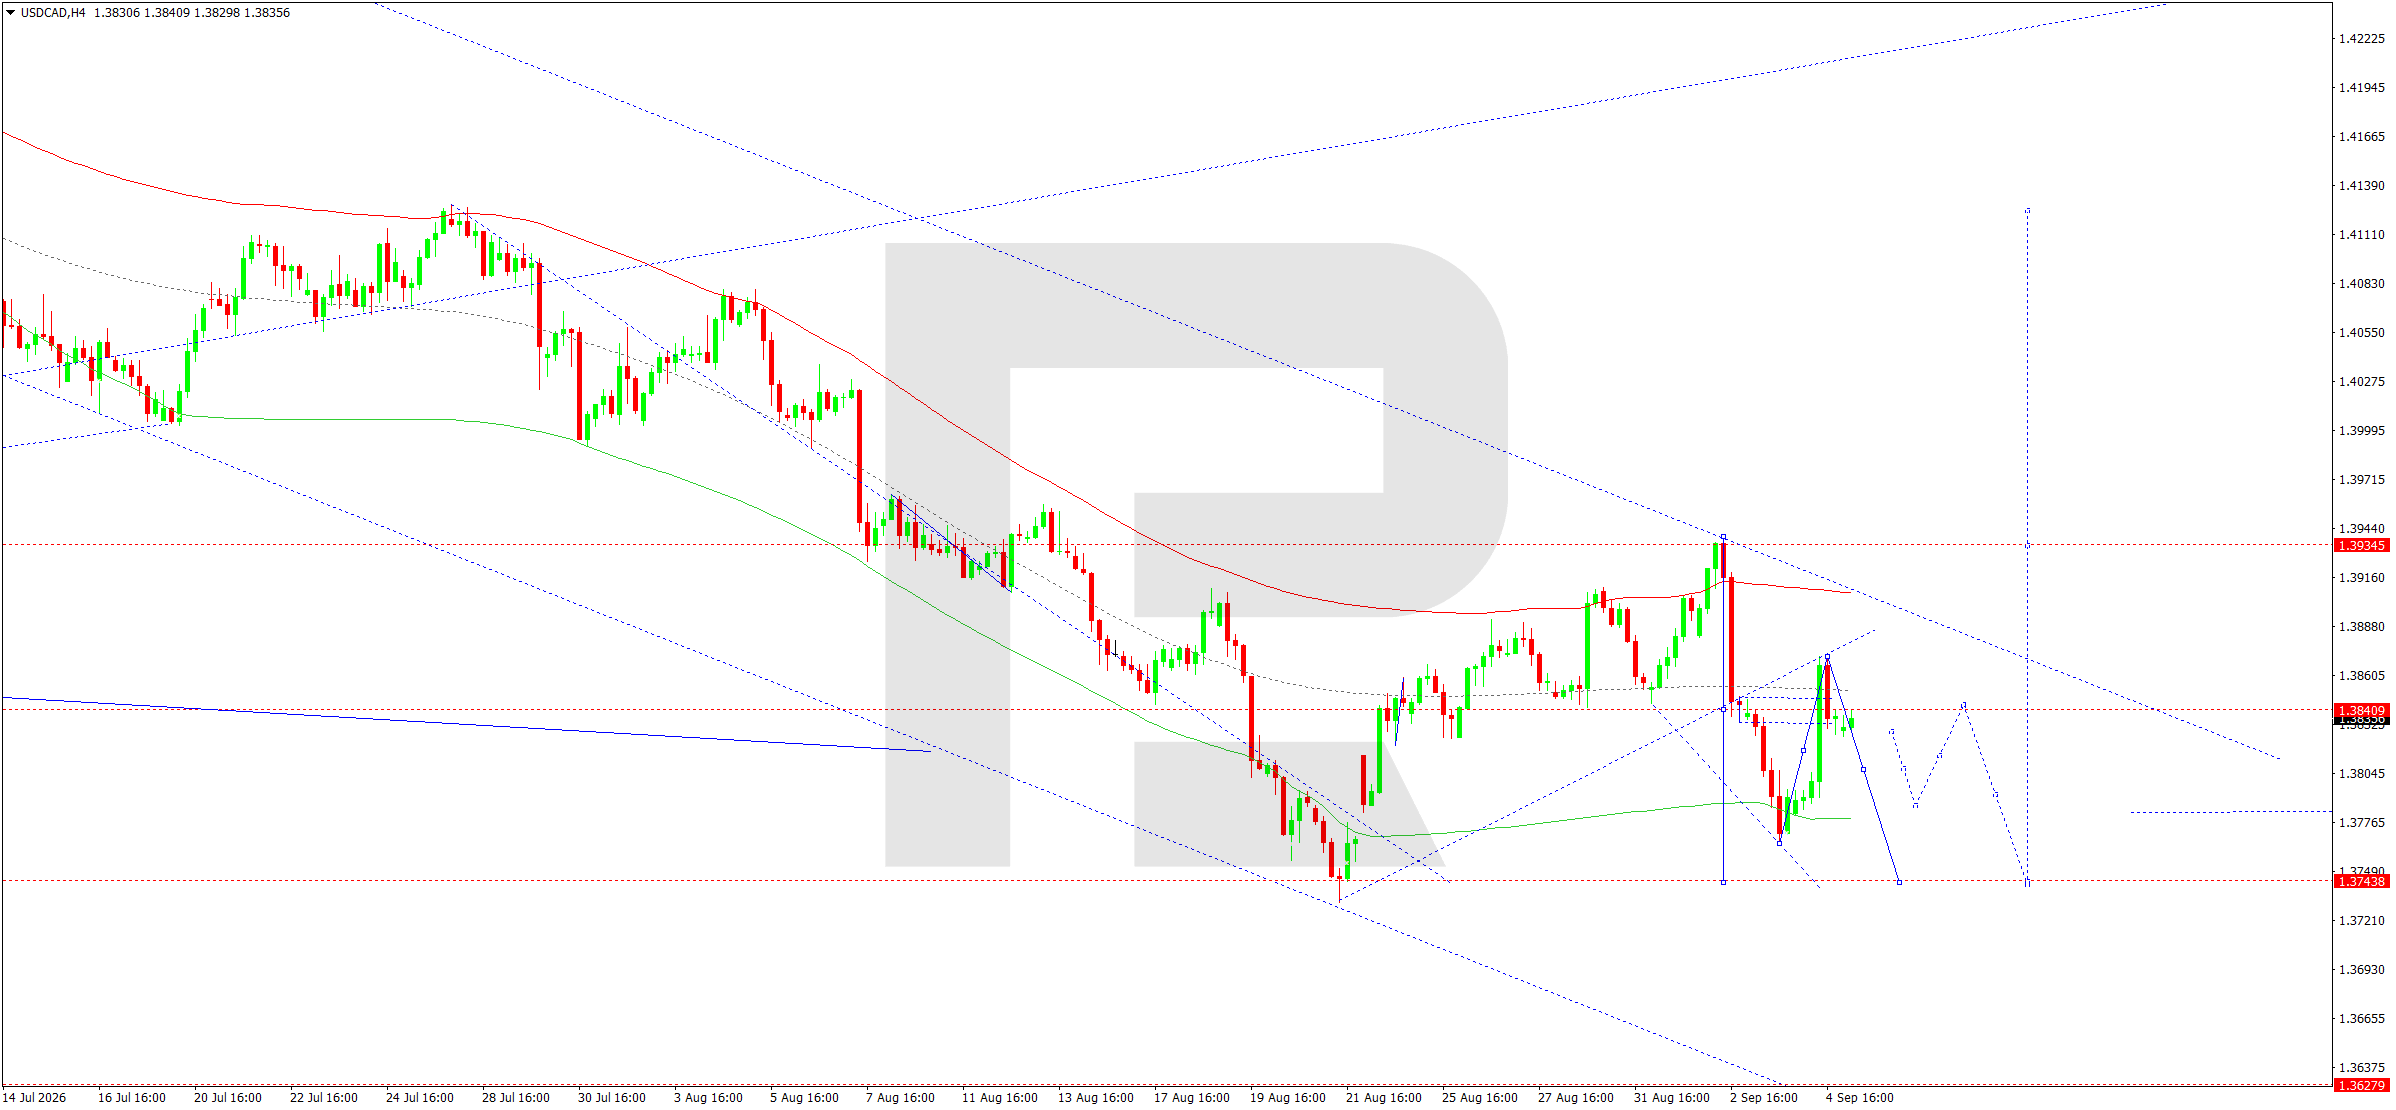
On the H4 chart, USDCAD remains within a broader downward structure. After forming a local low in the 1.3747 area, the market staged a corrective recovery, but the rise was capped near 1.3866.
A new downward momentum formed from this area towards 1.3825. Today, the price is hovering near 1.3835 and is forming a compact consolidation directly below the matrix pivot at 1.3840.
As long as the market remains below 1.3840–1.3866, the downside retains the advantage. The first target is the 1.3775 area, followed by a test of the key support level at 1.3747, which coincides with the lower part of the current Price Envelope.
Consolidation below 1.3747 would confirm a continuation of the main downtrend. At the same time, this level could become the base for a more significant upward correction.
An alternative scenario would be activated if the price consolidates above 1.3866. In this case, the market could form a move towards 1.3939. Until such a breakout occurs, any rise is viewed mainly as corrective.
Trading scenario: SELL
- Price at the time of writing: 1.3835
- Entry price: 1.3830
- Stop loss: 1.3870
- Take profit: 1.3747
- Risk-to-reward ratio: 1:2
XAUUSD forecast
Gold starts the week under the influence of two opposing fundamental factors. On the one hand, the strong August US employment report fuelled expectations of a more hawkish Fed policy. Rising US government bond yields increase the opportunity cost of holding gold and put pressure on XAUUSD. This factor remains one of the main obstacles to a recovery in prices after the previous decline.
On the other hand, the geopolitical situation continues to support demand for safe-haven assets. Tensions involving Iran and the US, along with risks to shipping and energy supplies through the Strait of Hormuz area, continue to maintain a significant geopolitical risk premium.
This week, US inflation figures will be particularly important. If the data confirms persistently elevated price pressures, the market may further increase the probability of tighter Fed policy, which would be unfavourable for gold. Weaker inflation, by contrast, could lower yields and bring buyers back to the precious metals market.
Thus, the fundamental backdrop remains volatile, but at the start of the day the impact of a strong US dollar and high yields allows a cautious bearish bias to be maintained.
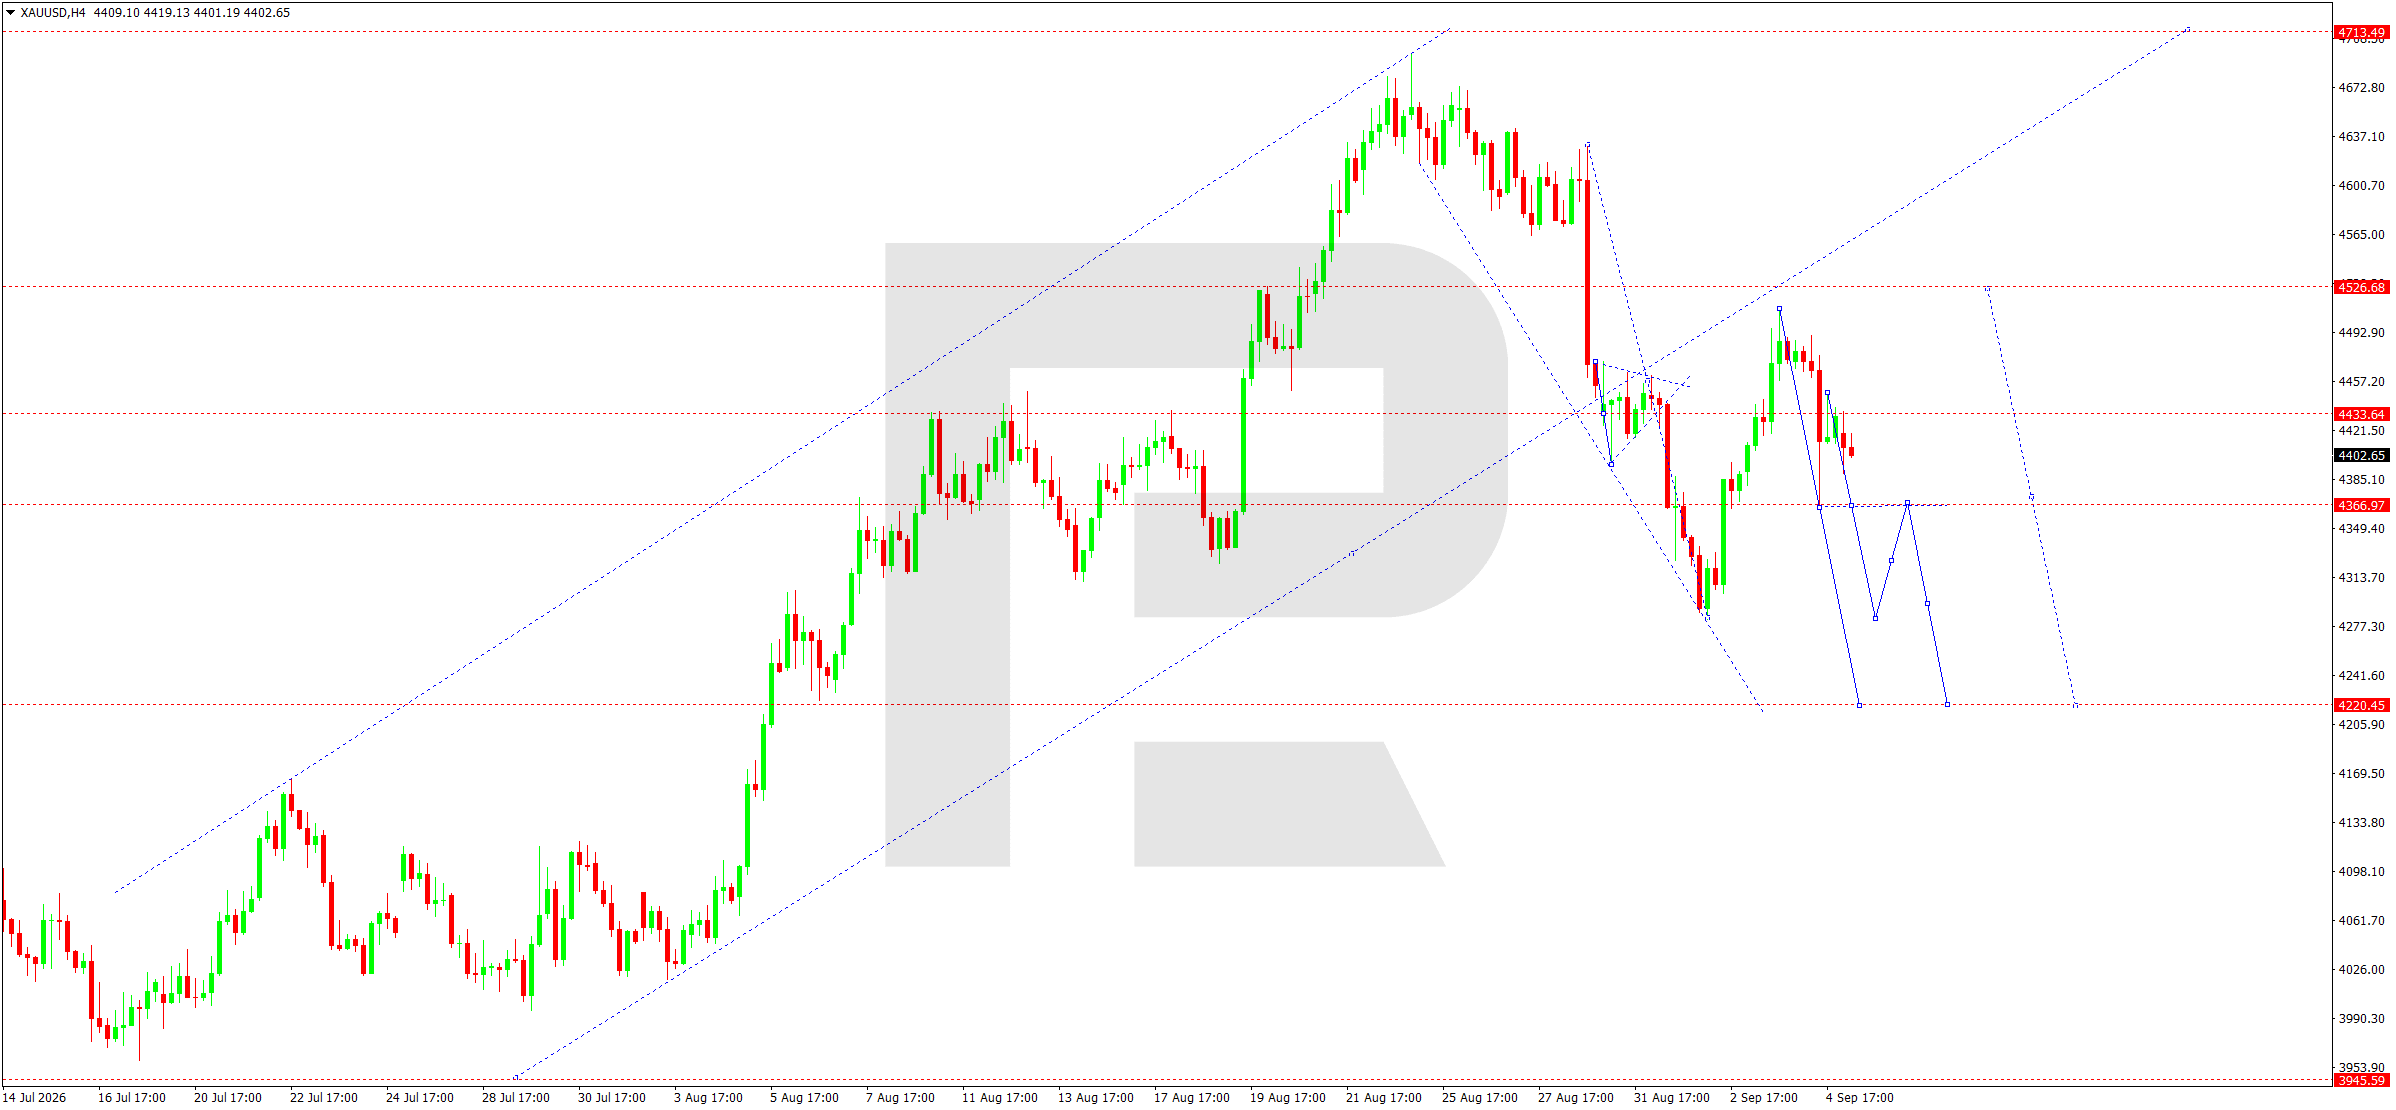
On the H4 chart, after forming a high in the 4,670 area, XAUUSD moved into a pronounced downward correction. The first major wave reached the 4,280 area, followed by a recovery towards 4,500.
Buyers failed to gain a foothold above this area. Another downward impulse formed from the local high, with prices currently near 4,403, directly below the matrix pivot at 4,433.
The 4,433 level remains key to the short-term structure. As long as prices hold below it, the main scenario suggests a continued decline, with the nearest intermediate target at 4,367. A breakout below this level would open the way towards the lower boundary of the Price Envelope in the 4,220–4,222 area.
After 4,220 is reached, the likelihood of a corrective recovery towards 4,433 would increase significantly. However, if sellers consolidate below 4,220, the next medium-term target will be the 4,145 area.
A return above 4,433, followed by a breakout above 4,527, would invalidate the immediate downside scenario and indicate a recovery in the upward structure.
Trading scenario: SELL
- Price at the time of writing: 4,403
- Entry price: 4,398
- Stop loss: 4,450
- Take profit: 4,222
- Risk-to-reward ratio: 1:3
US 500 forecast
For the US 500, the key theme at the start of the week remains the reassessment of the US interest rate path. The strong August employment report demonstrated the resilience of the US labour market and noticeably strengthened expectations of a more hawkish Fed stance. Following the data release, Treasury yields rose, while US stock indices ended Friday’s session lower.
For the stock market, this creates a contradictory situation. A strong labour market confirms the resilience of the economy and reduces immediate recession concerns, but at the same time increases the likelihood of high interest rates. Highly valued companies and the technology sector remain particularly sensitive to rising yields.
This week, investors will closely monitor US inflation data. It should give the market additional guidance regarding the Fed’s future decisions. Geopolitical tensions and high oil prices also pose a risk, as they can sustain inflation while increasing corporate costs.
An additional feature of today’s session is that the US stock market is closed on 7 September for the Labor Day holiday. Therefore, activity in the US 500 may remain subdued, with a full reaction from US investors to the new fundamental backdrop expected after trading resumes on Tuesday.
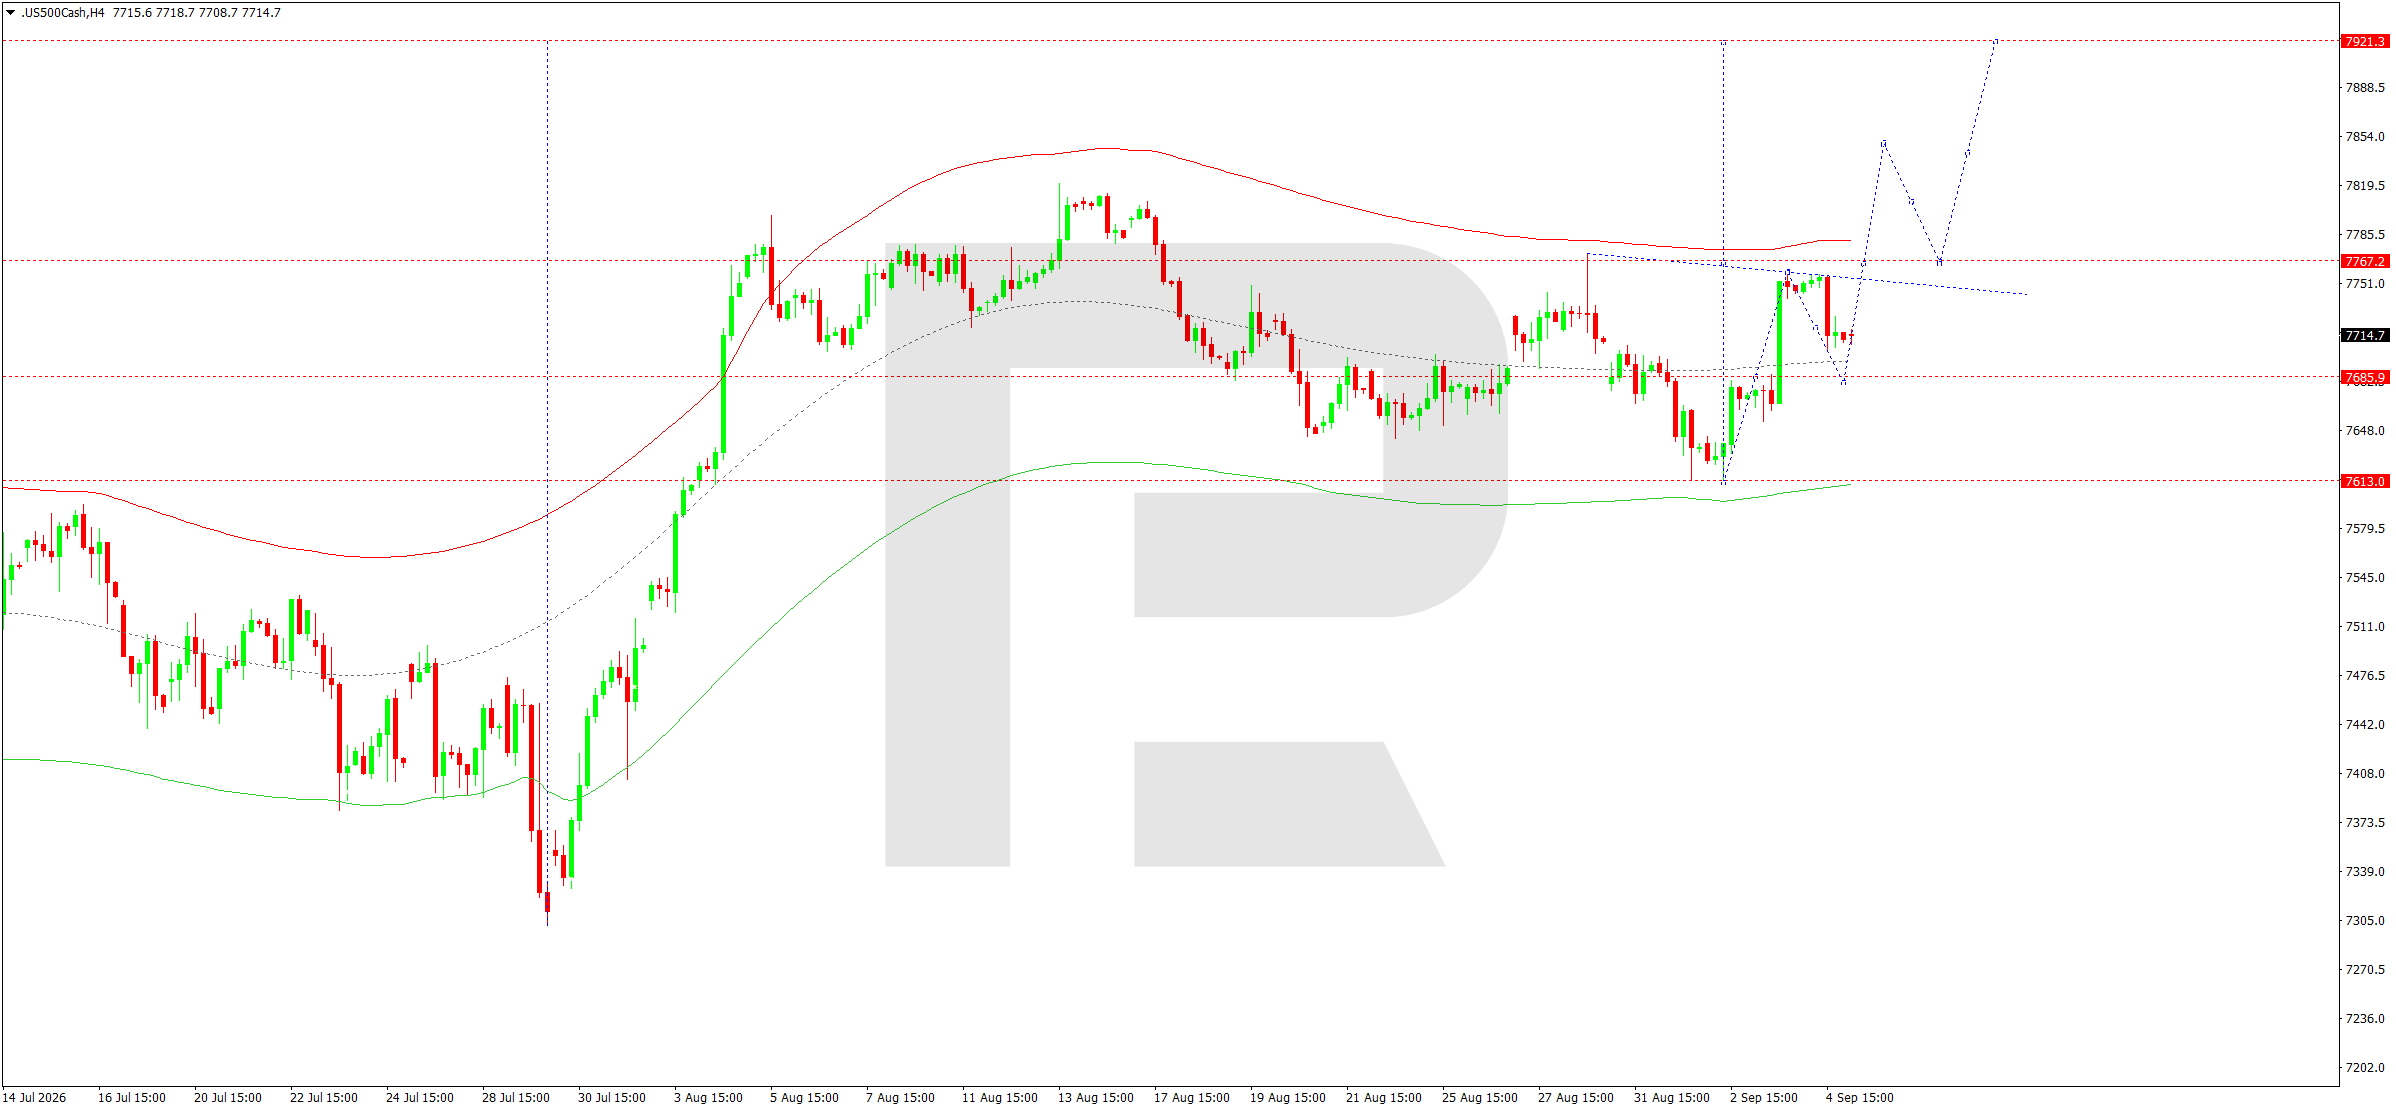
On the H4 chart, the US 500 formed a strong recovery wave after declining towards 7,613. Buyers first returned the price above 7,685 and then formed an impulse towards 7,758.
The market is currently correcting this rise and trading near 7,715–7,717. The central line of the Price Envelope runs through this area. The matrix of the current upward wave has its pivot at 7,685.
The main scenario suggests the correction will be completed near 7,685, followed by a new upward wave. The first resistance level remains at 7,767. Consolidation above this mark would open the way towards 7,848. If the upward momentum persists, a further target will be 7,921.
Thus, the decline from 7,758 is currently viewed as a technical correction rather than the start of a new downtrend. To break this structure, sellers need to gain a foothold below 7,685. In this case, a return towards 7,613 would become more likely.
Since the price is located directly above the matrix pivot, it remains preferable to look for a buy after the local correction is completed.
Trading scenario: BUY
- Price at the time of writing: 7,715
- Entry price: 7,720
- Stop loss: 7,680
- Take profit: 7,848
- Risk-to-reward ratio: 1:3
BTCUSD forecast
BTCUSD starts the week with the cryptocurrency market highly sensitive to expectations regarding US monetary policy. Strong US employment data increased the likelihood that interest rates will remain high and initially put pressure on risk assets. For Bitcoin, rising real and nominal US bond yields are a restraining factor, as they increase the attractiveness of traditional US dollar instruments.
At the same time, the cryptocurrency market’s reaction remains mixed. Comments from Fed officials had previously eased concerns about an immediate rate hike to some extent, allowing BTCUSD to recover above 80,000. However, Friday’s strong labour market report once again brought uncertainty back into investor expectations.
This week, US inflation will be the most important macroeconomic reference point. An acceleration in price pressures could strengthen expectations of higher interest rates and trigger weaker demand for cryptocurrencies. Softer figures, by contrast, could support a recovery in Bitcoin.
Geopolitical risks are also having a mixed impact. During periods of a sharp deterioration in global risk appetite, BTCUSD can still behave as a highly volatile risk asset, so rising tensions in the Middle East increase the likelihood of significant price swings.
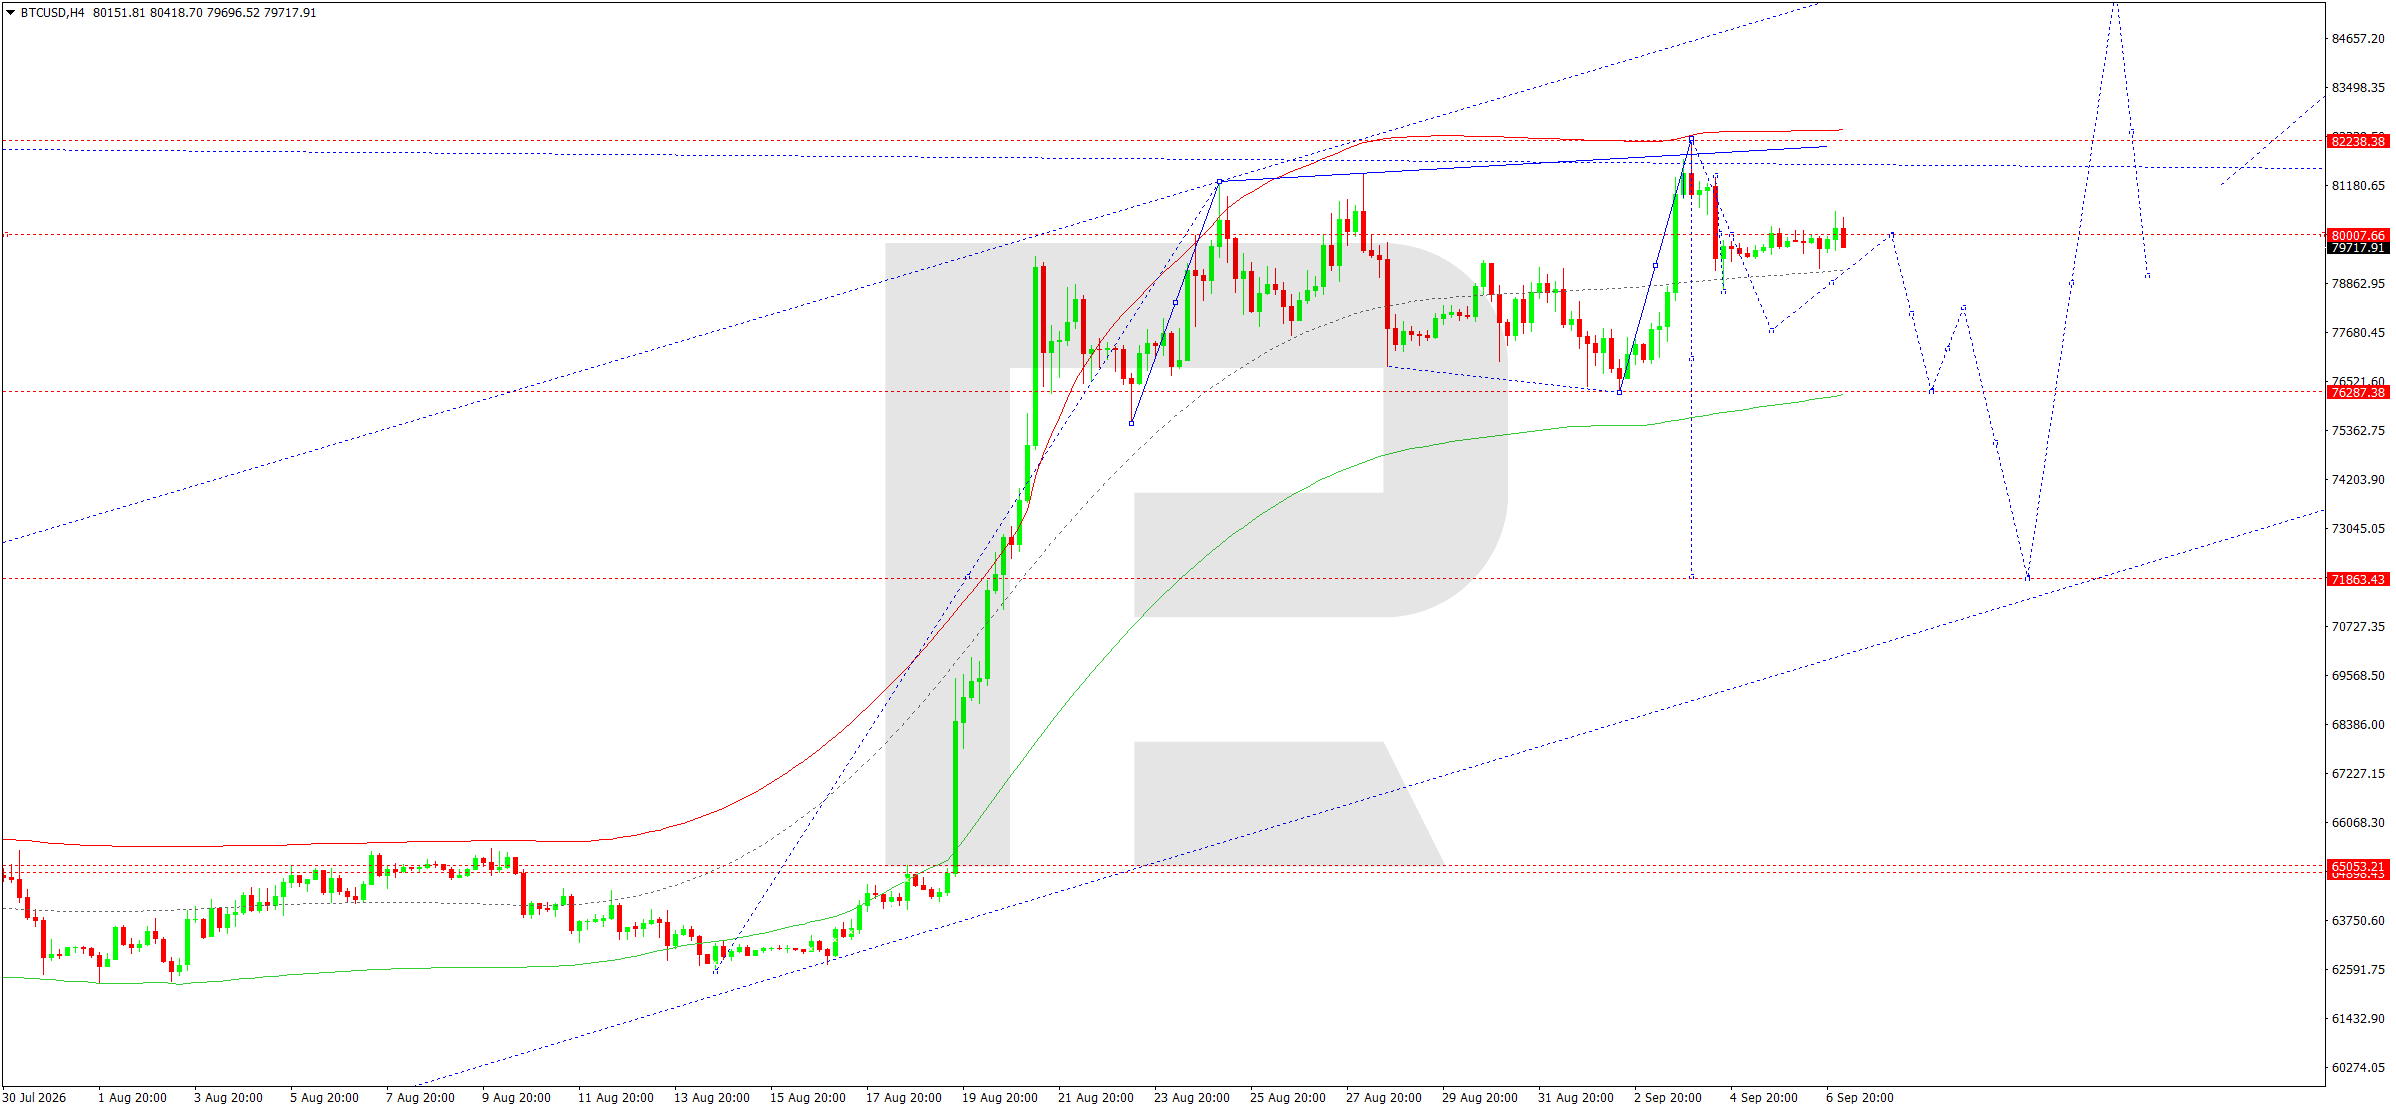
On the H4 chart, BTCUSD formed a broad range between 76,286 and 82,238 after the large August impulse. The latest upward wave reached the upper boundary of the Price Envelope in the 82,238 area, but the market failed to consolidate above it.
This was followed by a correction towards 78,678 and a new rise towards 80,475. The price is currently near 79,800 and is forming a consolidation directly below the 80,008–80,475 resistance area.
This structure maintains the possibility of another downward wave, with the first significant target at 76,286. This area is both significant horizontal support and the lower part of the local range.
The matrix of the larger upward structure retains its pivot around 71,863. Therefore, even a decline towards 76,286 would not yet fully invalidate the medium-term bullish structure. Once this target is reached, a new recovery wave towards 80,008 and then 82,238 may develop.
However, a breakout below 76,286 would significantly strengthen sellers and suggest a move directly towards 71,863. Conversely, consolidation above 80,475 would weaken the current corrective scenario, while a breakout above 82,238 would confirm a recovery in the upward momentum.
At the current stage, the balance of technical factors suggests the sell scenario from the consolidation area remains the priority.
Trading scenario: SELL
- Price at the time of writing: 79,828
- Entry price: 79,823
- Stop loss: 80,500
- Take profit: 76,286
- Risk-to-reward ratio: 1:5
Editors’ picks
 EURUSD forecast 2026–2027: technical analysis, price levels & predictions
EURUSD has recovered from the July lows and is trading near 1.1545 — back in bullish territory. The pair has reclaimed EMA65 on the daily, formed a bullish EMA crossover on H4, and the US-eurozone GDP gap has narrowed sharply (US 1.5% vs eurozone 1.0%). Goldman Sachs and Deutsche Bank both now target 1.2500 by year-end. A confirmed close above 1.1700 opens the path to 1.1805. We break down the key levels, three trading scenarios, and what the unprecedented 9-3 FOMC dissent vote means for EURUSD.
 Gold (XAUUSD) forecast 2026: technical analysis, price levels & predictions
Gold has reversed its downtrend and is trading near 4,360 USD, back above both EMA65 and EMA200. ETF flows turned positive in July with 3 billion USD of net inflows, and central banks bought 288.9 tonnes in Q2 — up 62% year-on-year. A breakout above 4,500 USD opens the path to 4,855 USD and the 5,597 USD all-time high. We break down the key levels, three trading scenarios with entry triggers, and what J.P. Morgan, Deutsche Bank and Goldman Sachs are forecasting for gold in 2026.
Forecasts presented in this section only reflect the author’s private opinion and should not be considered as guidance for trading. RoboForex bears no responsibility for trading results based on trading recommendations described in these analytical reviews.