
Daily technical analysis and forecast for 8 September 2026
Daily technical analysis and forecast for EURUSD, USDJPY, GBPUSD, AUDUSD, USDCAD, XAUUSD, US 500, and BTCUSD for 8 September 2026.
Each scenario on this page reflects the market structure on the H4 chart as of 10:00 UTC+3 on 8 September 2026. The assessment considers the current H4 chart structure, key support and resistance levels, the direction of the medium-term movement, and the prevailing fundamental backdrop.
EURUSD forecast
As of 8 September 2026, the fundamental backdrop for EURUSD remains mixed, but the balance of risks is gradually shifting towards continued pressure on the pair following the euro’s local recovery. The European Central Bank approaches its 10 September meeting with eurozone inflation having accelerated to 3.3% in August from 2.9% in July. Energy prices made the main contribution, while core inflation slowed to 2.4%. The market has almost fully priced in a 25-basis-point increase in the deposit rate to 2.50%, meaning the tightening itself is already largely reflected in prices. Improved investor sentiment in the eurozone and resilient economic activity provide additional support to the euro.
At the same time, oil rising to multi-week highs is increasing inflation risks and worsening the outlook for real consumption in Europe. For the dollar, the key factor remains the Federal Reserve.
Following the strong August employment report, which showed an increase of 162,000 jobs and unemployment at 4.1%, the market again raised the probability of a September rate hike. However, the dollar is being restrained by expectations ahead of US inflation data and partial profit-taking on long positions. The short-term rate-expectation differential is also important: a possible ECB hike is already almost fully priced in, while the market’s reaction to US inflation could materially alter the probability of a Fed move.
Therefore, even if the ECB maintains hawkish rhetoric, the euro will need a new macroeconomic impulse to consolidate sustainably above the nearest technical resistance levels.
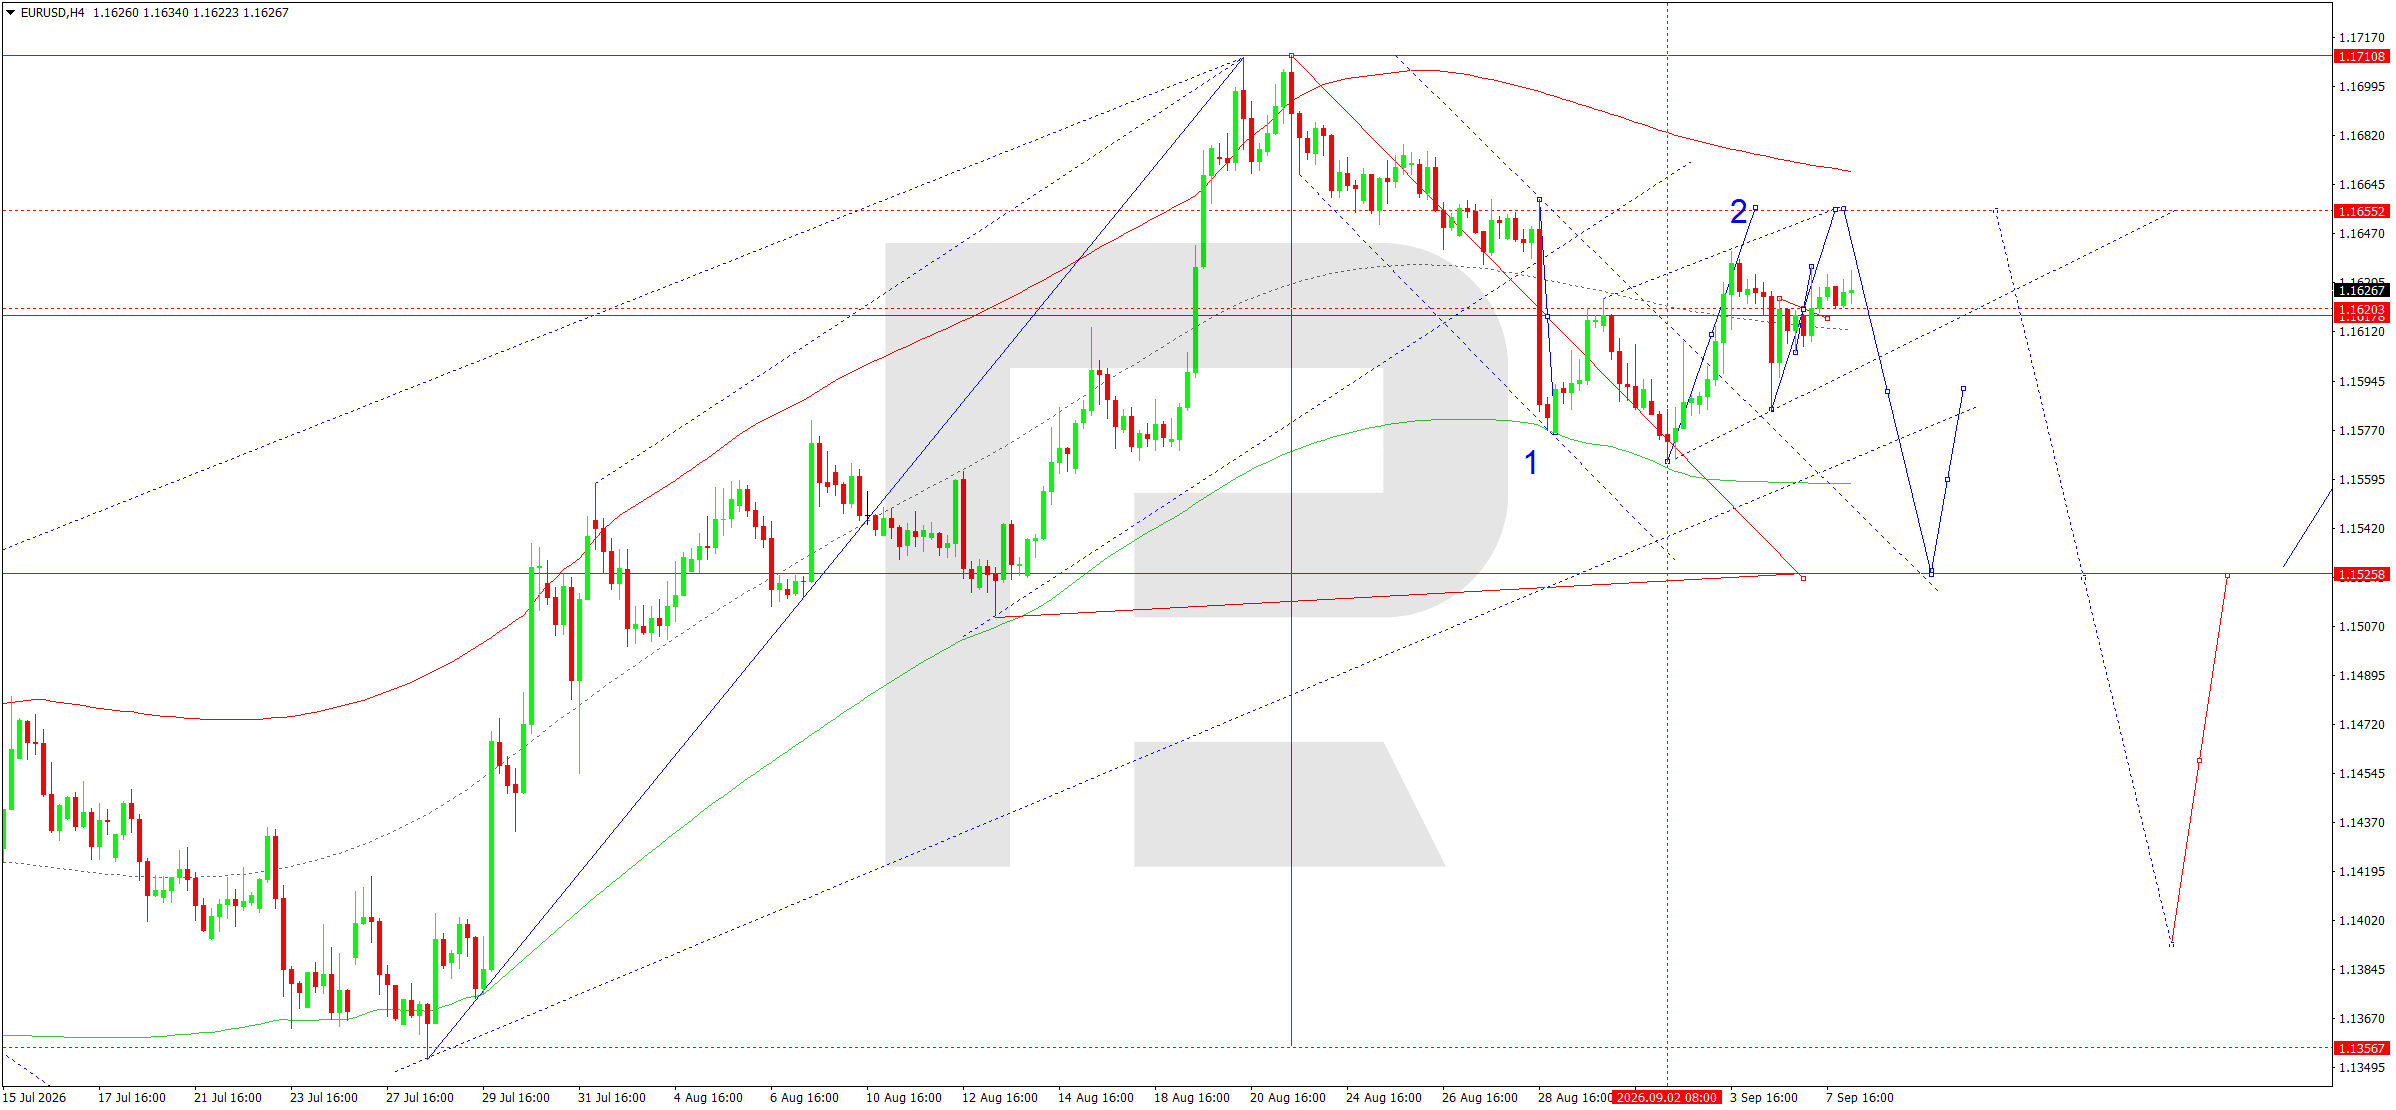
On the EURUSD H4 chart, after declining from the 1.1711 area, the market formed a local recovery wave and returned to the 1.1620–1.1635 zone. The current price near 1.1627 is directly above the matrix pivot at 1.1618 and around the central line of the Price Envelope. The structure of recent sessions resembles a corrective recovery within a broader downward wave. The nearest resistance is 1.1637, and a breakout above it could extend the correction towards 1.1655. This area coincides with the upper part of the local channel and is viewed as a zone where supply may strengthen again.
The main scenario for 8 September suggests that the corrective rise will end within the 1.1637–1.1655 range, followed by the return of sellers. A move below 1.1605 would confirm the development of the next downward impulse and open the way towards 1.1570 and then the key target at 1.1525. The 1.1525 level is considered the first completed target of the current downward wave. As long as the price remains below 1.1655, the downward structure retains priority. Consolidation above 1.1655 would temporarily invalidate the immediate downside scenario and open the way towards 1.1711, although this remains the alternative scenario for now.
EURUSD forecast scenario
Trading scenario: SELL
- Price at the time of writing: 1.1627
- Entry price: 1.1622
- Stop loss: 1.1660
- Take profit: 1.1525
- Risk-to-reward ratio: 1:3
The trade idea is until 8:00 AM on 9 September 2026 (server time, UTC+3).
USDJPY forecast
The fundamental backdrop for USDJPY on 8 September 2026 remains predominantly favourable for the Japanese yen. The Bank of Japan has noticeably strengthened its rhetoric on further policy normalisation. Governor Kazuo Ueda confirmed that a rate hike will be discussed at the September meeting if inflation risks continue to increase. Further support comes from an upward revision to Japan’s second-quarter GDP growth and accelerating real wages, which reduce concerns about the economy’s ability to withstand tighter financial conditions.
Against this backdrop, the yen reached seven-month highs, while short-covering and the unwinding of carry trades are increasing the magnitude of the move.
On the US side, the dollar is supported by a strong labour market: August employment increased by 162,000, while the probability of a September rate hike by the Federal Reserve rose noticeably. However, this factor has so far failed to offset the reassessment of the BOJ outlook. Rising oil prices and geopolitical tensions in the Middle East are adding to market nervousness. Higher Japanese government bond yields also reflect expectations of a higher BOJ policy rate.
At the same time, yen appreciation has itself become an independent factor through the closing of speculative short positions. Therefore, even strong US data may provide the dollar mainly with corrective support while the market continues to price in a further narrowing of the interest rate differential between the US and Japan. Volatility remains elevated ahead of meetings by both central banks.
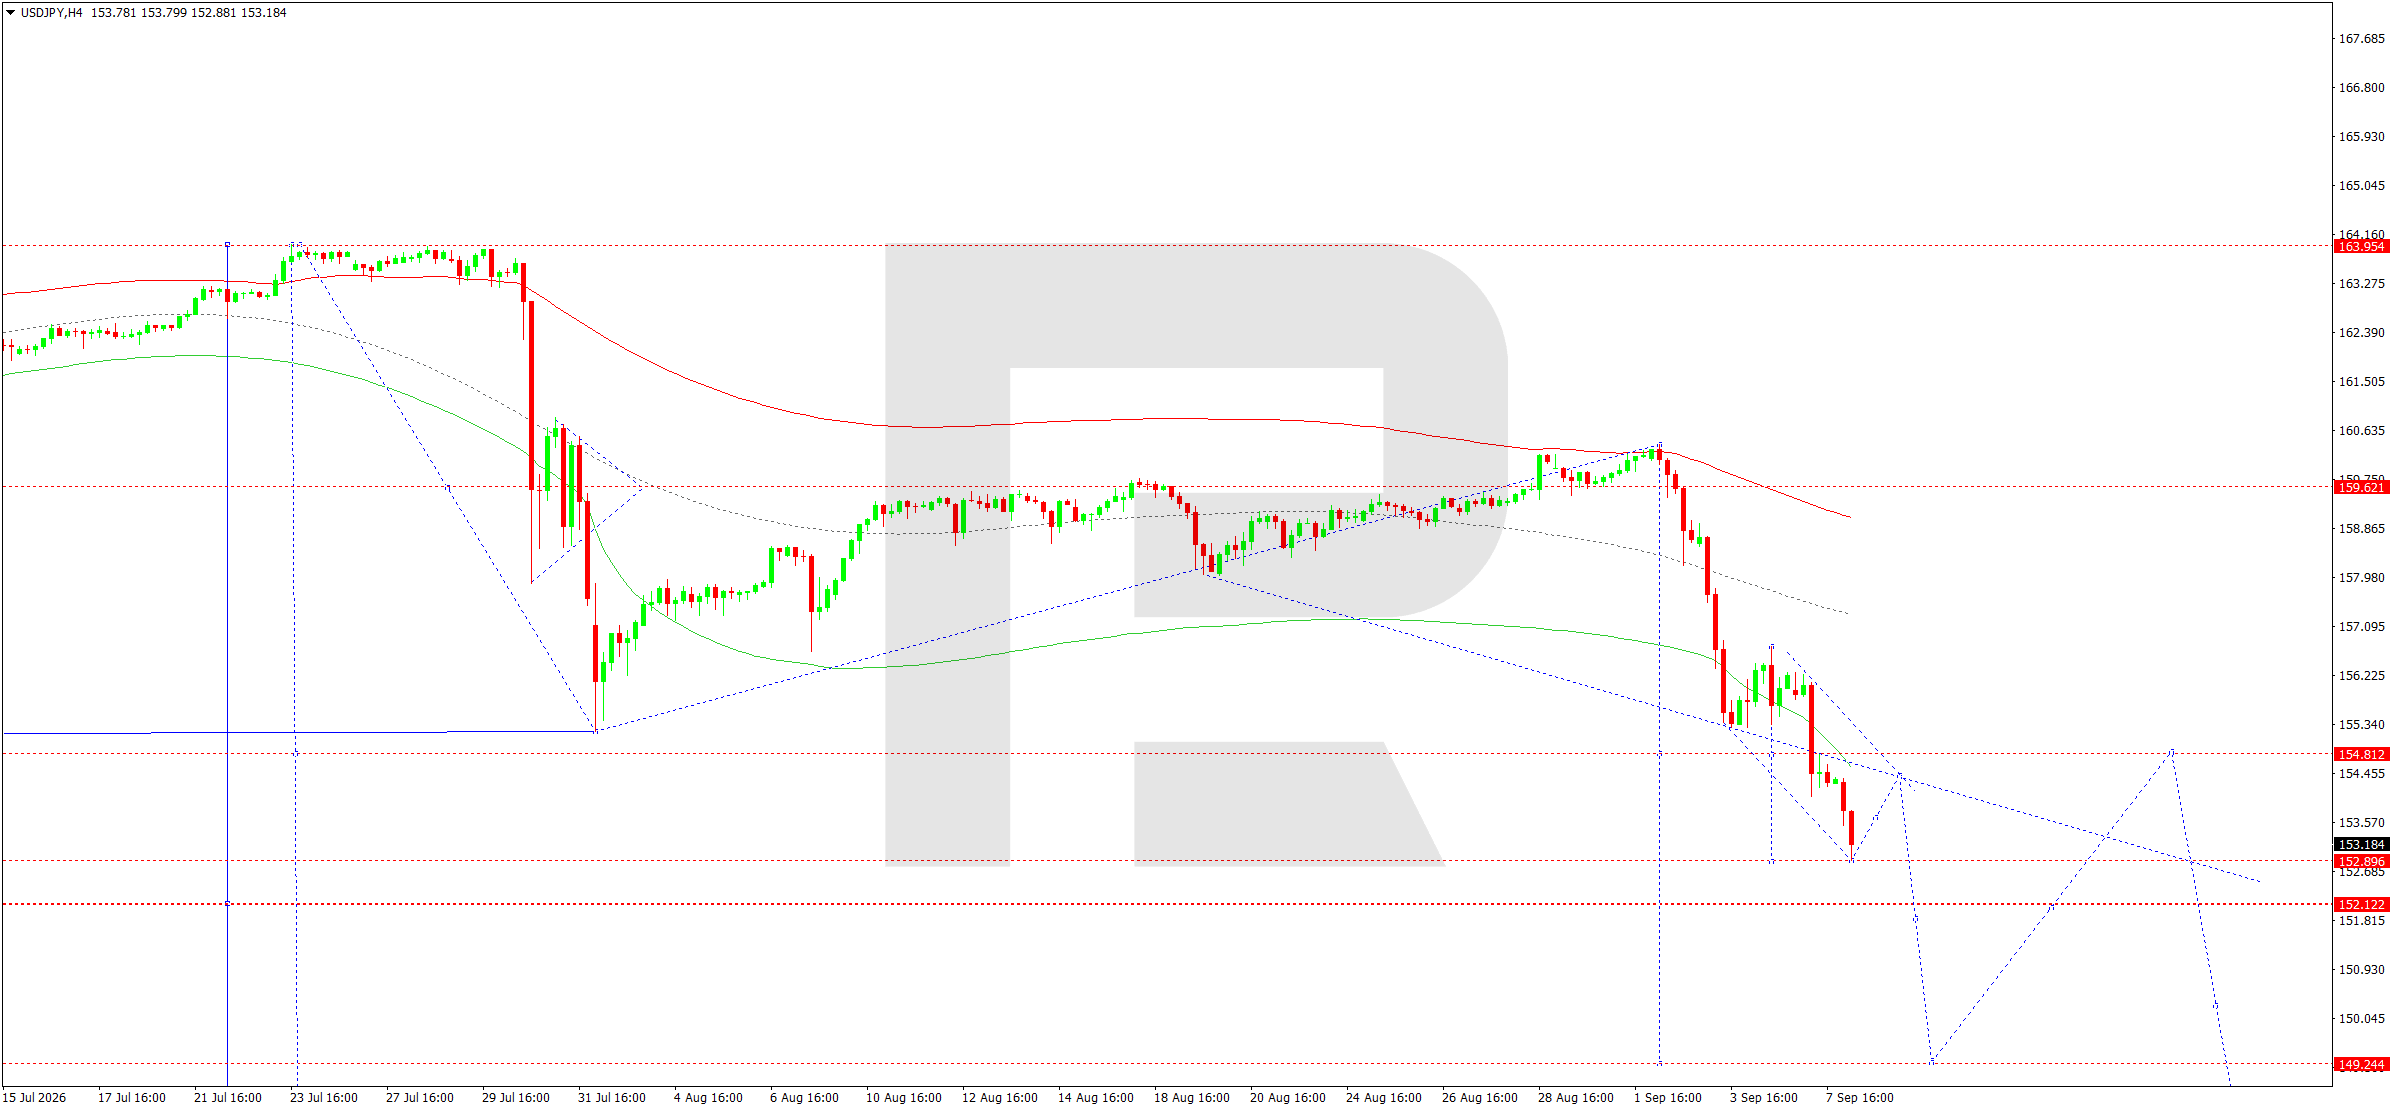
On the H4 chart, the downward wave in USDJPY remains dominant. After rebounding from the 159.60–160.60 area, the market successively broke through several key levels and reached the lower boundary of the Price Envelope near 152.88. The current price around 153.18 is slightly above this support, so consolidation or a corrective rebound is likely over the coming hours. The Elliott wave structure allows for a recovery towards 154.00–154.82, which would be viewed as a technical retest from below of the previously broken area.
The matrix of the downward wave, with a pivot around 155.81, continues to point to sustained bearish momentum. As long as the price remains below 154.82, any recovery looks corrective. Once the local correction is complete, the main scenario envisages another decline towards 152.88 and then 152.12. A breakout below 152.12 would confirm an extension of the wave and open the way towards the main local target at 149.25.
An alternative scenario would emerge only if the price returns firmly above 154.82, after which the market could continue the correction towards 155.80–156.20. However, given the slope of the channels, the price position relative to the Price Envelope’s median lines and the overall momentum, the main H4 trend remains downward.
USDJPY forecast scenario
Trading scenario: SELL
- Price at the time of writing: 153.18
- Entry price: 153.13
- Stop loss: 154.82
- Take profit: 149.25
- Risk-to-reward ratio: 1:2
The trade idea is until 8:00 AM on 9 September 2026 (server time, UTC+3).
GBPUSD forecast
The fundamental backdrop for GBPUSD on 8 September 2026 is being shaped by simultaneously hawkish expectations for both UK and US monetary policy. The Bank of England is keeping rates unchanged, but Chief Economist Huw Pill said last week that a timely rate increase could reduce the risk of more aggressive tightening later if inflationary pressure, intensified by rising energy prices, becomes persistent. The market currently sees the probability of a September hike as limited, but expectations of tighter policy at subsequent meetings are supporting the pound.
Another moderately positive factor is evidence of stabilisation in the UK labour market: recruitment-sector data pointed to the first increase in permanent hiring in several years. At the same time, uncertainty surrounding UK fiscal policy and rising fuel costs persists, limiting sterling’s upside potential. In the US, the strong August employment report again strengthened expectations of a Federal Reserve rate hike, while Treasury yields remain high. Ahead of the US inflation release, however, the dollar is trading without sustained momentum.
Expensive energy remains a significant external risk for the UK: it supports inflation while simultaneously worsening the outlook for domestic demand. This limits the Bank of England’s ability to pursue a prolonged rate-hiking cycle. Therefore, the pound’s short-term resilience largely depends on whether US inflation confirms or challenges expectations of renewed Fed tightening and persistently high US yields.
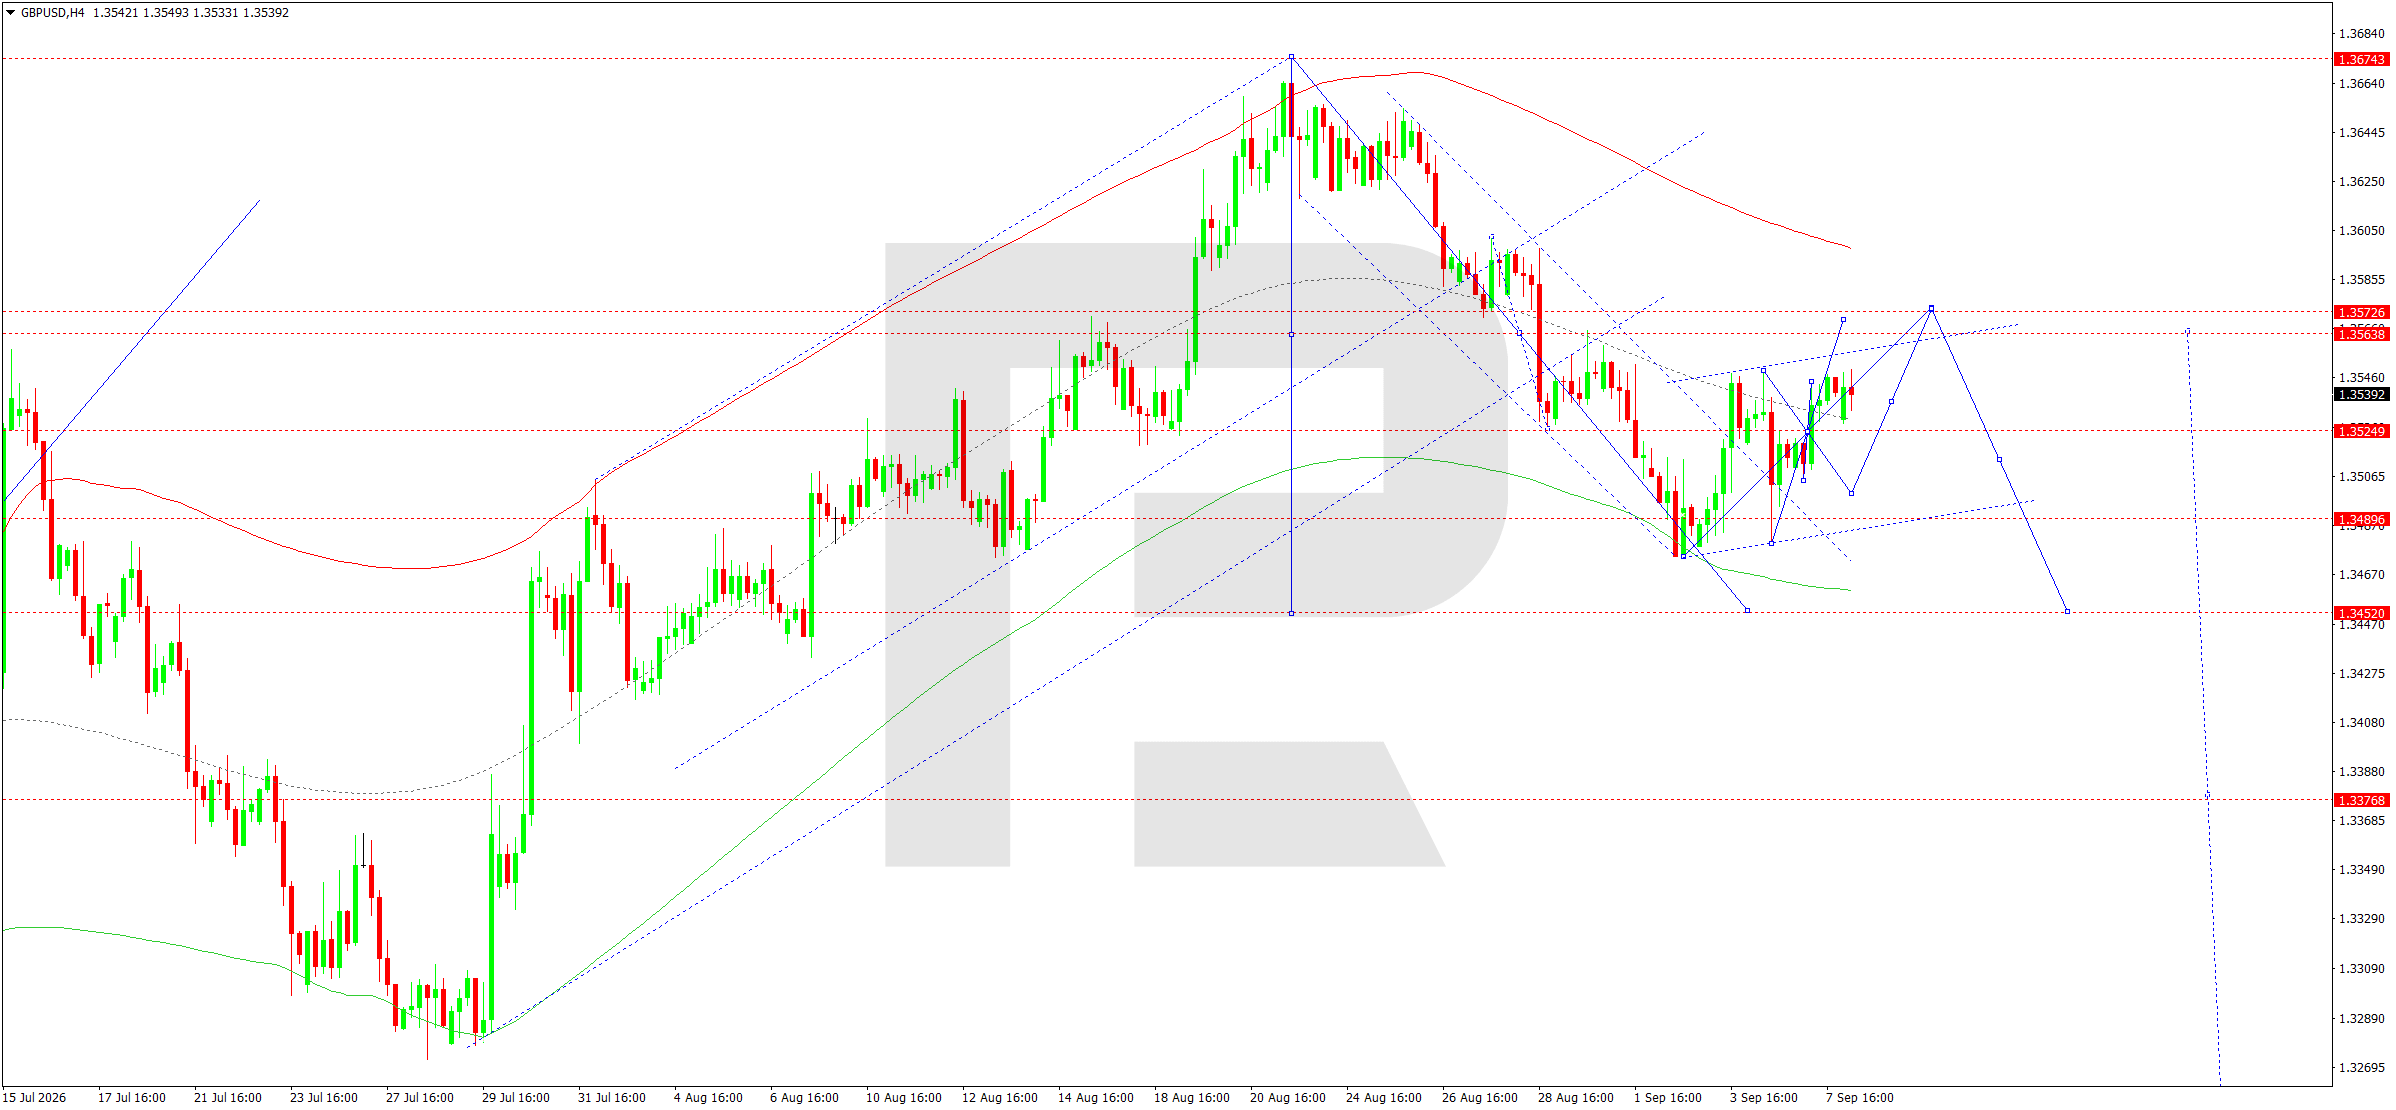
On the H4 chart, after declining from the 1.3674 high, GBPUSD formed a local base around 1.3475–1.3490 and completed a corrective upward wave towards 1.3548. The price is now near 1.3539 and is again consolidating around 1.3529. The structure is consistent with a correction within a broader downward wave. The nearest resistance zone is located at 1.3564–1.3573. A test of this area from below could complete the corrective phase and create conditions for sellers to return.
The matrix of the downward wave, with its pivot around 1.3555, maintains a bearish bias. As long as the price does not consolidate above 1.3573, the main scenario suggests a decline first towards 1.3500 and 1.3490. After a possible retest of the 1.3560–1.3570 area, a new impulse towards the lower boundary of the Price Envelope at 1.3452 is expected. A breakout below 1.3452 would extend the downside potential towards 1.3377. To invalidate this scenario, the market needs to consolidate firmly above 1.3573 and return the price to the previous upward channel. Until then, any rise should be viewed mainly as corrective, while the main H4 trend remains downward.
GBPUSD forecast scenario
Trading scenario: SELL
- Price at the time of writing: 1.3539
- Entry price: 1.3534
- Stop loss: 1.3574
- Take profit: 1.3452
- Risk-to-reward ratio: 1:2
The trade idea is until 8:00 AM on 9 September 2026 (server time, UTC+3).
AUDUSD forecast
The fundamental picture for AUDUSD on 8 September 2026 combines support for the Australian dollar from hawkish rate expectations with growing risks to domestic demand. At its August meeting, the Reserve Bank of Australia kept the rate unchanged at 4.35% but discussed the possibility of another increase, as underlying inflation remains above a comfortable trajectory. The latest Westpac Consumer Sentiment Index fell by 5.2% in September to 84.4, almost completely reversing the improvement seen in August.
High interest rates, rising fuel prices and weakness in the housing market are increasing pressure on households. These factors limit the scope for sustained Australian dollar appreciation despite expectations of potentially tighter RBA policy.
The external backdrop is also mixed. Improving Chinese exports and the relative resilience of Asian markets are supporting commodity currencies, while rising oil prices and geopolitical tensions are increasing global inflation risks. Following the strong August employment report, the Federal Reserve has again moved closer to a possible September rate hike.
The US dollar weakened somewhat ahead of the inflation data, temporarily helping AUDUSD. China remains an important additional factor, as Chinese demand directly affects expectations for Australian commodity exports. Improving Chinese export figures support the AUD, while weakness in some domestic indicators of the Chinese economy keeps sentiment cautious. Therefore, the Australian dollar receives fundamental support mainly on declines, while moves towards resistance require a more sustained improvement in global risk appetite.
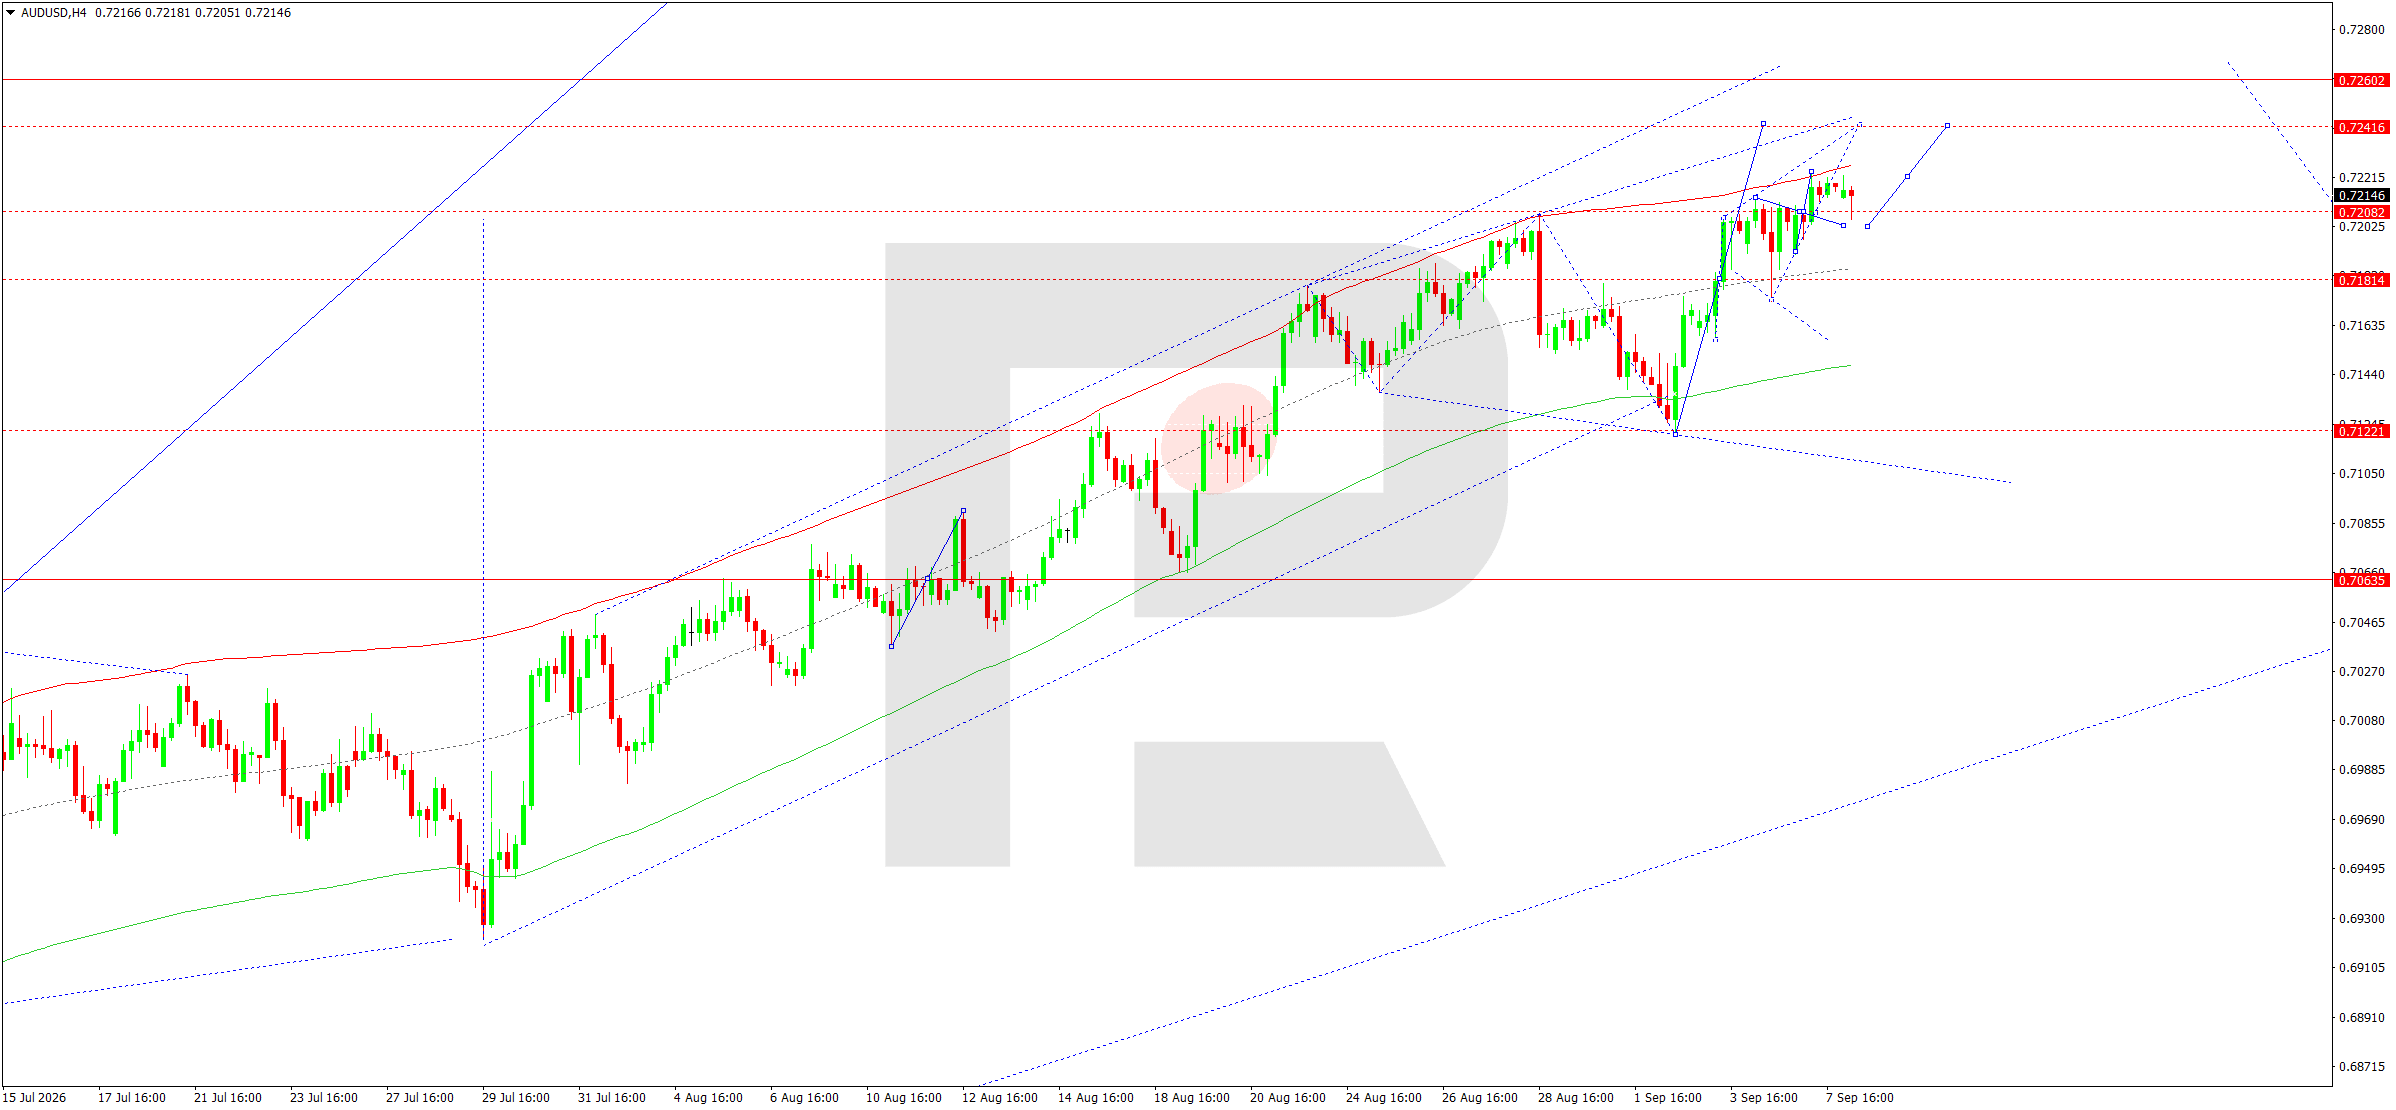
On the H4 chart, after a confident rise from the 0.7122 area, AUDUSD formed an impulse towards 0.7220–0.7225 and moved into a compact consolidation. The current price near 0.7215 is above the matrix pivot at 0.7181 but directly below the local resistance zone at 0.7223–0.7241. The wave structure allows for another extension of the corrective rise towards 0.7241, although this area is viewed as a likely zone where the current upward leg may end.
The main scenario suggests a reversal below 0.7241 followed by a decline. The first confirmation would be a move below 0.7205, opening the way towards 0.7181 and 0.7171. A breakout below 0.7171 would strengthen the bearish momentum and create conditions for a move towards the main target at 0.7122. The upper boundary of the broader range is located near 0.7260; only consolidation above it would invalidate the downside scenario and indicate a recovery of the sustained upward trend. Until then, the current rise is viewed as the final part of the correction, with preference shifting to selling from the upper part of the range once a signal forms.
AUDUSD forecast scenario
Trading scenario: SELL
- Price at the time of writing: 0.7215
- Entry price: 0.7210
- Stop loss: 0.7243
- Take profit: 0.7122
- Risk-to-reward ratio: 1:3
The trade idea is until 8:00 AM on 9 September 2026 (server time, UTC+3).
USDCAD forecast
The fundamental backdrop for USDCAD on 8 September 2026 is moderately favourable for the Canadian dollar. At its 2 September meeting, the Bank of Canada kept the key interest rate unchanged at 2.25% but noticeably hardened its rhetoric. Governor Tiff Macklem said the regulator was prepared to raise rates, repeatedly if necessary, if inflation remained too high. Annual inflation in Canada reached 3%, with more expensive energy being the main source of pressure amid the conflict involving Iran. Rising oil prices provide additional support to the Canadian dollar: Brent is trading near six-week highs, while risks to supplies through the Persian Gulf region remain.
At the same time, trade disputes with the US and new tariff threats create risks for Canadian exports and limit CAD appreciation. On the US dollar side, the strong August employment report increased the probability of tighter policy by the Federal Reserve. However, ahead of the inflation release, the dollar is not showing sustained growth. The current difference in rate expectations does not give the US dollar a clear advantage: the Fed may also raise rates, but for CAD, higher oil prices simultaneously improve the external trade backdrop and strengthen the Bank of Canada’s case against overly accommodative policy. Therefore, the pair’s reaction to oil prices and US inflation over the coming sessions may be stronger than to ordinary domestic Canadian indicators. Volatility is also rising because of the pair’s sensitivity to the oil market.
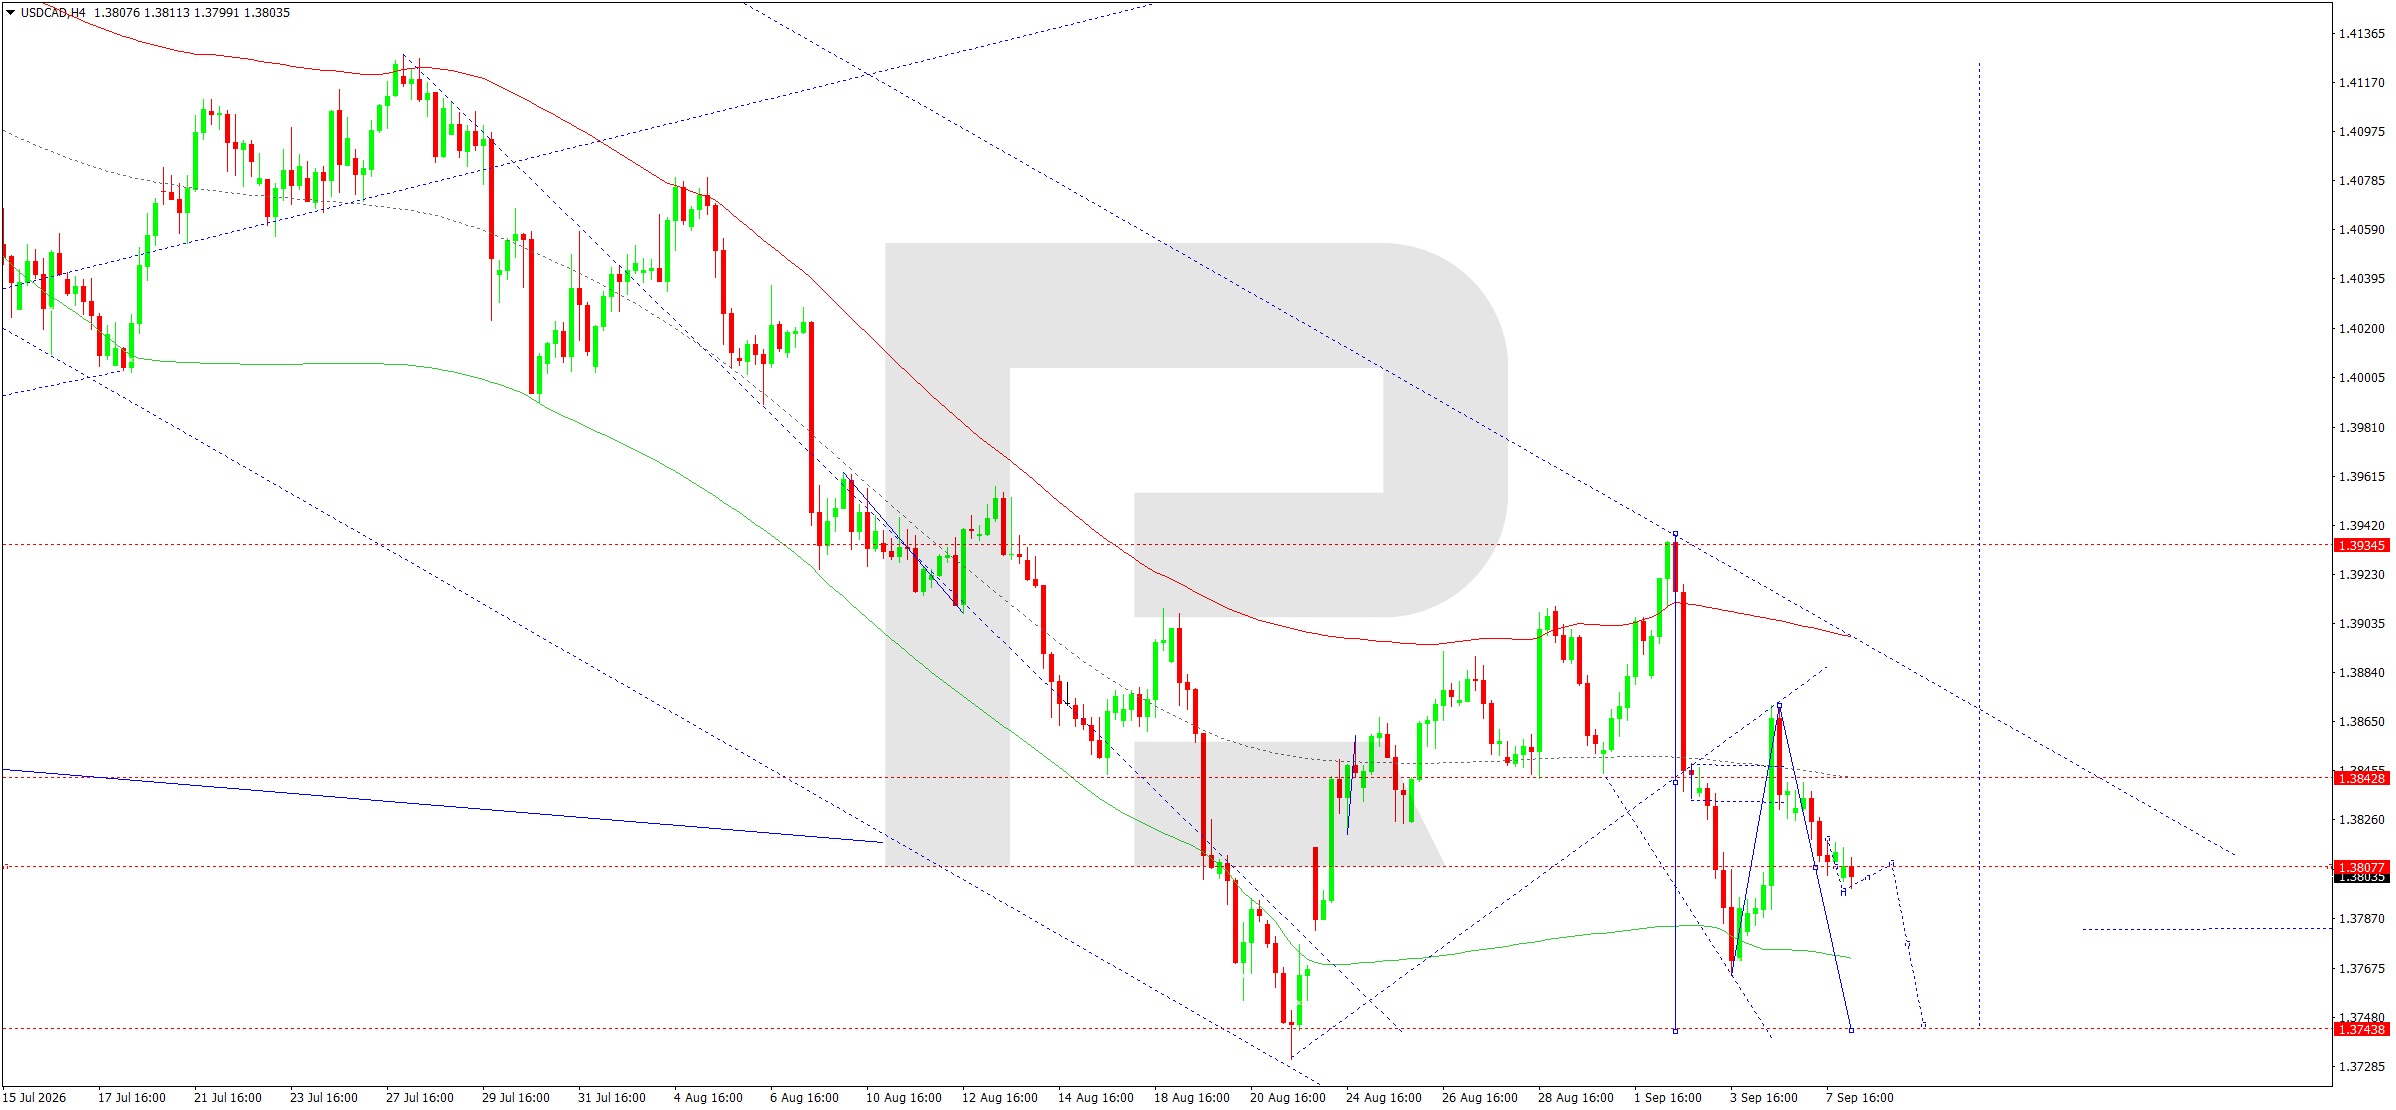
On the H4 chart, USDCAD continues to form a downward structure after rebounding from the 1.3935 area. The latest upward correction ended near 1.3865, after which the price returned towards 1.3800. The current quote near 1.3804 is below the matrix pivot at 1.3840 and beneath the central part of the Price Envelope, preserving the sellers’ advantage. The nearest local resistance zone is 1.3808–1.3843.
During the day, a compact consolidation around 1.3800 is likely. A brief move higher could lead to a test of 1.3843–1.3850, but as long as the price remains below this area, such a rise will be viewed as corrective.
The main scenario suggests a breakout below 1.3780 and a continuation of the decline towards 1.3747–1.3744, where the lower boundary of the current structure lies. Reaching this area may complete the local downward wave and create conditions for a deeper upward correction towards 1.3840 and later 1.3939. Therefore, the current trading idea is focused specifically on completing the nearest downward leg. Consolidation above 1.3850 would invalidate the immediate sell scenario and indicate an early start to the recovery wave.
USDCAD forecast scenario
Trading scenario: SELL
- Price at the time of writing: 1.3804
- Entry price: 1.3799
- Stop loss: 1.3825
- Take profit: 1.3747
- Risk-to-reward ratio: 1:2
The trade idea is until 8:00 AM on 9 September 2026 (server time, UTC+3).
XAUUSD forecast
The fundamental backdrop for XAUUSD on 8 September 2026 remains contradictory. On the one hand, gold is supported by a weaker US dollar and a high geopolitical risk premium. Tensions involving Iran persist, oil prices have risen to six-week highs, and risks to energy infrastructure in the Persian Gulf are supporting demand for safe-haven assets. On Tuesday, gold again rose above 4,430 as the US Dollar Index declined. On the other hand, the strong August US labour market report significantly increased the probability of a Federal Reserve rate hike in September.
Rising Treasury yields and expectations of tighter policy are restraining factors for the non-yielding precious metal. The market is now focusing on upcoming US producer and consumer inflation data. Higher inflation would strengthen expectations of a rate hike and could put renewed pressure on gold, while softer readings would support buyers.
It is also important to note that gold is currently trading in an environment of heightened sensitivity to real yields. If nominal yields continue to rise faster than inflation expectations, pressure on the metal will increase. If geopolitical risks once again lead to a weaker US dollar and stronger demand for safe-haven assets, buyers may be able to hold the 4,400 area even amid hawkish Fed rhetoric. Therefore, ahead of the US inflation release, the market may remain particularly sensitive to changes in yields and Middle East news, maintaining a wide intraday range.
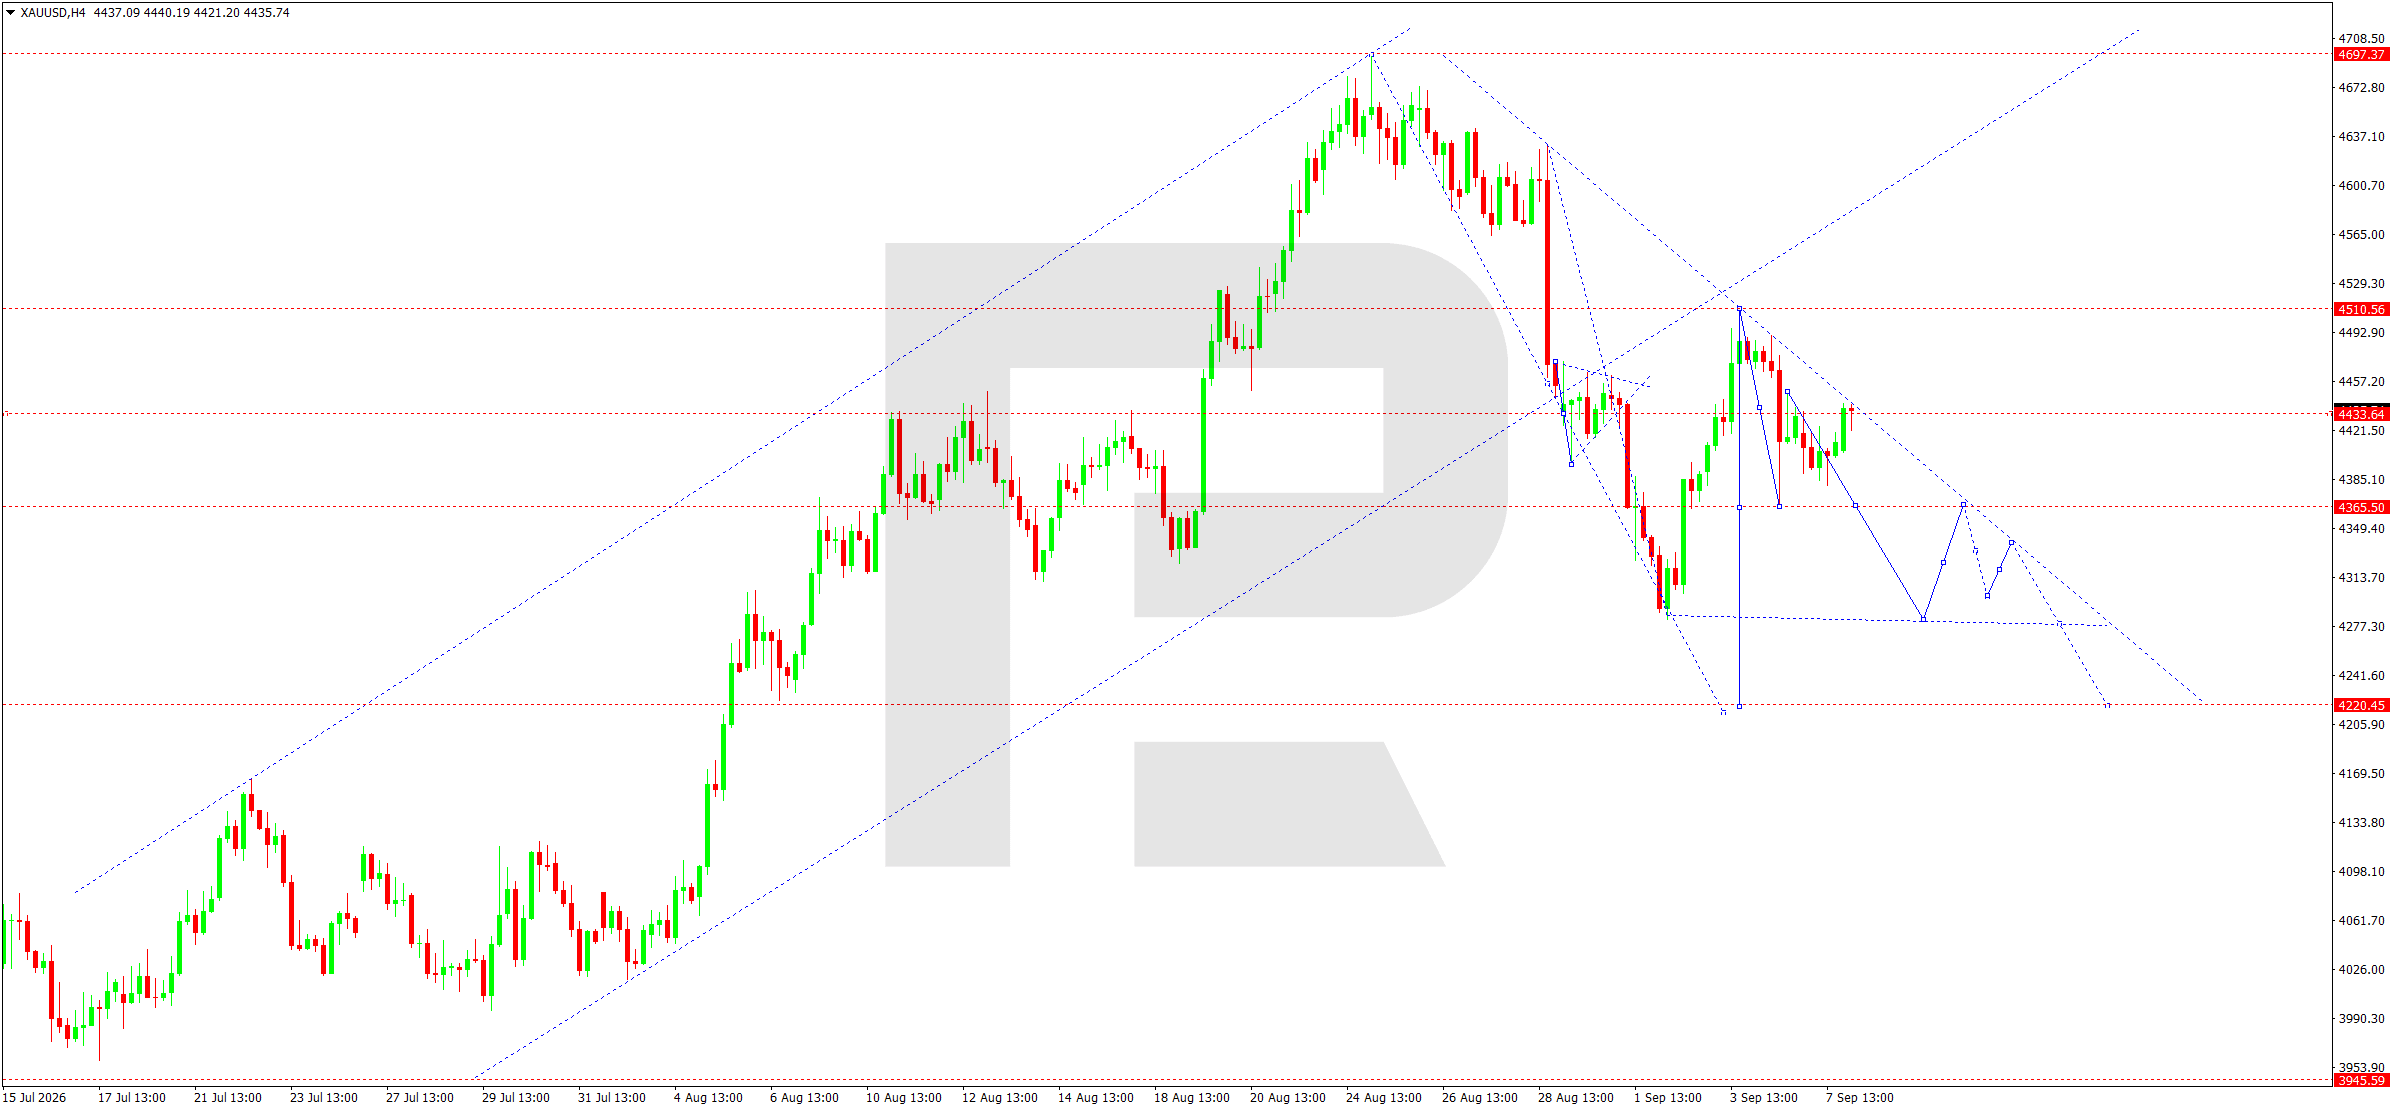
On the H4 chart, after forming a high near 4,697, XAUUSD moved into a pronounced correction. The subsequent recovery towards 4,510 failed to return the price to the previous upward channel, after which a new sequence of lower highs formed. The price is now near 4,436, almost in the centre of the local range around 4,433. The matrix of the downward wave, with its pivot at 4,433, maintains a bearish bias, while the nearest resistance remains the 4,510 area.
The main scenario suggests the current consolidation will end with a downside breakout. The first target is 4,365. Consolidation below this level would open the way towards 4,280 and then the lower boundary of the Price Envelope at 4,220–4,222. This area is considered the first significant target of the current downward wave. Once it is reached, a technical correction back towards 4,365–4,433 is likely. If 4,220 fails to hold, the downward structure may extend towards 4,145.
An alternative scenario would emerge if the price consolidates above 4,510; in that case, the correction could continue towards 4,600 and 4,697. As long as the price remains below 4,510, the downside retains priority.
XAUUSD forecast scenario
Trading scenario: SELL
- Price at the time of writing: 4,436
- Entry price: 4,431
- Stop loss: 4,512
- Take profit: 4,222
- Risk-to-reward ratio: 1:3
The trade idea is until 8:00 AM on 9 September 2026 (server time, UTC+3).
US 500 forecast
The fundamental backdrop for the US 500 on 8 September 2026 remains mixed and sensitive to interest rate expectations. The strong August US employment report showed an increase of 162,000 jobs, with unemployment at 4.1%, which significantly increased the probability of a Federal Reserve rate hike at the September meeting.
Following the release, the yield on two-year Treasury notes rose to around 4.37%, while the ten-year yield climbed towards 4.78%, putting pressure on equity valuations, particularly in the technology segment. At the same time, markets are awaiting inflation data, which should determine how persistent the new tightening cycle may be.
An additional risk comes from the sharp rise in oil and diesel prices amid escalating tensions involving Iran. More expensive energy increases corporate costs and may slow consumer activity. At the same time, the US economy remains resilient, while the absence of a sharp deterioration in corporate expectations supports demand for equities on declines.
The key question for the index is whether growth in corporate earnings can offset the higher discount rate. As long as the labour market remains strong, an immediate recession scenario looks less likely, supporting cyclical companies. However, the combination of oil near local highs and ten-year Treasury yields close to 4.8% makes further multiple expansion difficult without softer inflation data. Therefore, the fundamental backdrop does not provide a clear one-sided signal and implies increased sensitivity of the index to US macroeconomic data.
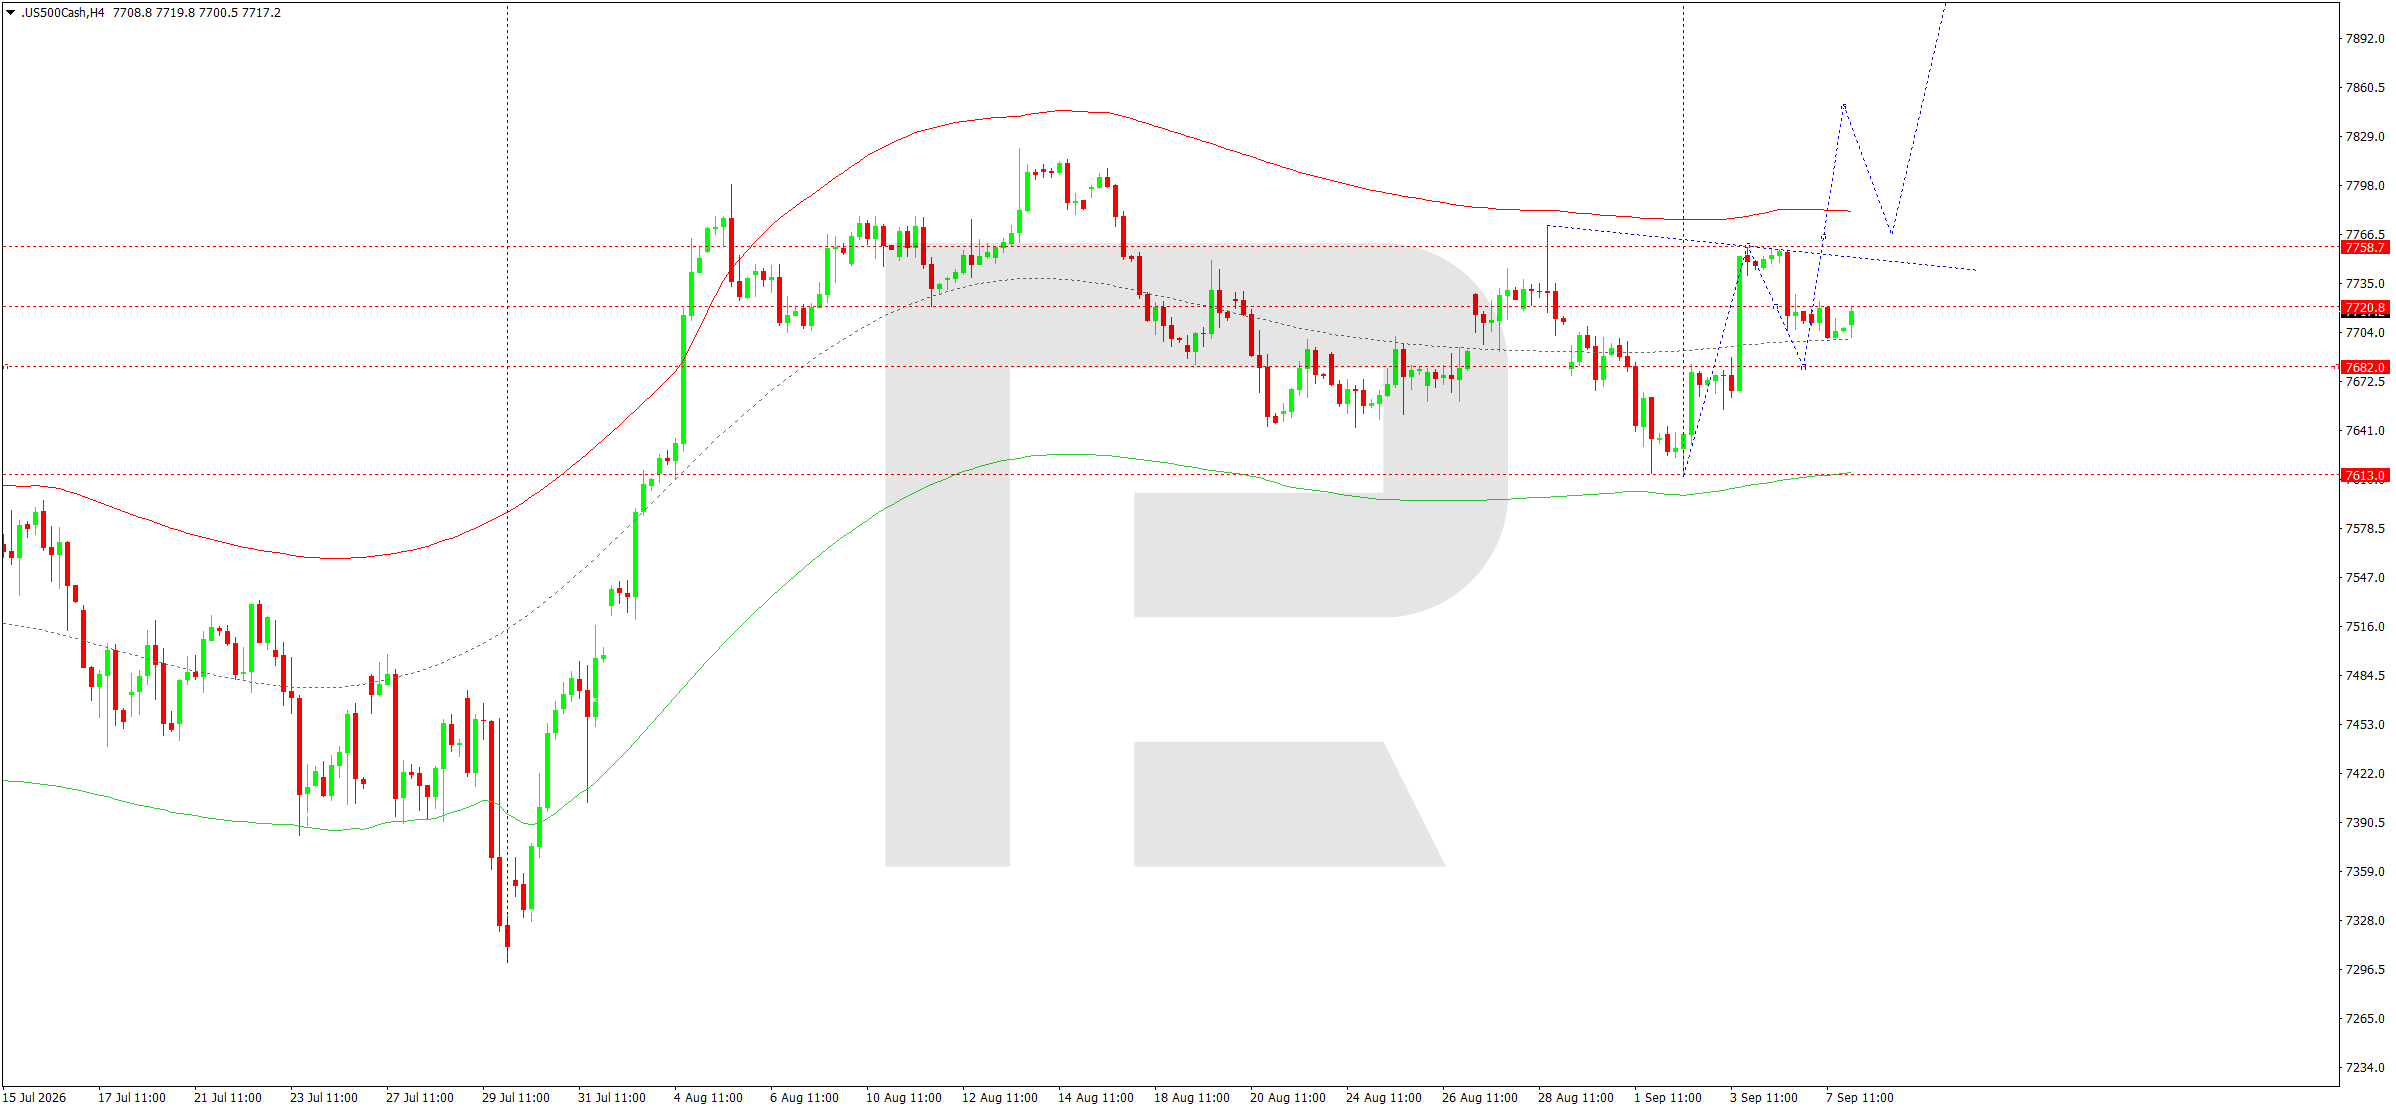
On the H4 chart, after declining towards 7,613, the US 500 formed a recovery impulse and reached the 7,759 area. This was followed by a correction towards 7,682, after which the index stabilised again near 7,717–7,720. The current structure looks like consolidation in the central part of the Price Envelope. The matrix of the upward wave, with a pivot near 7,685, retains a moderately bullish bias as long as the price holds above 7,682.
During the next session, another test of the 7,685–7,682 area is possible. If buyers hold this zone, a new impulse towards 7,759 is likely. Consolidation above 7,759 would confirm the continuation of the upward wave and open the way towards 7,848, which remains the main target of the current structure. An intermediate consolidation around 7,800–7,830 is possible within the move. An alternative scenario would form if the price falls below 7,682.
In this case, the index could head back towards 7,613, where key support and the lower part of the current range are located. As long as this level is not broken, the decline is viewed as a correction, while the main scenario remains focused on a resumption of growth after the matrix pivot area holds.
US 500 forecast scenario
Trading scenario: BUY
- Price at the time of writing: 7,717
- Entry price: 7,722
- Stop loss: 7,680
- Take profit: 7,848
- Risk-to-reward ratio: 1:3
The trade idea is until 8:00 AM on 9 September 2026 (server time, UTC+3).
BTCUSD forecast
The fundamental backdrop for BTCUSD on 8 September 2026 remains sensitive to US dollar liquidity dynamics and expectations regarding Federal Reserve policy. Following the strong August employment report, the market significantly increased the probability of a September rate hike. Higher US bond yields traditionally limit demand for risk assets, including cryptocurrencies, by increasing the attractiveness of US dollar instruments. At the same time, the dollar weakened somewhat on the morning of 8 September ahead of the inflation data, temporarily easing pressure on Bitcoin.
Geopolitical tensions in the Middle East and rising oil prices are increasing overall uncertainty, but so far have not created clear safe-haven demand for cryptocurrencies. A supportive factor is the return of institutional interest: US spot Bitcoin ETFs recorded around 987 million USD of net inflows over the past week, extending their positive streak to a third consecutive week. At the same time, the 80,000–82,000 area remains a zone where the market encounters significant supply. An important feature of the current backdrop is the divergence between improving flows into cryptocurrency investment products and tighter macroeconomic expectations.
This combination often results not in a sustained trend, but in broad fluctuations around key levels. Therefore, for Bitcoin to continue rising, either expectations of a Fed rate hike need to weaken noticeably or a new sustained capital inflow must emerge that can absorb selling in the resistance area.
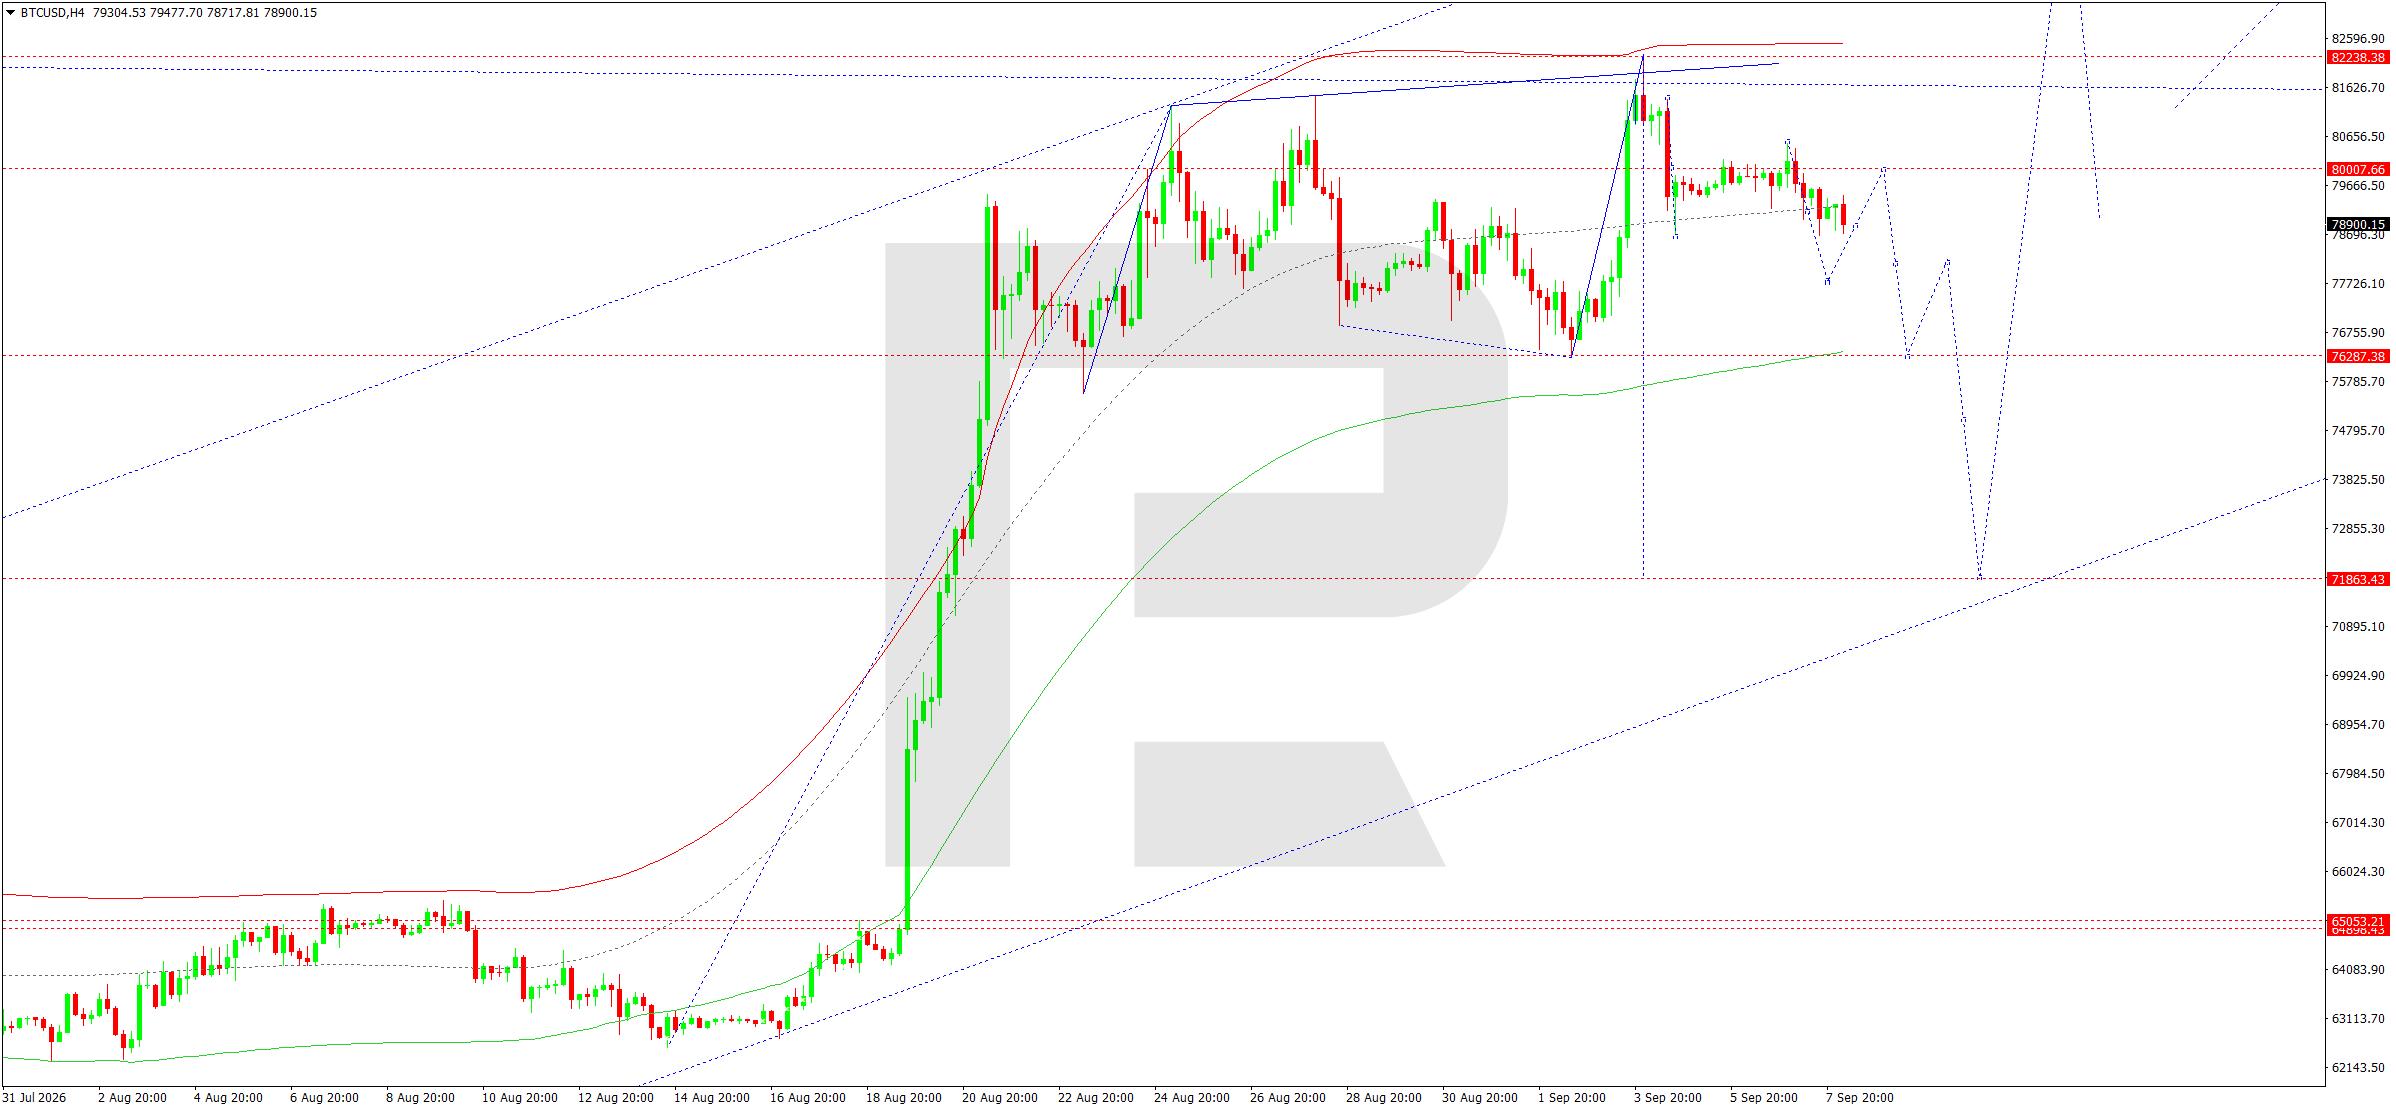
On the H4 chart, after the impulsive rise from the August lows, BTCUSD formed a high in the 82,238 area and failed to consolidate above the upper boundary of the Price Envelope. A correction followed, bringing the price back below the psychological 80,000 level. The current price near 78,900 is below the matrix pivot at 80,000 and below the local median line, preserving the sellers’ advantage.
The nearest support is the 77,800–77,700 area. A breakout below it would confirm the development of the next downward impulse towards 76,288, where an important lower boundary of the current structure is located. If 76,288 is broken, the downside potential would extend towards 71,863. At the same time, intermediate corrective rebounds towards 80,000–80,100 would not change the main scenario as long as the price fails to consolidate above this area. To restore the bullish structure, the market needs to reclaim 80,000 and then break above 82,238. Only then would the potential open for another move towards 83,000 and higher. At the current stage, the combination of lower local highs and the price remaining below the matrix pivot makes the continuation-of-decline scenario the priority.
BTCUSD forecast scenario
Trading scenario: SELL
- Price at the time of writing: 78,900
- Entry price: 78,895
- Stop loss: 80,010
- Take profit: 76,288
- Risk-to-reward ratio: 1:2
The trade idea is until 8:00 AM on 9 September 2026 (server time, UTC+3).
Editors’ picks
 EURUSD forecast 2026–2027: technical analysis, price levels & predictions
EURUSD has recovered from the July lows and is trading near 1.1545 — back in bullish territory. The pair has reclaimed EMA65 on the daily, formed a bullish EMA crossover on H4, and the US-eurozone GDP gap has narrowed sharply (US 1.5% vs eurozone 1.0%). Goldman Sachs and Deutsche Bank both now target 1.2500 by year-end. A confirmed close above 1.1700 opens the path to 1.1805. We break down the key levels, three trading scenarios, and what the unprecedented 9-3 FOMC dissent vote means for EURUSD.
 Gold (XAUUSD) forecast 2026: technical analysis, price levels & predictions
Gold has reversed its downtrend and is trading near 4,360 USD, back above both EMA65 and EMA200. ETF flows turned positive in July with 3 billion USD of net inflows, and central banks bought 288.9 tonnes in Q2 — up 62% year-on-year. A breakout above 4,500 USD opens the path to 4,855 USD and the 5,597 USD all-time high. We break down the key levels, three trading scenarios with entry triggers, and what J.P. Morgan, Deutsche Bank and Goldman Sachs are forecasting for gold in 2026.
Forecasts presented in this section only reflect the author’s private opinion and should not be considered as guidance for trading. RoboForex bears no responsibility for trading results based on trading recommendations described in these analytical reviews.