
Daily technical analysis and forecast for 9 September 2026
Daily technical analysis and forecast for EURUSD, USDJPY, GBPUSD, AUDUSD, USDCAD, XAUUSD, US 500, and BTCUSD for 9 September 2026.
Each scenario on this page reflects the market structure on the H4 chart as of 10:00 UTC+3 on 9 September 2026. The assessment considers the current H4 chart structure, key support and resistance levels, the direction of the medium-term movement, and the prevailing fundamental backdrop.
EURUSD forecast
EURUSD is focused on the upcoming European Central Bank meeting, with the decision due on 10 September. The market has almost fully priced in a 25-basis-point interest rate increase. August eurozone inflation provided an additional argument for a more hawkish ECB stance: the preliminary estimate showed annual HICP accelerating to 3.3% from 2.9% a month earlier. The impact of the energy component increased particularly noticeably, directly reflecting the renewed rise in oil prices. Brent approached 100 USD per barrel amid another escalation of tensions in the Middle East.
For the dollar, the key factor remains expectations ahead of the Federal Reserve’s 15–16 September decision. The strong August labour market report, which showed employment growth of 162,000 and unemployment at 4.1%, significantly increased the probability of a rate hike. However, the final assessment of the Fed outlook will depend heavily on Friday’s CPI data. Therefore, the fundamental balance for EURUSD remains mixed: expectations of an ECB rate hike support the euro, but rising US bond yields, a strong US labour market and deteriorating global risk appetite limit its upside potential.
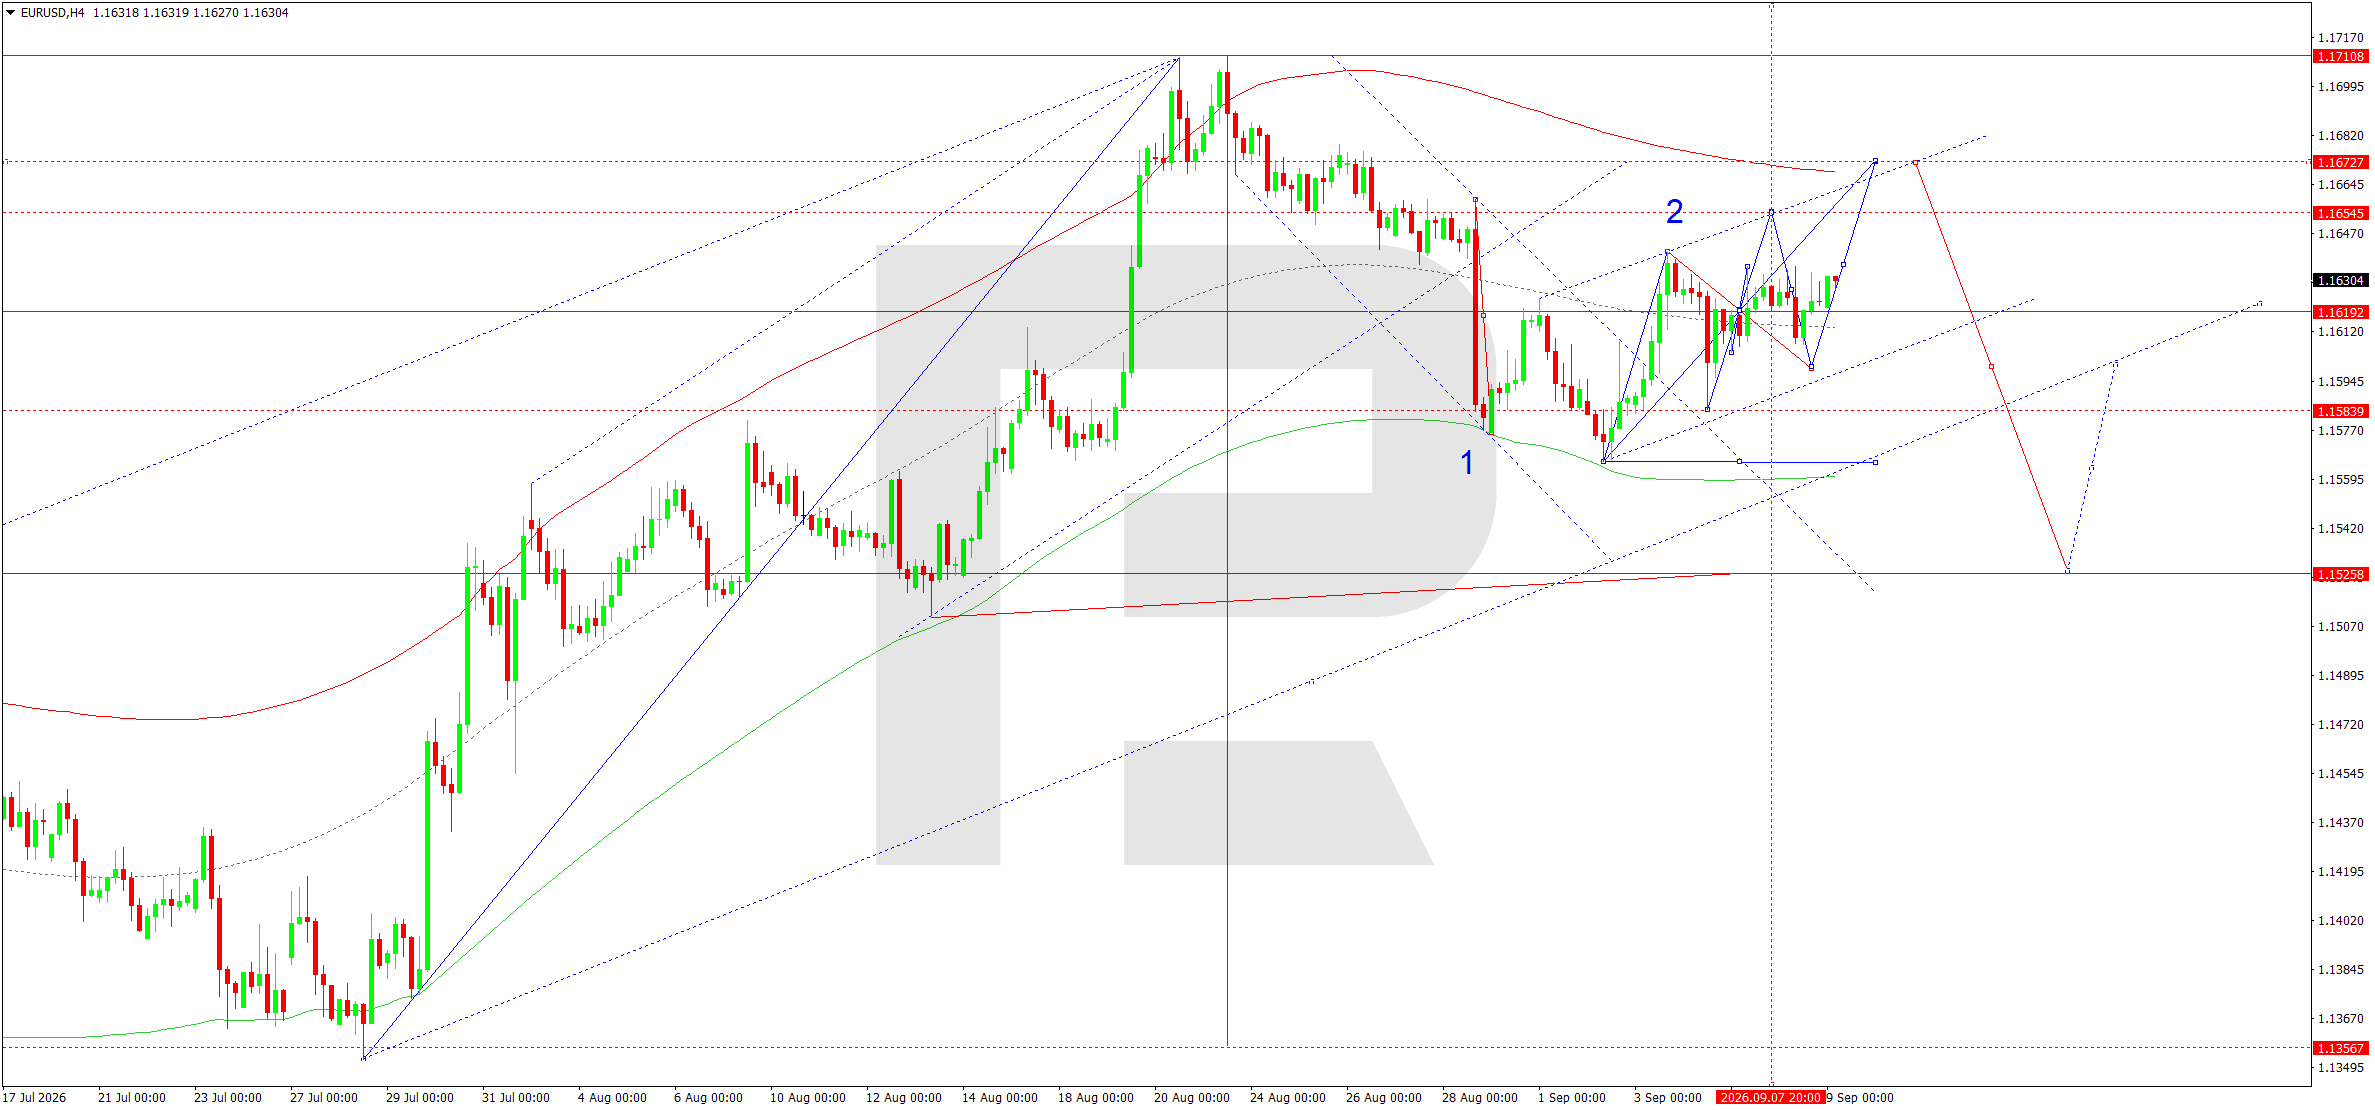
On the H4 chart, the pair continues to form a consolidation range around the 1.1620 area. After completing the first downward wave and forming a local low, the market moved into a corrective rise. The current structure allows this move to continue first towards 1.1654 and then 1.1672. The 1.1654–1.1672 zone is viewed as the likely area where the correction may end and a new point of seller activity may form.
From an Elliott wave perspective, the current rise still shows the characteristics of a second corrective wave. The wave Matrix, with its pivot around 1.1620, also indicates that the market remains in a transitional phase.
The central line of the Price Envelope runs almost through the current values, so a short-term extension of the range higher would not signal a change in the main scenario.
After the rise towards 1.1654–1.1672 is complete, another downward impulse is expected to form. The first confirmation would be a return below 1.1619. Sellers would then need to break below 1.1584, after which the downside would open towards 1.1525. This level remains the main target of the first major downward wave. Only sustained consolidation above 1.1672 would weaken this scenario and allow another test of 1.1711. Overall, the chart structure continues to confirm the priority of selling once the local correction is complete.
EURUSD forecast scenario
Trading scenario: SELL
- Price at the time of writing: 1.1629
- Entry price: 1.1624
- Stop loss: 1.1677
- Take profit: 1.1525
- Risk-to-reward ratio: 1:2
The trade idea is valid until 8:00 AM on 10 September 2026 (server time, UTC+3).
USDJPY forecast
The main fundamental factor for USDJPY remains the sharp strengthening of expectations for further policy tightening by the Bank of Japan. The yen strengthened to its highest levels in around seven months, while the market has almost fully priced in the probability of a 25-basis-point BoJ rate hike to 1.25% at the 17–18 September meeting. Further support for the Japanese currency comes from short covering and the gradual unwinding of carry trades. Rising Japanese government bond yields are also increasing the attractiveness of domestic assets and creating conditions for Japanese investors to repatriate capital.
On the dollar side, support from strong US labour market data remains. Following the 162,000 increase in August employment, the Federal Reserve has more room to raise rates, although Friday’s CPI remains the key factor ahead of the 15–16 September meeting. Oil rising to almost 100 USD per barrel is increasing global inflation risks while also boosting demand for the yen as a safe-haven asset. Under current conditions, the rate-expectation differential no longer gives the dollar its previous advantage, as the market is repricing the BoJ outlook much more rapidly. Therefore, the fundamental picture continues to favour the Japanese currency and is consistent with the downward technical direction of USDJPY.
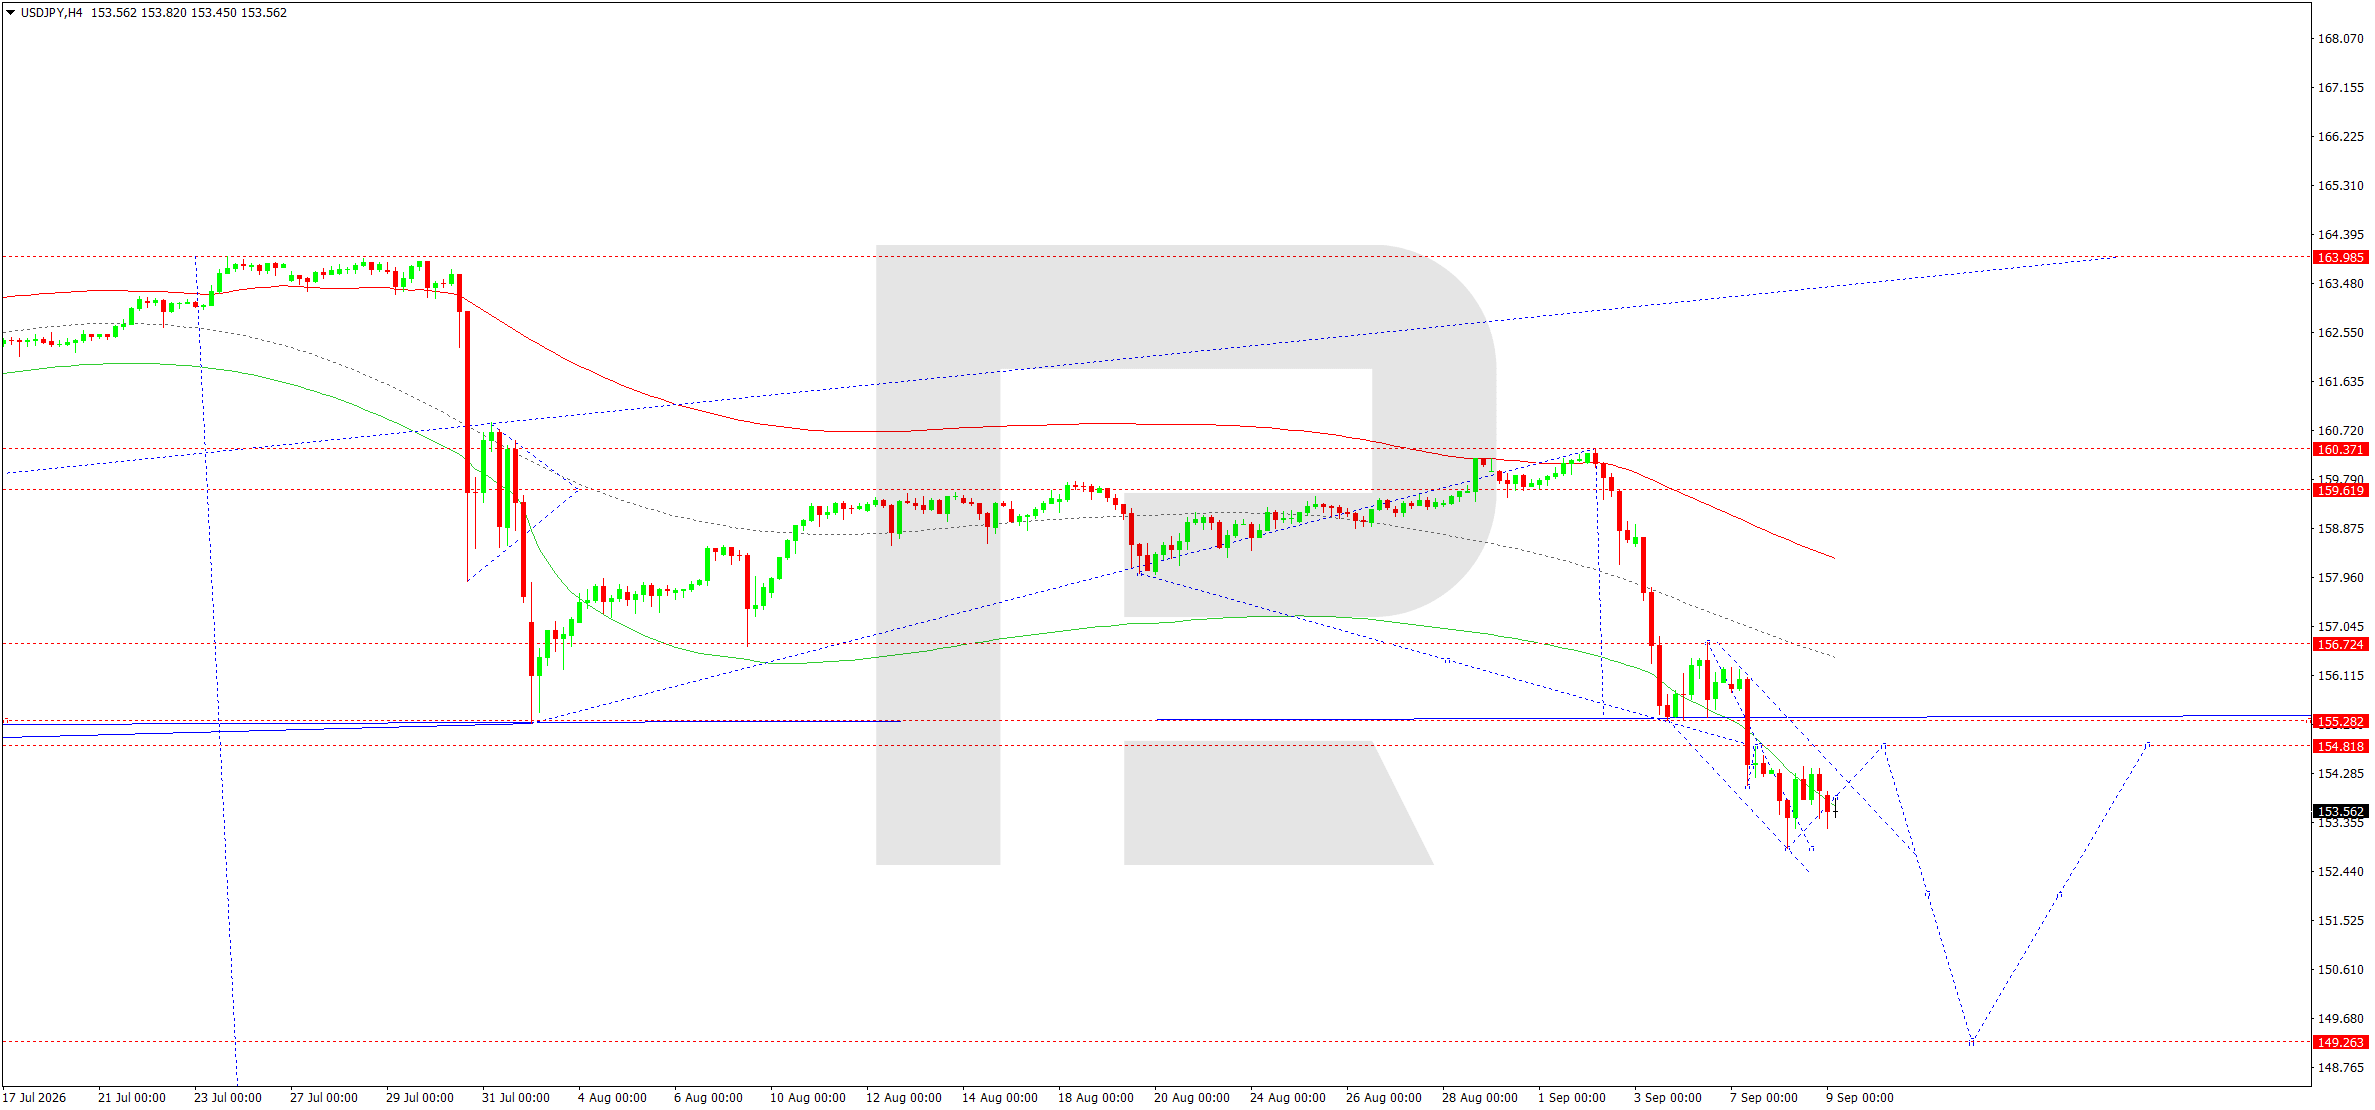
On the H4 chart, the pair rebounded sharply lower from the 154.42 area and formed another downward impulse, setting new local lows. The price approached the lower part of the Price Envelope and is currently around 153.39. After such a strong move, the market may form a small consolidation range or a technical correction, but the downward trend structure has not yet been broken.
The matrix of the current wave has its pivot around 154.81. As long as the price remains below this level, any recovery towards 154.00–154.81 is viewed mainly as corrective. The 154.82 and 155.28 levels form the nearest resistance zone, which must be overcome for a more substantial recovery.
The main wave scenario suggests that the local consolidation will end and the downward sequence will continue. The first intermediate target is the 152.20–152.40 area. The chart then leaves room for a move towards the round 150.00 level and the main local target at 149.30. Within the wave structure, this scenario may correspond to the continuation of the third downward wave after a short correction. A return above 154.81 would temporarily delay the decline and allow a test of 155.28, but only consolidation above this zone would call the current bearish structure into question.
USDJPY forecast scenario
Trading scenario: SELL
- Price at the time of writing: 153.39
- Entry price: 153.34
- Stop loss: 154.86
- Take profit: 149.30
- Risk-to-reward ratio: 1:3
The trade idea is valid until 8:00 AM on 10 September 2026 (server time, UTC+3).
GBPUSD forecast
For the British pound, the key factor remains the Bank of England’s stance amid renewed energy-driven inflation. Economists expect the BoE to keep the rate at 3.75% at next week’s meeting and potentially leave it unchanged through the end of 2026. UK inflation is currently around 2.9%, but a spike in oil prices nearly to 100 USD per barrel increases the likelihood of a temporary acceleration in prices this autumn. At the same time, signs of cooling domestic demand persist, so the scope for aggressive policy tightening remains limited.
By contrast, the Federal Reserve received support for a more hawkish stance following the strong employment report. The probability of a September rate hike has increased noticeably, while US bond yields remain high. Friday’s CPI data could once again materially alter the balance of expectations. The escalation of geopolitical tensions in the Middle East is adding further pressure on risk-sensitive currencies. Therefore, the fundamental backdrop does not provide the pound with a sustained advantage: potentially higher inflation limits the BoE’s scope for easing, while expectations of a longer pause by the UK regulator simultaneously reduce sterling’s appeal relative to the dollar.
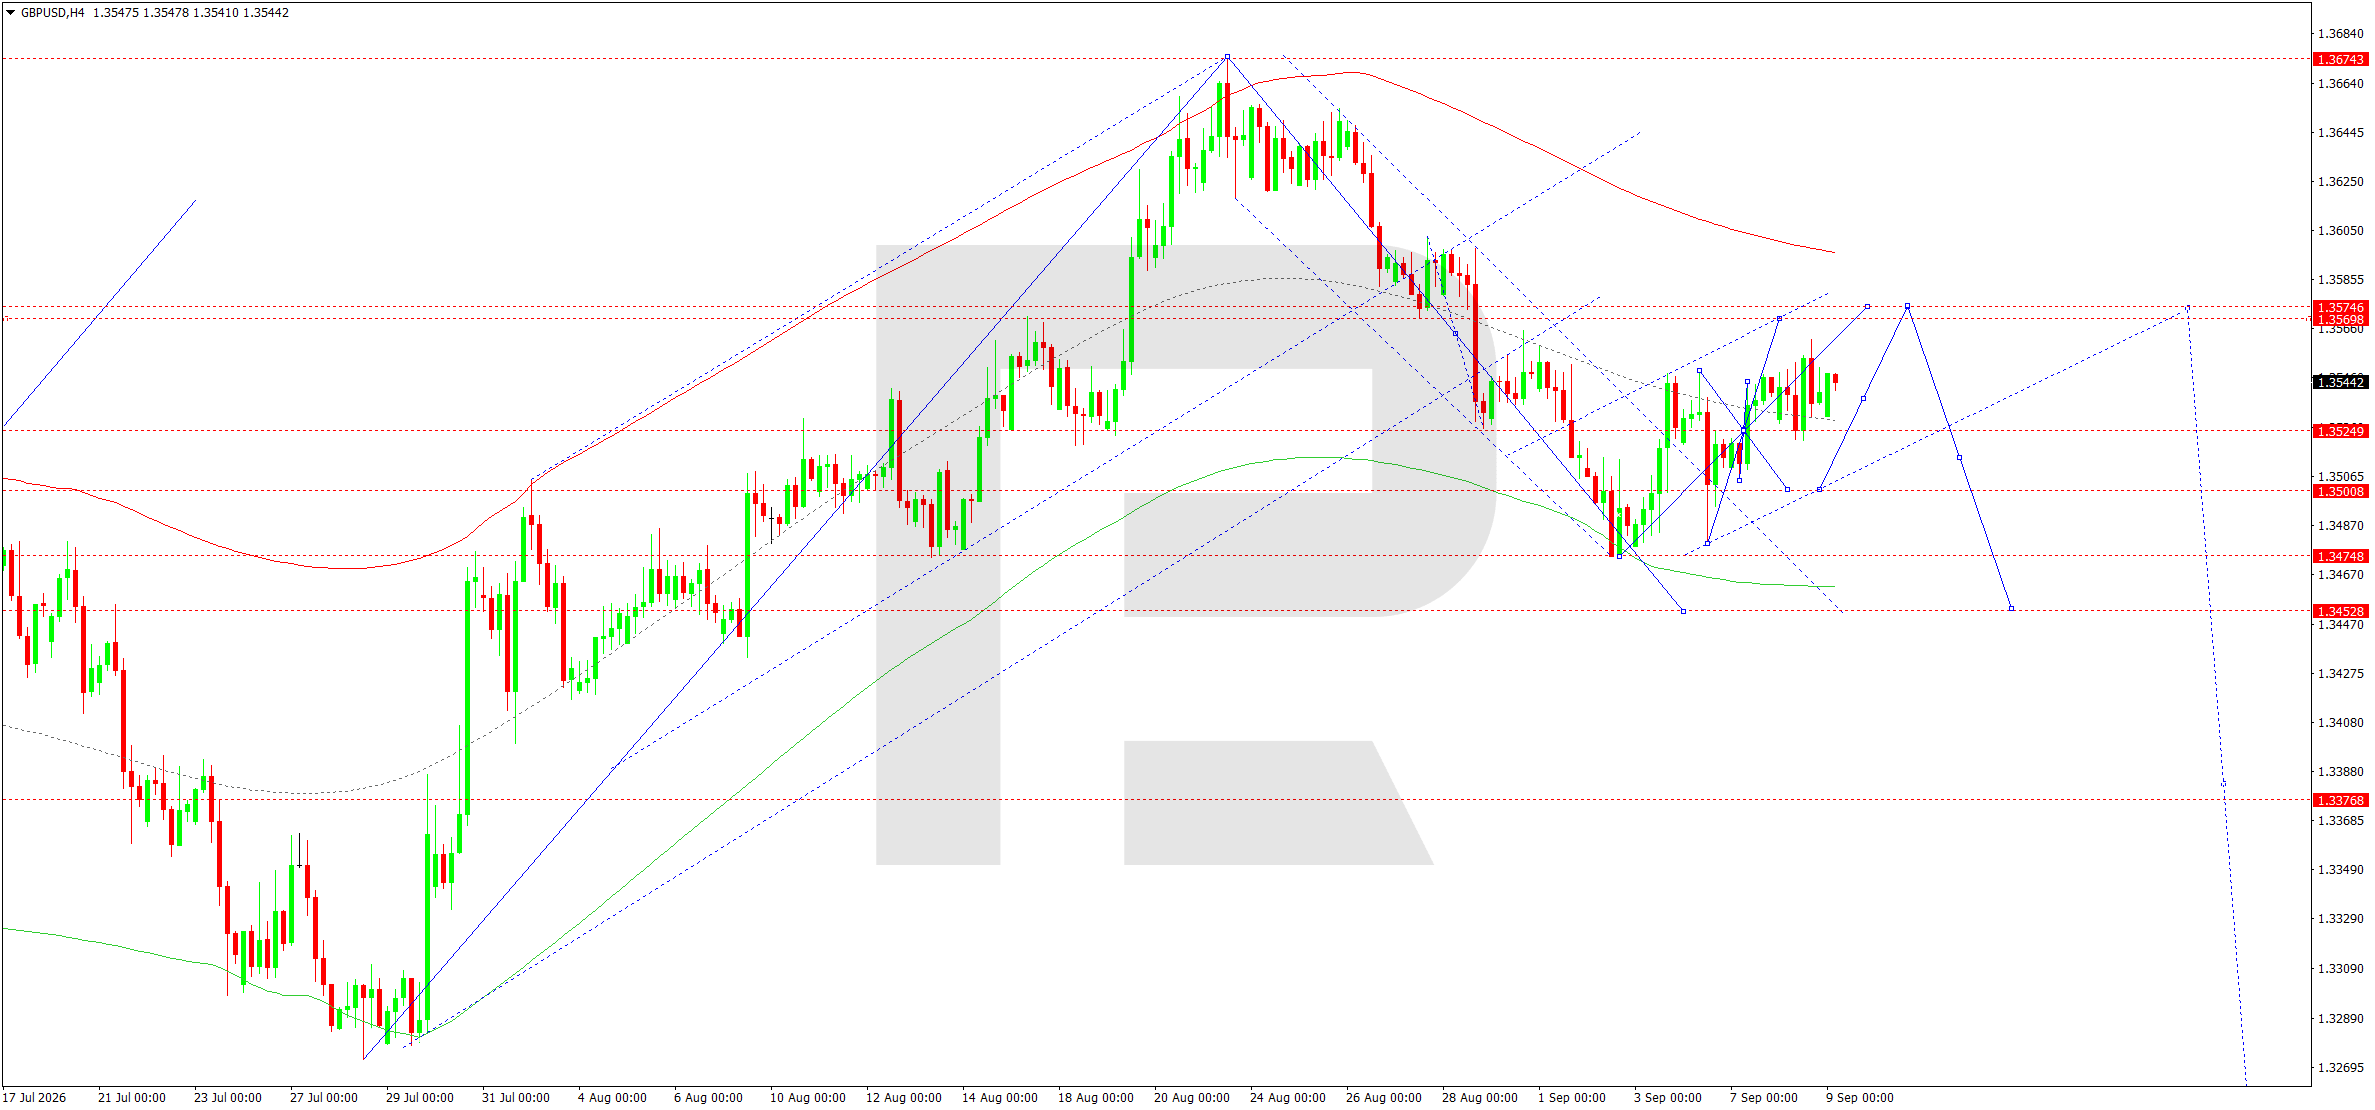
On the H4 chart, GBPUSD formed an upward wave towards the 1.3561 area after recovering. The market then pulled back towards 1.3530 and moved into a compact range. The current structure allows for another extension of the corrective rise towards 1.3566–1.3575. This area also coincides with the upper part of the local matrix and is viewed as a likely zone where the correction may end.
The pivot of the current wave is located at approximately 1.3555. As long as the market is unable to consolidate sustainably above it, the structure continues to show signs of preparing for a new downward wave. On H4, the price remains below the broader descending dynamic line, while the rise of recent sessions is developing within a corrective channel.
The main scenario suggests a test of 1.3566–1.3575 followed by another wave of selling. The first signal would be a return below 1.3525. Attention would then shift to 1.3501 and 1.3475. The lower boundary of the Price Envelope is located near 1.3452 and is the main local target of the current wave. A move below it could significantly strengthen the downward impulse and open the way towards 1.3377, although the main objective for the trading day remains a move towards 1.3452. Consolidation above 1.3575 would temporarily invalidate the immediate downside scenario and allow the market to extend the correction.
GBPUSD forecast scenario
Trading scenario: SELL
- Price at the time of writing: 1.3548
- Entry price: 1.3543
- Stop loss: 1.3580
- Take profit: 1.3452
- Risk-to-reward ratio: 1:2
The trade idea is valid until 8:00 AM on 10 September 2026 (server time, UTC+3).
AUDUSD forecast
The Australian dollar continues to receive support from the Reserve Bank of Australia’s relatively tight monetary policy. At its August meeting, the regulator kept the rate unchanged at 4.35% after three increases during the year. Inflation remains above desired levels, with annual CPI for July at 3.5%. The renewed jump in oil prices increases the risk of second-round inflation effects and keeps the possibility of further policy tightening alive. At the same time, high rates are already having a noticeable impact on domestic demand: the September Westpac Consumer Sentiment Index fell by 5.2% to 84.4, showing increased pressure on households.
In the US, the Federal Reserve is balancing between keeping rates unchanged and raising them. Strong August employment data support the dollar, while the approaching CPI release increases the likelihood of sharp moves in US bond yields. Overall risk appetite is another factor for AUDUSD. The escalation of the conflict in the Middle East and Brent near 100 USD are putting pressure on equity markets and traditionally limiting demand for the Australian dollar. Therefore, the fundamental picture combines support for the AUD from the RBA with a negative external backdrop that could contribute to a technical correction in the pair after a prolonged rise.
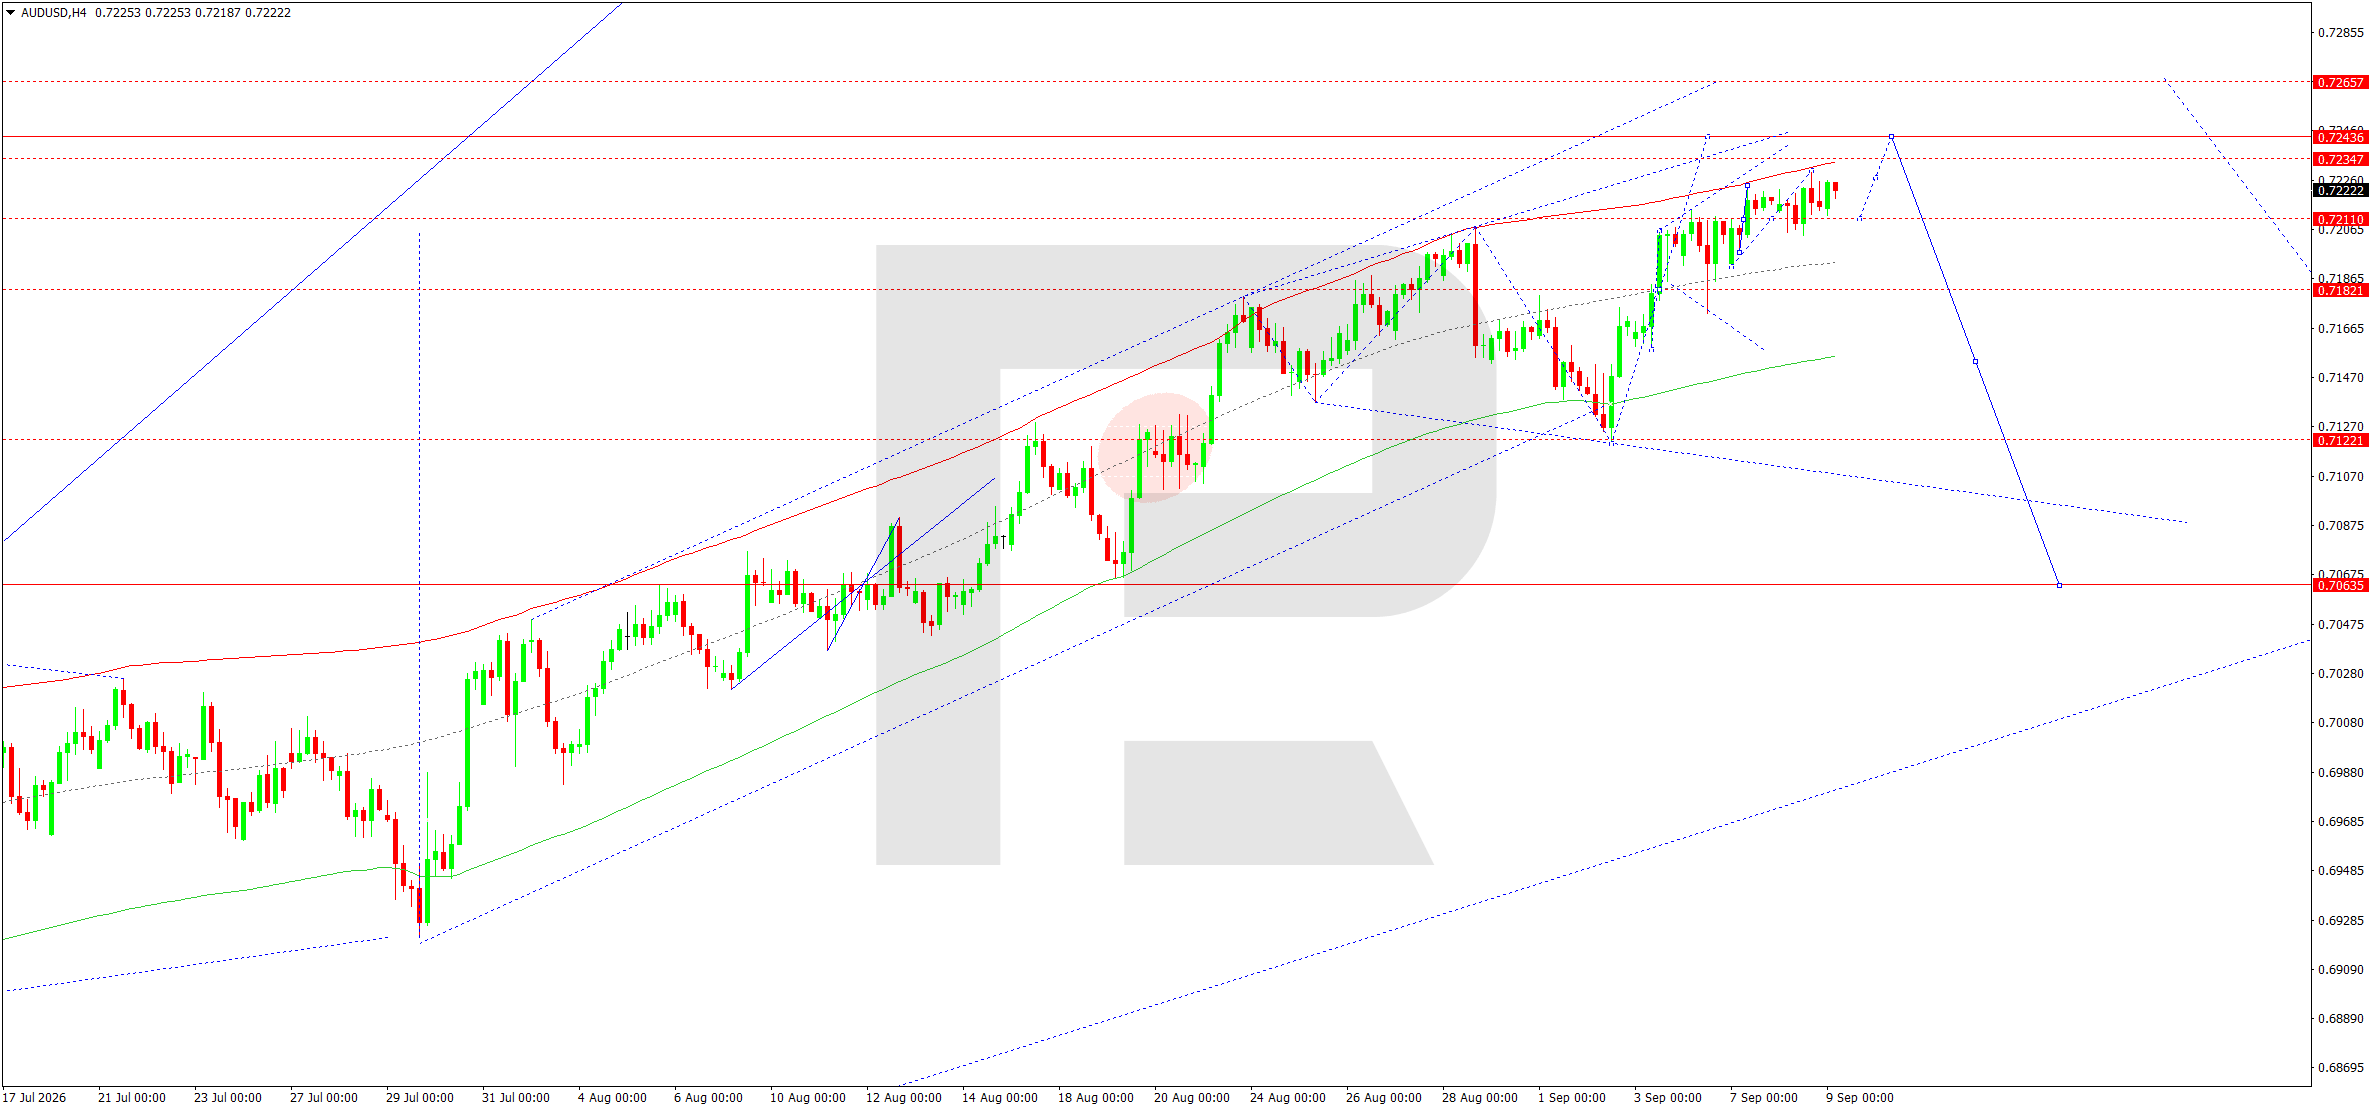
On the H4 chart, AUDUSD has formed a stable upward structure from the July lows, but the price has now approached the upper boundary of a large Price Envelope and a cluster of resistance levels. The market is consolidating around 0.7210–0.7225. There is still scope for a final extension higher towards 0.7244–0.7246, where an important completion area for the current upward wave is located.
The matrix of the upward movement has its pivot near 0.7181. The current price is significantly above it, confirming that most of the upward impulse has already been completed. The wave configuration allows for the final part of a fifth wave to form directly around 0.7246.
Once the rise is complete, a correction becomes the main scenario. A return below 0.7210 would provide the first signal for sellers. A breakout below 0.7181 would move the market below the pivot and significantly strengthen the downside scenario. The next target would be 0.7122, where an important support of the broader structure is located. If sentiment deteriorates further, the move could continue towards 0.7064. Only consolidation above 0.7246 would delay the correction and open the way towards 0.7266. For the current day, selling after the upper part of the range forms remains the preferred approach.
AUDUSD forecast scenario
Trading scenario: SELL
- Price at the time of writing: 0.7225
- Entry price: 0.7220
- Stop loss: 0.7250
- Take profit: 0.7122
- Risk-to-reward ratio: 1:3
The trade idea is valid until 8:00 AM on 10 September 2026 (server time, UTC+3).
USDCAD forecast
The fundamental picture for USDCAD is being heavily influenced by the oil market. Brent approached 100 USD per barrel due to an escalation of the conflict in the Middle East, which traditionally supports the Canadian dollar as the currency of a major oil exporter. On 8 September, the CAD strengthened to its highest level in almost three weeks, while USDCAD fell intraday to around 1.3760. Higher commodity prices are currently outweighing the negative impact of the Canada–US trade confrontation.
The Bank of Canada kept its rate unchanged at 2.25% on 2 September. Headline inflation is around 3%, mainly due to high petrol prices, while inflation excluding petrol is approximately 2.2% and core measures remain near 2%. This allows the BoC to avoid rushing into further tightening, although a prolonged rise in energy prices increases the risks. At the same time, trade tariffs between Canada and the US could worsen the outlook for the Canadian economy. Following strong employment data, the Federal Reserve also retains the option of raising rates. Therefore, the medium-term fundamental balance remains mixed: oil supports the CAD, but trade risks and higher yields on US assets may limit further declines in USDCAD.
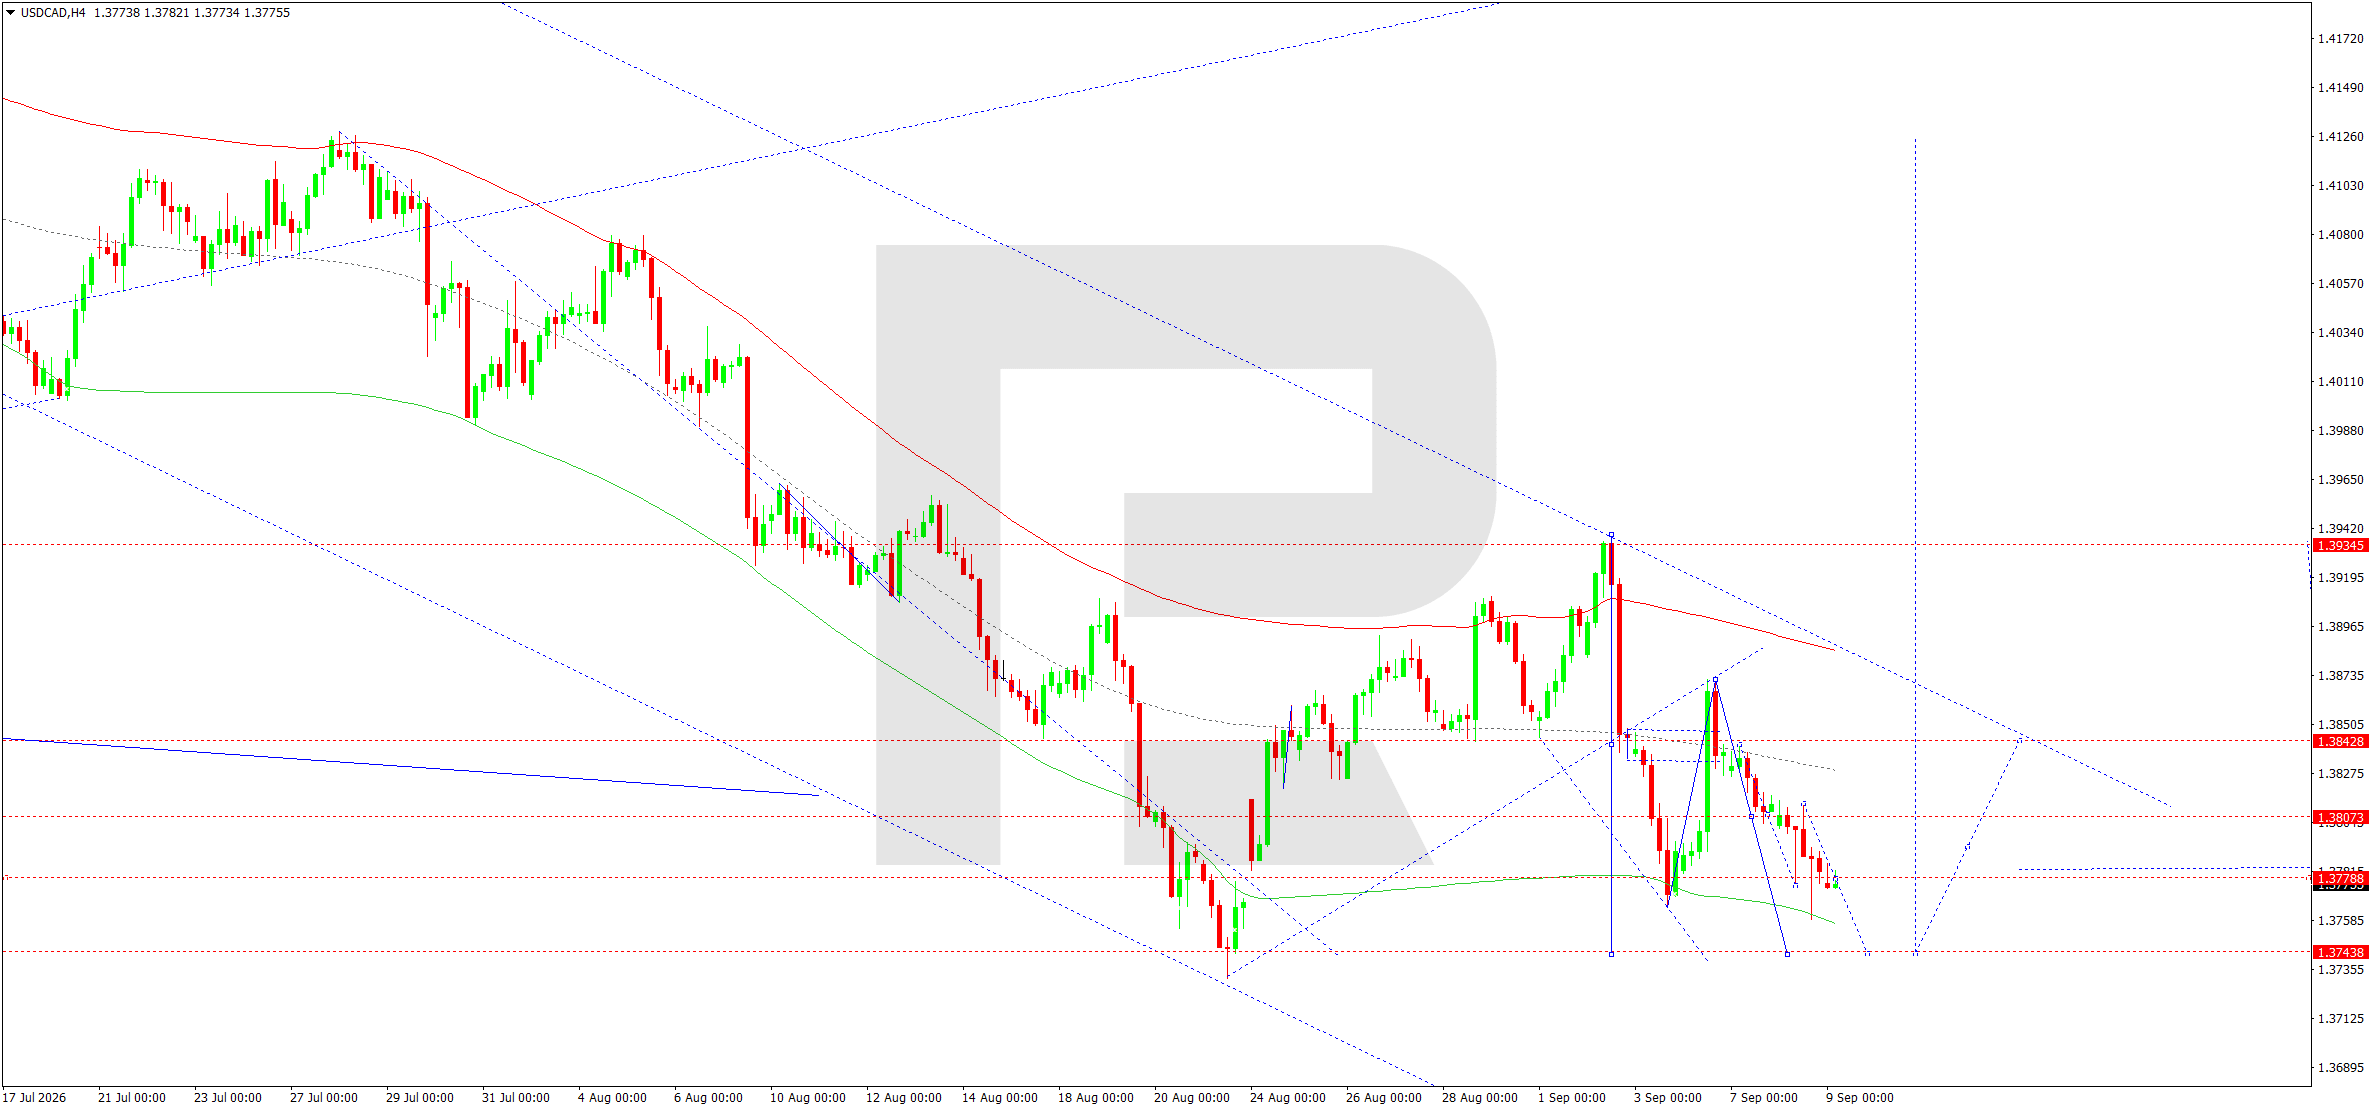
On the H4 chart, the main downward structure remains intact. After a corrective rise towards 1.3935, the market formed a strong downward impulse and returned to the lower boundary of the Price Envelope. The price is currently around 1.3774–1.3778, where a compact range is forming.
The matrix pivot is located around 1.3840. As long as the price remains below it, sellers retain the technical advantage. The nearest downside target is 1.3748. This is where the key lower support of the current structure is located.
At the same time, the chart structure indicates that the 1.3748 area could become the completion point of the current downward move and the start of a larger corrective recovery. If the level holds, a return first towards 1.3807 and then 1.3840 is likely. A successful breakout above the latter would allow the rise to extend towards 1.3935–1.3939. Thus, the immediate downside potential has already narrowed considerably, while the potential recovery amplitude is substantially larger. For this reason, the trading scenario is based on buying as long as support at 1.3748 holds. A move below it would invalidate the recovery idea and confirm the continuation of the downward trend.
USDCAD forecast scenario
Trading scenario: BUY
- Price at the time of writing: 1.3774
- Entry price: 1.3779
- Stop loss: 1.3738
- Take profit: 1.3939
- Risk-to-reward ratio: 1:4
The trade idea is valid until 8:00 AM on 10 September 2026 (server time, UTC+3).
XAUUSD forecast
Gold is caught between two opposing fundamental factors. On the one hand, the sharp deterioration in the geopolitical situation in the Middle East is increasing demand for safe-haven assets. Brent approached 100 USD per barrel, while intensified attacks on facilities in the region are fuelling concerns about further inflation and disruptions to energy supplies. In morning trading on 9 September, gold gained around 0.7% and traded near 4,385 USD per ounce.
On the other hand, the metal is under pressure from changing expectations regarding Federal Reserve policy. The strong August employment report increased the probability of a September rate hike. US bond yields remain high, with long-term yields approaching around 5%, reducing the relative appeal of non-yielding gold. Investors are awaiting Friday’s CPI release: stronger inflation could further increase expectations of Fed tightening and intensify pressure on XAUUSD. As a result, geopolitical demand is limiting the depth of the decline, but the monetary backdrop is not yet creating conditions for a sustained return to the August highs.
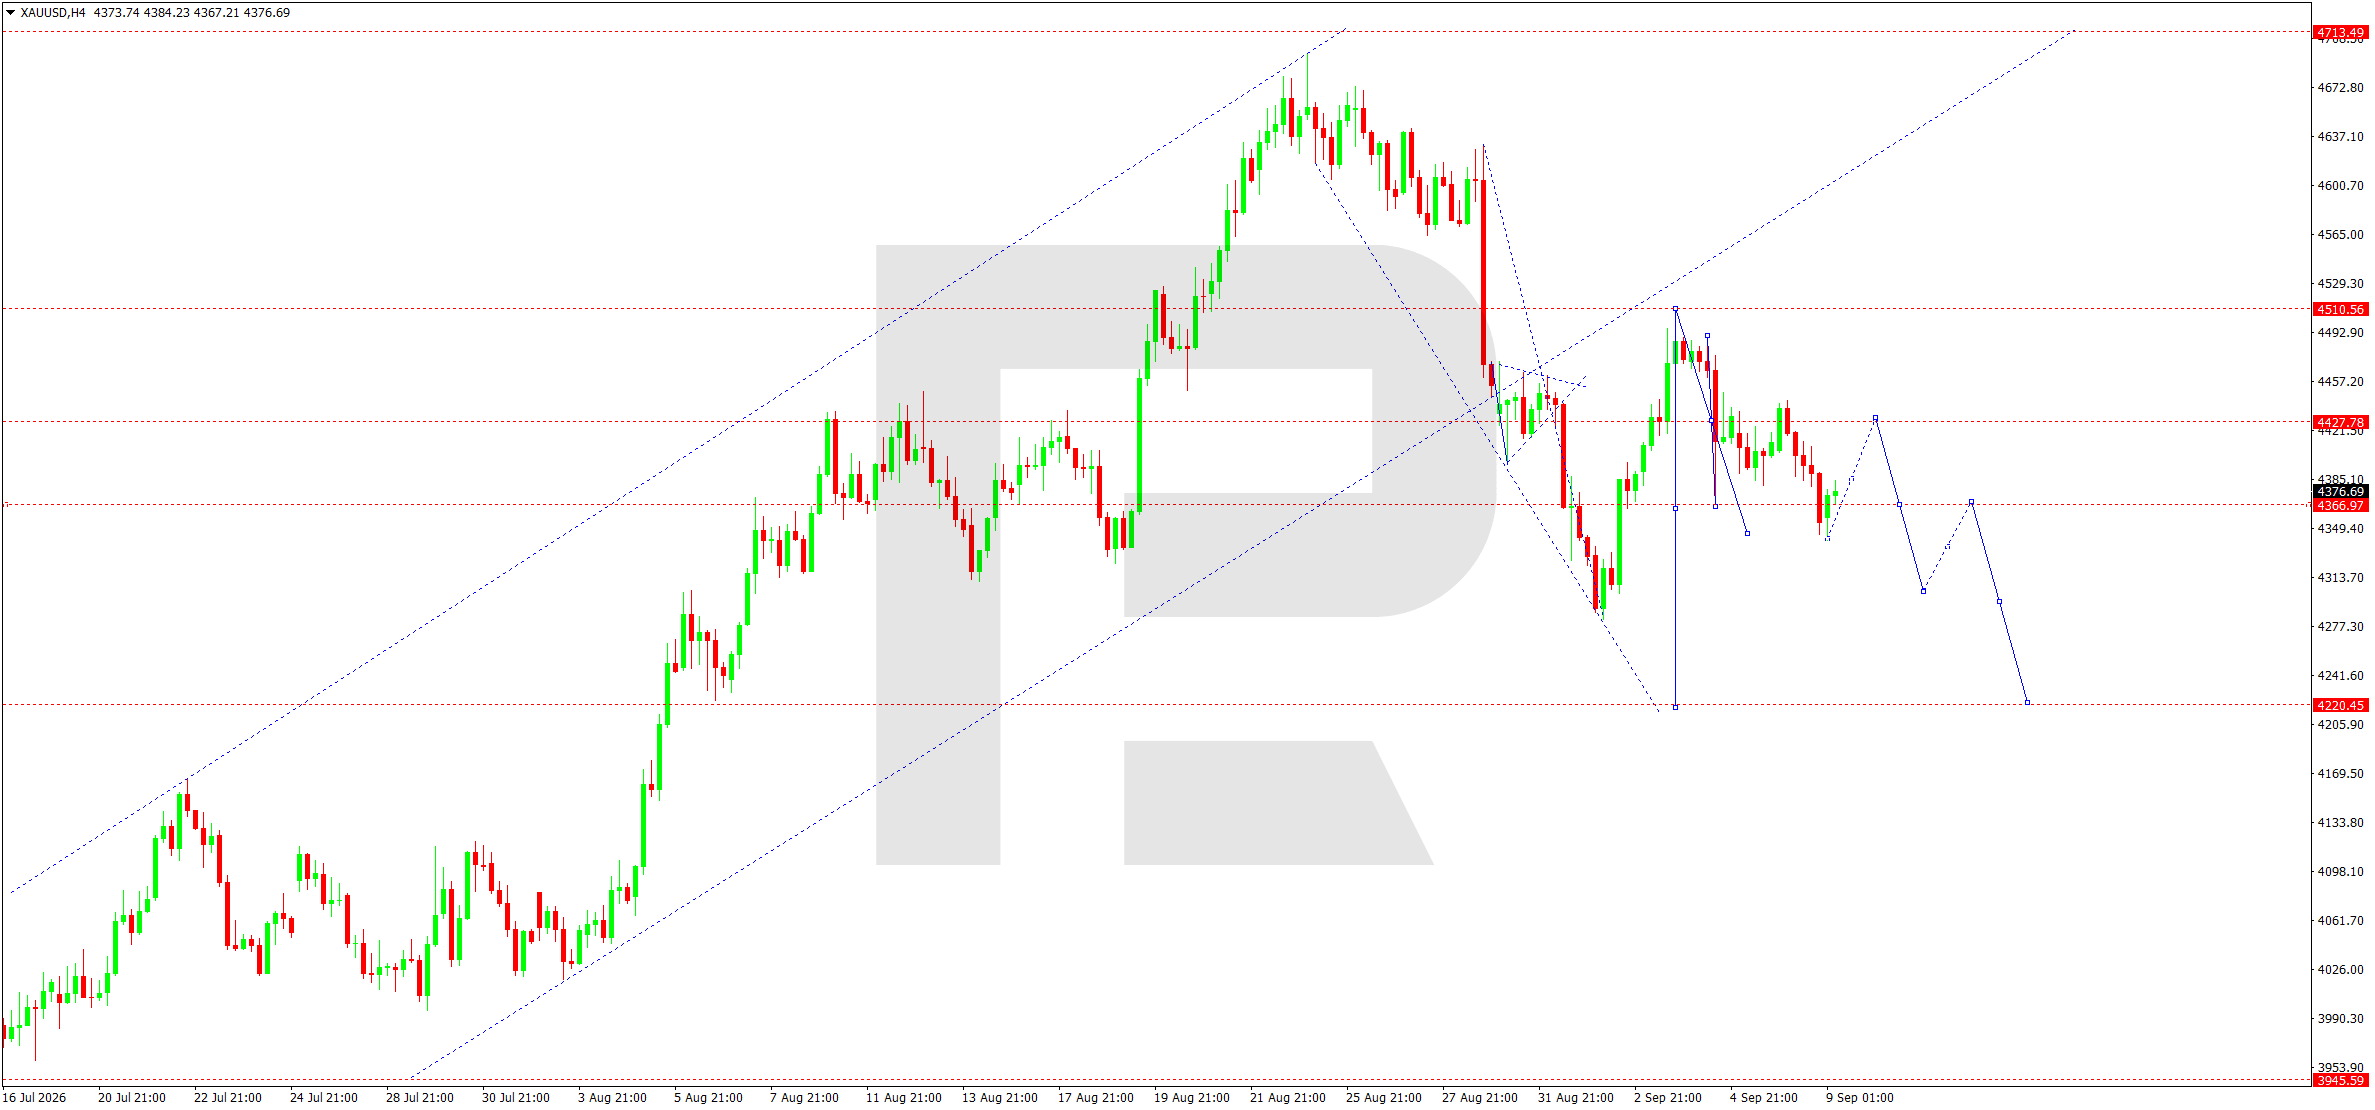
On the H4 chart, gold continues to form a broad range around the central 4,430 area. After forming a high above 4,700, the market moved into a pronounced corrective structure. The latest recovery attempt ended around 4,510, after which sellers pushed prices back towards 4,350–4,380.
The matrix of the current downward movement has its pivot around 4,433. As long as prices hold below this level, the structure remains predominantly bearish. A small corrective rise is currently developing from 4,343 and could lead to a retest of 4,420–4,433. However, without consolidation above the pivot, this rise is viewed as a technical correction.
The main scenario suggests a continued decline, with the first intermediate target at 4,300. The move may then extend towards the lower boundary of the Price Envelope near 4,220. A new range and a more significant upward correction are likely to form in this area. If the 4,220 level is broken, the next target will be 4,200, while the broader structure still leaves room for a move towards 4,145. Only a return above 4,433 and consolidation above 4,510 would materially weaken the downward configuration.
XAUUSD forecast scenario
Trading scenario: SELL
- Price at the time of writing: 4,380
- Entry price: 4,375
- Stop loss: 4,430
- Take profit: 4,220
- Risk-to-reward ratio: 1:3
The trade idea is valid until 8:00 AM on 10 September 2026 (server time, UTC+3).
US 500 forecast
The US stock market remains under pressure from several factors at once. At the end of the previous session, the S&P 500 fell by around 0.58% and closed near 7,674. Pressure came from the technology and software segments, while energy companies received support from the sharp rise in oil prices. Brent approached 100 USD per barrel after another escalation of the conflict in the Middle East. High energy prices are once again increasing inflation risks and reducing the likelihood of a rapid easing of monetary conditions.
The Federal Reserve approaches its 15–16 September meeting with stronger labour market data. Employment increased by 162,000 in August, and the probability of a rate hike moved close to 60% after the release. Another negative factor for equities is rising Treasury yields: long-term rates are approaching 5%, increasing the cost of capital and providing an alternative to stocks. The key event now will be Friday’s CPI release. Higher inflation could strengthen expectations of a rate hike and add to pressure on the stock market. On the morning of 9 September, futures are showing relative resilience, but overall risk appetite remains cautious.
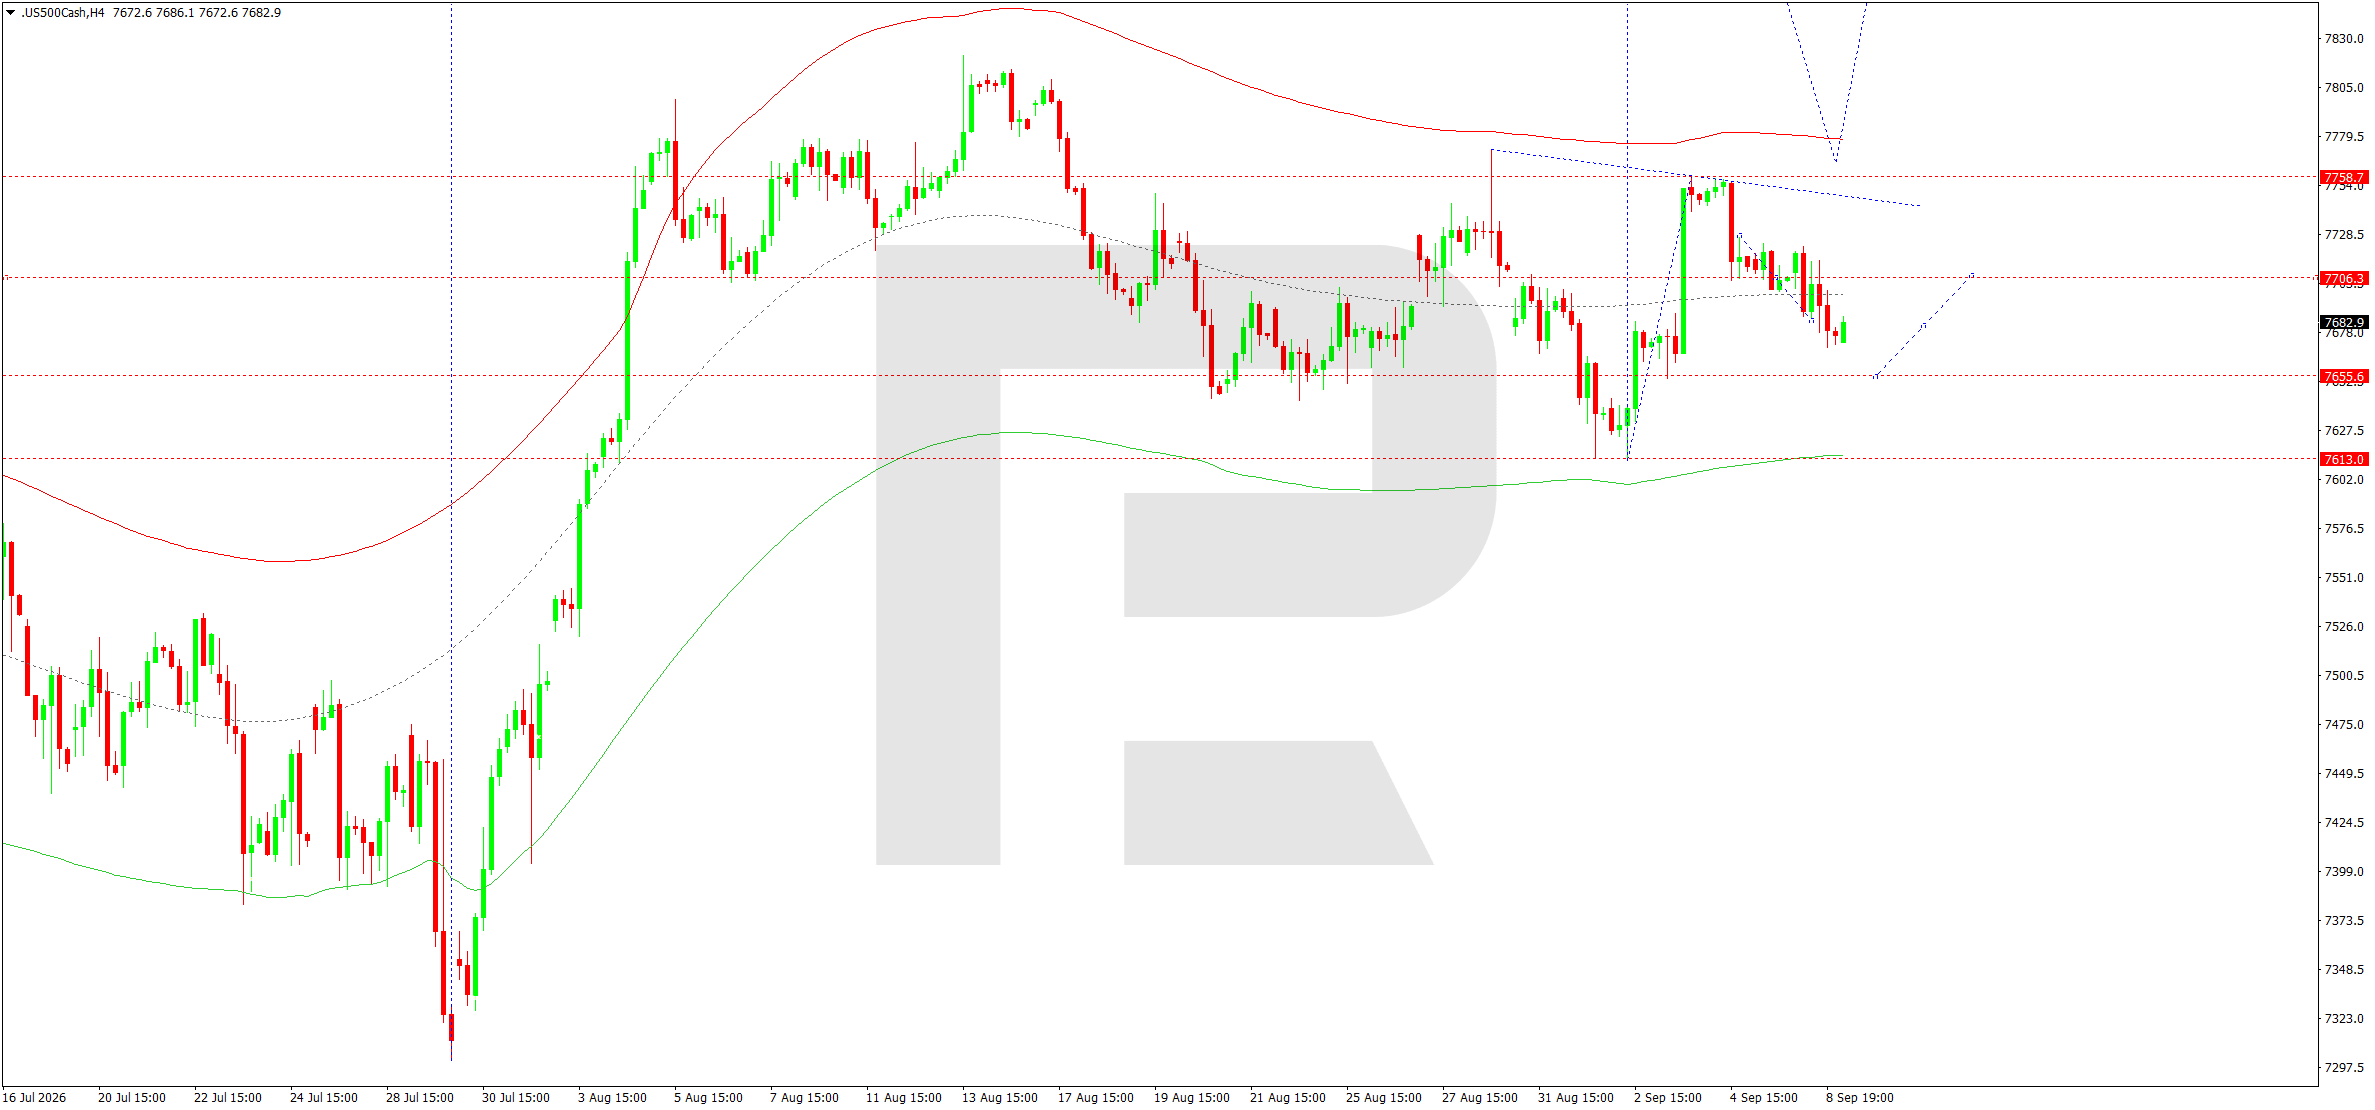
On the H4 chart, after recovering towards 7,759, the US 500 formed a new downward wave. The price successively moved back below 7,706 and approached the central 7,685 area. The market is currently trading near 7,688, while the local structure continues to show signs of range formation.
The pivot of the current matrix is near 7,685. The key supports below are 7,656 and 7,613. In the short term, the market may recover towards 7,706, although this rise is still viewed as corrective.
The main scenario suggests that the correction will end around 7,700–7,707, followed by a resumption of the decline. A breakout below 7,656 would confirm the development of the next leg of the downward wave and open the way towards 7,613. This level also coincides with the lower dynamic area of the Price Envelope and is the most significant target at the current stage. If 7,656 holds, the market may continue consolidating between 7,656 and 7,707. Consolidation above 7,707 would increase the probability of a retest of 7,759, but a confident move above the latest high would be required to change the broader configuration. Until that happens, the sell scenario retains priority.
US 500 forecast scenario
Trading scenario: SELL
- Price at the time of writing: 7,688
- Entry price: 7,683
- Stop loss: 7,715
- Take profit: 7,613
- Risk-to-reward ratio: 1:2
The trade idea is valid until 8:00 AM on 10 September 2026 (server time, UTC+3).
BTCUSD forecast
Bitcoin continues to be influenced by the same macroeconomic factors that are driving other risk assets. Following the strong August US labour market report, the probability of a September rate hike by the Federal Reserve increased substantially. Higher borrowing costs and US bond yields traditionally limit demand for higher-risk assets. Bitcoin again fell below 80,000 yesterday, while Coinbase and Strategy shares also declined, confirming weaker short-term sentiment in the cryptocurrency segment.
An additional risk factor was a report that assets worth around 320 million USD had been withdrawn from the federation wallet of the Liquid Bitcoin network. Although the event does not relate directly to the Bitcoin base blockchain, it increases market attention to infrastructure and operational risks in the crypto sector. At the same time, long-term institutional integration continues, with major banks expanding professional clients’ access to digital-asset trading. On the morning of 9 September, Bitcoin recovered to around 79,000, but the overall backdrop remains cautious amid rising oil prices, geopolitical tensions and expectations ahead of US inflation data. Until the CPI release, the market may remain highly volatile within the established range.
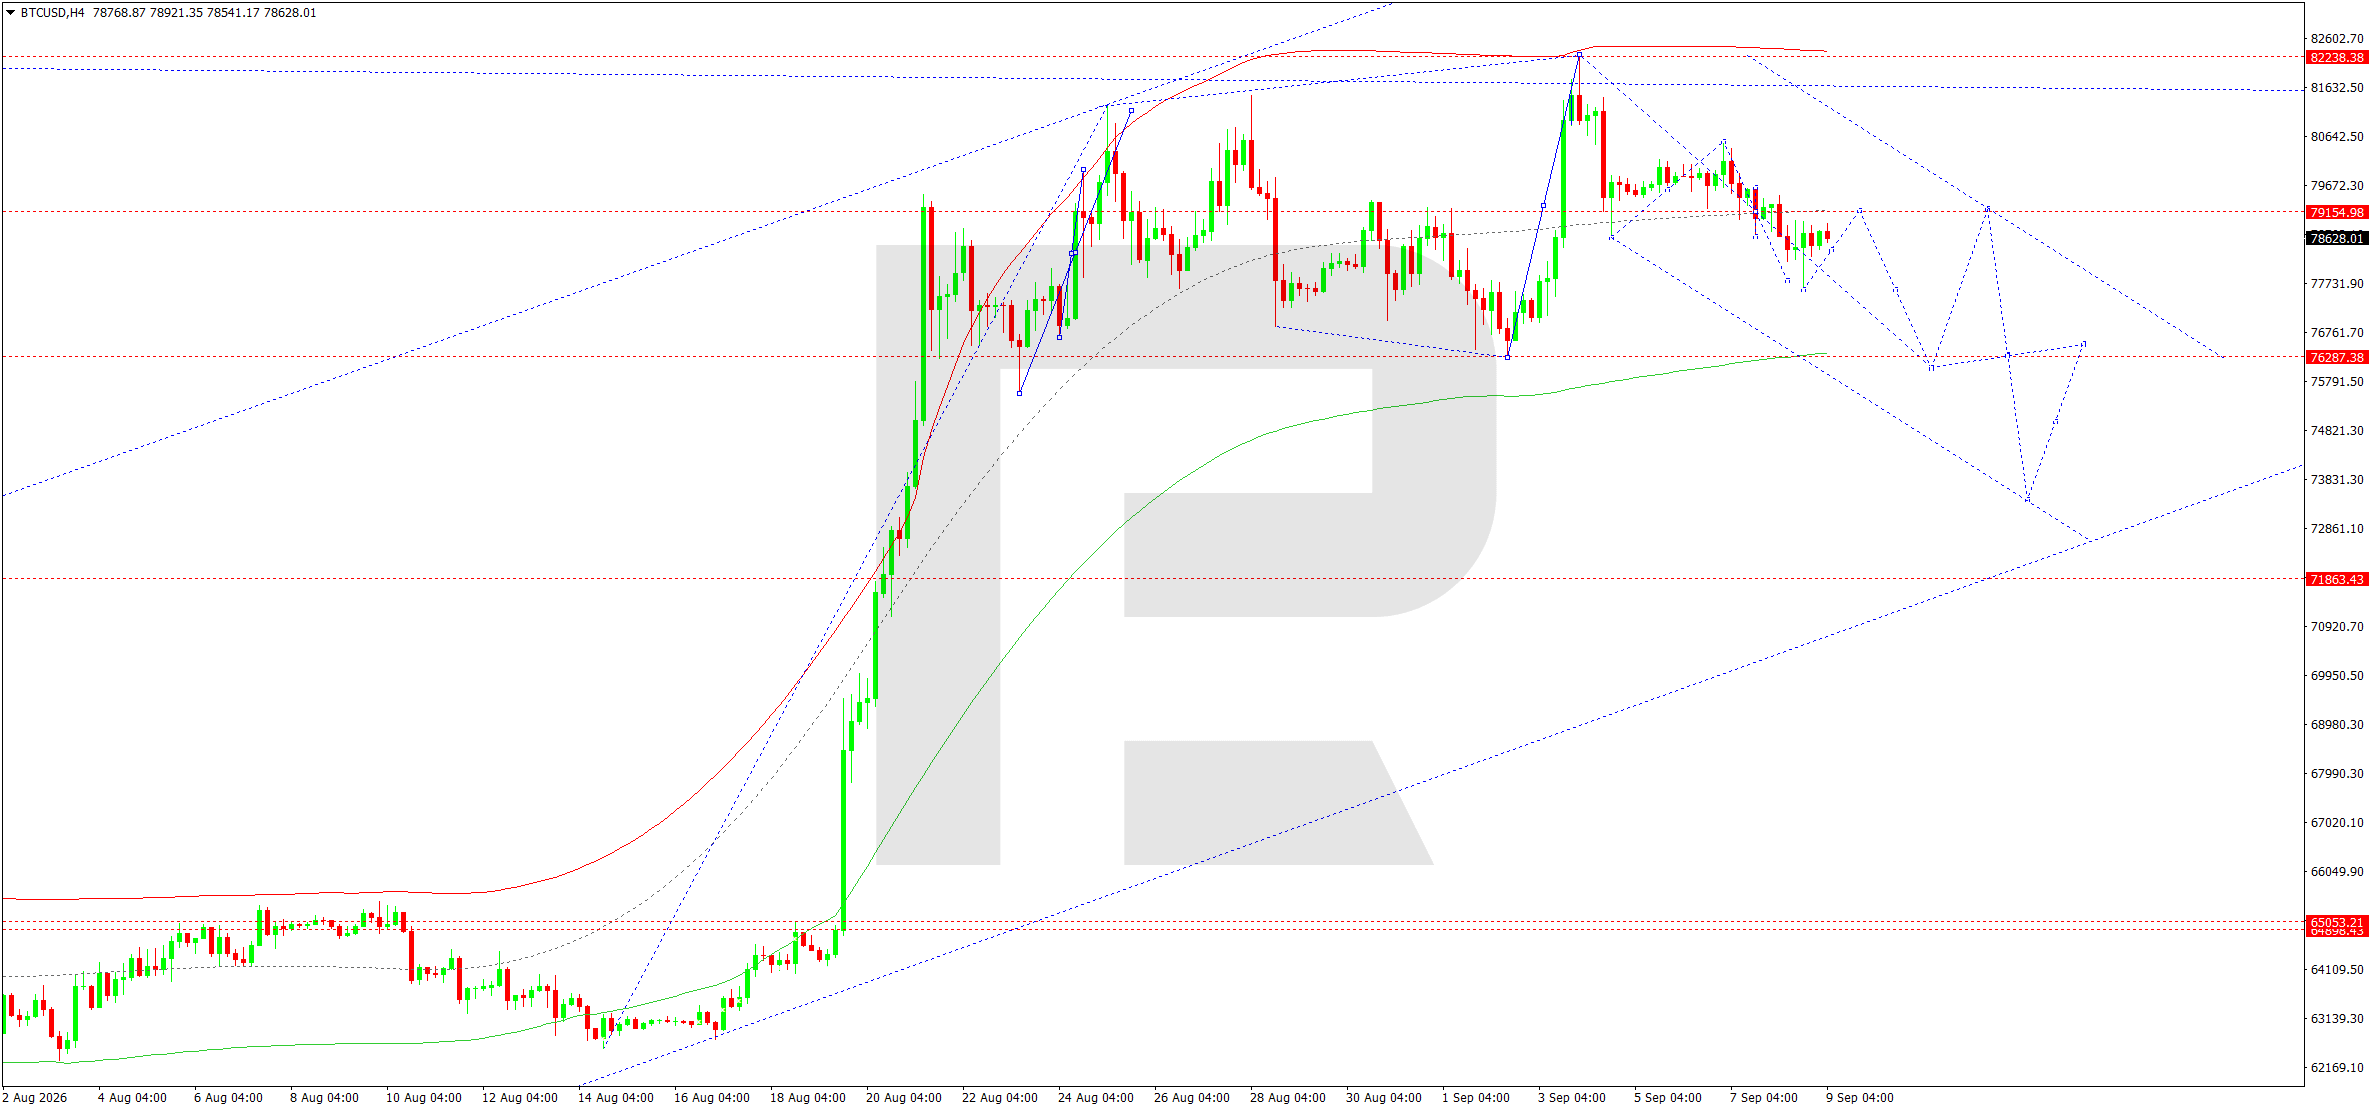
On the H4 chart, after forming a top near 82,238, Bitcoin moved into a downward structure. The market successively formed a series of lower local highs and returned to the 78,000–79,000 area. A range is currently forming around 79,155.
The pivot of the current matrix is located at approximately 80,000. As long as the price remains below it, sellers retain the advantage. Locally, the market may still extend the corrective rise towards 79,650, but this area lies within the downward channel and is viewed as a likely point for a new downside impulse to form.
The first target is a return to 77,600. A breakout below this level would confirm the continuation of the wave towards the lower boundary of the Price Envelope near 76,288. This is where the main buyer reaction and the formation of a new range are expected. If support at 76,288 fails to hold, the structure allows for a deeper decline towards 73,831–72,860. An alternative scenario would emerge only after a sustained return above 80,000, while a definitive weakening of the current bearish pattern would require a recovery above 82,238. Until then, selling on corrective rises remains the priority.
BTCUSD forecast scenario
Trading scenario: SELL
- Price at the time of writing: 79,000
- Entry price: 78,995
- Stop loss: 79,700
- Take profit: 76,288
- Risk-to-reward ratio: 1:4
The trade idea is valid until 8:00 AM on 10 September 2026 (server time, UTC+3).
Editors’ picks
 EURUSD forecast 2026–2027: technical analysis, price levels & predictions
EURUSD has recovered from the July lows and is trading near 1.1545 — back in bullish territory. The pair has reclaimed EMA65 on the daily, formed a bullish EMA crossover on H4, and the US-eurozone GDP gap has narrowed sharply (US 1.5% vs eurozone 1.0%). Goldman Sachs and Deutsche Bank both now target 1.2500 by year-end. A confirmed close above 1.1700 opens the path to 1.1805. We break down the key levels, three trading scenarios, and what the unprecedented 9-3 FOMC dissent vote means for EURUSD.
 Gold (XAUUSD) forecast 2026: technical analysis, price levels & predictions
Gold has reversed its downtrend and is trading near 4,360 USD, back above both EMA65 and EMA200. ETF flows turned positive in July with 3 billion USD of net inflows, and central banks bought 288.9 tonnes in Q2 — up 62% year-on-year. A breakout above 4,500 USD opens the path to 4,855 USD and the 5,597 USD all-time high. We break down the key levels, three trading scenarios with entry triggers, and what J.P. Morgan, Deutsche Bank and Goldman Sachs are forecasting for gold in 2026.
Forecasts presented in this section only reflect the author’s private opinion and should not be considered as guidance for trading. RoboForex bears no responsibility for trading results based on trading recommendations described in these analytical reviews.