
Daily technical analysis and forecast for 10 September 2026
Daily technical analysis and forecast for EURUSD, USDJPY, GBPUSD, AUDUSD, USDCAD, XAUUSD, US 500, and BTCUSD for 10 September 2026.
Each scenario on this page reflects the market structure on the H4 chart as of 10:00 UTC+3 on 10 September 2026. The assessment considers the current H4 chart structure, key support and resistance levels, the direction of the medium-term movement, and the prevailing fundamental backdrop.
EURUSD forecast
On 10 September 2026, EURUSD is trading in an environment of heightened sensitivity to central bank decisions and inflation data. The main event of the day is the European Central Bank meeting. The market expects the deposit rate to be raised to 2.50% from 2.25%, which would be the second tightening move this year. The main reason remains eurozone inflation accelerating above 3% amid a renewed energy shock, while core inflation slowed to 2.4%. Resilient business activity is providing additional support to the euro: the eurozone composite PMI remained above 50 points in August, while lending continued to recover. At the same time, Brent rising above 100 USD per barrel is increasing risks for the European economy as a major energy importer and may limit the single currency’s upside potential.
For the dollar, the key factor remains expectations ahead of US producer price data today and consumer inflation on Friday. The Federal Reserve will hold its meeting on 15–16 September. The market estimates the probability of a rate hike at around 60%, while most economists expect a pause. High US bond yields are supporting the dollar, although the Dollar Index remains under pressure, preserving a balanced risk profile for EURUSD. If the ECB confirms its readiness to continue tightening, the divergence in policy expectations between the ECB and the Fed could temporarily support the euro. More cautious rhetoric combined with stronger US inflation, by contrast, would restore the dollar’s advantage. Therefore, the fundamental backdrop allows for an intraday rise in EURUSD but does not eliminate the risk of a subsequent reversal.
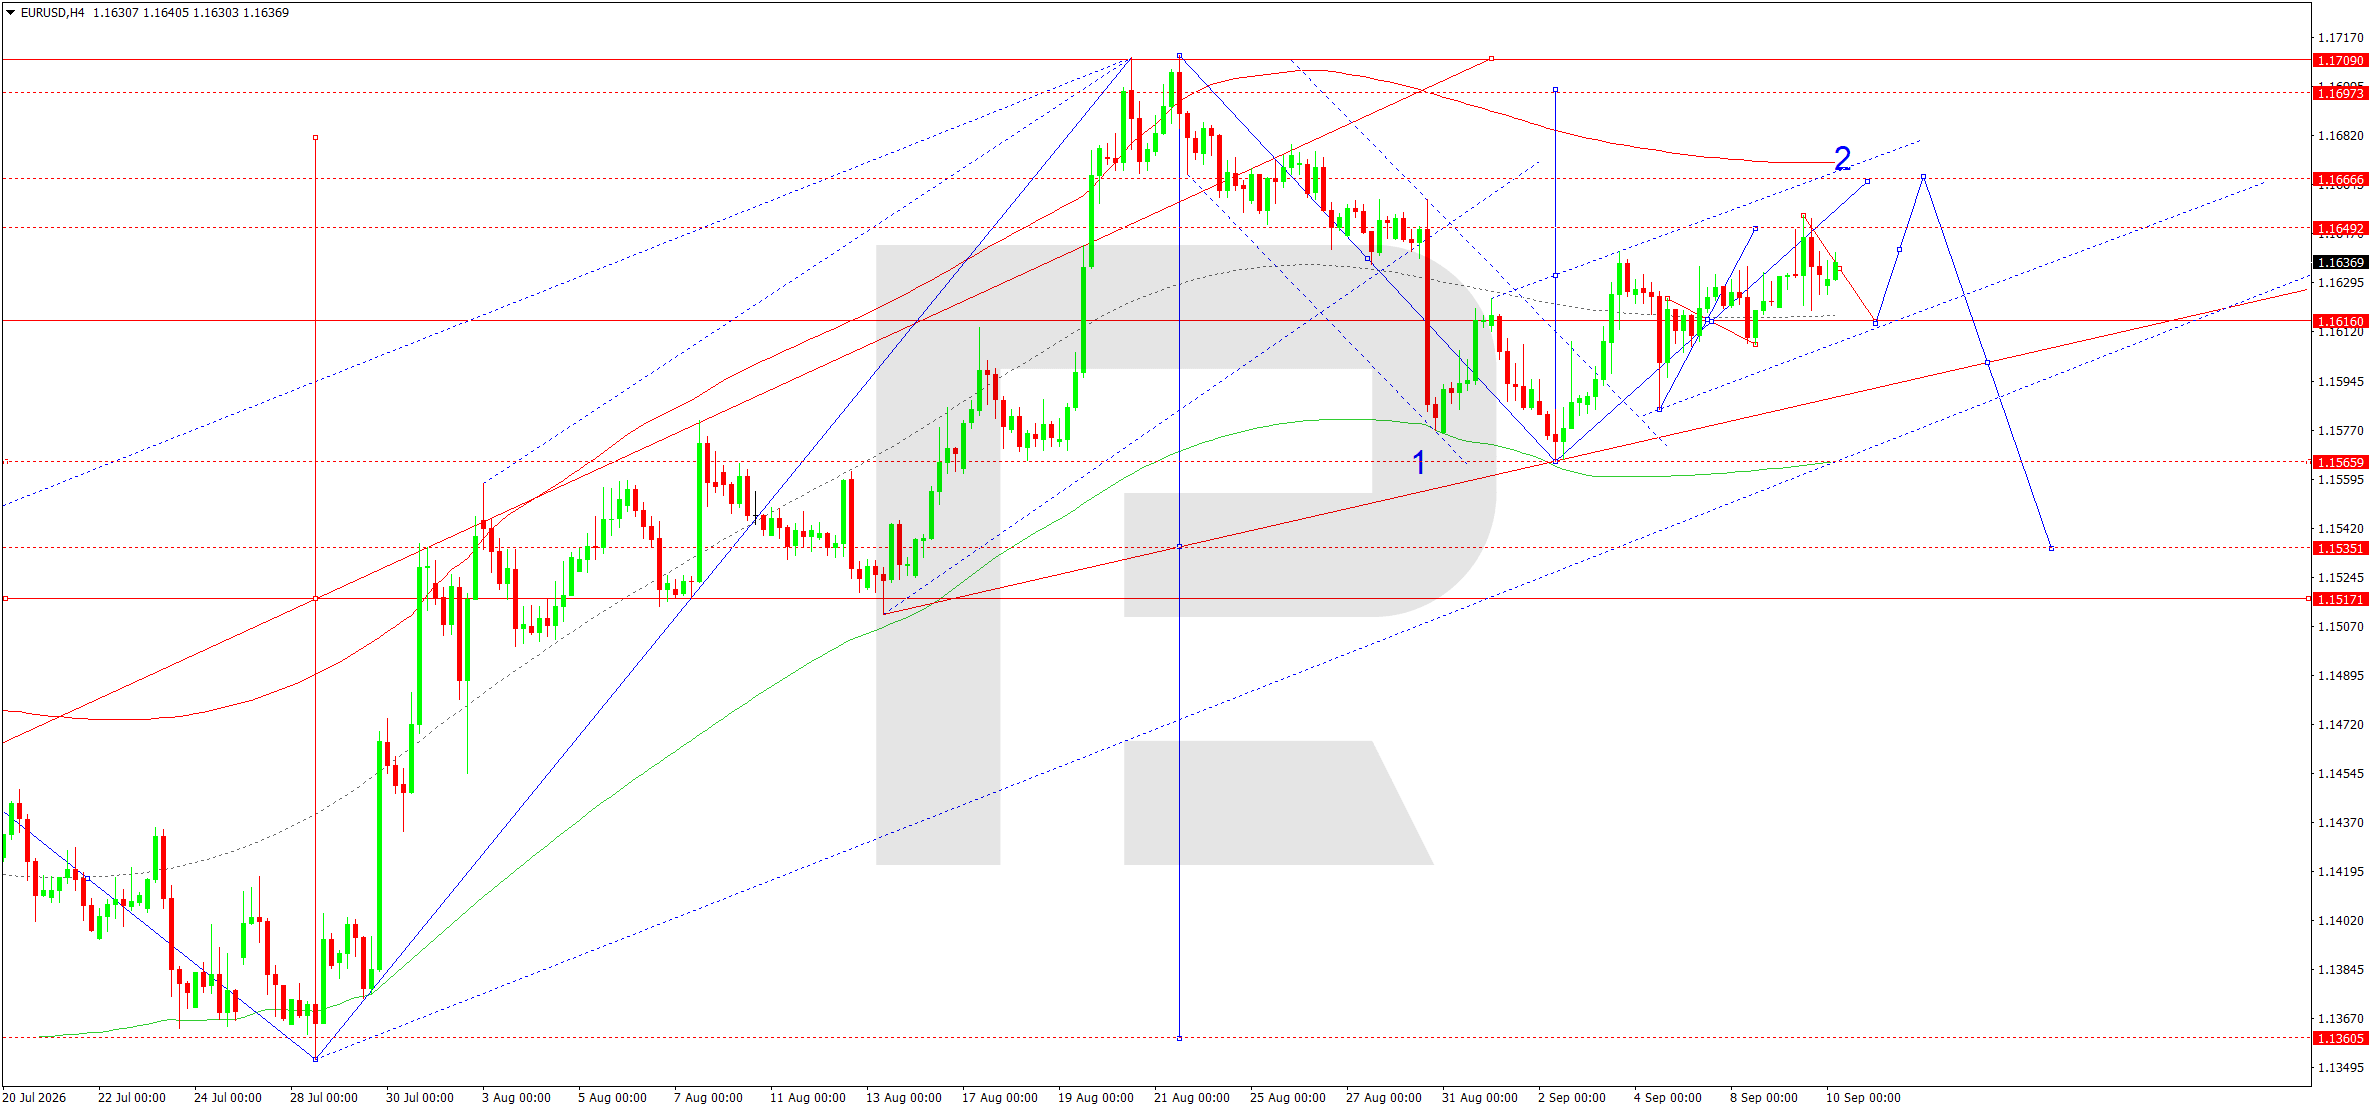
On the H4 chart, EURUSD is forming a consolidation range around 1.1616 after recovering from the 1.1566 area. The current structure preserves the possibility of another extension higher towards 1.1666, where an important resistance area and the upper part of the local Price Envelope are located. Reaching this area could complete the corrective upward wave and prepare the market for a new downward impulse.
The Elliott structure and the wave matrix point to a pivot around 1.1616. As long as the price remains above it, a move towards 1.1649 and 1.1666 is possible. However, the main scenario does not assume sustained consolidation above 1.1666. A return below 1.1616 would provide the first confirmation of weakening buying pressure. The next reference point would be 1.1566, and a breakout below it would open the way towards 1.1535 and 1.1525, where the lower boundary of the current Price Envelope and the target of the first downward wave are located. The main trend over the period under review is assessed as transitional, with a downside bias once the local upward correction is complete.
EURUSD forecast scenario
Trading scenario: SELL
- Price at the time of writing: 1.1639
- Entry price: 1.1634
- Stop loss: 1.1675
- Take profit: 1.1535
- Risk-to-reward ratio: 1:2
The trade idea is valid until 8:00 AM on 11 September 2026 (server time, UTC+3).
USDJPY forecast
On 10 September 2026, the fundamental backdrop for USDJPY remains predominantly favourable for the Japanese yen. The main factor is expectations of further policy tightening by the Bank of Japan. The market is increasingly pricing in a rate hike at the 18 September meeting, with a move to 1.25% under discussion. Additional support came from comments by BoJ representative Kazuyuki Masu about broadening inflationary pressure and core inflation approaching a sustainable level of around 2%. Against this backdrop, the yen has strengthened by around 4% since the start of September and remains near seven-month highs. Short covering in the yen and potential capital repatriation by Japanese investors are reinforcing the move.
The situation on the US side is less clear-cut. The Federal Reserve will hold its meeting on 15–16 September. Following the strong employment report, the market estimates the probability of a rate hike at around 60%, although most economists surveyed expect the 3.50–3.75% range to remain unchanged. Today, attention is focused on the Producer Price Index, followed by CPI on Friday. The rise in 10-year Treasury yields towards three-year highs formally supports the dollar, but this effect is currently being outweighed by expectations of tighter BoJ policy. High oil prices remain a negative factor for Japan as an energy importer, but in the current phase the market views the monetary-policy factor as stronger.
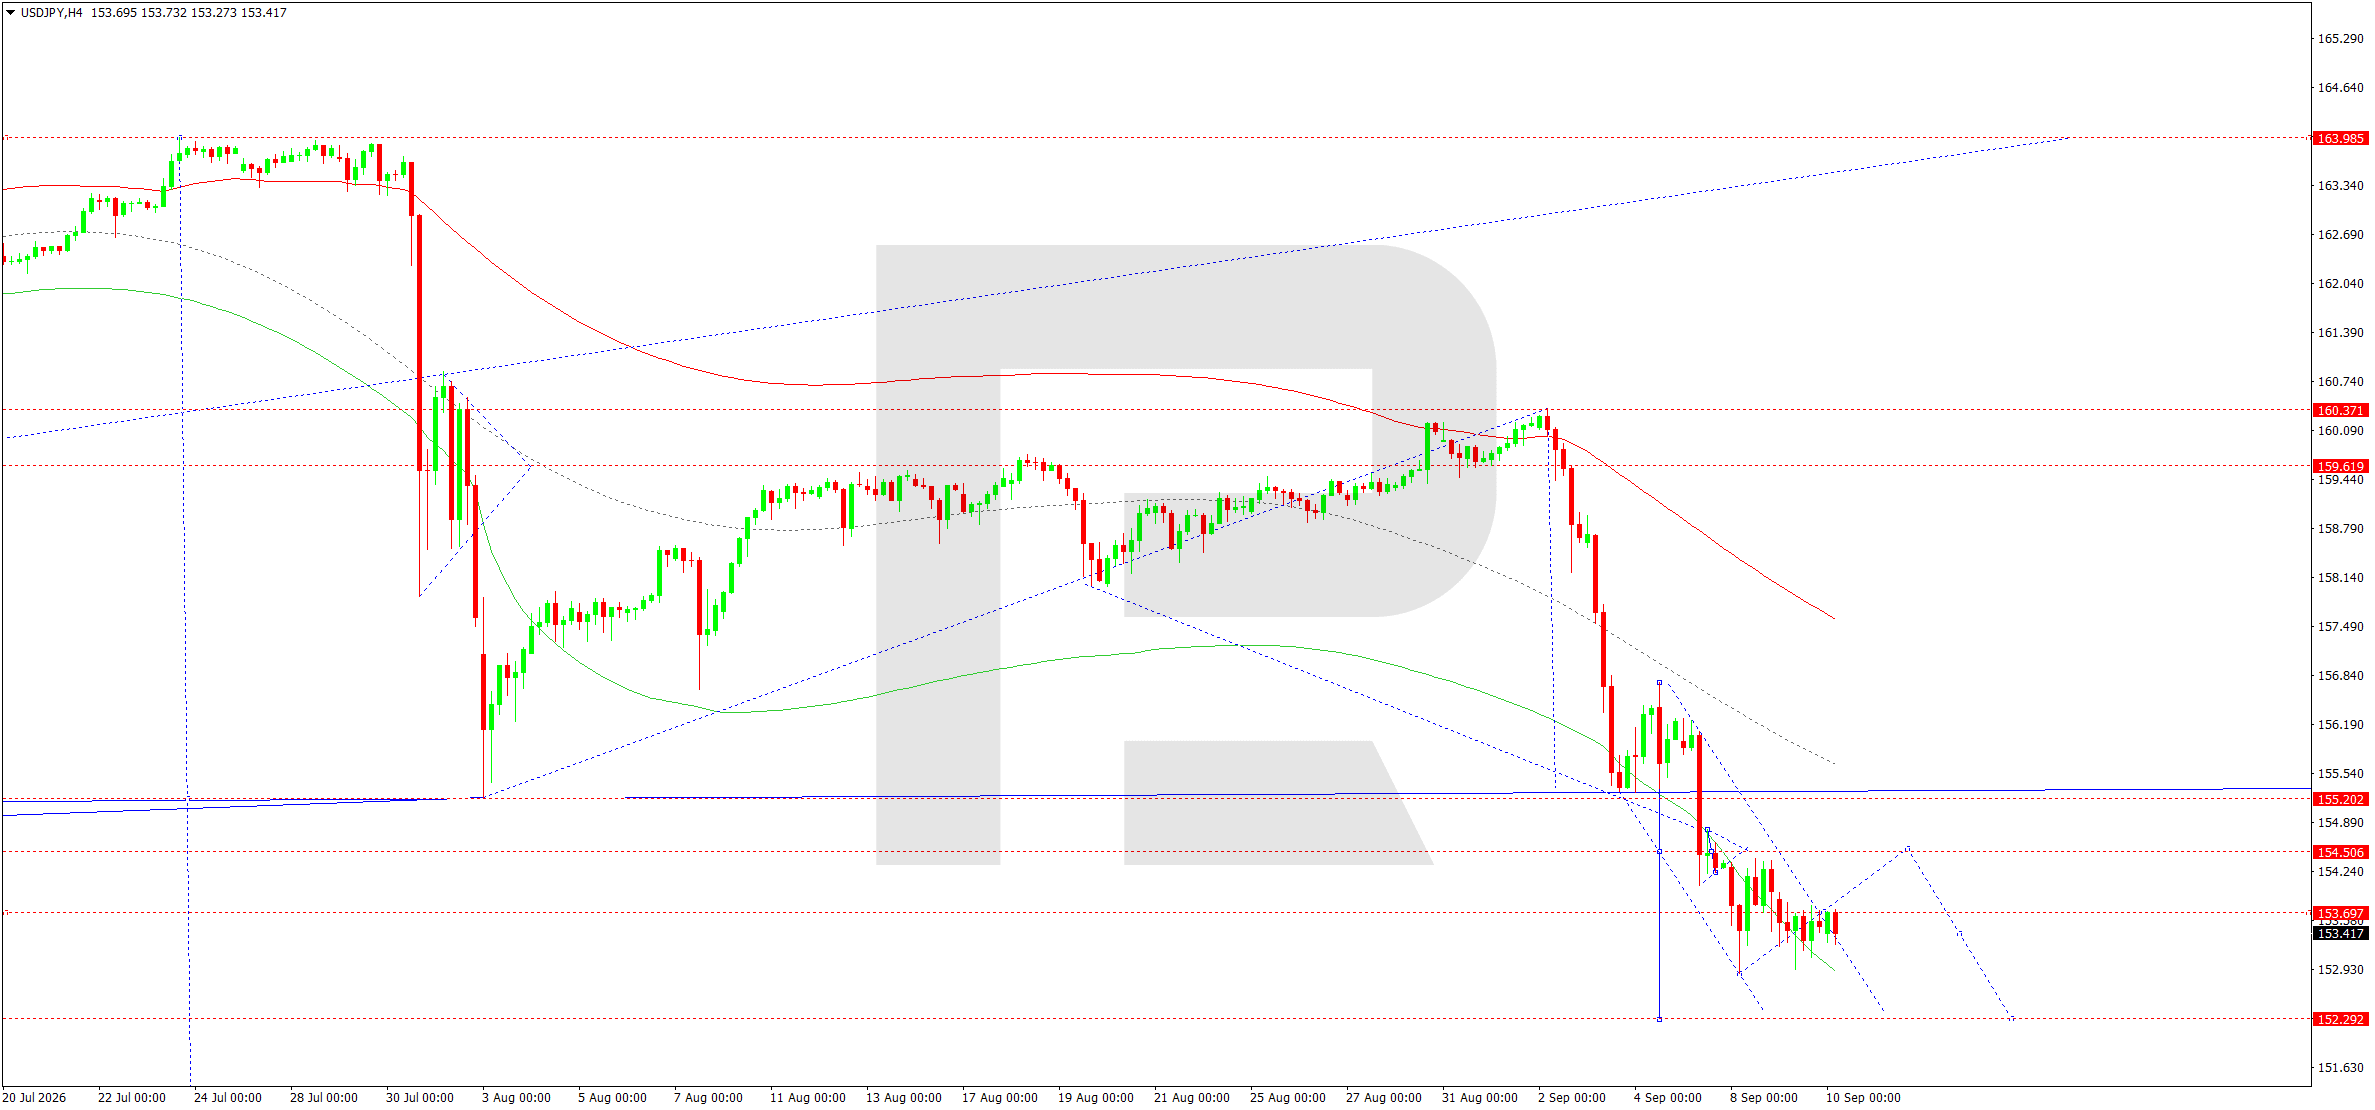
On the H4 chart, USDJPY retains a pronounced downward structure. After rebounding from 153.70, the market continued lower towards 152.92, forming another local low. The price is below the central part of the Price Envelope and significantly below the descending moving average, confirming that seller pressure remains in place.
The downward wave matrix has its pivot around 154.81. As long as the market remains below this level, corrective rises are viewed as part of the downward move. In the near term, consolidation above 152.92 and a recovery towards 153.70–154.06 are possible. However, consolidation below 152.92 would confirm continuation of the impulse towards 152.22. If pressure intensifies, the next targets would be 150.00 and 149.30. A move above 154.81 would weaken the current scenario and create conditions for a deeper correction towards 155.20.
From a broader perspective, the decline from the 160.37 area has already formed a sequence of lower highs and lower lows. This confirms the development of an Elliott impulsive structure. As long as the price does not return above 154.81–155.20, there is insufficient reason to consider the current wave complete. Local stabilisation near 152.92 may only slow the move, not change its direction.
USDJPY forecast scenario
Trading scenario: SELL
- Price at the time of writing: 153.38
- Entry price: 153.33
- Stop loss: 153.85
- Take profit: 152.22
- Risk-to-reward ratio: 1:2
The trade idea is valid until 8:00 AM on 11 September 2026 (server time, UTC+3).
GBPUSD forecast
On 10 September 2026, the pound remains relatively resilient, although the fundamental backdrop is mixed. The Bank of England will hold its next meeting on 17 September. Most economists expect the rate to remain unchanged at 3.75% despite rising inflation risks. UK consumer inflation accelerated to 2.9% in July, while the sharp rise in Brent above 100 USD per barrel has renewed concerns about energy costs. This factor is particularly important for the UK economy because of its dependence on energy imports. At the same time, BoE Governor Andrew Bailey stressed that rate hikes are not a predetermined scenario and will depend on the extent to which the energy shock passes through to domestic prices.
The money market is nevertheless pricing in the possibility of tighter policy in the coming months. This supports the pound, but high UK bond yields are also tightening financial conditions and may restrain economic activity. On the dollar side, attention is focused on US inflation data and the Federal Reserve’s 15–16 September meeting. The market estimates the probability of a US rate hike at around 60%, while most economists expect a pause. This uncertainty is limiting directional movement in GBPUSD. For the next session, the fundamental backdrop allows for short-term pound strength, but its sustainability will depend on how aggressively the market continues to reprice the outlook for the BoE and the Fed.
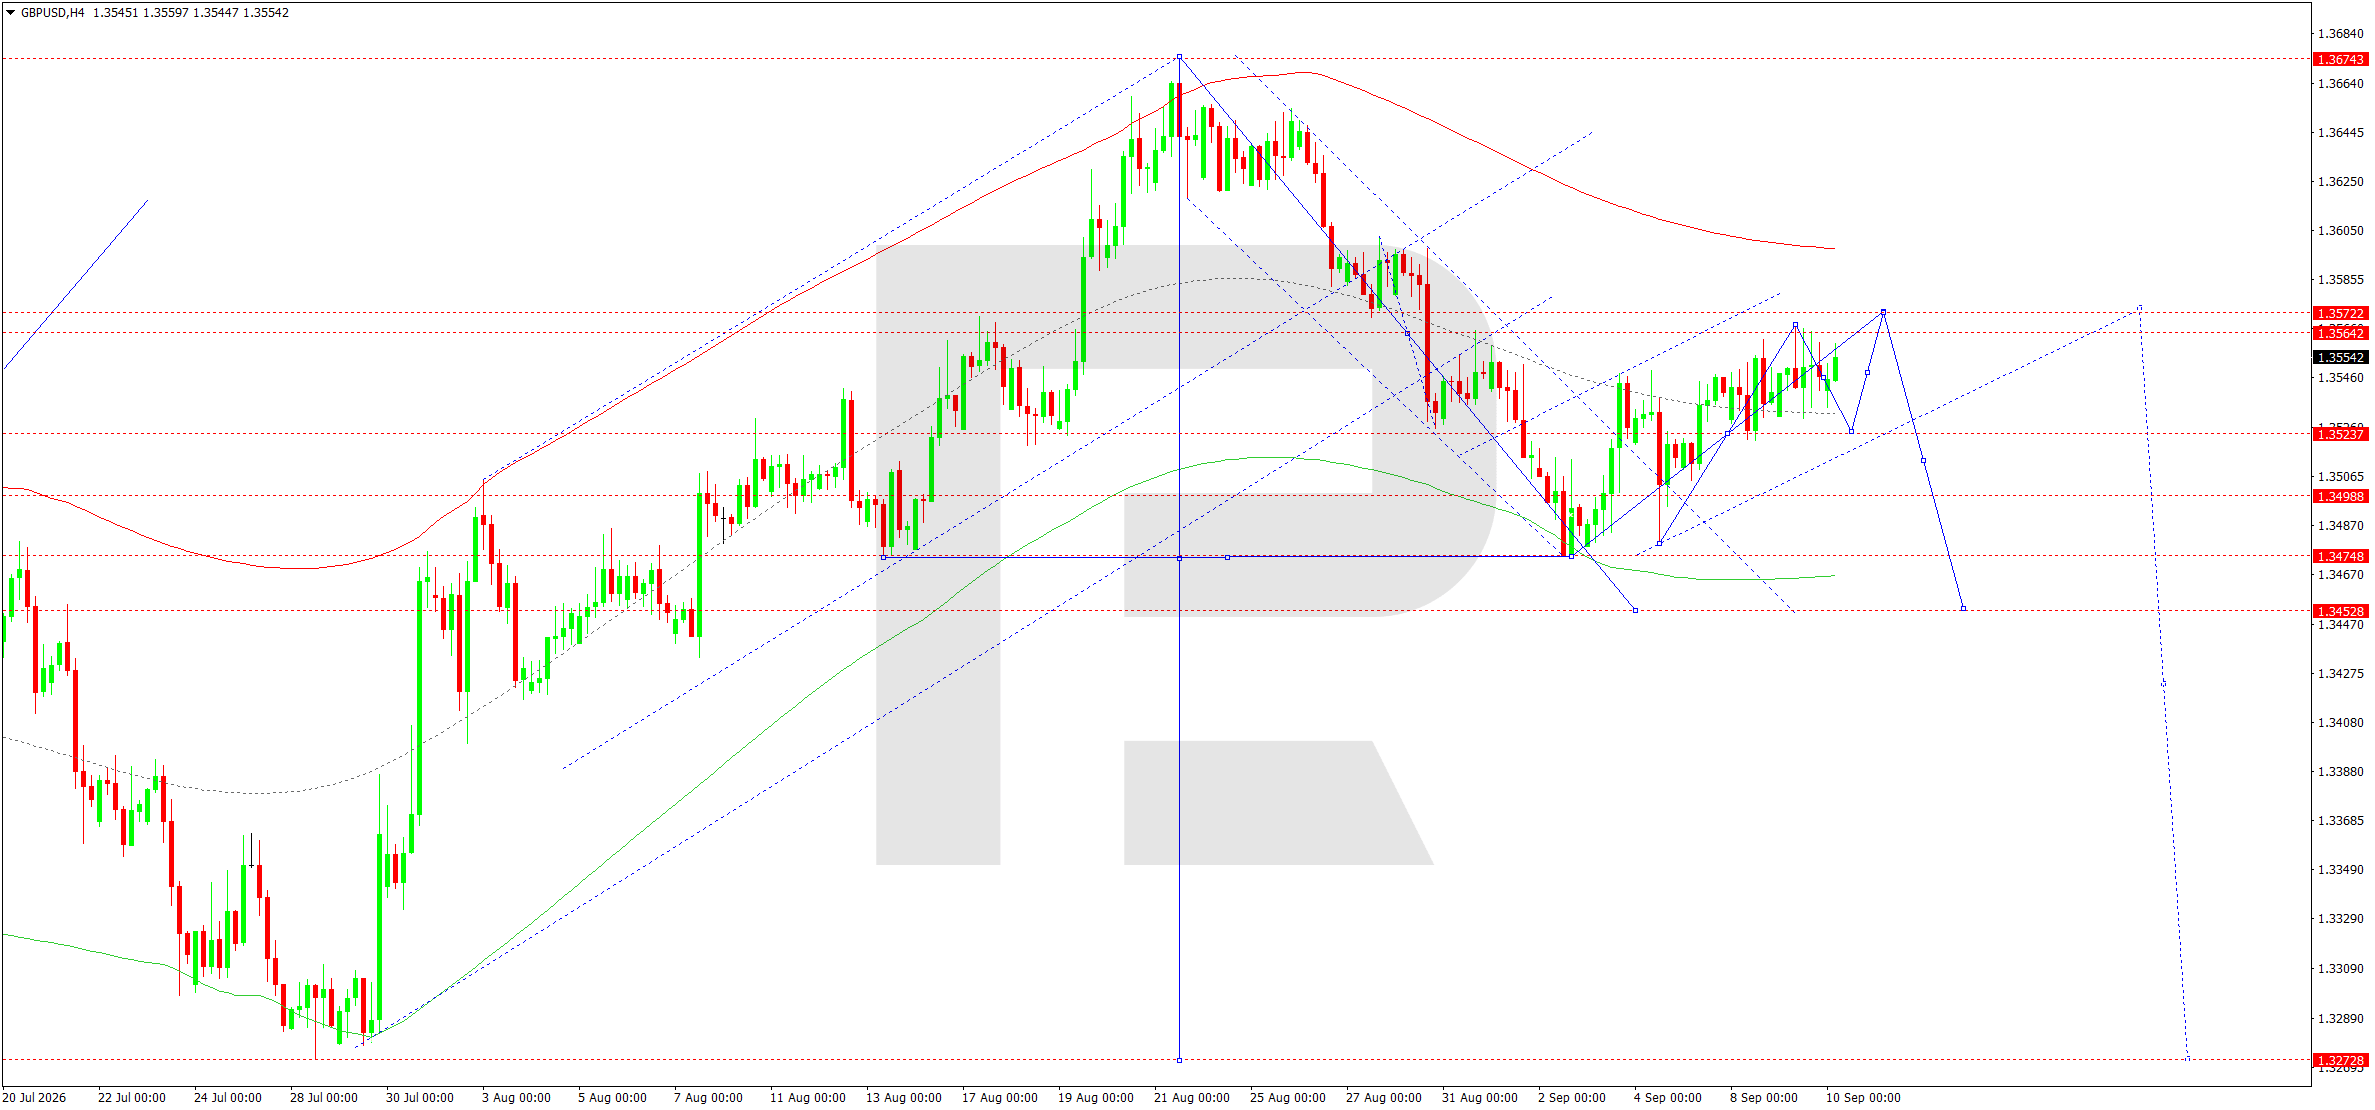
On the H4 chart, after recovering from the 1.3475 area, GBPUSD formed an upward wave towards 1.3566. A decline towards 1.3530 then followed, after which the price moved into a compact consolidation range. The current structure allows for another extension higher towards 1.3572, where the nearest strong resistance and the likely completion zone of the corrective move are located.
The upward wave matrix has its pivot around 1.3523. As long as the price remains above this level, there is still scope for a rise towards 1.3572. However, the broader H4 pattern after the 1.3674 high remains corrective and downward. The price failed to recover towards the previous highs, while the sequence of local highs continues to preserve seller pressure.
Once the rise towards 1.3572 is complete, the main scenario becomes a reversal towards 1.3523 and 1.3499. A breakout below 1.3499 would open the way towards 1.3475 and then 1.3452, which corresponds to the lower boundary of the Price Envelope. Consolidation above 1.3572 would temporarily delay the decline and allow a test of 1.3600–1.3610. From an Elliott wave perspective, the current rise can be viewed as the final corrective phase within the broader downward move from 1.3674. Therefore, the 1.3572–1.3600 area remains a zone of heightened seller interest.
GBPUSD forecast scenario
Trading scenario: SELL
- Price at the time of writing: 1.3555
- Entry price: 1.3550
- Stop loss: 1.3580
- Take profit: 1.3452
- Risk-to-reward ratio: 1:3
The trade idea is valid until 8:00 AM on 11 September 2026 (server time, UTC+3).
AUDUSD forecast
On 10 September 2026, the Australian dollar remains relatively resilient, although the fundamental backdrop is mixed. The Reserve Bank of Australia kept its rate unchanged at 4.35% in August after three increases since the start of the year. The regulator has stressed that inflation remains too high and financial conditions need to stay restrictive. Annual CPI for July was 3.5%, while stronger core inflation readings increased expectations that the RBA could return to tightening. This factor supports the AUD through higher yields.
At the same time, domestic demand is showing signs of cooling. The Westpac-Melbourne Institute Consumer Sentiment Index fell by 5.2% to 84.4 in September, reflecting pressure from high interest rates, fuel prices and a weak housing market. Oil above 100 USD per barrel is increasing inflation risks but is also worsening global risk appetite, which traditionally weighs on the Australian currency. The AUD is receiving additional support from the resilience of the Chinese yuan and signs of accelerating inflation in China, as the condition of the Chinese economy remains an important reference point for Australian exports. In the US, attention is focused on inflation data and the Federal Reserve’s decision next week. As a result, the fundamental balance allows AUDUSD to remain near local highs, but weaker risk sentiment is limiting further upside potential.
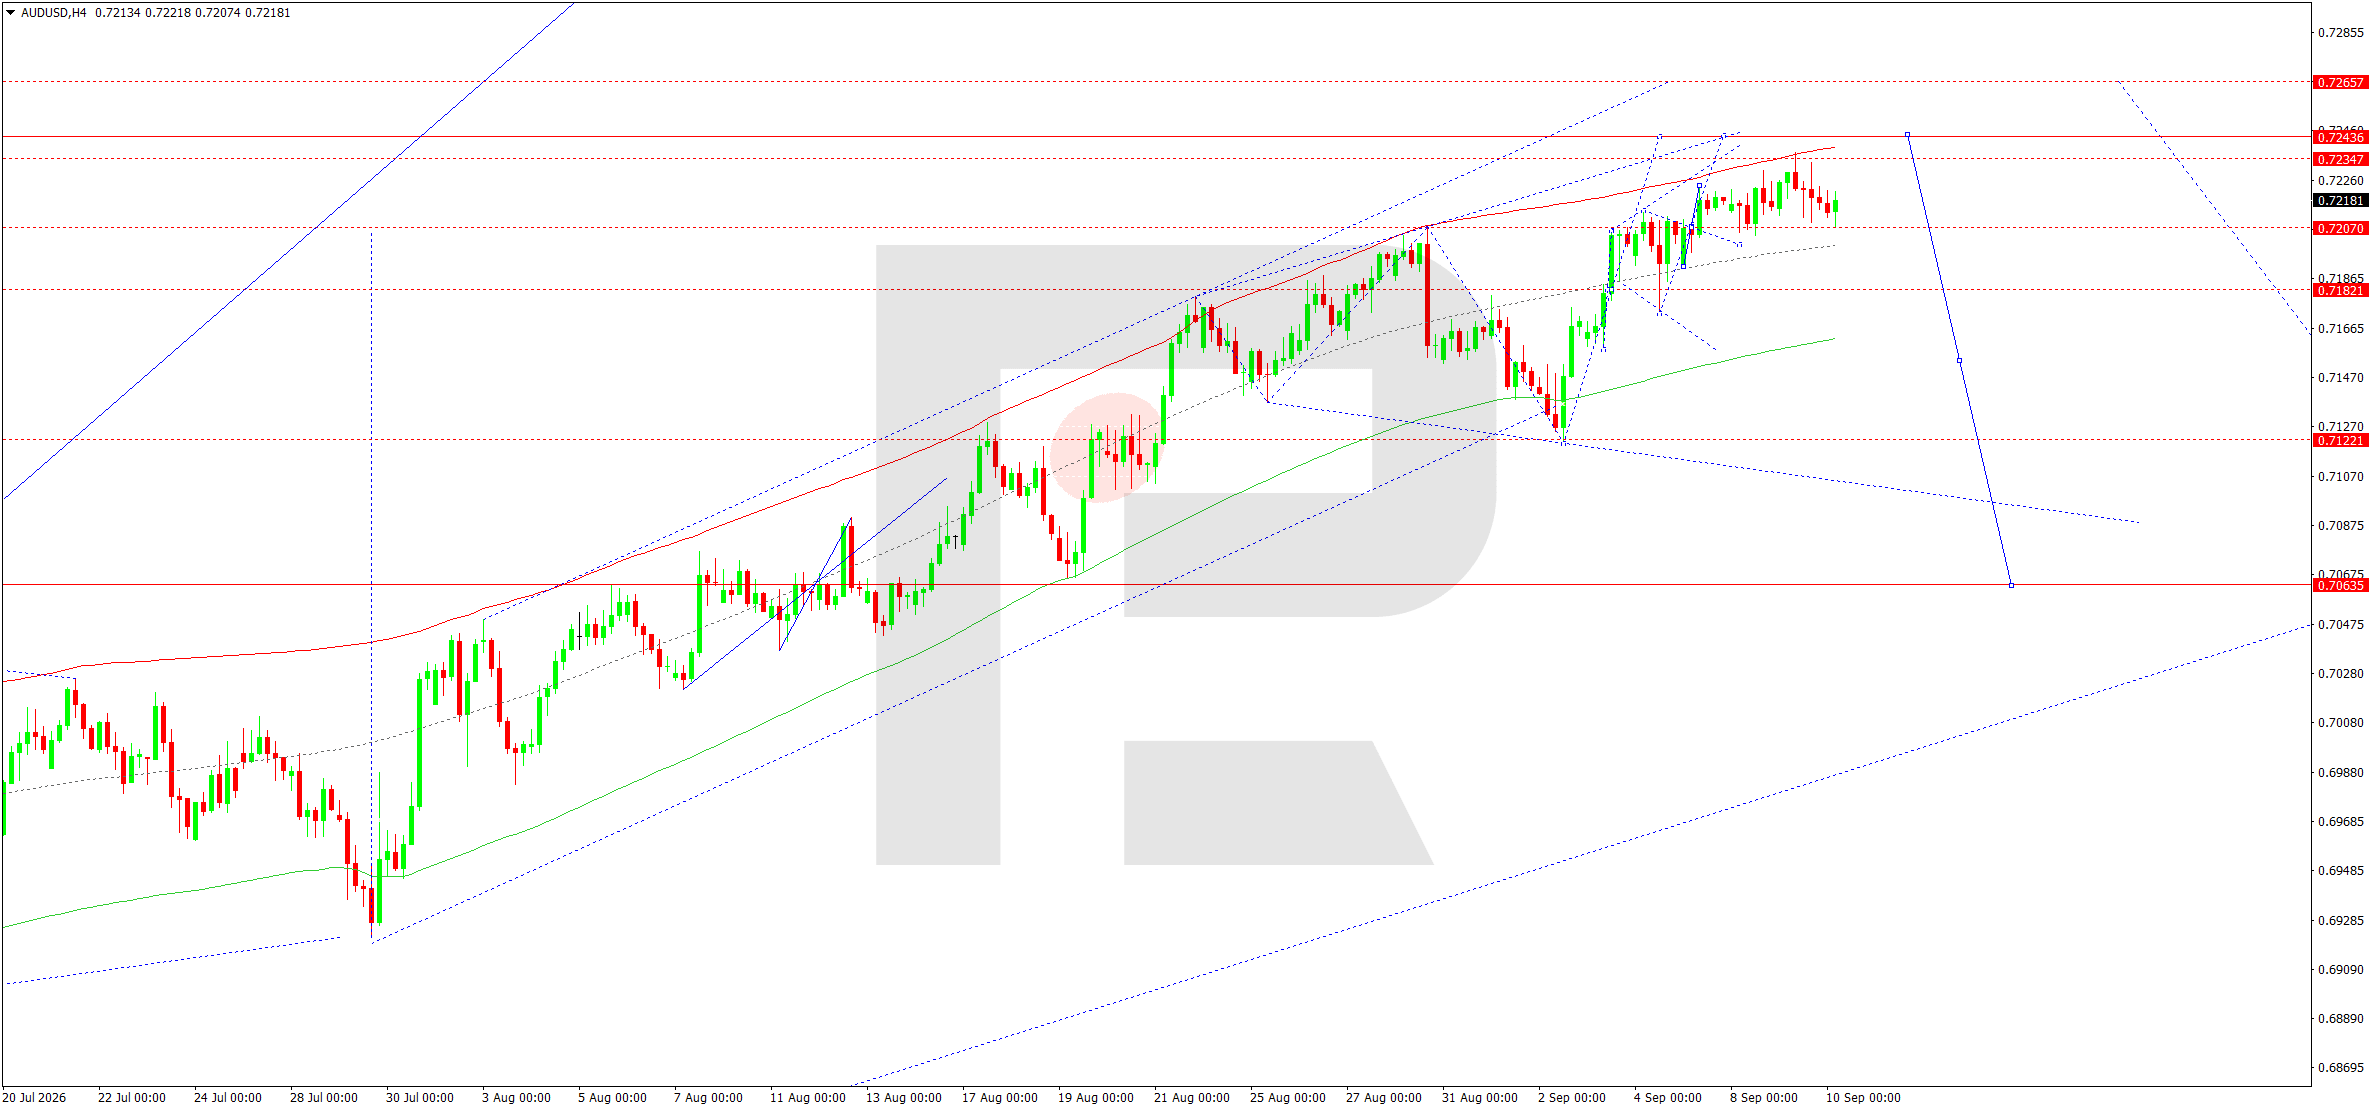
On the H4 chart, AUDUSD has formed a consolidation range around 0.7207 after a confident upward move from the 0.7122 area. The price remains in the upper part of the current Price Envelope, while the local structure allows the rise to continue towards 0.7233 and 0.7246. The 0.7246 area is viewed as a likely zone where the current upward wave may end.
The upward wave matrix has its pivot around 0.7181. As long as the price remains above it, the short-term buying impulse remains intact. However, a move towards 0.7246 would test the upper boundary of the Price Envelope and resistance, where the probability of a reversal increases. Once the rise is complete, the main scenario becomes a return towards 0.7207 and then 0.7181. A breakout below 0.7181 would confirm the start of a deeper downward wave with targets at 0.7122 and 0.7063.
From an Elliott wave perspective, the current rise appears to be the final phase of a local impulse, so the priority shifts towards selling after a test of the upper zone. Consolidation above 0.7246 would invalidate this signal and open the way towards 0.7266. Until such confirmation appears, the more likely scenario remains the formation of a top within the ascending channel followed by a move towards its lower boundary.
AUDUSD forecast scenario
Trading scenario: SELL
- Price at the time of writing: 0.7221
- Entry price: 0.7216
- Stop loss: 0.7250
- Take profit: 0.7122
- Risk-to-reward ratio: 1:3
The trade idea is valid until 8:00 AM on 11 September 2026 (server time, UTC+3).
USDCAD forecast
On 10 September 2026, the Canadian dollar is being influenced by two opposing factors: expensive oil and an intensifying trade conflict with the US. The Bank of Canada kept its policy rate unchanged at 2.25% on 2 September, but its rhetoric became noticeably more hawkish. Governor Tiff Macklem noted that if inflation remains elevated, several rate hikes may be required. Annual inflation in Canada has reached 3%, while rising energy costs are increasing the risk of further price pressure. This supports expectations of tighter BoC policy and, under normal conditions, should strengthen the Canadian currency.
Oil remains an additional positive factor: Brent has again risen above 100 USD per barrel, improving Canada’s terms of trade as a major commodity exporter. However, this effect is being partly offset by a sharp deterioration in trade relations with the US. New restrictions and reciprocal tariff measures have increased uncertainty around exports and the outlook for Canadian economic growth. This trade factor put pressure on the CAD in the previous session despite expensive oil. On the US dollar side, the market is awaiting PPI today and CPI on Friday ahead of the Federal Reserve’s 15–16 September meeting. Overall, the fundamental backdrop for USDCAD remains mixed, but local risks still allow for Canadian dollar strength as long as oil remains above 100 USD.
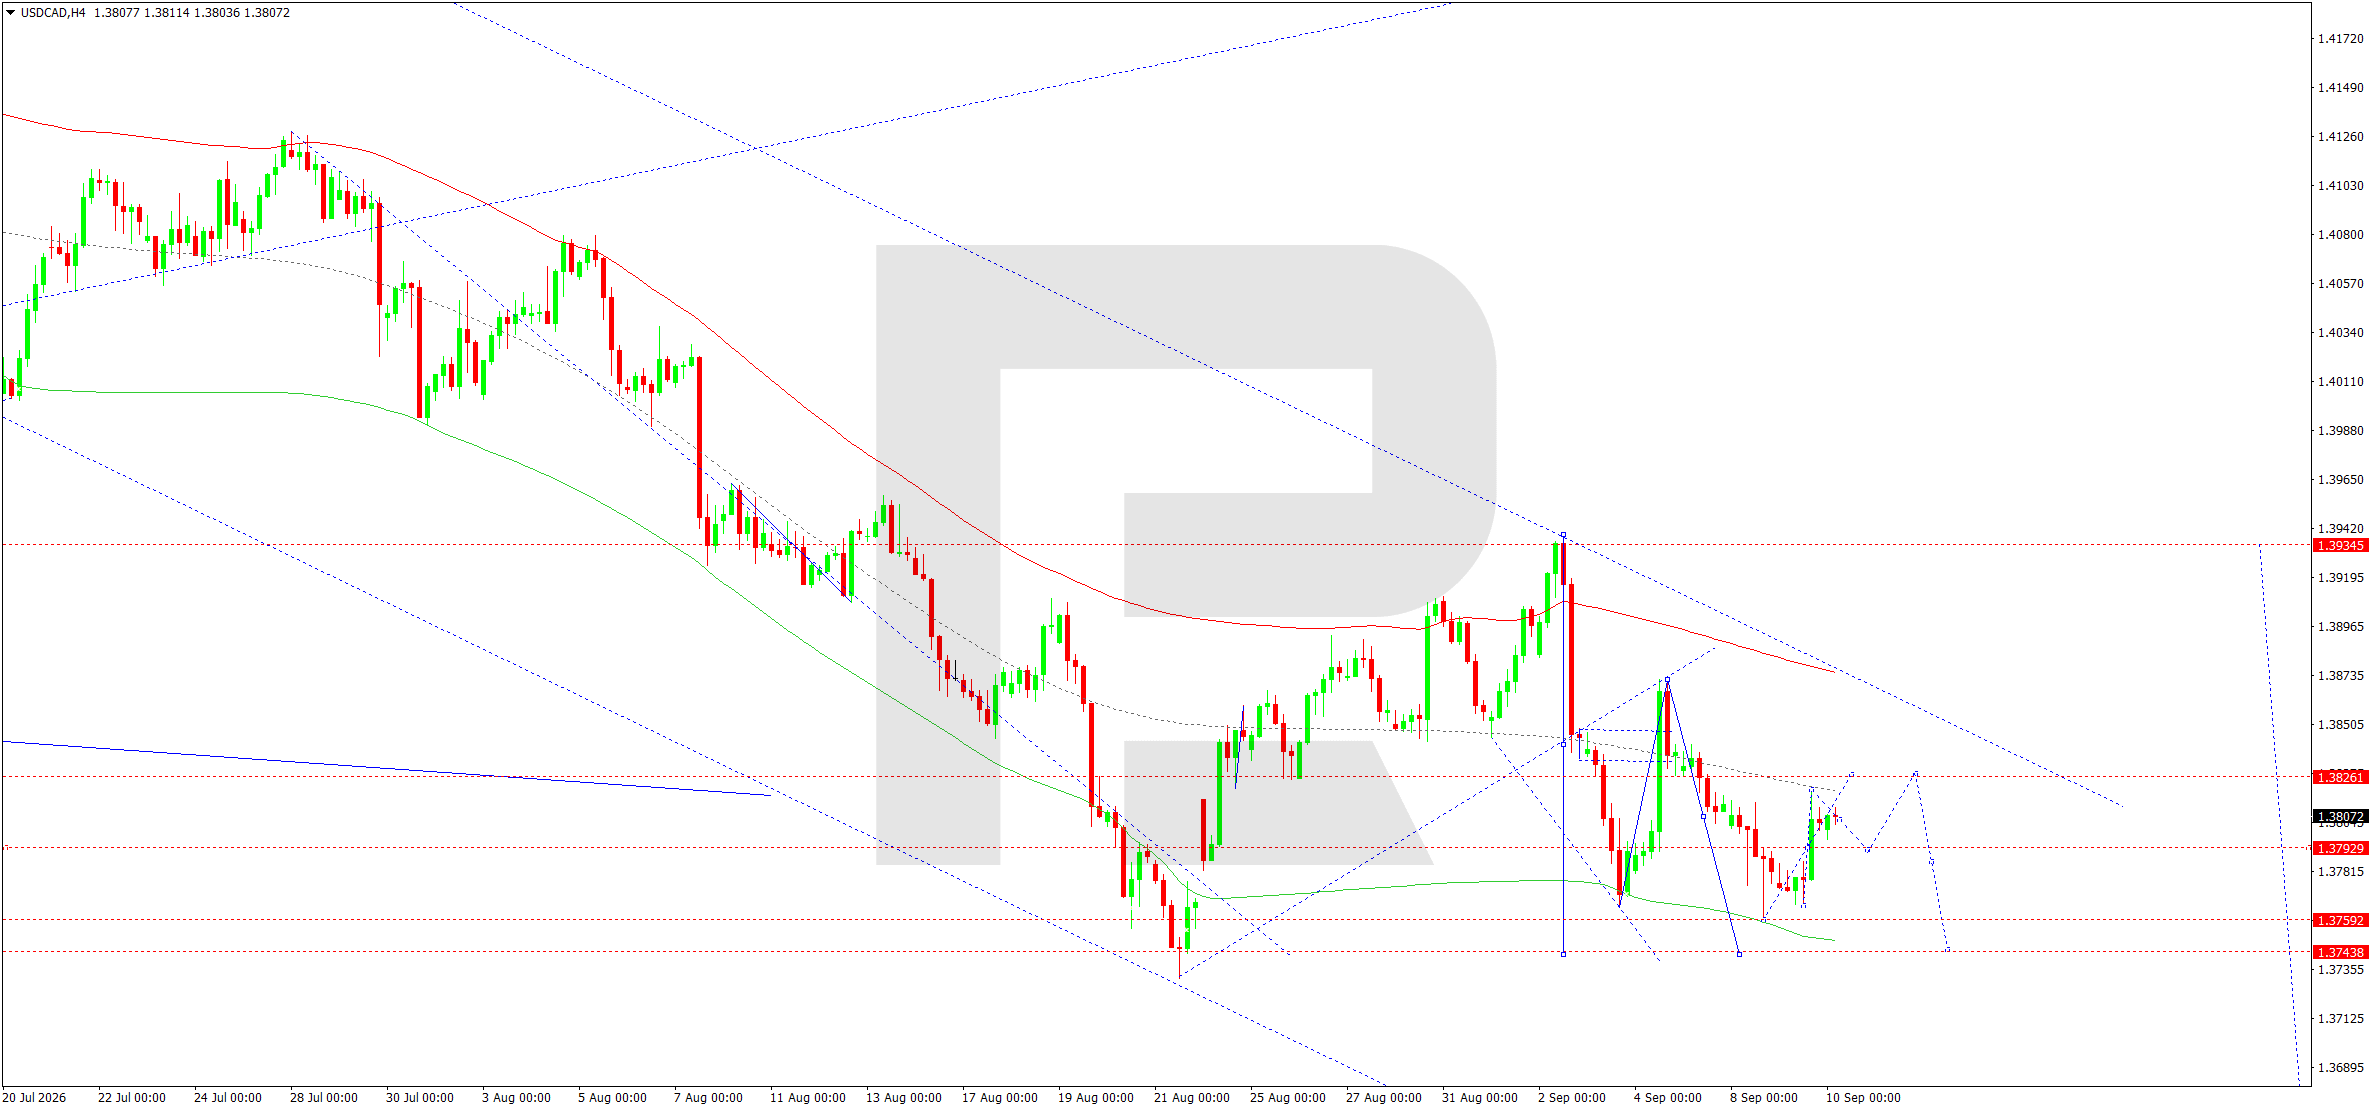
On the H4 chart, after a corrective recovery towards 1.3826, USDCAD returned to a decline and is currently trading around 1.3805. The local structure is forming a range between 1.3743 and 1.3826. Within this range, the price remains below the descending line of the broader move and below the upper boundary of the Price Envelope, preserving the sellers’ advantage.
The downward wave matrix has its pivot around 1.3840. As long as the price remains below this level, any rise is viewed as corrective. In the near term, another test of 1.3818–1.3826 is possible, after which the main scenario remains a decline towards 1.3793 and 1.3759. A breakout below 1.3743 would confirm continuation of the downward impulse.
At the same time, the 1.3743–1.3759 area is also a strong support zone and the lower part of the Price Envelope, so the probability of an upward reversal would increase after it is tested. In the broader scenario, a recovery towards 1.3826 and then 1.3939 could begin from this area. Until such a reversal forms, selling remains the priority on H4. From an Elliott wave perspective, the current section can be interpreted as a continuation of the downward impulsive structure, with the next wave likely to end near the lower boundary of the range.
USDCAD forecast scenario
Trading scenario: SELL
- Price at the time of writing: 1.3805
- Entry price: 1.3800
- Stop loss: 1.3830
- Take profit: 1.3743
- Risk-to-reward ratio: 1:2
The trade idea is valid until 8:00 AM on 11 September 2026 (server time, UTC+3).
XAUUSD forecast
On 10 September 2026, gold continues to receive support from a weak dollar, geopolitical tensions and elevated demand for safe-haven assets. The spot price was around 4,414 USD per ounce in the morning. The market’s main focus is on US inflation data: the Producer Price Index is released today, followed by CPI on Friday. These figures will be the final key indicators before the Federal Reserve’s 15–16 September meeting. The market estimates the probability of a rate hike at around 60%, while most economists expect the 3.50–3.75% range to remain unchanged. High rates usually limit demand for gold, but in the current phase this factor is partly offset by dollar weakness and demand for inflation protection.
The metal is receiving additional support from a new escalation of the conflict in the Middle East. Brent remains above 100 USD per barrel following attacks on shipping and energy infrastructure, increasing inflation risks and uncertainty in global markets. At the same time, the yield on 10-year US Treasuries has risen to its highest levels since 2023, providing a counterweight to gold’s advance. Fiscal risks also remain in focus after US government debt rose above 40 trillion USD. As a result, the fundamental backdrop remains constructive for gold over the medium term, but the probability of sharp corrective moves is high ahead of the inflation data.
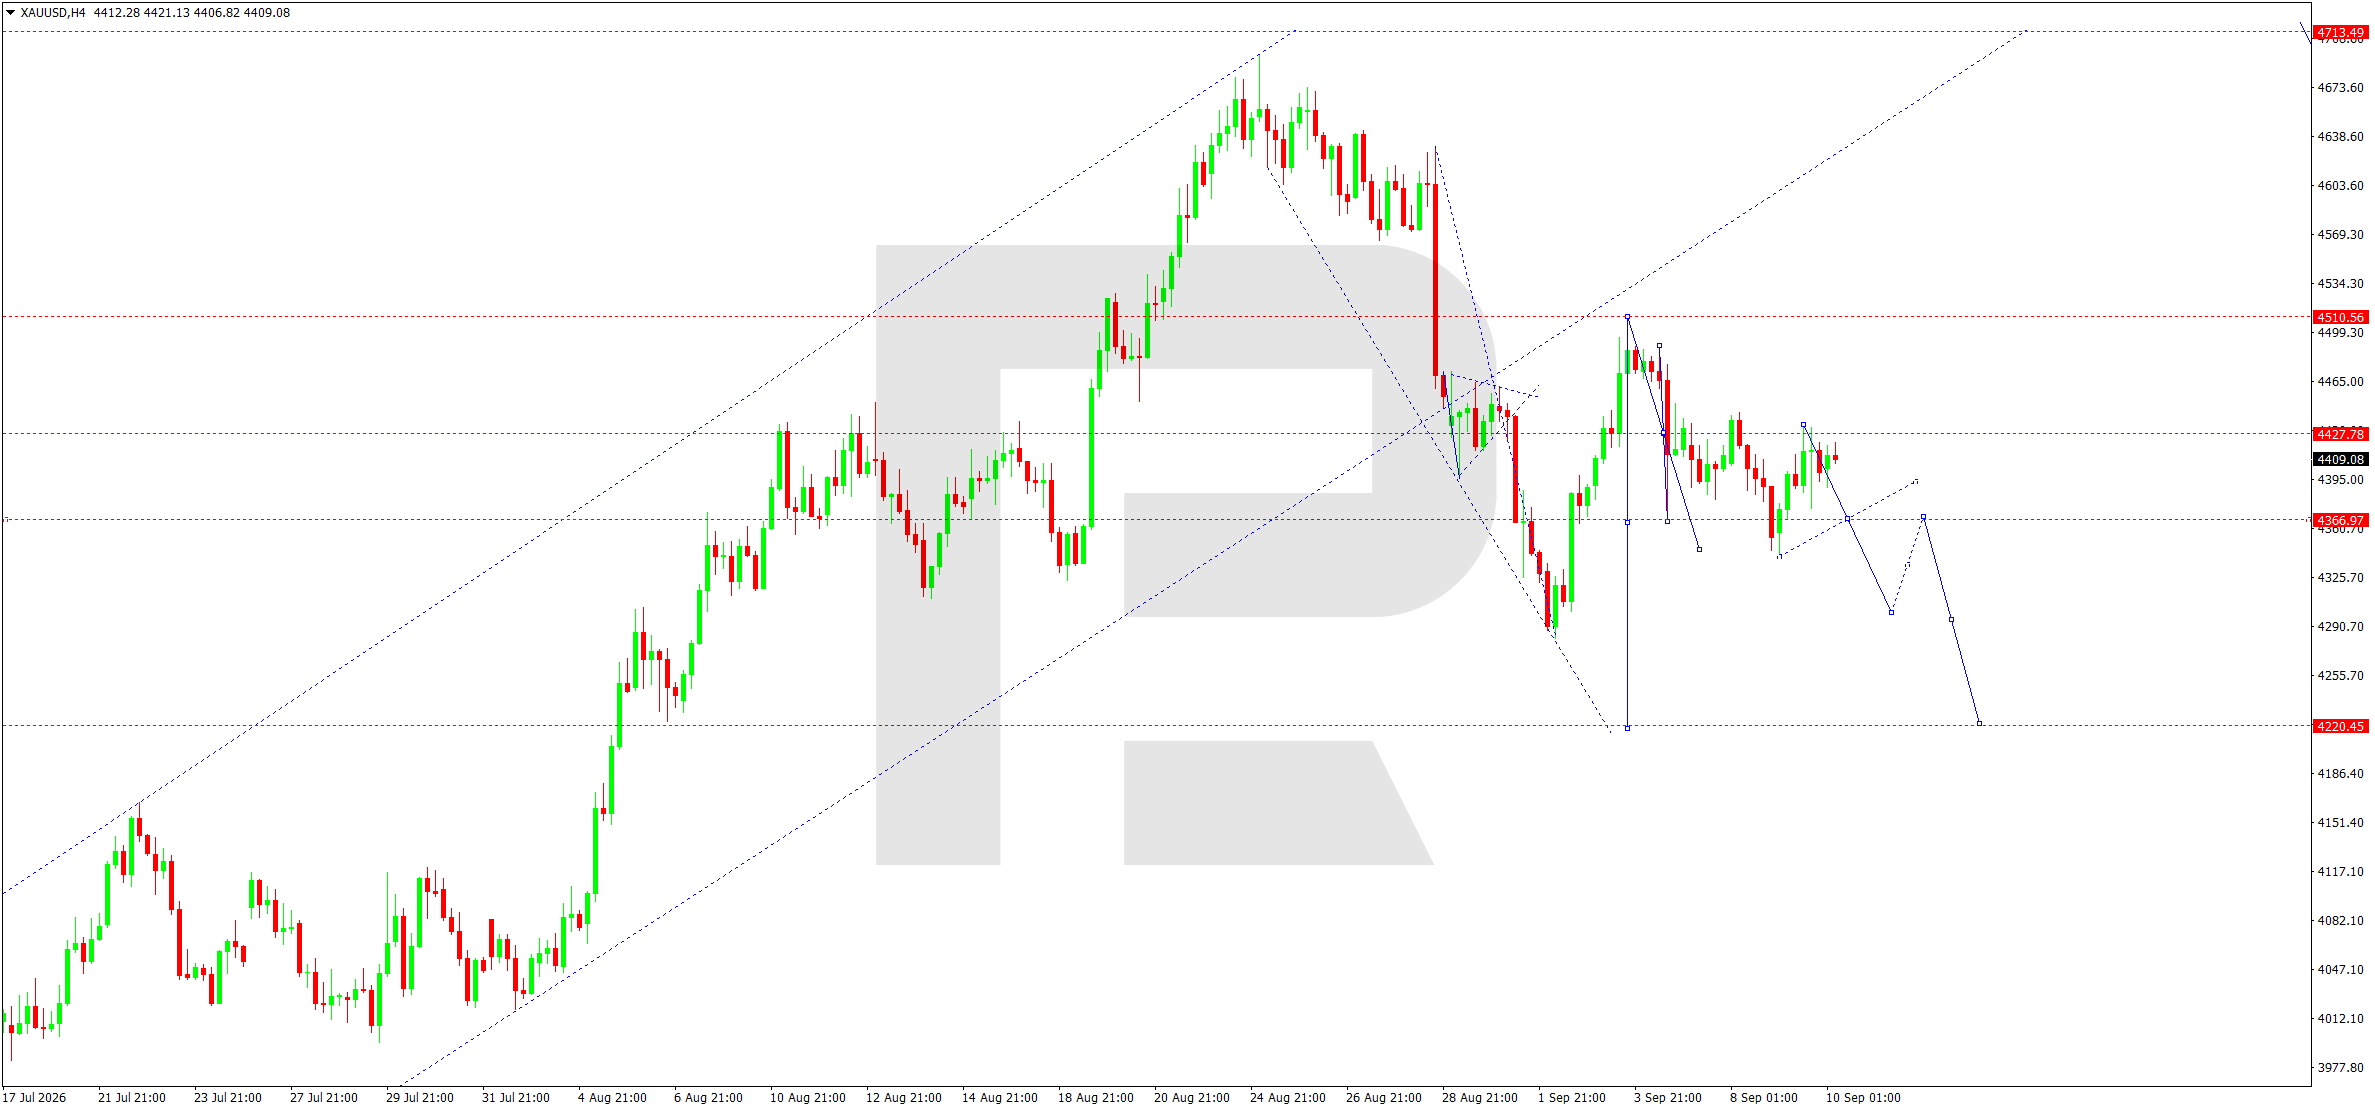
On the H4 chart, XAUUSD continues to form a broad range around 4,427. A decline towards 4,343 was followed by a correction towards 4,431, but the price failed to consolidate above the central area of the range. This preserves the probability of a renewed downward move.
The downward wave matrix has its pivot around 4,433. As long as the price remains below this level, the advantage is gradually shifting towards sellers. The nearest support is 4,367. A breakout below it would confirm the development of another downward wave towards 4,300. After a possible local correction from this area, the next target would be 4,220, which coincides with the lower boundary of the Price Envelope.
From an Elliott wave perspective, the current rise from 4,343 can be viewed as a corrective wave within a broader downward structure. A return above 4,433 would allow the price to retest 4,510, but only consolidation above this resistance would materially weaken the downside scenario. An important confirmation would be a move below 4,367 followed by a retest of the level from below. Until this signal appears, the price may remain in a sideways phase between 4,367 and 4,433 for some time. The sequence of lower local highs after the August peak indicates that pressure within the corrective structure remains in place.
XAUUSD forecast scenario
Trading scenario: SELL
- Price at the time of writing: 4,410
- Entry price: 4,405
- Stop loss: 4,440
- Take profit: 4,300
- Risk-to-reward ratio: 1:3
The trade idea is valid until 8:00 AM on 11 September 2026 (server time, UTC+3).
US 500 forecast
On 10 September 2026, the US stock market remains under pressure from a combination of high bond yields, expensive oil and uncertainty ahead of inflation data. The S&P 500 fell by around 0.5% in the previous session as Brent rose above 100 USD per barrel, intensifying concerns about a new wave of inflation. The yield on 10-year US Treasuries climbed towards 4.84%, the highest levels since 2023. Rising risk-free yields increase discount rates and are particularly significant for highly valued technology companies.
Today, the market is awaiting the US Producer Price Index, followed by CPI on Friday. These data will shape expectations ahead of the Federal Reserve’s 15–16 September meeting. The futures market estimates the probability of a rate hike at around 60%, although most economists still expect a pause. Elevated uncertainty could keep the index under pressure during the session. However, the fundamental picture is not entirely negative. Corporate earnings remain strong: around 86% of S&P 500 companies that have already reported second-quarter results exceeded analysts’ expectations. Several banks have raised their index targets on the back of resilient earnings and investment in artificial intelligence infrastructure. Therefore, medium-term support remains in place, but inflation and interest-rate risks dominate the current horizon.
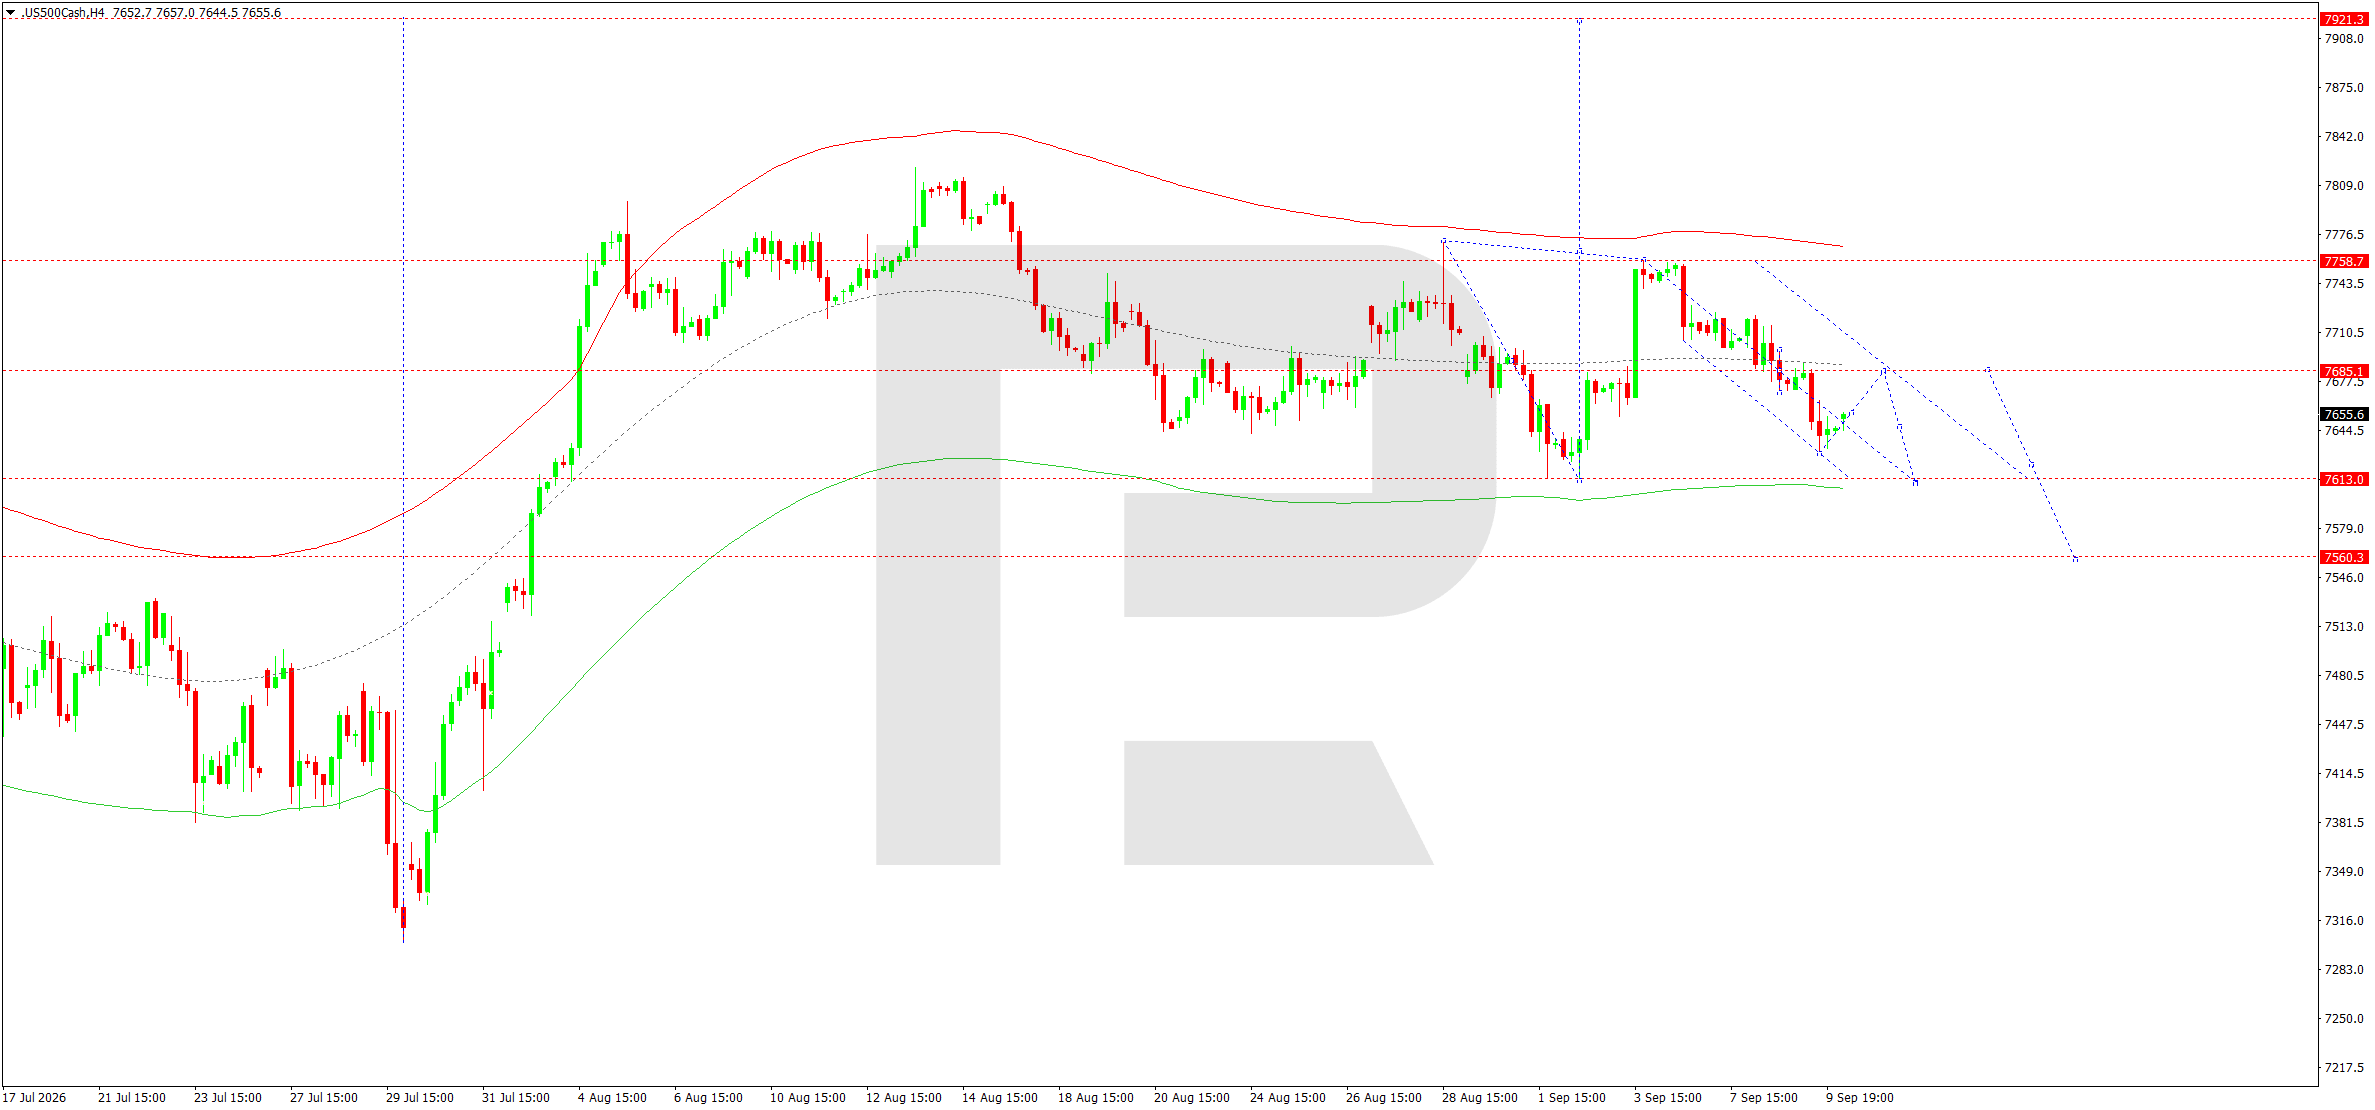
On the H4 chart, the US 500 formed a downward wave from the 7,758 area towards 7,630. After reaching a local low, a correction began, but the structure remains below the central 7,685 area and beneath a sequence of lower local highs. This preserves the sellers’ advantage.
The downward wave matrix has its pivot around 7,685. As long as the index trades below it, any rise is viewed as corrective. In the near term, another move towards 7,685 and consolidation below this level is possible. A downward rebound would create conditions for a return towards 7,630 and 7,613. A breakout below 7,613 would confirm continuation of the impulse towards 7,560.
From an Elliott wave perspective, the current section appears to be the development of another downward phase after the correction from the September low ended. A return above 7,685 would ease the pressure and allow a test of 7,758, but only consolidation above 7,758 would shift the short-term structure in favour of buyers. Another factor is the price position relative to the central line of the Price Envelope: the market is not yet showing a sustained return above it. Therefore, a test of 7,685 should be treated as a key control point. A continued sequence of lower highs would confirm pressure towards the lower boundary of the range.
US 500 forecast scenario
Trading scenario: SELL
- Price at the time of writing: 7,659
- Entry price: 7,654
- Stop loss: 7,690
- Take profit: 7,613
- Risk-to-reward ratio: 1:1
The trade idea is valid until 8:00 AM on 11 September 2026 (server time, UTC+3).
BTCUSD forecast
On 10 September 2026, Bitcoin is trading in an environment of heightened sensitivity to global risk appetite and expectations for US monetary policy. The rise in 10-year Treasury yields to their highest levels since 2023 is increasing the opportunity cost of holding risk assets and limiting the recovery in cryptocurrencies. Oil above 100 USD per barrel is adding further pressure: the energy shock is increasing inflation expectations and supporting the probability of tighter Federal Reserve policy. The market estimates the probability of a rate hike at the 15–16 September meeting at around 60%, although most economists expect the current range to be maintained.
Today, attention is focused on US PPI, followed by CPI on Friday. Higher inflation could increase pressure on BTCUSD through rising yields and weaker demand for high-risk assets. Caution also persists within the cryptocurrency market following a report that around 320 million USD had been withdrawn from a Bitcoin-based Liquid Network wallet as a result of a security incident. Although the event is not directly related to the main Bitcoin network, it is increasing investors’ sensitivity to infrastructure risks. At the same time, the regulatory backdrop in the US remains an important factor: the Senate is preparing for a key procedural vote on the Clarity Act, aimed at clarifying the rules for digital assets. This creates a potentially positive medium-term factor, but short-term volatility remains high until greater clarity emerges.
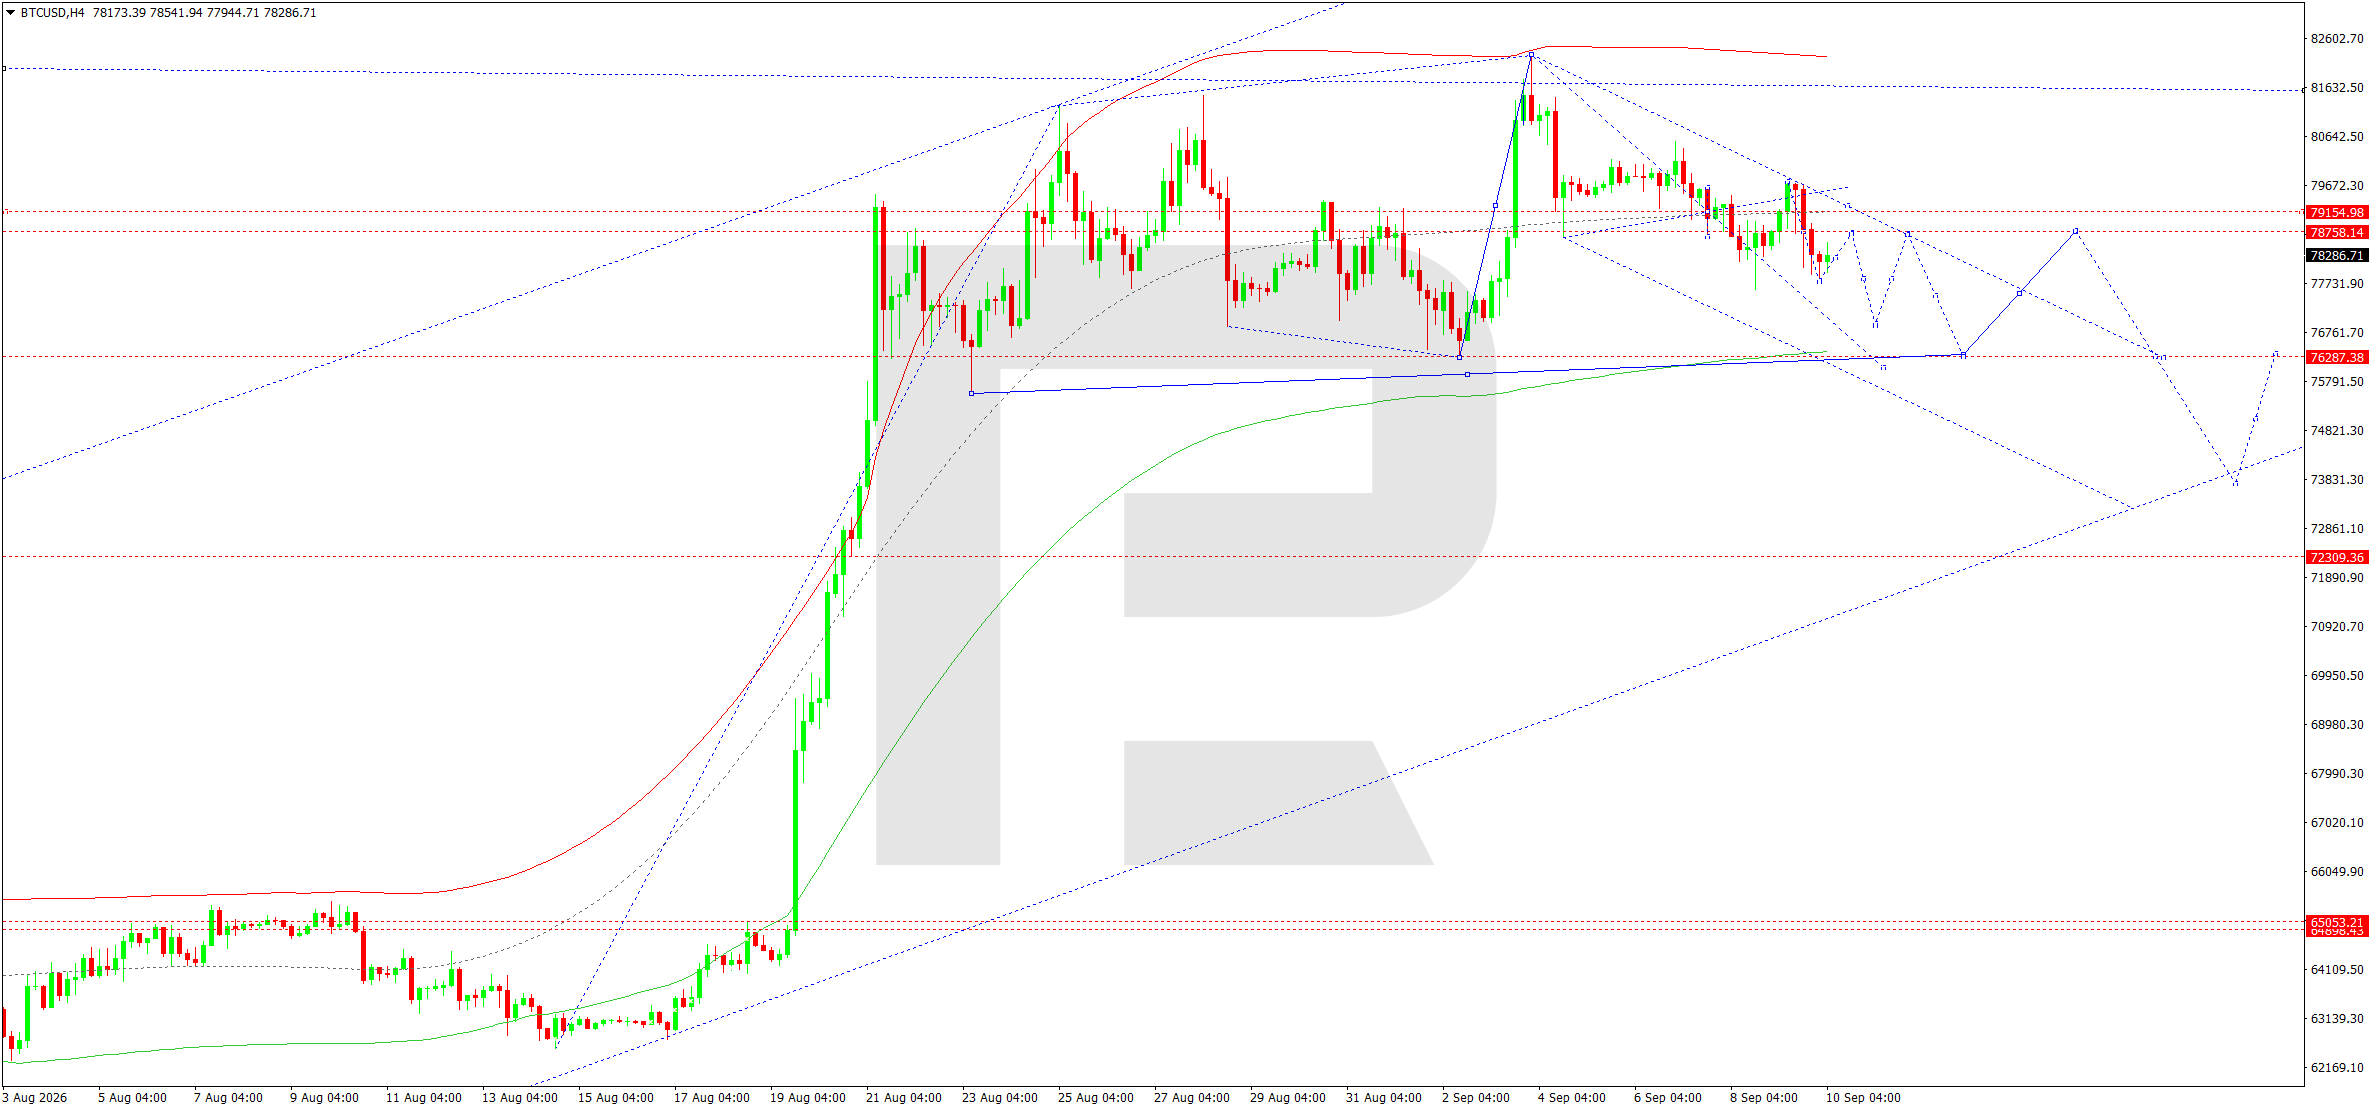
On the H4 chart, after rising towards the upper boundary of the Price Envelope near 82,238, BTCUSD reversed and formed a downward wave towards 77,820. The market is now consolidating around 78,757, remaining below the central 79,159 area. This indicates that seller pressure remains in place and there is still no confirmed upward reversal.
The downward wave matrix has its pivot at 79,159. As long as the price remains below it, local rises are viewed as corrective. Another test of 78,758–79,159 is possible, but consolidation below 77,820 would strengthen the downward impulse towards 76,288. This level coincides with the lower part of the Price Envelope and a key support area of the current range. A breakout below 76,288 would open the way towards 73,800 and 72,309.
From an Elliott wave perspective, the move from the 82,238 top appears to be a developing downward structure with a sequence of lower highs. A return above 79,159 would ease the pressure and allow a test of 79,515, but only a move above 80,000–80,500 would materially improve the short-term picture. Within the current consolidation, the nature of the retest of 79,159 from below is important: failure to consolidate above the matrix pivot would confirm that the downward phase remains intact. A further confirmation would be an expansion of the range below 77,820 accompanied by rising volatility.
BTCUSD forecast scenario
Trading scenario: SELL
- Price at the time of writing: 78,392
- Entry price: 78,387
- Stop loss: 79,160
- Take profit: 76,288
- Risk-to-reward ratio: 1:3
The trade idea is valid until 8:00 AM on 11 September 2026 (server time, UTC+3).
Editors’ picks
 EURUSD forecast 2026–2027: technical analysis, price levels & predictions
EURUSD has recovered from the July lows and is trading near 1.1545 — back in bullish territory. The pair has reclaimed EMA65 on the daily, formed a bullish EMA crossover on H4, and the US-eurozone GDP gap has narrowed sharply (US 1.5% vs eurozone 1.0%). Goldman Sachs and Deutsche Bank both now target 1.2500 by year-end. A confirmed close above 1.1700 opens the path to 1.1805. We break down the key levels, three trading scenarios, and what the unprecedented 9-3 FOMC dissent vote means for EURUSD.
 Gold (XAUUSD) forecast 2026: technical analysis, price levels & predictions
Gold has reversed its downtrend and is trading near 4,360 USD, back above both EMA65 and EMA200. ETF flows turned positive in July with 3 billion USD of net inflows, and central banks bought 288.9 tonnes in Q2 — up 62% year-on-year. A breakout above 4,500 USD opens the path to 4,855 USD and the 5,597 USD all-time high. We break down the key levels, three trading scenarios with entry triggers, and what J.P. Morgan, Deutsche Bank and Goldman Sachs are forecasting for gold in 2026.
Forecasts presented in this section only reflect the author’s private opinion and should not be considered as guidance for trading. RoboForex bears no responsibility for trading results based on trading recommendations described in these analytical reviews.