
Daily technical analysis and forecast for 15 September 2026
Daily technical analysis and forecast for EURUSD, USDJPY, GBPUSD, AUDUSD, USDCAD, XAUUSD, US 500, and BTCUSD for 15 September 2026.
Each scenario on this page reflects the market structure on the H4 chart as of 10:00 UTC+3 on 15 September 2026. The assessment considers the current H4 chart structure, key support and resistance levels, the direction of the medium-term movement, and the prevailing fundamental backdrop.
EURUSD forecast
As of 15 September 2026, the fundamental backdrop for EURUSD remains predominantly in favour of the dollar. The Federal Reserve is beginning its two-day meeting against a backdrop of accelerating inflation: the US Consumer Price Index rose by 0.4% month-on-month and 3.4% year-on-year in August, while the core CPI increased by 0.3%. Following this data, most economists expect the Fed to raise rates by 25 basis points to 3.75–4.00%. The dollar is receiving additional support from the rise in the yield on 10-year US Treasuries towards 5% and continued tensions in the energy market. Oil prices remain above 100 USD per barrel, increasing concerns about second-round inflation effects and supporting expectations of tighter US policy.
The European Central Bank raised rates by 25 basis points last week in response to a renewed energy-driven inflation impulse. However, support for the euro has remained limited: the market is concerned that further tightening of financial conditions could weaken the eurozone economy. As a result, the fundamental balance for the current session remains mixed, but the dollar retains the advantage, particularly ahead of the Fed decision and the release of its updated projections.
It is also important that the ECB rate hike is already largely priced in, while the Fed's future policy path remains the main source of repricing in the interest rate differential. Ahead of the meeting, the market is particularly sensitive to oil and US Treasury yield dynamics: another rise in yields could support the dollar even without additional negative news from the eurozone.
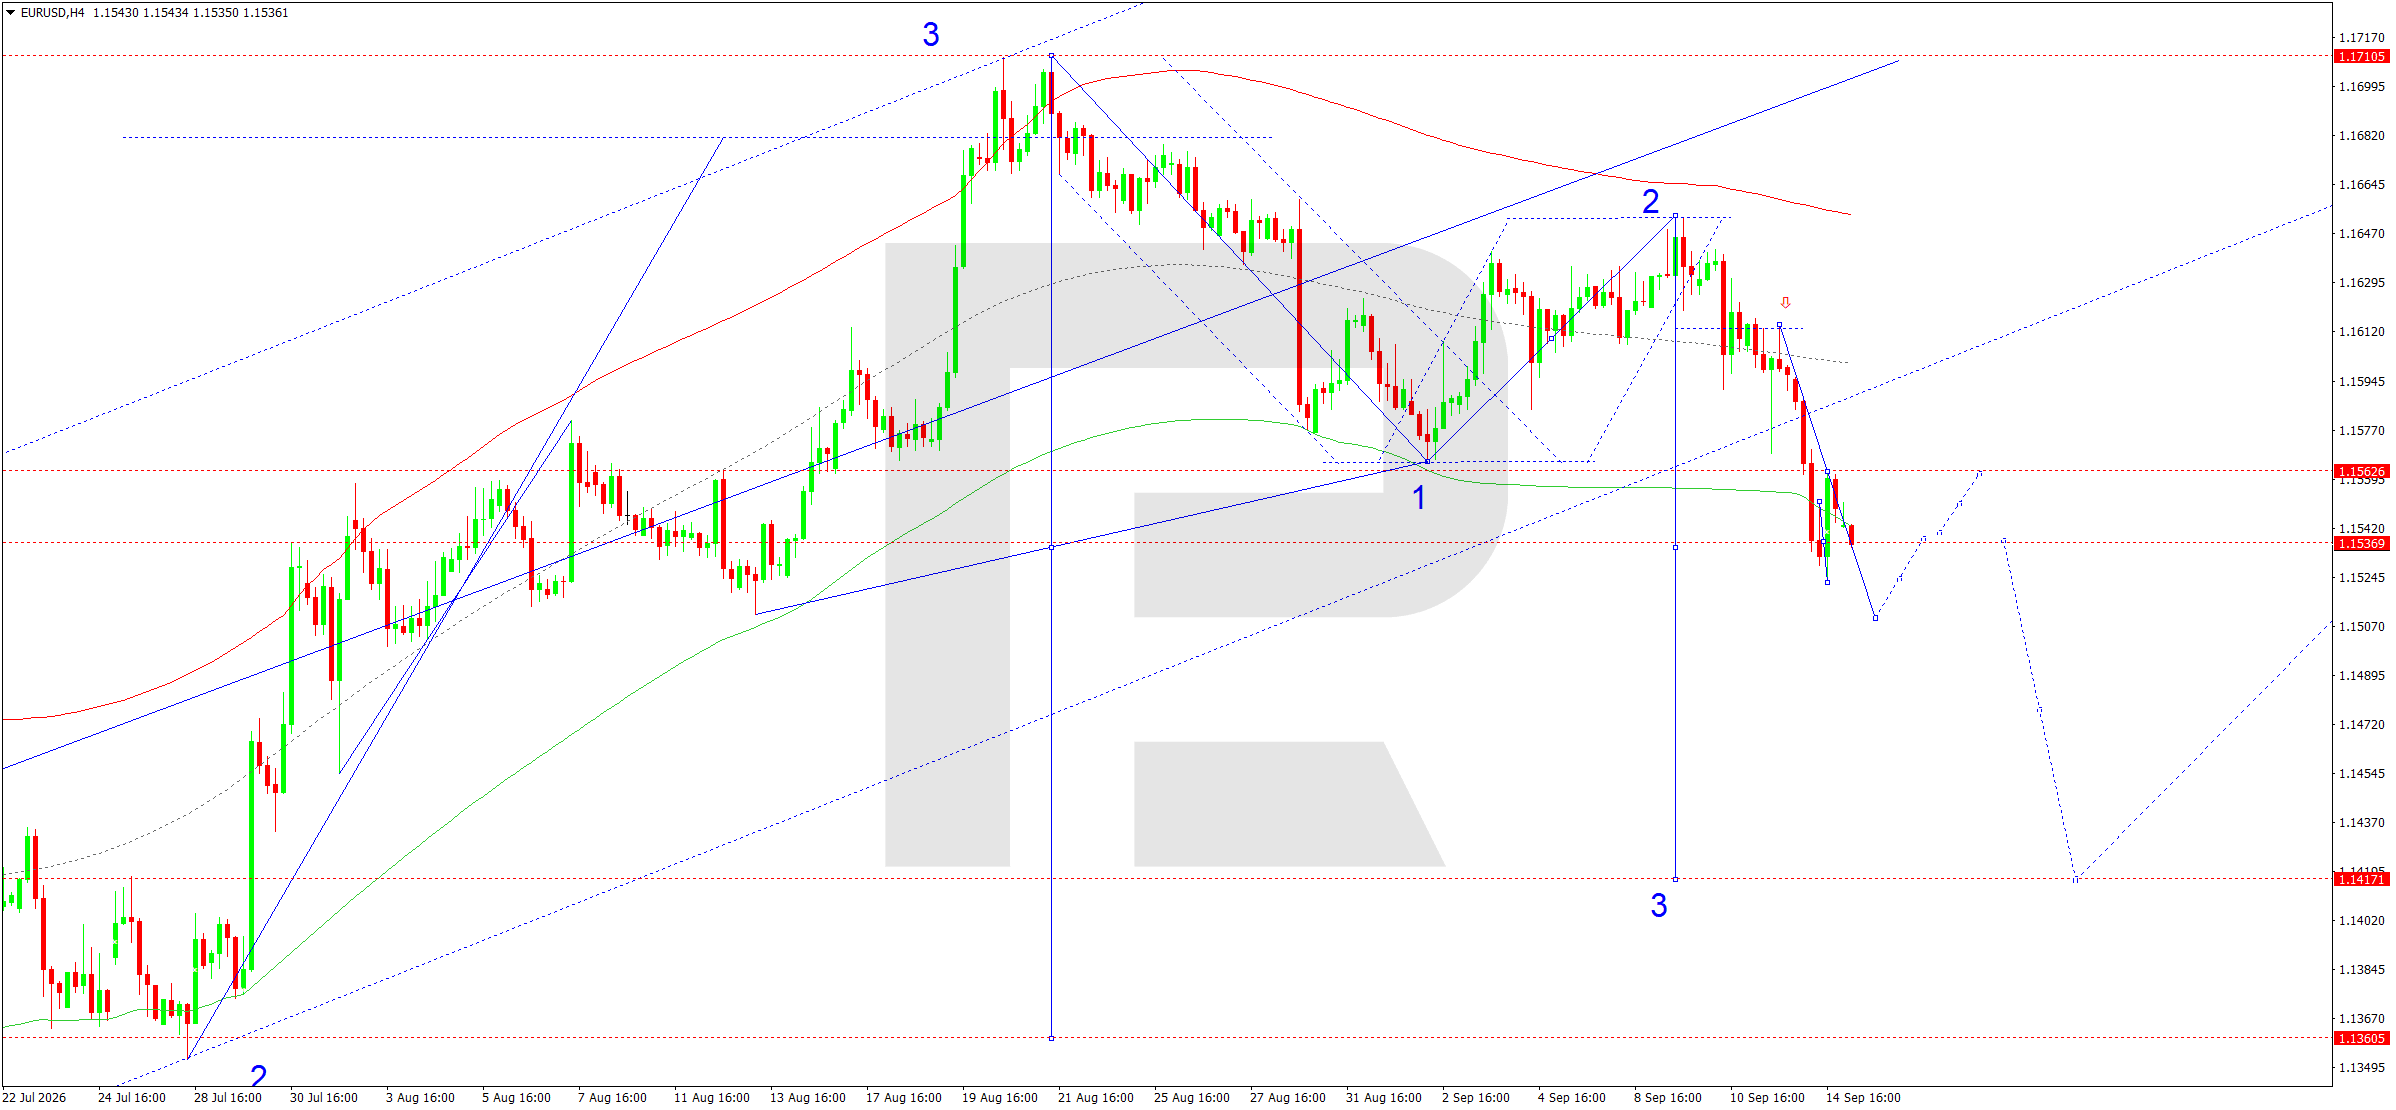
On the H4 chart, EURUSD completed a correction towards 1.1562 and formed a new downward impulse towards 1.1535. Today, the key scenario is a breakout below 1.1530, followed by a further move towards 1.1510. Consolidation below this area would confirm the development of the third downward wave and open the way towards 1.1420.
The Elliott wave structure and the wave matrix, with a pivot point around 1.1525, support the bearish scenario. A local rise towards the central line of the Price Envelope around 1.1565 is viewed as a corrective retest from below. While the price remains below 1.1562–1.1565, continued downside remains the priority. The nearest objective for sellers is to consolidate below 1.1530, after which the market could accelerate towards 1.1510. The next significant target is 1.1420, where the lower boundary of the broader Price Envelope is located and the projected target of the current downward momentum is completed.
The chart continues to show a sequence of lower highs following the 1.1640–1.1650 peak. The 1.1537 level acts as intermediate support, but repeated tests increase the probability of a breakout. A return above 1.1565 would reduce selling pressure, while consolidation above 1.1610 would be required to change the main bearish structure. The 1.1595–1.1610 area remains additional resistance, where selling previously concentrated.
EURUSD forecast scenario
Trading scenario: SELL
- Price at the time of writing: 1.1533
- Entry price: 1.1528
- Stop loss: 1.1564
- Take profit: 1.1420
- Risk-to-reward ratio: 1:3.0
The trade idea is valid until 8:00 AM on 16 September 2026 (server time, UTC+3).
USDJPY forecast
As of 15 September 2026, USDJPY is being driven by two opposing factors. The Federal Reserve is approaching its rate decision with significantly more hawkish expectations: following strong inflation and a recovery in employment, the market is almost fully pricing in a 25-basis-point rate hike. The yield on 10-year US Treasuries has risen towards 5%, supporting the dollar and temporarily limiting downside in the pair.
At the same time, the Bank of Japan is preparing for its meeting on Friday, and expectations of a rate hike to 1.25% have strengthened noticeably. BoJ officials have previously stated directly that a rise in borrowing costs would be discussed at the September meeting if inflation risks persist. Against this backdrop, the yen has already received support, while carry-trade participants are reducing positions. The possibility of heightened volatility due to the energy shock remains another factor: high oil prices worsen Japan's trade balance, but rising global yields and expectations of BoJ tightening are working in favour of the yen. Therefore, another corrective rise in USDJPY is possible in the short term, but the medium-term balance is gradually shifting towards a decline in the pair.
A key difference in the current situation is the narrowing expected interest rate gap: a substantial part of the Fed hike is already priced in, while the BoJ decision could still trigger a fresh repricing of the yen. High oil prices remain a constraint for the Japanese currency, so sharp two-way moves are likely ahead of Friday.
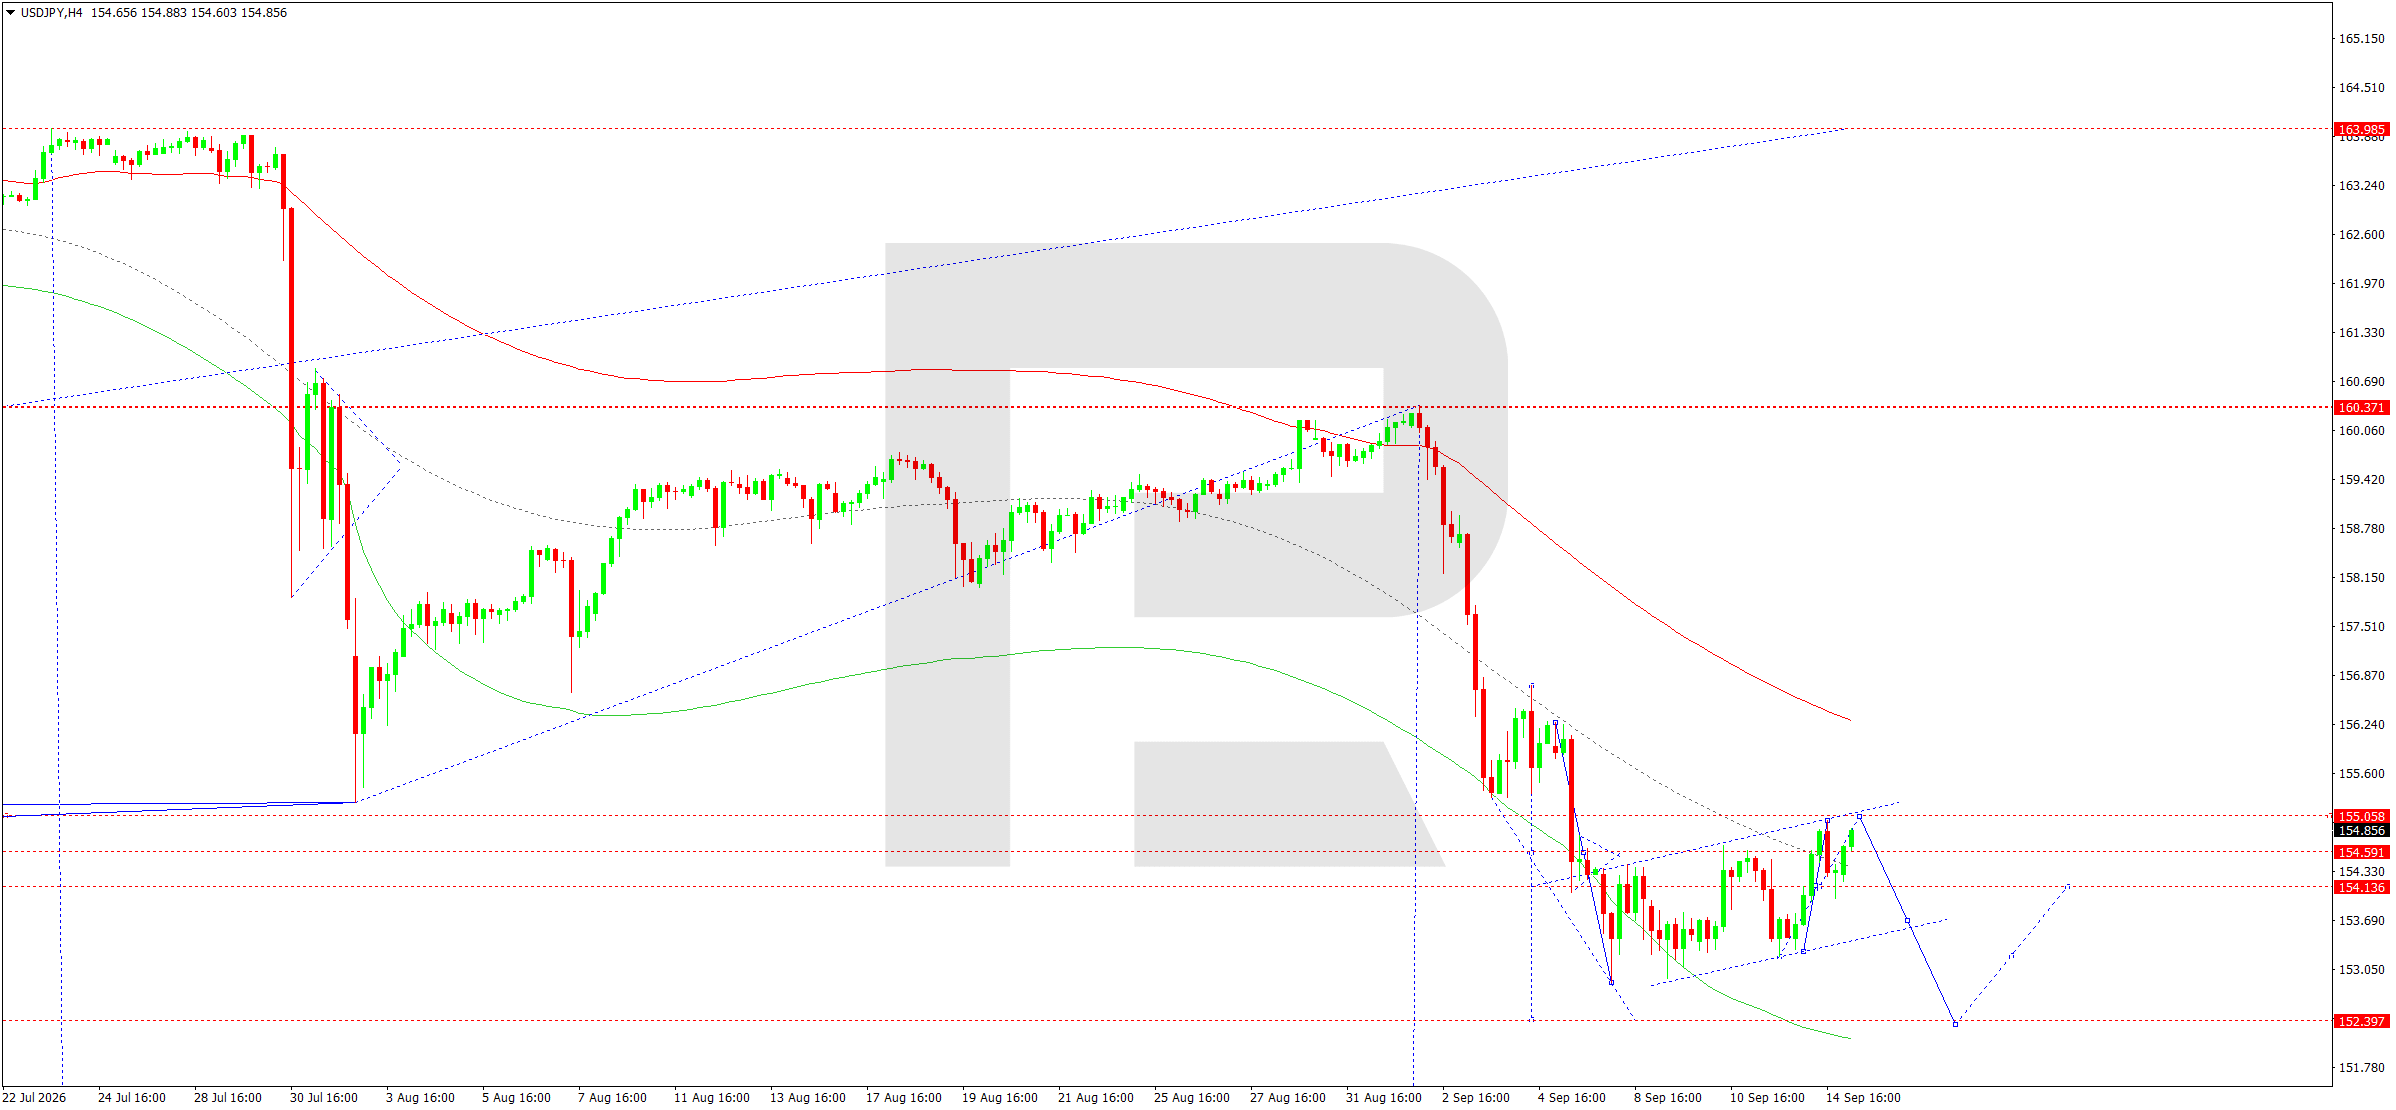
On the H4 chart, the market found support around 154.14 and is developing an upward correction towards 155.05. Today, the 155.05 level is viewed as the main target of the current recovery move and, at the same time, as an area where the correction could end. After testing this area, the pair is likely to form a new downward wave towards 152.40.
The Elliott wave structure and the downward wave matrix, with a pivot point around 155.00, confirm the preference for selling from the upper boundary of the current correction. The market previously completed a move towards the lower boundary of the Price Envelope around 152.88 and is now returning to its central line at 155.05 for a retest from below. If the price fails to consolidate above 155.05, a pivot point with potential for a move towards 152.40 would form. A breakout below 152.40 would extend the bearish structure and open the way towards 148.80. The main H4 trend remains downward despite the current corrective rise.
On the H4 chart, the corrective channel is capped by the 154.85–155.05 area. The support level is located at 154.14, and a breakout below it would provide the first confirmation of a reversal lower, opening the way towards 153.30 and 152.40. Only a sustained move above 155.60 would require a reassessment of the immediate bearish structure. Volatility ahead of the BoJ meeting may temporarily widen the range without changing the main direction.
USDJPY forecast scenario
Trading scenario: SELL
- Price at the time of writing: 154.80
- Entry price: 154.75
- Stop loss: 155.53
- Take profit: 152.40
- Risk-to-reward ratio: 1:3.0
The trade idea is valid until 8:00 AM on 16 September 2026 (server time, UTC+3).
GBPUSD forecast
As of 15 September 2026, the pound remains under pressure from a strong dollar and rising global yields. The Federal Reserve is expected by most economists to raise rates by 25 basis points this week after August inflation accelerated and employment data came in stronger. This is supporting US Treasury yields and increasing the appeal of the dollar as a safe-haven asset amid tensions in the oil market.
The Bank of England will meet on 17 September. The market's baseline scenario is for the policy rate to remain at 3.75%, although a spike in oil prices above 100 USD per barrel and rising inflation risks have prompted investors to increase the probability of tighter policy later in 2026. The UK economy is also showing some signs of resilience: July GDP grew more strongly than expected. However, high government bond yields, concerns about the debt burden and the risk that the BoE may prove less hawkish than already priced in are limiting the pound's upside potential. As a result, the fundamental backdrop for GBPUSD remains moderately negative, with the dollar retaining the advantage ahead of the Fed decision.
The pound is receiving some support from expectations of more hawkish BoE rhetoric if the energy shock feeds into wages and services. However, much of these expectations are already priced in, increasing the risk of disappointment. Ahead of the BoE meeting, the pair's direction is being driven more by the dollar and global risk appetite.
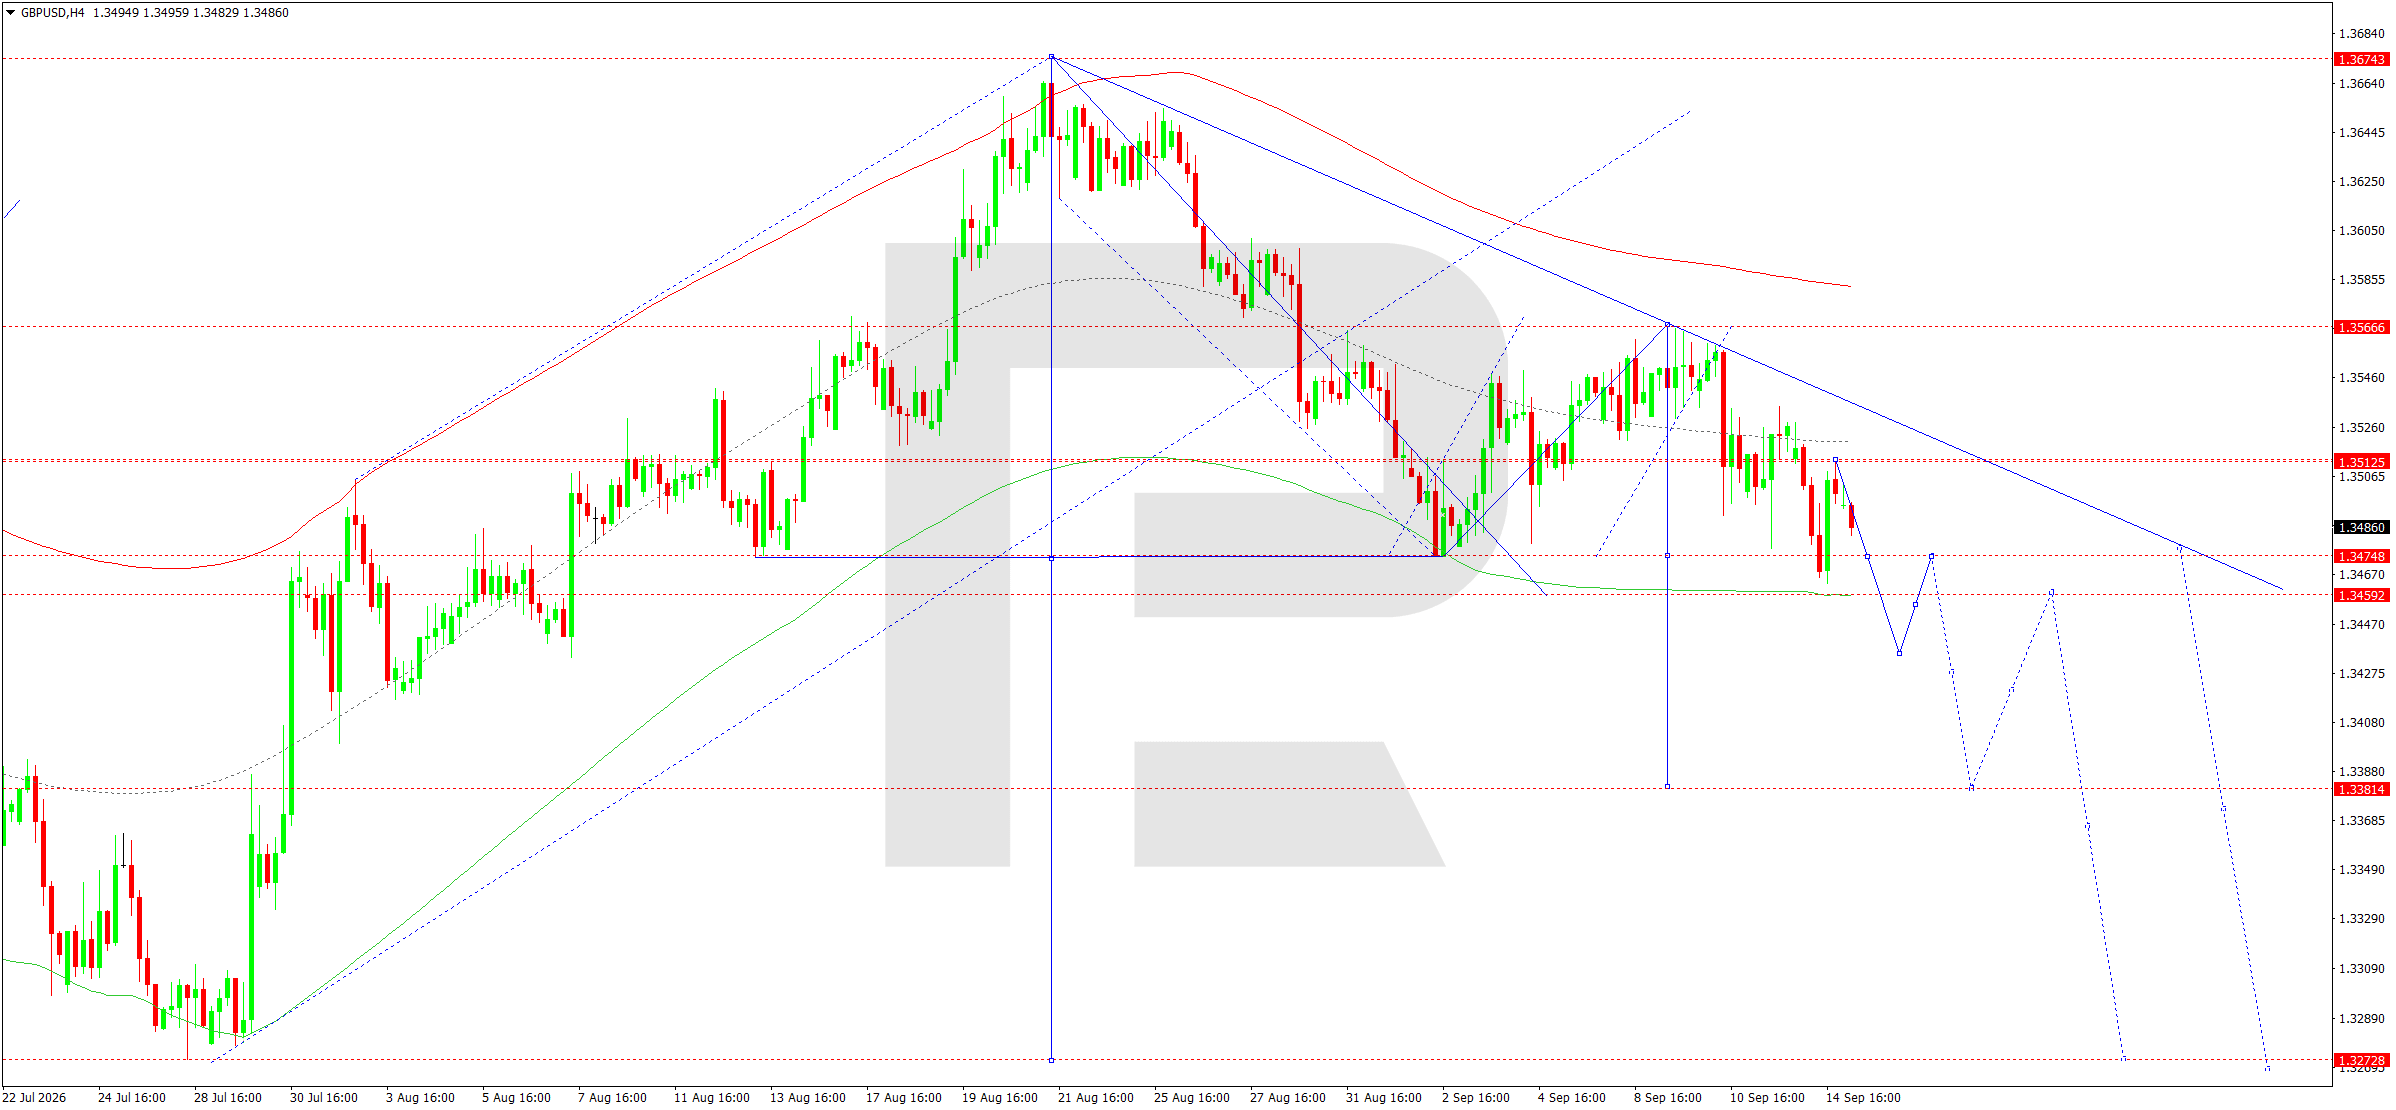
On the H4 chart, GBPUSD completed a correction towards 1.3512 and tested this level from below. After the corrective move ended, a new downward wave towards 1.3470 began to develop. A compact consolidation is forming around this level and could provide a base for continued bearish momentum.
The Elliott wave structure and the downward wave matrix, with a pivot point around 1.3470, confirm the bearish scenario. The central line of the Price Envelope runs through the same area, so a failure to return above 1.3512 will keep pressure on buyers. The nearest downside target is 1.3435, where the lower boundary of the local Envelope is located. A breakout below 1.3435 would extend the move towards 1.3383. This level corresponds to the local projected target of the current wave and also acts as a significant support level within the broader H4 range. The main trend remains bearish until the price returns above 1.3566.
A descending trendline from the August high remains in place on the H4 chart. The price failed to reclaim 1.3512 after the latest decline, while a breakout below 1.3470 could accelerate the move towards 1.3435. A return above 1.3512 is needed to neutralise the bearish outlook, while a full-fledged reversal would require consolidation above 1.3566. Local rebounds towards 1.3495–1.3512 should still be viewed as corrective.
GBPUSD forecast scenario
Trading scenario: SELL
- Price at the time of writing: 1.3479
- Entry price: 1.3474
- Stop loss: 1.3504
- Take profit: 1.3383
- Risk-to-reward ratio: 1:3.0
The trade idea is valid until 8:00 AM on 16 September 2026 (server time, UTC+3).
AUDUSD forecast
As of 15 September 2026, the Australian dollar remains caught between a tight domestic monetary policy stance and a deteriorating external backdrop. The Reserve Bank of Australia has already raised rates three times in 2026, bringing the policy rate to 4.35%. Following strong July inflation, the regulator retains the option of another hike, which limits pressure on the AUD over the medium term. At the same time, the labour market is showing signs of cooling: employment unexpectedly fell in July, while unemployment rose to 4.5%, reducing the need for immediate further tightening.
China is another source of risk for the AUD. Fresh August data showed faster industrial production, but at the same time extremely weak retail sales growth and a noticeable decline in investment, especially in property. This combination points to persistent imbalances in the Chinese economy and limits support for commodity currencies. On the US side, the dollar is benefiting from expectations of a Federal Reserve rate hike, high US Treasury yields and safe-haven demand amid energy and geopolitical tensions. Overall, the fundamental picture for the next session remains moderately negative for AUDUSD.
The Australian dollar is also sensitive to Asian risk appetite. Higher oil prices and US yields are tightening global financial conditions, while weak Chinese demand and the property downturn are limiting a sustained AUD recovery. Therefore, until Chinese data improves or the dollar weakens materially, rebounds in the pair remain vulnerable.
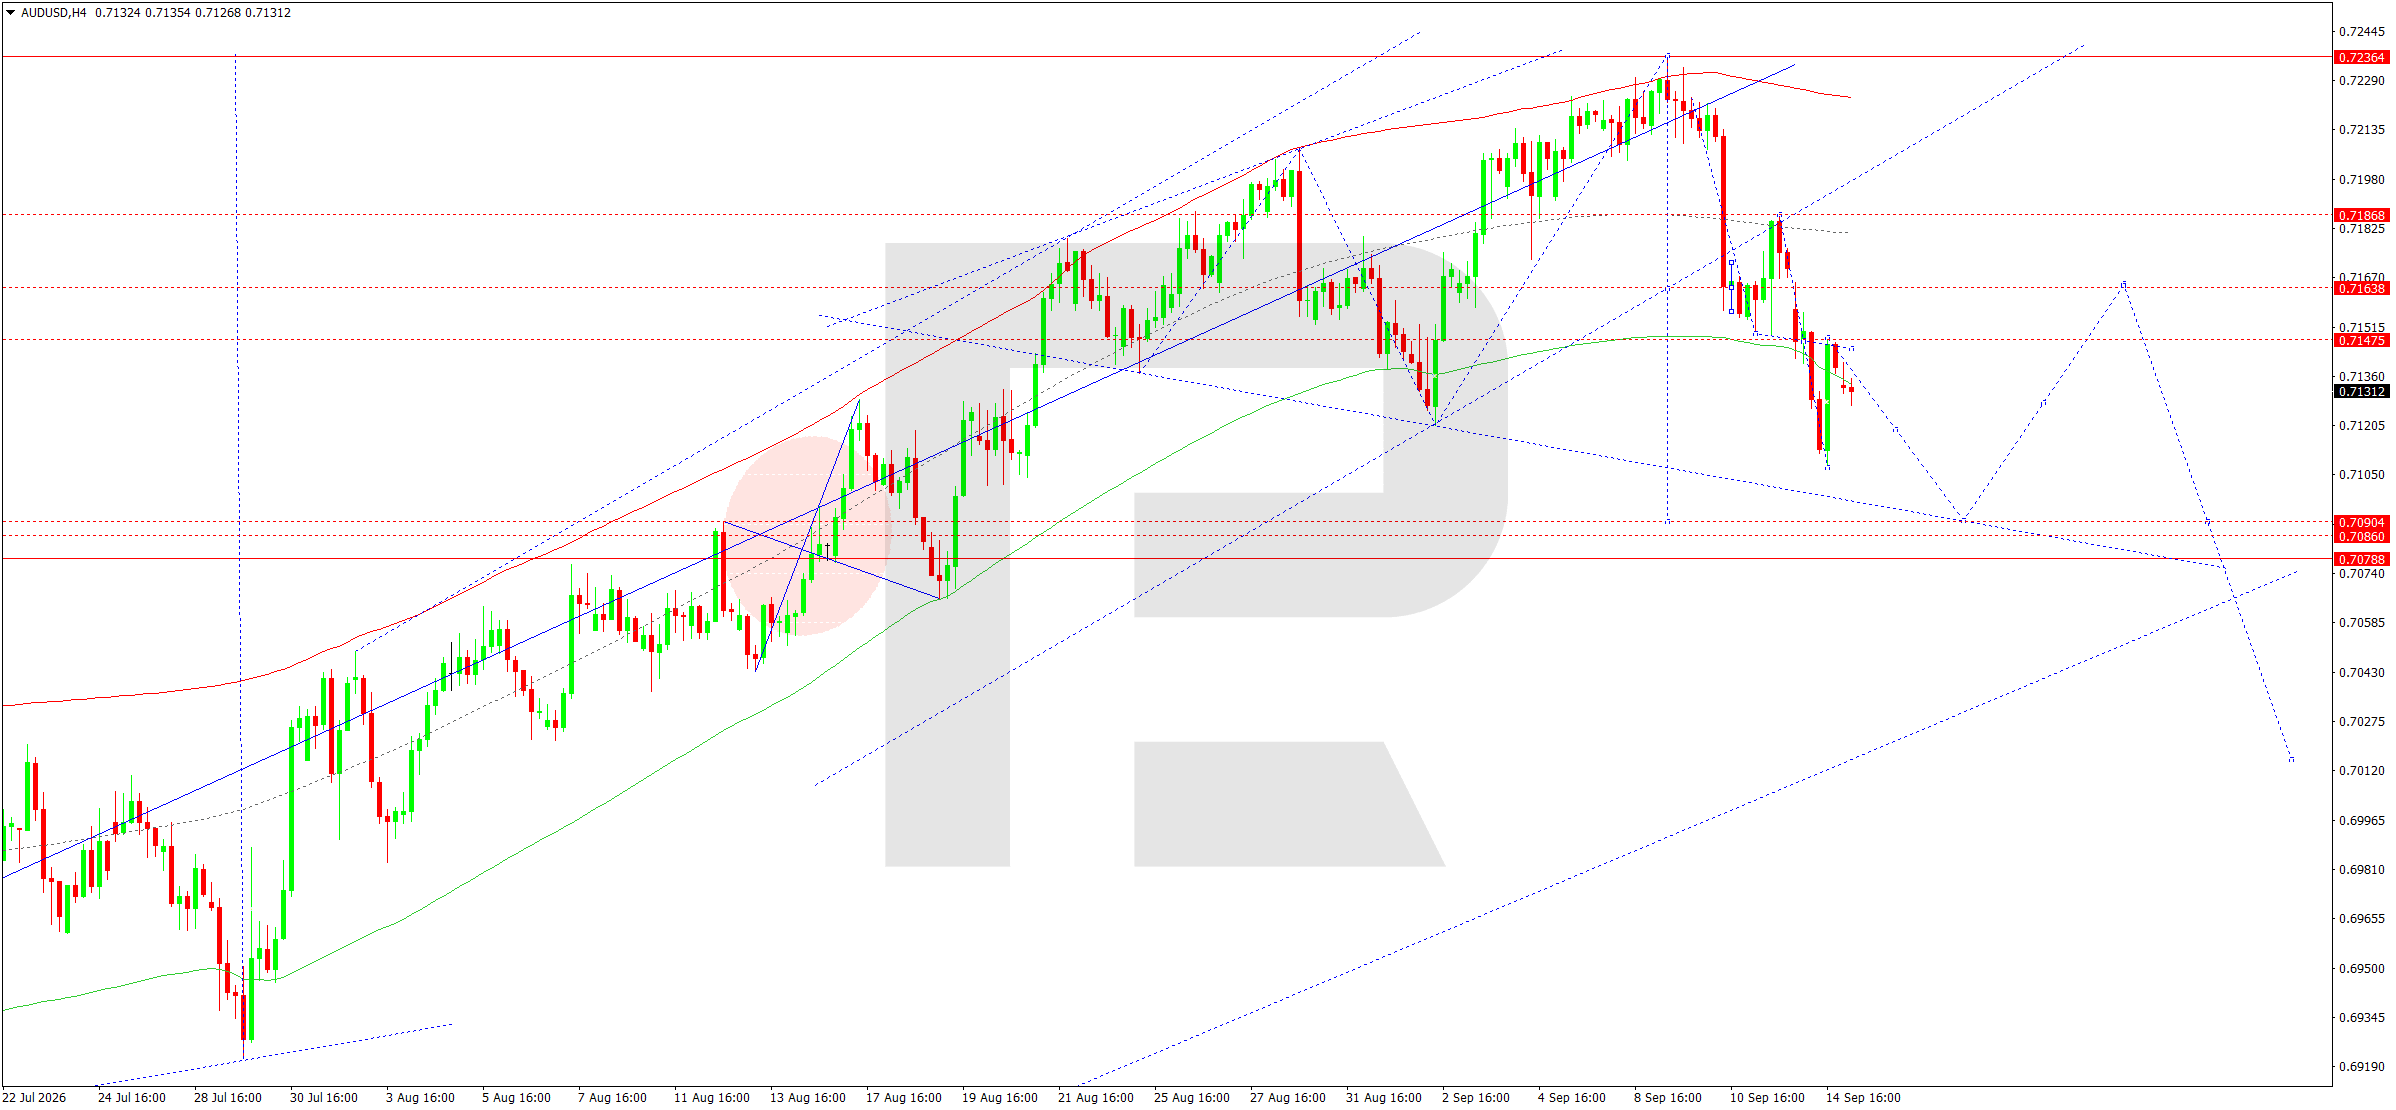
On the H4 chart, the market completed a downward impulse towards 0.7108 and formed a local consolidation range above this level. Today, a corrective upward move towards 0.7147 formed, followed by a decline towards 0.7117. The main scenario points to a continued downward wave towards 0.7090.
The Elliott wave structure and the downward wave matrix, with a pivot point at 0.7161, confirm persistent selling pressure. The price is below the central area of the Envelope, while the sequence of lower highs following the reversal from 0.7236 preserves the bearish configuration. The nearest target remains the lower boundary of the Price Envelope around 0.7090. After reaching it, the market may stabilise and form a new consolidation range. Only consolidation above 0.7147 would create conditions for a corrective return towards 0.7161; until then, the main H4 trend remains downward.
Following the peak at 0.7236, lower highs and lower lows are forming the H4 chart. The 0.7147–0.7161 area is now resistance. The 0.7090 support level could trigger a rebound, but a breakout below it would open the way towards 0.7079 and then 0.7050. An upside correction would become the priority only above 0.7161. Another sign of weakness is the price moving below the H4 dynamic moving average. While the market remains below 0.7147, sellers retain a tactical advantage and may increase pressure again during the Asian session.
AUDUSD forecast scenario
Trading scenario: SELL
- Price at the time of writing: 0.7119
- Entry price: 0.7114
- Stop loss: 0.7122
- Take profit: 0.7090
- Risk-to-reward ratio: 1:3.0
The trade idea is valid until 8:00 AM on 16 September 2026 (server time, UTC+3).
USDCAD forecast
As of 15 September 2026, the Canadian dollar is trading under pressure from several factors. The previous day, USDCAD rose towards a 12-day high after Canadian inflation data came in in line with expectations and amid broader US dollar strength. August labour market data provided another negative signal for the Canadian economy: employment fell by around 41,700 jobs, with most of the decline concentrated in full-time employment. This points to weaker domestic demand and complicates the Bank of Canada's position.
At the same time, oil prices above 100 USD per barrel should theoretically support the Canadian dollar as the currency of a commodity-exporting economy, but the current effect is limited. High oil prices are also increasing global inflation risks and contributing to higher yields in the US. The Federal Reserve is expected by the market to raise rates by 25 basis points at its current meeting, preserving support for the dollar. US-Canada trade tensions remain another risk factor. The fundamental backdrop therefore continues to favour USDCAD holding at elevated levels, although the pair has technically approached an area where the probability of a downward correction is increasing.
The CAD is facing an unusual combination: high oil prices support export revenues but at the same time strengthen inflation risks and the dollar through higher US rates. Canada's weak labour market reduces the room for an aggressive BoC response. At the same time, much of the dollar's advantage is already reflected in the pair's rise towards 1.3928–1.3950.
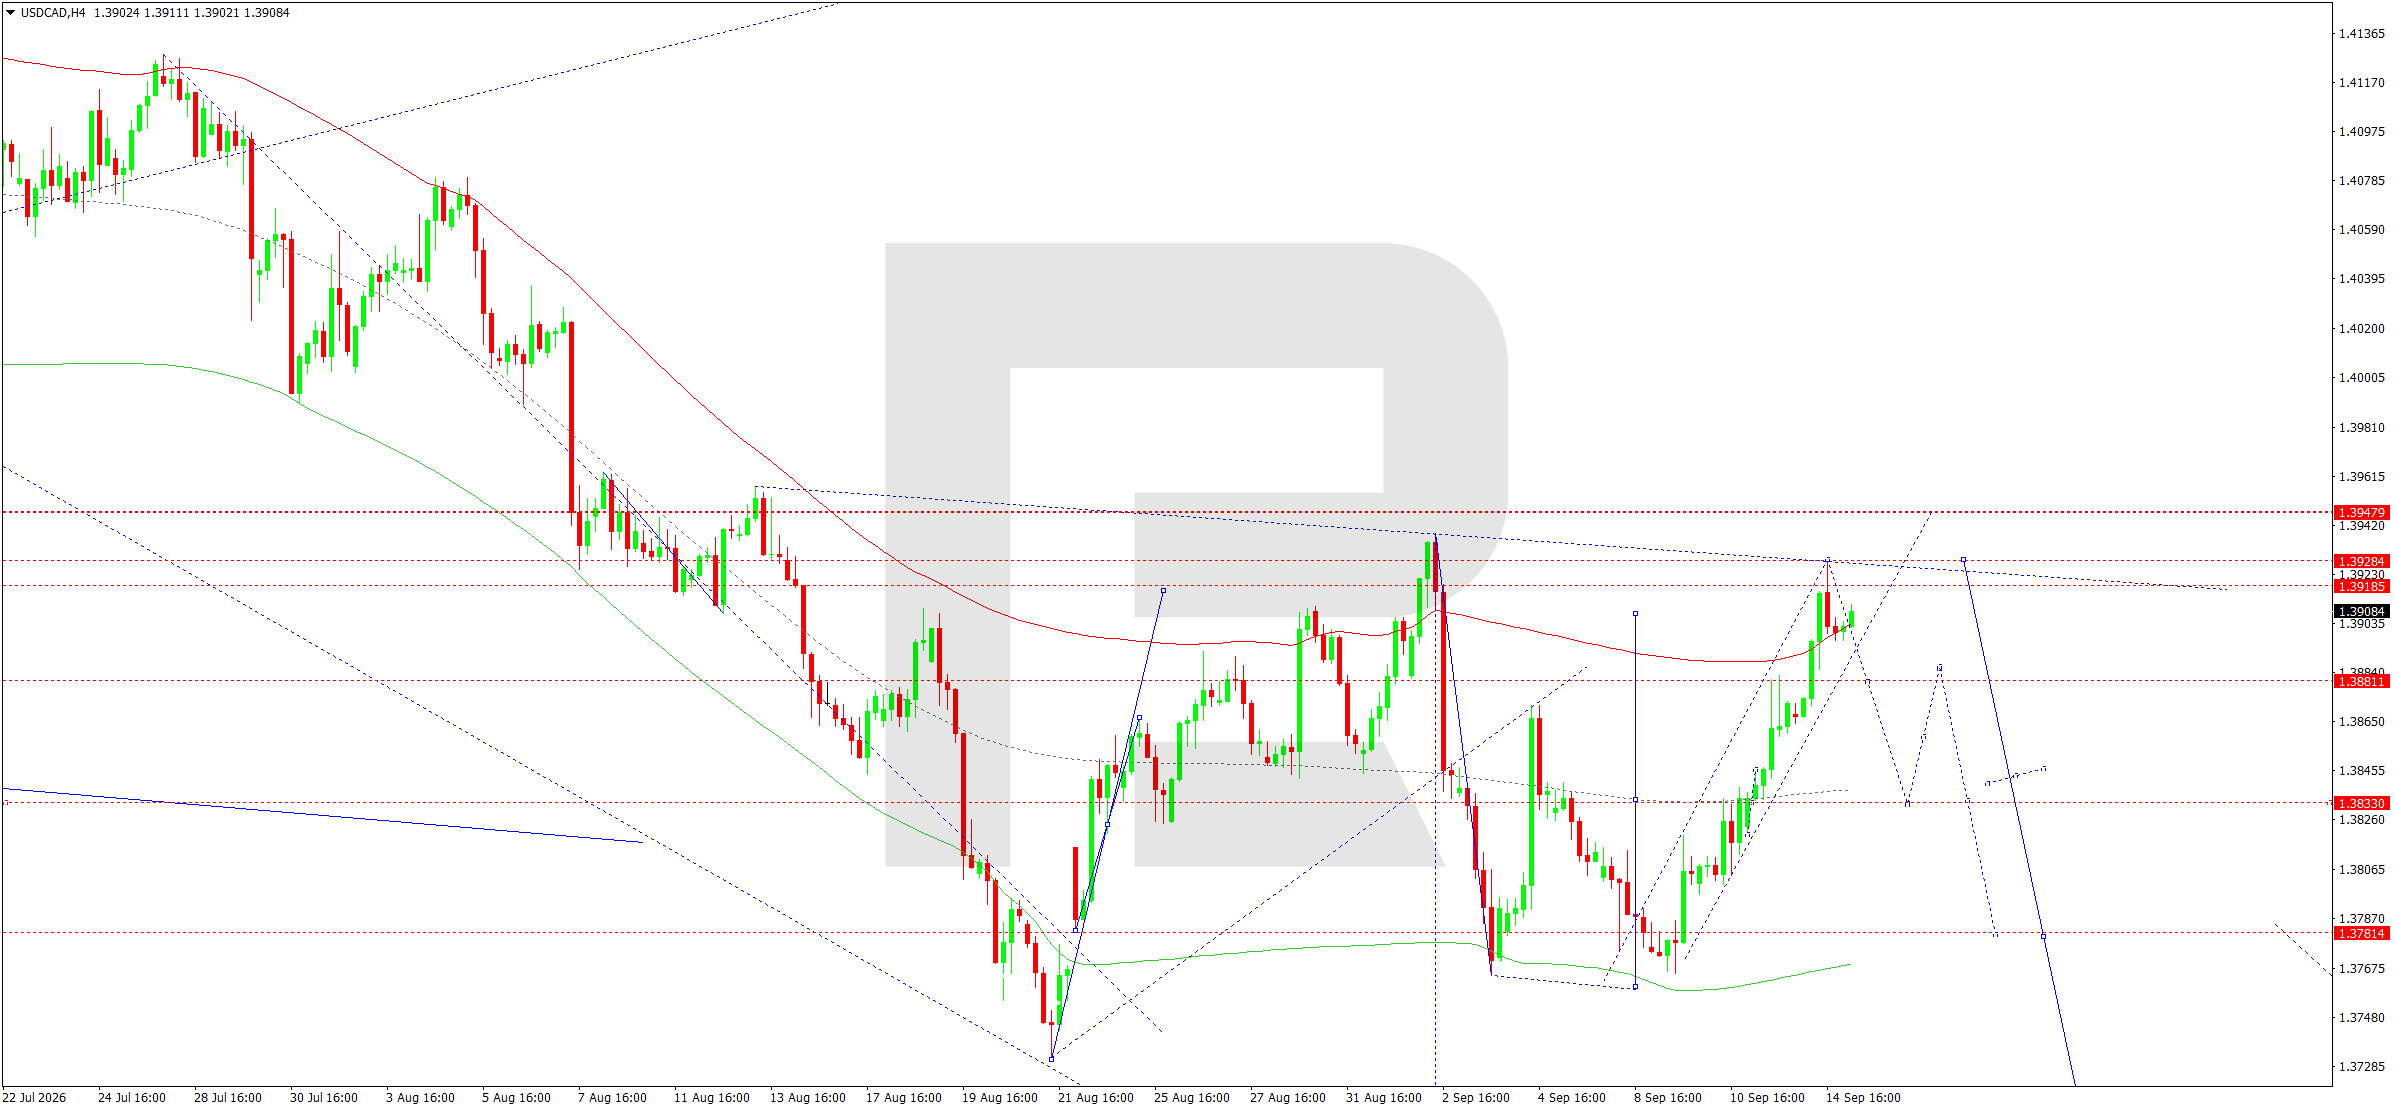
On the H4 chart, USDCAD completed an upward wave towards 1.3928 and moved into a compact consolidation range below this level. Locally, another brief move higher towards 1.3950 remains possible, but the main scenario following the completion of the correction is a decline.
The Elliott wave structure and the upward wave matrix, with a pivot point around 1.3833, show that the market has already reached the upper boundary of the Price Envelope near 1.3928. From here, the probability of a return towards the central part of the range is increasing, with the first downside target at 1.3830–1.3833. A breakout below this area would confirm the end of the upward correction and open room towards 1.3781 and then 1.3733. While the price remains below 1.3950, the preferred scenario is selling from the upper boundary of the current range.
The 1.3920–1.3950 area has acted as a supply zone several times. A decline below 1.3881 would be the first sign of weakening buying momentum. The 1.3833 level is then critical: a breakout below it would shift the structure into a full-fledged bearish phase. Only consolidation above 1.3950 would make continued growth the main scenario. Intraday support is around 1.3881; losing this level would materially increase the probability of an accelerating correction towards the matrix pivot.
USDCAD forecast scenario
Trading scenario: SELL
- Price at the time of writing: 1.3910
- Entry price: 1.3905
- Stop loss: 1.3962
- Take profit: 1.3733
- Risk-to-reward ratio: 1:3.0
The trade idea is valid until 8:00 AM on 16 September 2026 (server time, UTC+3).
XAUUSD forecast
As of 15 September 2026, gold is under strong pressure from rising real and nominal yields in the US. The market is almost fully pricing in a 25-basis-point rate hike by the Federal Reserve following the acceleration in August inflation. The yield on 10-year US Treasuries has risen towards the psychological 5% area, increasing the opportunity cost of holding gold and remaining the main source of pressure on XAUUSD.
At the same time, safe-haven demand has not disappeared entirely. Oil remains above 100 USD per barrel amid an escalation of the conflict in the Middle East and threats to energy infrastructure, increasing inflation expectations and maintaining demand for defensive assets. However, in the current phase, the market is interpreting the energy shock primarily as an argument for tighter Fed policy rather than as an unequivocally bullish signal for gold. In early September, the metal was already declining under pressure from a strong dollar and rising US Treasury yields. Ahead of the Fed decision, the balance of factors remains broadly negative for XAUUSD, although geopolitical headlines could trigger sharp intraday rebounds.
The dollar's performance also remains important: the US currency is trading near a two-week high this morning, adding pressure on gold. Some of the hawkish expectations may be realised after the Fed decision, but at the time of writing, the combination of a strong dollar and yields near 5% continues to favour sellers.
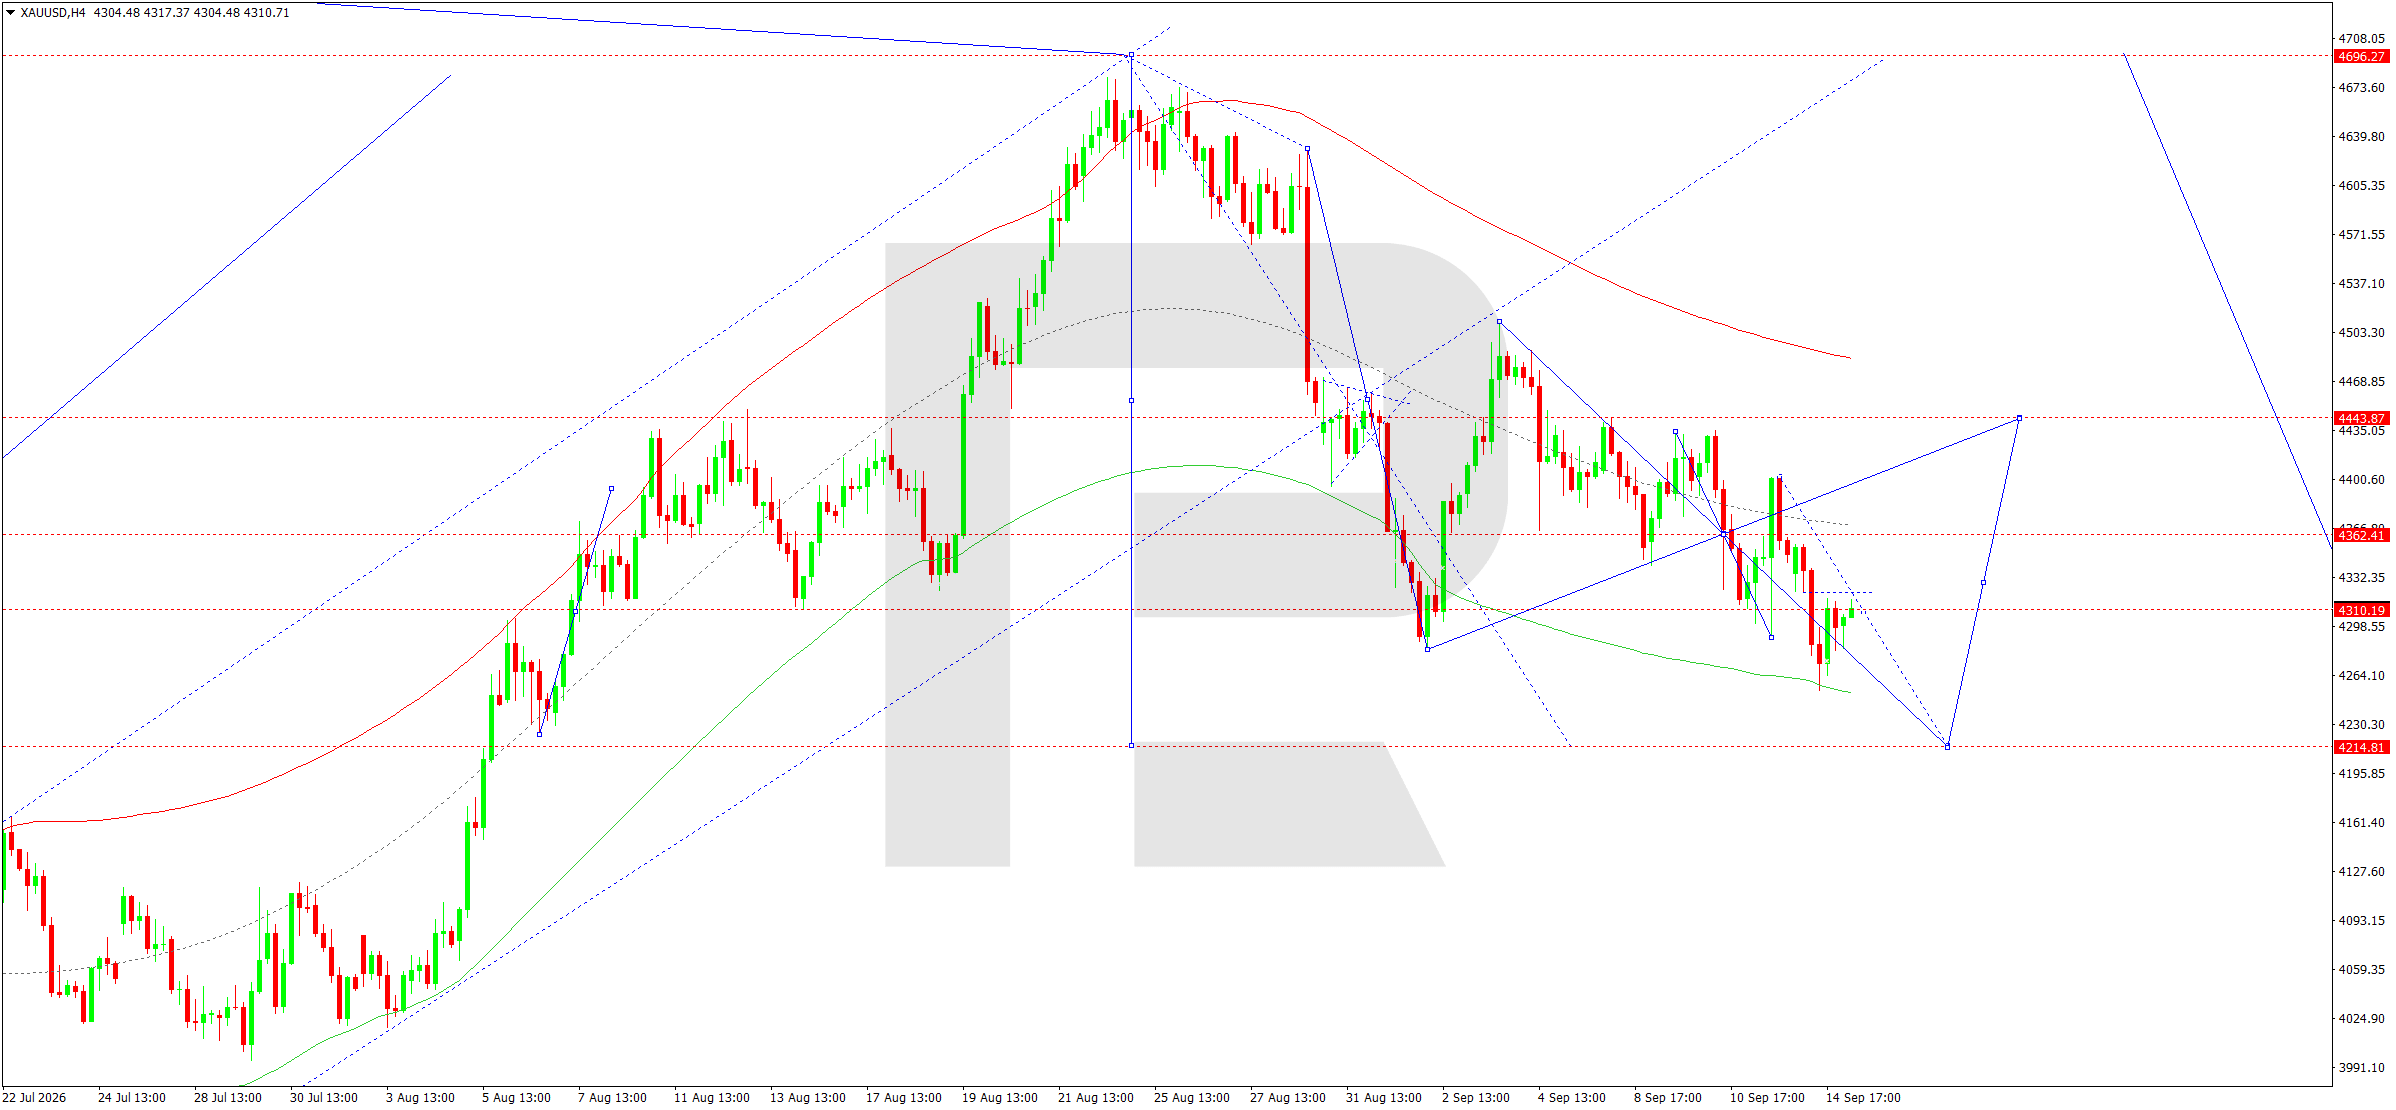
On the H4 chart, the market continues to develop a consolidation range around 4,310. A downward wave towards 4,253 formed earlier, after which the price returned to 4,310. The current rise is viewed as a corrective move within the broader bearish structure.
The Elliott wave count and the downward matrix, with a pivot point around 4,362, confirm the downside bias. The price remains below the central area of the Price Envelope and below the descending dynamic resistance line. The nearest target is 4,215, the lower boundary of the Envelope and the first projected target of the current wave. After this level is reached, consolidation and a corrective rebound may develop. Only a sustained return above 4,362 would weaken the bearish scenario and create conditions for a deeper correction towards 4,433. Until then, the main H4 direction remains downward.
A sequence of lower highs remains in place on the H4 chart. The price is holding below 4,362, while 4,310 has become a local area of contention. Another move below 4,290 would increase the likelihood of a test of 4,253 and then 4,215. A return above 4,362 would indicate stabilisation, while consolidation above 4,443 would invalidate the immediate bearish scenario. Another confirmation comes from the price remaining below the descending resistance line. Until buyers reclaim the 4,310–4,362 area, corrective rallies remain vulnerable to renewed selling.
XAUUSD forecast scenario
Trading scenario: SELL
- Price at the time of writing: 4,291
- Entry price: 4,286
- Stop loss: 4,310
- Take profit: 4,215
- Risk-to-reward ratio: 1:3.0
The trade idea is valid until 8:00 AM on 16 September 2026 (server time, UTC+3).
US 500 forecast
As of 15 September 2026, the US stock market is under pressure from rising yields and expectations of tighter monetary policy. The Federal Reserve is holding its meeting on 15–16 September, and following strong August inflation, most economists expect a 25-basis-point rate hike. The yield on 10-year US Treasuries has risen towards 5%, increasing the discount rate applied to future corporate earnings and putting particular pressure on high-multiple segments.
A deterioration in technology sector sentiment has added another risk factor. US indices closed lower in the previous session, with semiconductor companies among the biggest decliners. At the same time, oil prices remain above 100 USD per barrel amid geopolitical tensions in the Middle East, increasing inflation risks and the likelihood of further tightening in financial conditions. Strong corporate earnings are so far preventing a deeper decline, but investors are reducing risk ahead of the Fed decision. As a result, the fundamental backdrop for the US 500 remains cautiously negative for the current session, while elevated volatility may persist until the decision and the regulator's new interest rate projections are released.
US Treasury yields around 5% are becoming a direct competitor to stocks, putting particular pressure on high-valuation technology companies. Higher oil prices are also worsening expectations for margins and consumer demand. Ahead of the Fed decision, investors are likely to avoid aggressively increasing risk exposure, limiting the potential for a sustained recovery in the index.
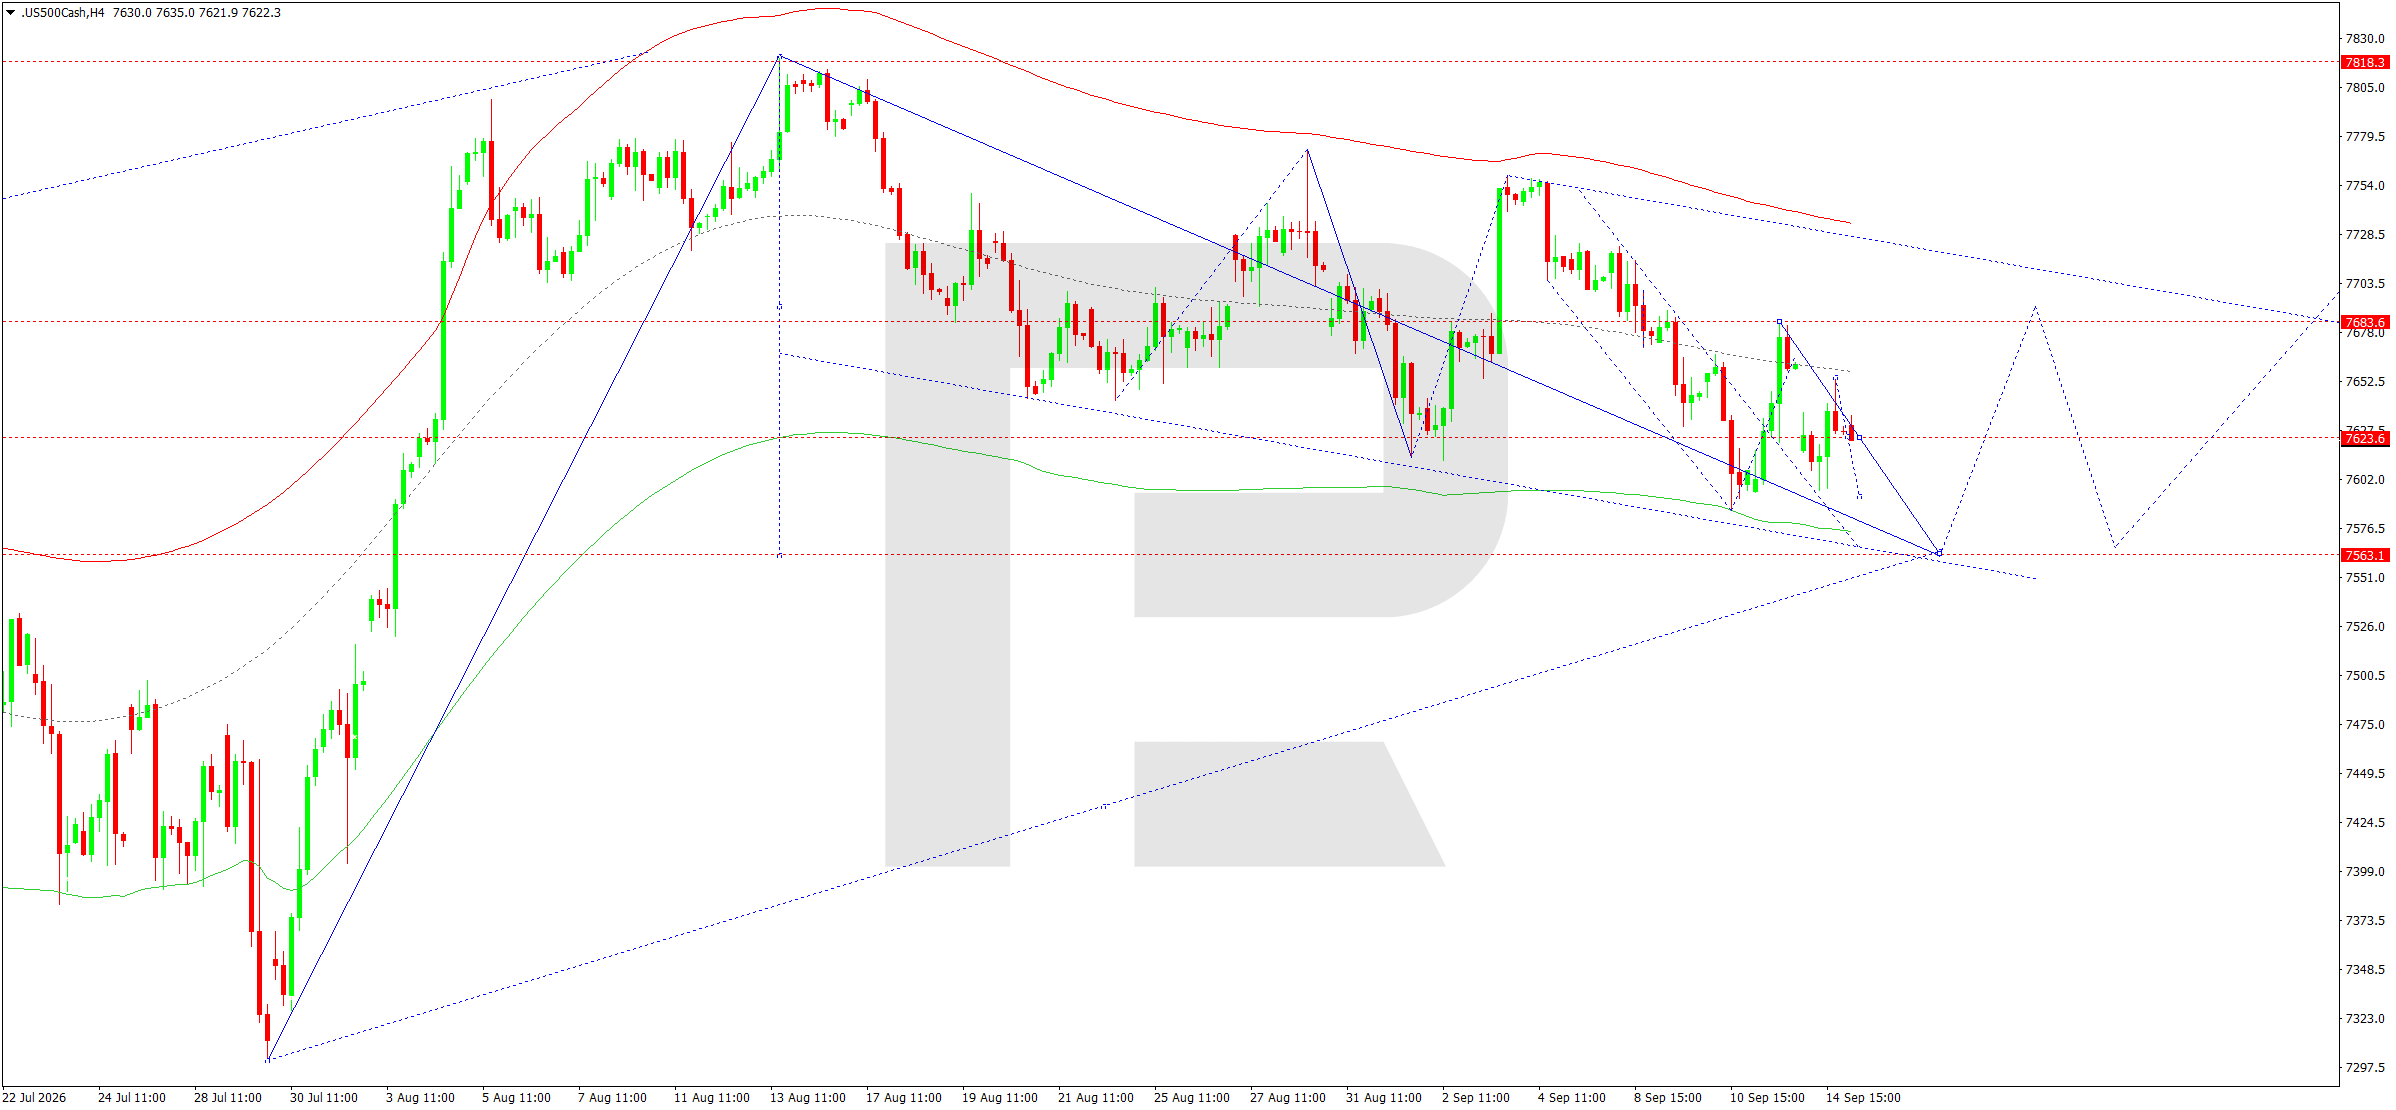
On the H4 chart, the US 500 previously formed an upward wave towards 7,652 before declining to 7,598. The market is now consolidating around 7,623. This structure is forming below the local descending resistance line and below the central area of the Price Envelope.
The downward wave matrix, with a pivot point around 7,660–7,666, maintains the bearish bias. While the price remains below 7,666, any rise is viewed as a correction within the broader bearish structure. The main scenario suggests a downside breakout from the range, followed by a test of the 7,563 level. This level coincides with the lower part of the current H4 channel and is the nearest projected target. Consolidation below 7,563 would increase pressure and could extend the decline, while a return above 7,684 would temporarily invalidate the immediate bearish momentum.
A narrowing bearish range remains in place on the H4 chart. The 7,623 level acts as the local centre of consolidation, while 7,684 is the nearest resistance. A breakout below 7,563 would confirm a downside move and create conditions for a decline towards 7,525–7,500. A return above 7,684 would temporarily postpone the bearish impulse. Weak technology stocks add another risk: if US Treasury yields rise above 5% again, selling could accelerate. On the chart, this corresponds to continued pressure while the price remains below 7,623 and 7,684.
US 500 forecast scenario
Trading scenario: SELL
- Price at the time of writing: 7,610
- Entry price: 7,605
- Stop loss: 7,620
- Take profit: 7,563
- Risk-to-reward ratio: 1:2.8
The trade idea is valid until 8:00 AM on 16 September 2026 (server time, UTC+3).
BTCUSD forecast
As of 15 September 2026, BTCUSD remains sensitive to global liquidity conditions and US interest rate dynamics. The Federal Reserve is approaching its decision with a high probability of a 25-basis-point rate hike, while the yield on 10-year US Treasuries has risen towards 5%. This backdrop typically weakens demand for high-risk assets and increases the likelihood of profit-taking after local Bitcoin rebounds.
At the same time, the fundamental backdrop for the cryptocurrency market is not unequivocally negative. In recent weeks, Bitcoin has recovered from its August lows, while exchange-traded fund data indicates a return of some institutional demand. Another supportive driver is work by the US Congress on the Clarity Act, which is intended to clarify the regulation of digital assets. However, macroeconomic factors dominate in the near term: rising yields, a strong dollar, high oil prices, and expectations of tighter Fed policy are reducing risk appetite. Therefore, even as the institutional backdrop improves, BTCUSD remains vulnerable to another wave of selling, especially if the regulator confirms its readiness to continue the rate-hiking cycle.
The cryptocurrency market is receiving support from expectations of clearer US regulation and renewed ETF inflows, so declines may be accompanied by sharp rebounds. Nevertheless, the cost of capital and the dollar's performance are currently more important. While US Treasury yields remain near multi-year highs, the appeal of highly volatile assets remains limited.
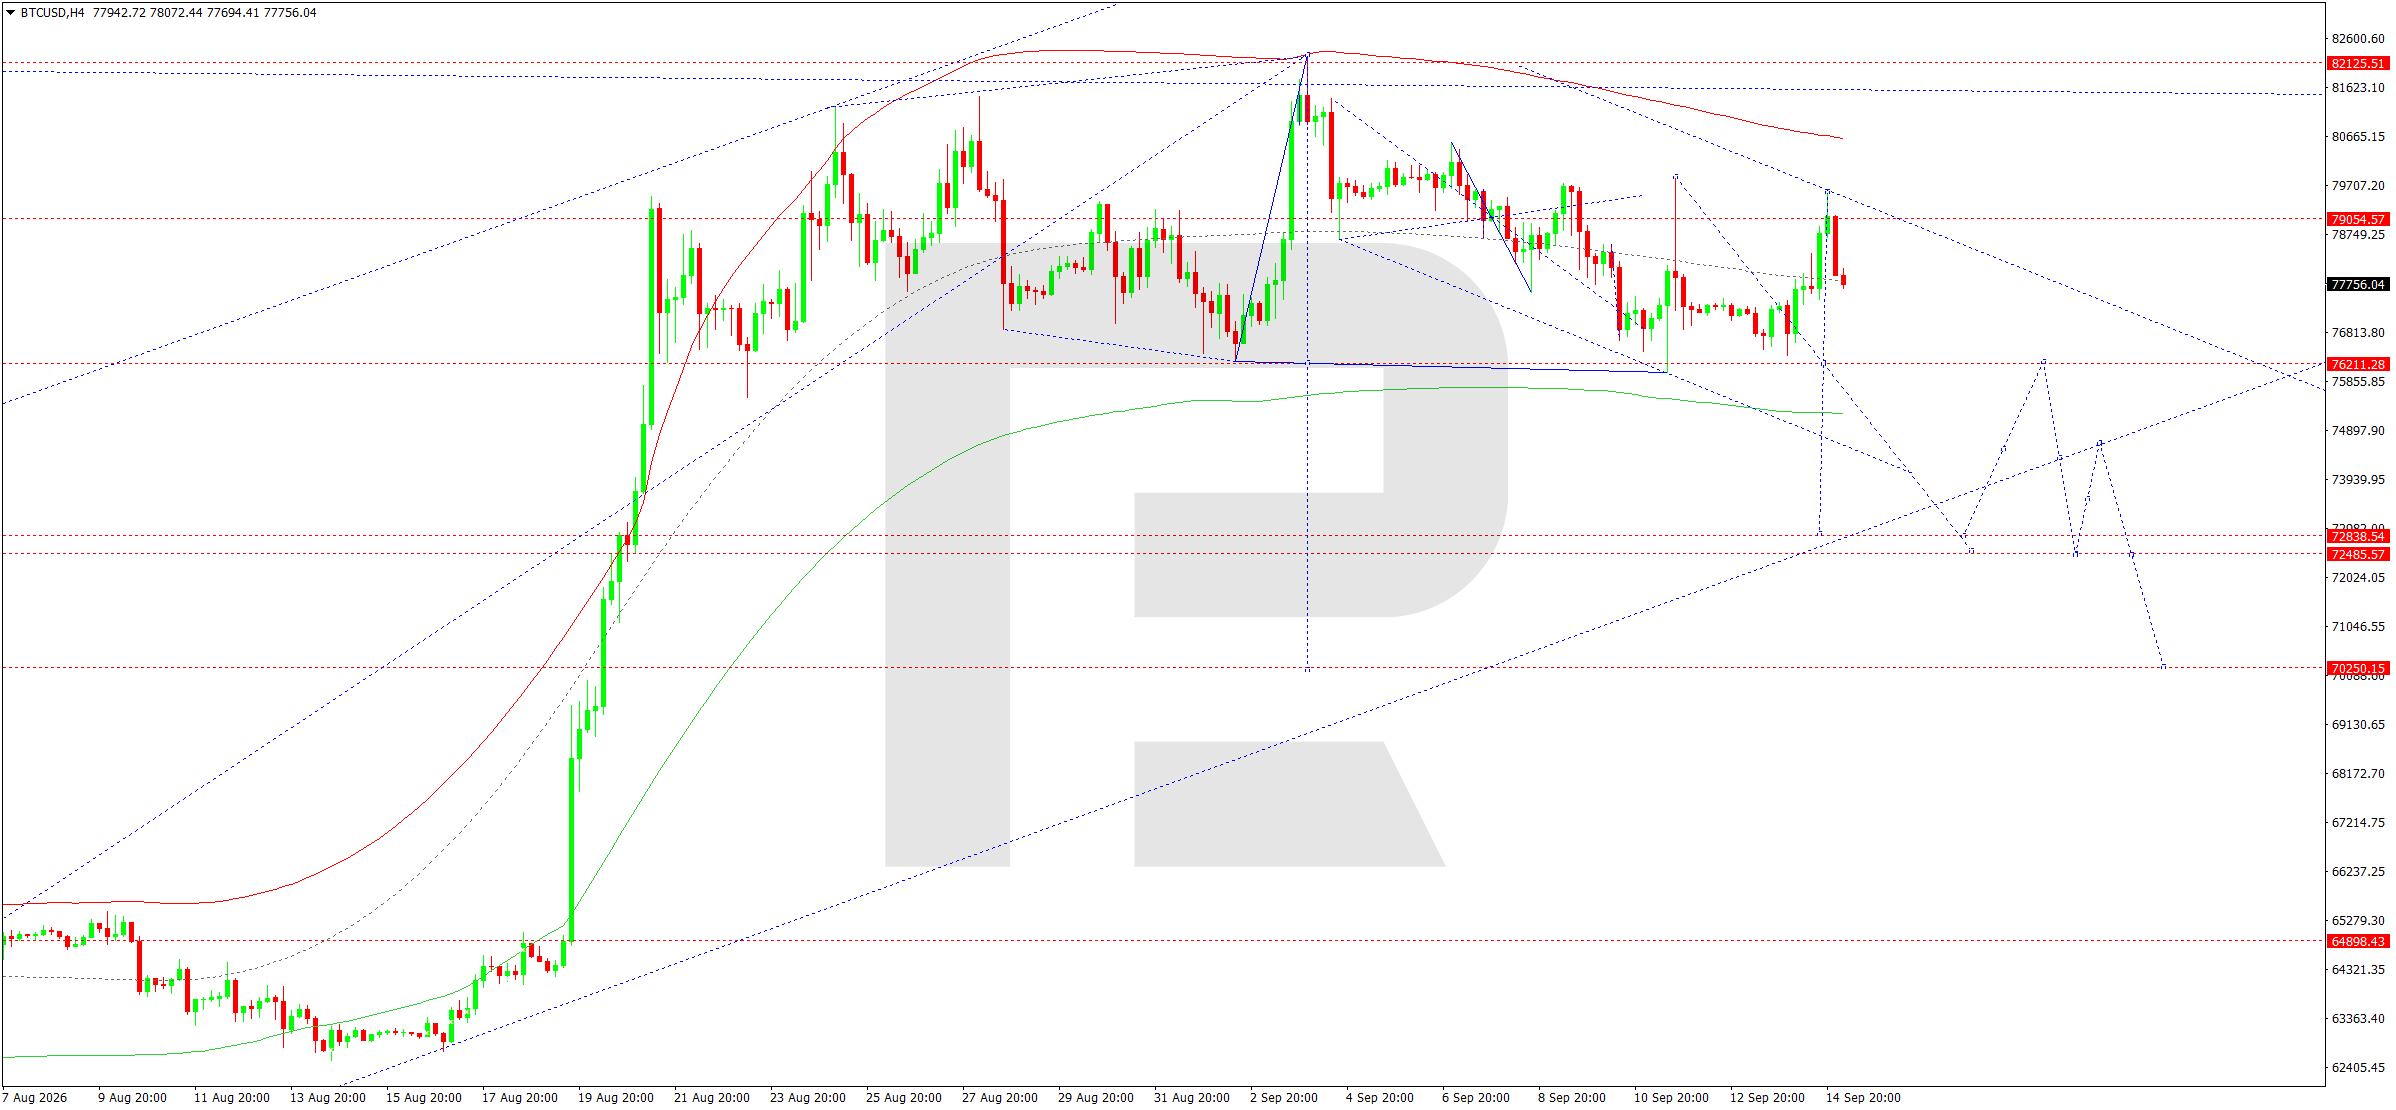
On the H4 chart, BTCUSD completed a corrective wave towards 79,090 and reversed lower from this area. Today, the market is moving towards 76,211. This level is the nearest support point in the current structure and could be tested during the next impulse.
The downward wave matrix, with a pivot point around 76,211, and the Elliott wave structure confirm the bearish bias. The price previously returned to the upper boundary of the Price Envelope near 79,090 but failed to consolidate above it. Therefore, the rise is viewed as a completed correction. A breakout below 76,211 would open the way towards 72,890, where the lower boundary of the Envelope is located. A test of 72,485 could then follow as a local continuation target. While BTCUSD remains below 79,090, the technical structure points to persistent selling pressure and a high risk of continued downward momentum.
The 79,000–79,100 area remains key resistance on the H4 chart: the latest upside attempt was quickly rejected. A breakout below 76,211 would confirm a new lower low and make 72,890 the main target. Rebounds towards 78,000–78,500 would not change the picture while the market remains below 79,090. The intraday reaction to 76,211 will be crucial: holding this support could trigger a technical rebound, but an H4 close below it would increase the likelihood of a rapid move towards 72,890.
BTCUSD forecast scenario
Trading scenario: SELL
- Price at the time of writing: 77,700
- Entry price: 77,695
- Stop loss: 79,297
- Take profit: 72,890
- Risk-to-reward ratio: 1:3.0
The trade idea is valid until 8:00 AM on 16 September 2026 (server time, UTC+3).
Editors’ picks
 EURUSD forecast 2026–2027: technical analysis, price levels & predictions
EURUSD has recovered from the July lows and is trading near 1.1545 — back in bullish territory. The pair has reclaimed EMA65 on the daily, formed a bullish EMA crossover on H4, and the US-eurozone GDP gap has narrowed sharply (US 1.5% vs eurozone 1.0%). Goldman Sachs and Deutsche Bank both now target 1.2500 by year-end. A confirmed close above 1.1700 opens the path to 1.1805. We break down the key levels, three trading scenarios, and what the unprecedented 9-3 FOMC dissent vote means for EURUSD.
 Gold (XAUUSD) forecast 2026: technical analysis, price levels & predictions
Gold has reversed its downtrend and is trading near 4,360 USD, back above both EMA65 and EMA200. ETF flows turned positive in July with 3 billion USD of net inflows, and central banks bought 288.9 tonnes in Q2 — up 62% year-on-year. A breakout above 4,500 USD opens the path to 4,855 USD and the 5,597 USD all-time high. We break down the key levels, three trading scenarios with entry triggers, and what J.P. Morgan, Deutsche Bank and Goldman Sachs are forecasting for gold in 2026.
Forecasts presented in this section only reflect the author’s private opinion and should not be considered as guidance for trading. RoboForex bears no responsibility for trading results based on trading recommendations described in these analytical reviews.