
Daily technical analysis and forecast for 16 September 2026
Daily technical analysis and forecast for EURUSD, USDJPY, GBPUSD, AUDUSD, USDCAD, XAUUSD, US 500, and BTCUSD for 16 September 2026.
Each scenario on this page reflects the market structure on the H4 chart as of 10:00 UTC+3 on 16 September 2026. The assessment considers the current H4 chart structure, key support and resistance levels, the direction of the medium-term movement, and the prevailing fundamental backdrop.
EURUSD forecast
As of the morning of 16 September, the fundamental backdrop for EURUSD is being shaped by two factors: the recent tightening of monetary policy in the eurozone and expectations surrounding today's US interest rate decision. The European Central Bank raised its key rate by 25 basis points to 2.50% on 10 September, citing increased inflation risks driven primarily by high energy prices. Eurozone inflation accelerated to 3.3% in August, while ECB officials said after the meeting that further gradual tightening could be possible if the energy shock begins to feed persistently into wages and other prices. This provides fundamental support for the euro, although it is not yet sufficient to establish a sustained uptrend.
The Federal Reserve meeting remains the main event of the day. Market participants are almost fully pricing in a 25-basis-point rate hike. US CPI rose by 3.4% year-on-year in August, while core inflation stood at 2.4%. A resilient labour market provides another argument for tight policy. The yield on 10-year US Treasuries previously moved above 5%, supporting the dollar. During the Asian session, EURUSD traded around 1.1535. Therefore, ahead of the Fed decision, the fundamental backdrop remains moderately negative for the euro.
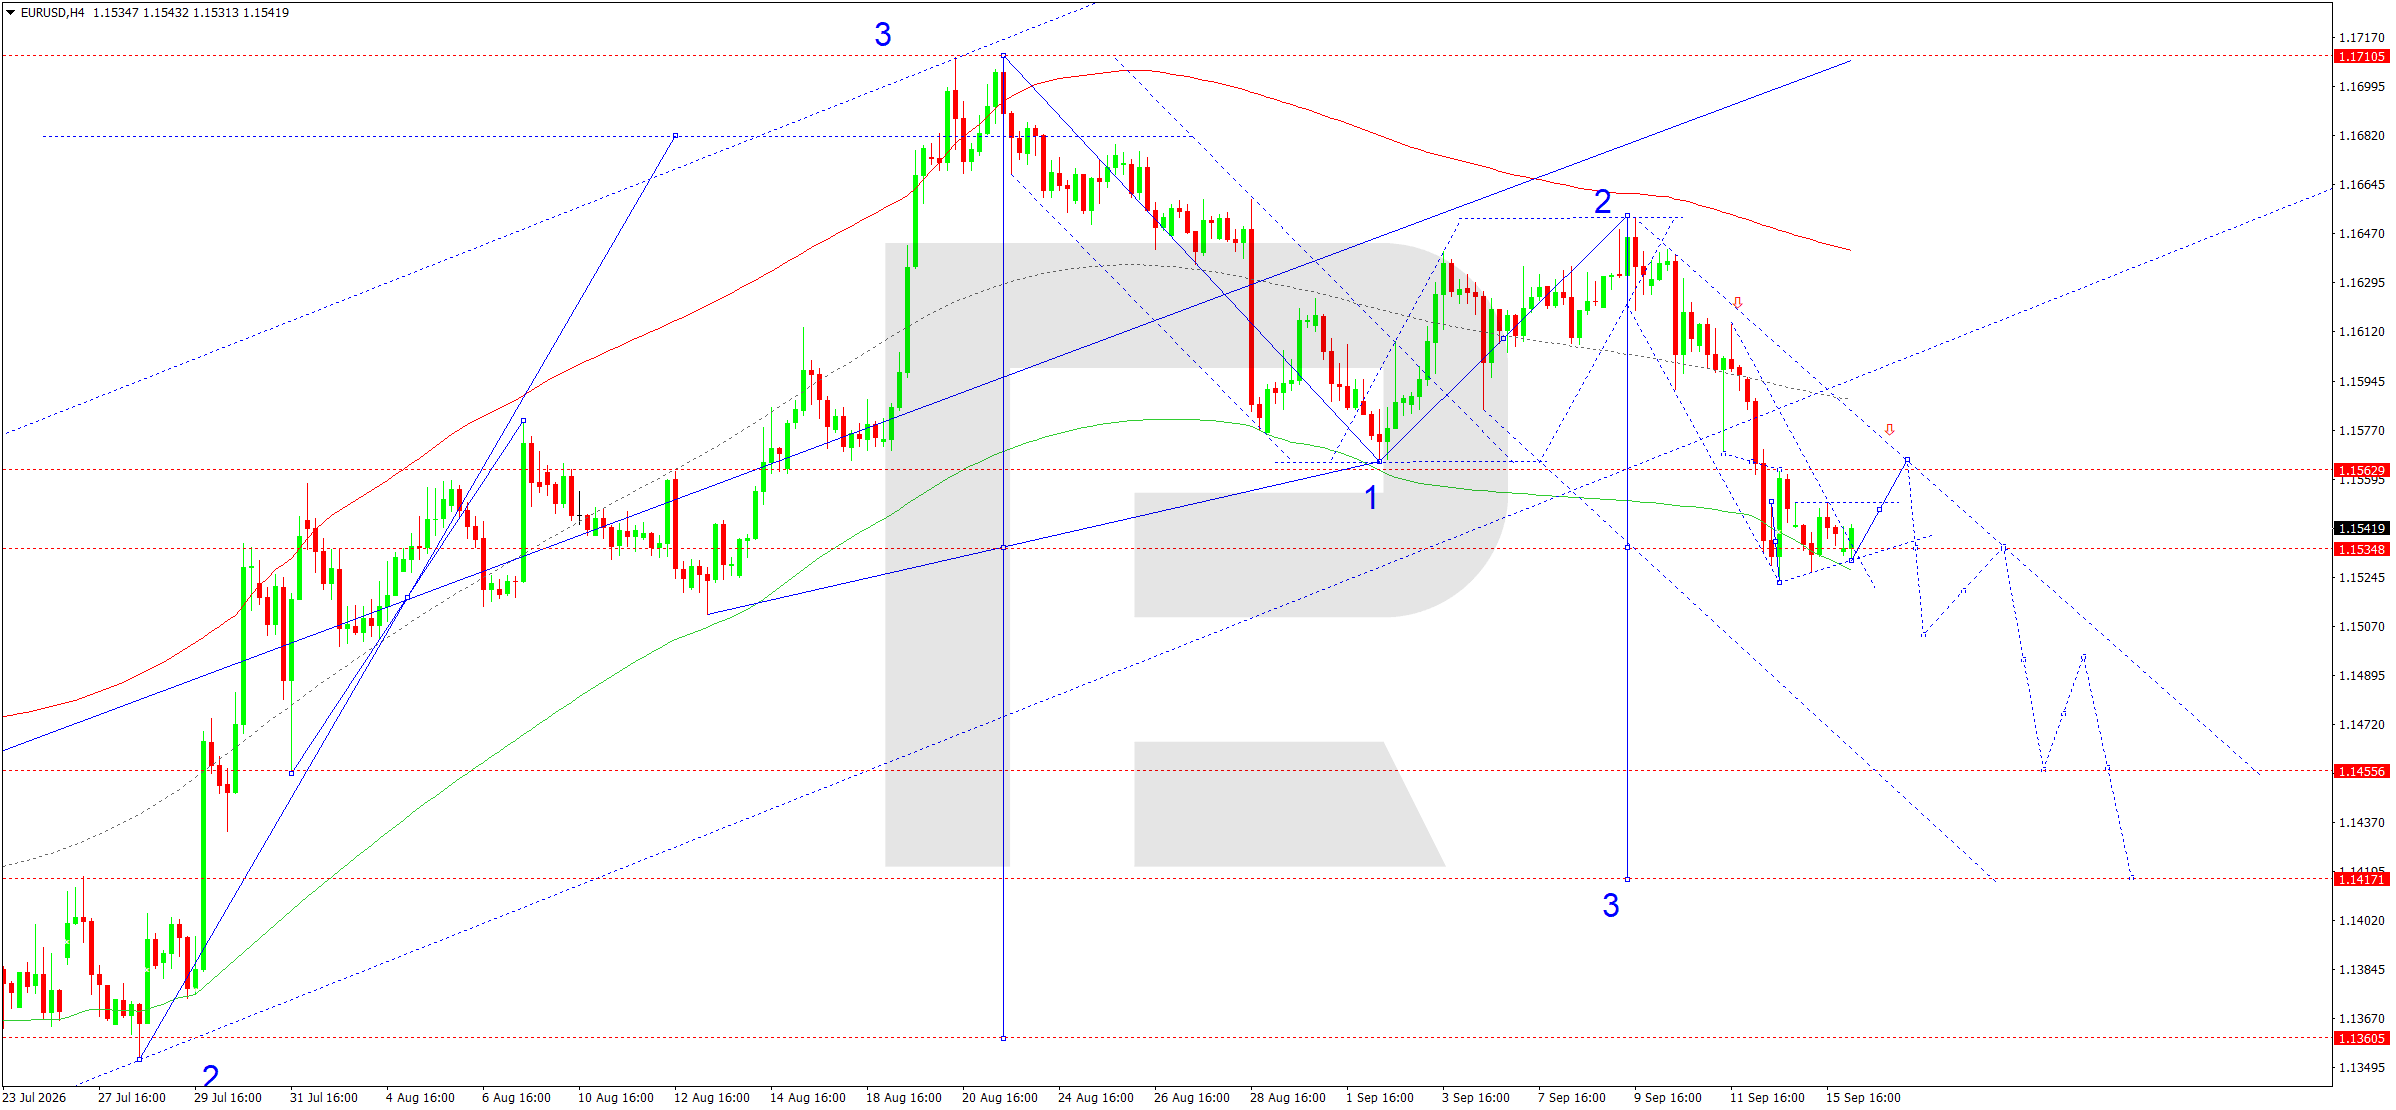
On the H4 chart, EURUSD completed a corrective wave towards 1.1562 and formed a new downward impulse towards the 1.1526 area. Today, 16 September 2026, a breakout below 1.1526, followed by a further move towards 1.1510, remains the main scenario. Once this target is reached, the way would open towards 1.1456 and then 1.1420. The latter area is viewed as the target of the third downward wave.
The Elliott wave structure and the matrix, with a pivot point around 1.1525, confirm the bearish bias. The market returned towards the central line of the Price Envelope around 1.1565 but failed to consolidate above it. The price remains within a descending channel, while local highs continue to move lower. While the EURUSD pair trades below 1.1565–1.1570, the main scenario remains a decline towards the lower boundary of the Envelope in the 1.1420 area. A return above 1.1595 would temporarily invalidate the current impulse and extend the correction.
EURUSD forecast scenario
Trading scenario: SELL
- Price at the time of writing: 1.1544
- Entry price: 1.1539
- Stop loss: 1.1570
- Take profit: 1.1456
- Risk-to-reward ratio: 1:2.7
The trade idea is valid until 8:00 AM on 17 September 2026 (server time, UTC+3).
USDJPY forecast
As of the morning of 16 September, the fundamental backdrop for USDJPY is being shaped by a simultaneous increase in rate expectations in the US and Japan. The Federal Reserve concludes its two-day meeting today. Financial markets are pricing in a 25-basis-point rate hike with a probability of around 90%. The dollar is being supported by elevated inflation, strong employment data and high US government bond yields. Oil also remains an important factor: expensive energy is supporting inflation expectations and increasing the likelihood that the Fed will maintain a hawkish tone after today's decision.
At the same time, the probability of policy tightening by the Bank of Japan is increasing. The meeting concludes on Friday, and analysts expect the policy rate to rise from 1.00% to 1.25%, which would be its highest level in around three decades. The latest data strengthen the BoJ's case: Japan's imports rose by 28% year-on-year in August due to higher energy prices, exports increased by 19.3%, and the trade balance remained in deficit. Higher imported fuel costs are creating additional inflationary pressure. Therefore, once the USDJPY correction is complete, the fundamental conditions for yen appreciation are gradually strengthening.
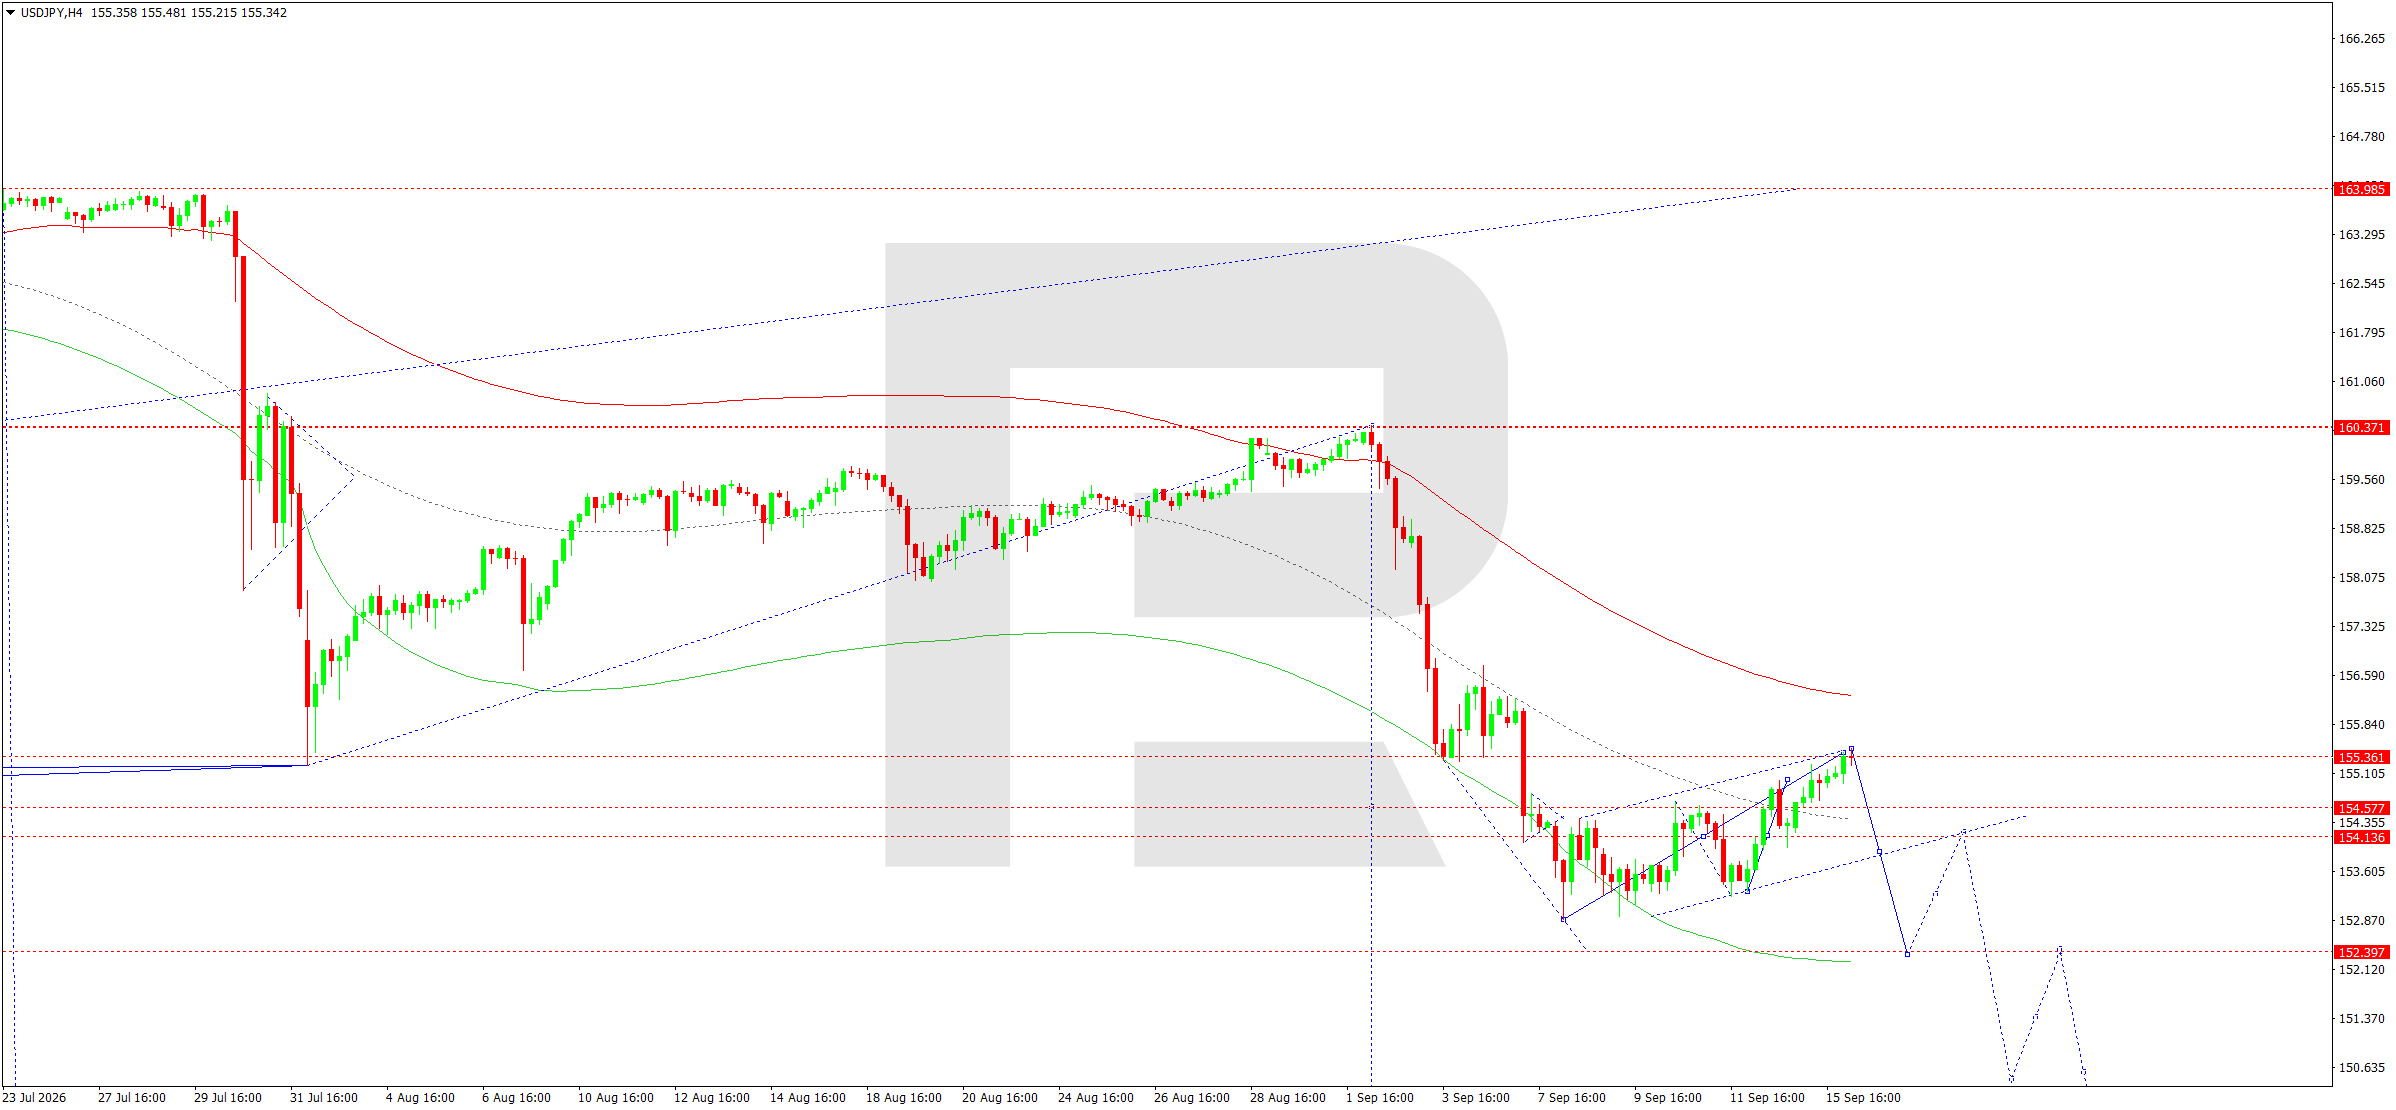
On the H4 chart, USDJPY found support around 154.00 and formed a corrective upward wave towards 155.44. A potential area where this correction could end is developing around this level today. A compact consolidation below 155.44 followed by the start of a new downward wave remains the main scenario. The first target is the central 154.00 area. A breakout below this level would open the way towards 152.40, while the next strategic target remains 148.80.
The Elliott wave structure and the downward wave matrix, with a pivot point around 155.00, confirm this scenario. Following the decline from the 160.37 area, the broader H4 trend remains bearish despite the recovery in recent sessions. The current rise towards 155.44 appears to be a corrective move within the broader bearish structure. A pivot point for the next impulse is effectively forming. A return below 155.00 followed by a breakout below 154.35 would increase selling pressure. Consolidation above 155.80 would be the first sign of a deeper correction and would require a reassessment of the short-term structure.
USDJPY forecast scenario
Trading scenario: SELL
- Price at the time of writing: 155.35
- Entry price: 155.30
- Stop loss: 155.80
- Take profit: 152.40
- Risk-to-reward ratio: 1:5.8
The trade idea is valid until 8:00 AM on 17 September 2026 (server time, UTC+3).
GBPUSD forecast
As of the morning of 16 September, the fundamental situation for GBPUSD is being driven mainly by a strengthening US dollar. The Federal Reserve will announce its rate decision today, and the market is pricing in a 25-basis-point hike to a significant degree. US inflation remained elevated in August, while higher oil prices increased concerns about a renewed inflationary impulse. The yield on 10-year US Treasuries previously moved above 5%, giving the dollar an additional advantage over most major currencies.
The Bank of England will announce its decision on Thursday. Fresh UK labour market data are more consistent with the BoE keeping rates unchanged: regular pay growth for the three months to July was 3.5%, the number of vacancies fell to 702,000, and payroll employment declined by 26,000 in August. This points to a gradual cooling of the labour market. At the same time, high energy prices are keeping inflation risks elevated, so the possibility of tighter policy later in the year remains. Ahead of the BoE meeting, the pound is not receiving interest-rate support comparable with that of the dollar, keeping GBPUSD under pressure.
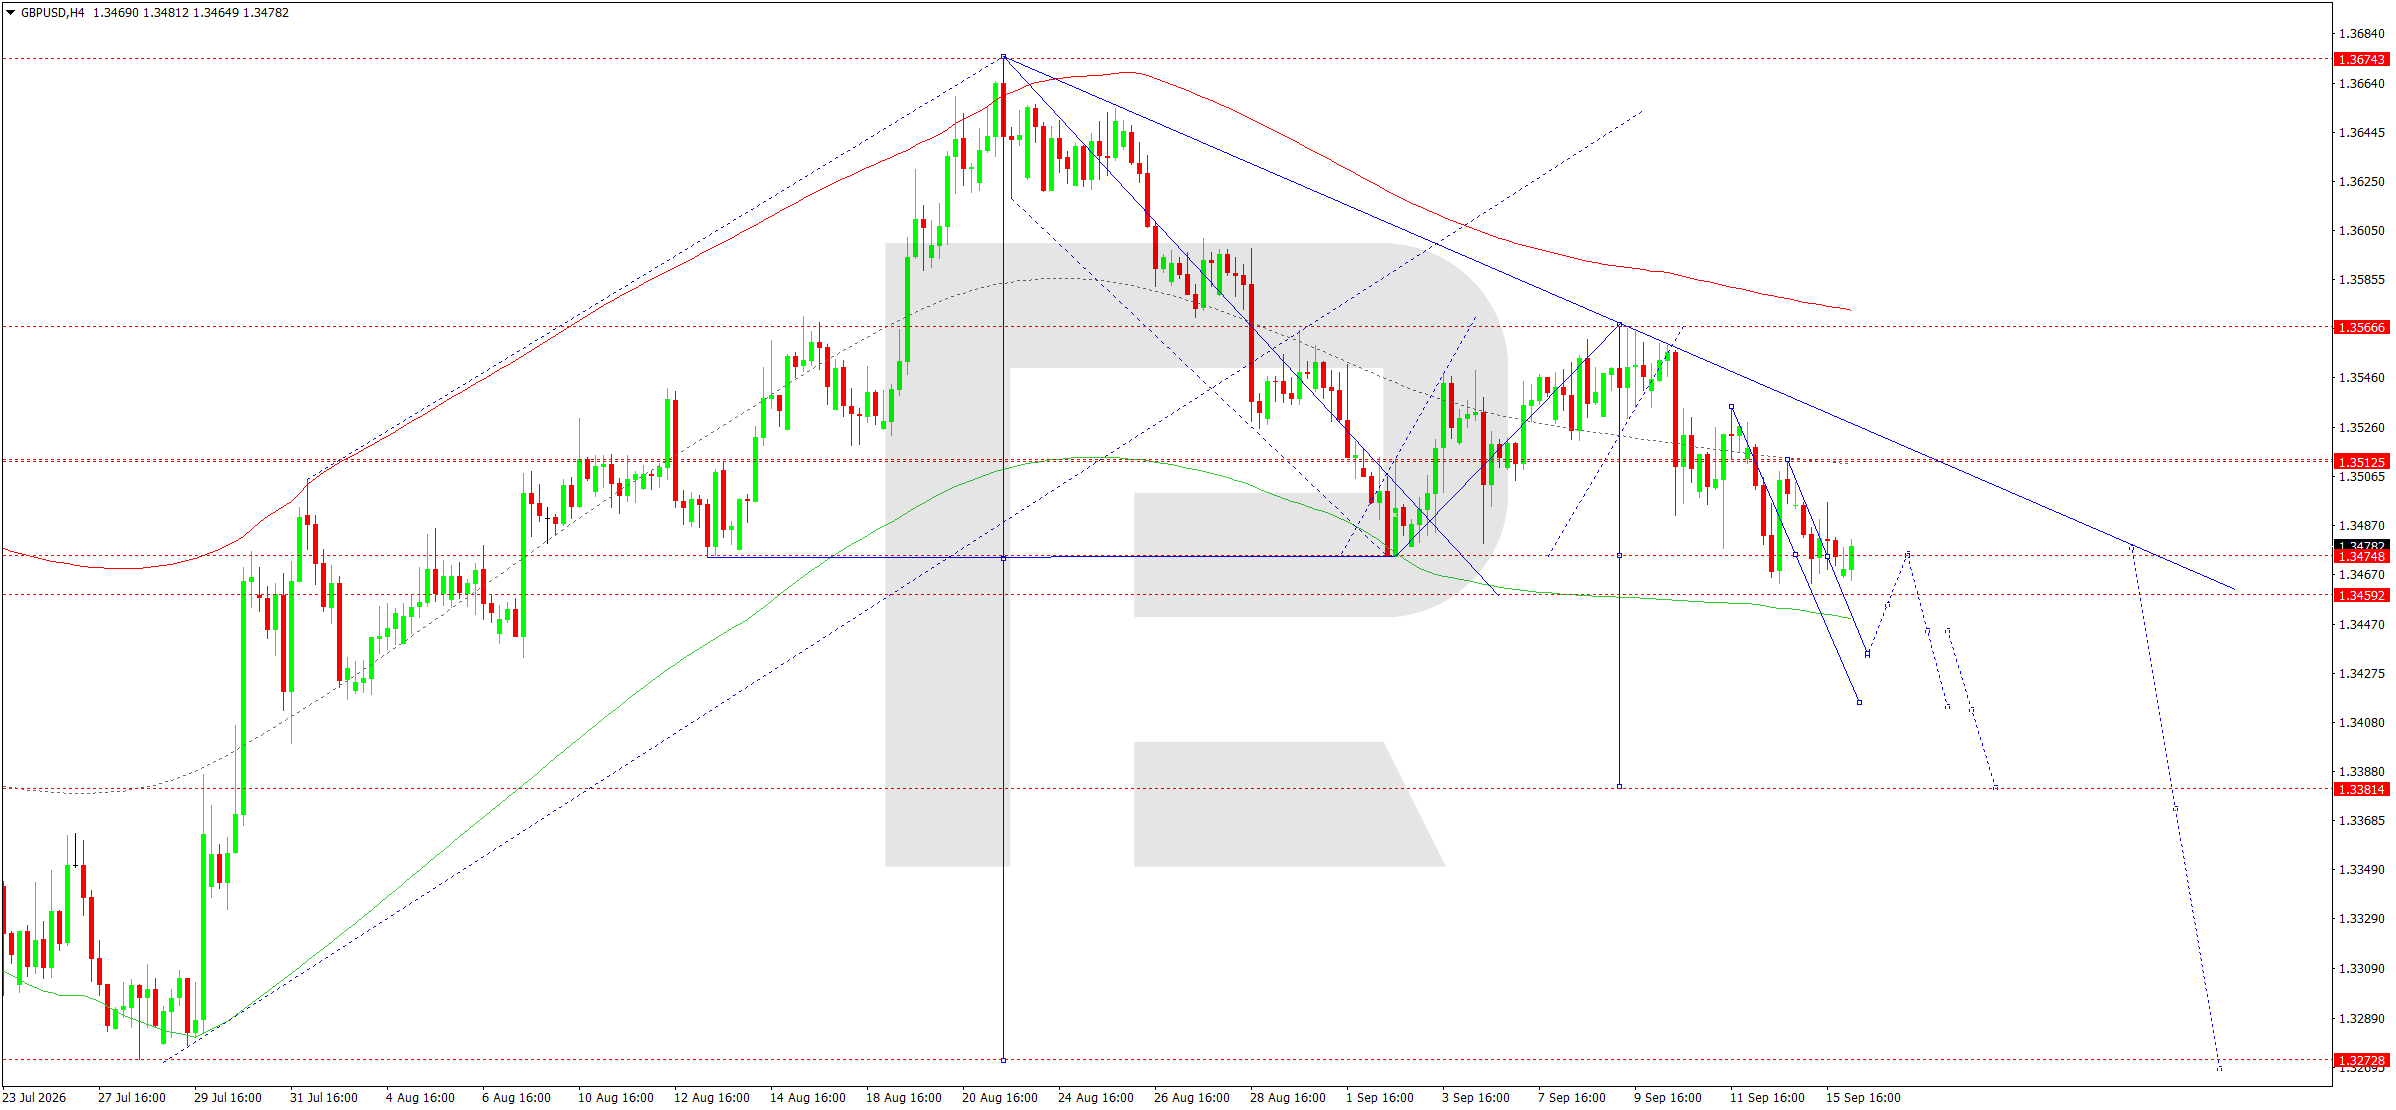
On the H4 chart, GBPUSD completed a correction towards 1.3512, effectively testing the level from below, before returning to the downside. Today, a compact consolidation range is forming around 1.3470. While the price remains below 1.3512, a continuation of the impulse towards 1.3459 and then 1.3415 remains the main scenario. The next local target is located around 1.3383.
The Elliott wave structure and the downward wave matrix, with a pivot point around 1.3470, confirm the sellers' advantage. The price is below the descending trendline drawn from the August high at 1.3674. The central line of the Price Envelope runs through the current consolidation area, while its lower boundary points towards 1.3415. A downside breakout from the range would confirm the continuation of the trend, with scope to reach 1.3383. Corrective rises towards 1.3512 are still viewed as resistance retests. Only consolidation above 1.3566 would materially change the current technical picture and create conditions for a more sustained recovery.
GBPUSD forecast scenario
Trading scenario: SELL
- Price at the time of writing: 1.3485
- Entry price: 1.3480
- Stop loss: 1.3520
- Take profit: 1.3383
- Risk-to-reward ratio: 1:2.4
The trade idea is valid until 8:00 AM on 17 September 2026 (server time, UTC+3).
AUDUSD forecast
For AUDUSD, the key fundamental factor on the morning of 16 September remains the combination of a strong US dollar and deteriorating global risk appetite. The Federal Reserve will announce its rate decision today, with the market largely expecting a 25-basis-point hike. Rising US bond yields and persistent inflation risks are creating additional demand for the dollar. The Australian currency, which is traditionally sensitive to changes in global sentiment, has retreated noticeably from its highs since the beginning of September. Reuters noted that pressure intensified after the US currency strengthened, Treasury yields rose and investor sentiment towards risk assets deteriorated.
The Reserve Bank of Australia is maintaining a tight monetary policy stance. Following a series of rate hikes, the policy rate stands at 4.35%, while money markets estimate the probability of another hike at the 28–29 September meeting at around 84%. However, high rates are already having a noticeable effect on domestic demand: Australian house prices have fallen by almost 4% from their peaks, with Sydney and Melbourne showing a deeper correction. Expectations of further RBA tightening therefore provide some support for the Australian dollar, but in the short term this factor is being outweighed by a strong US dollar and cautious risk sentiment.
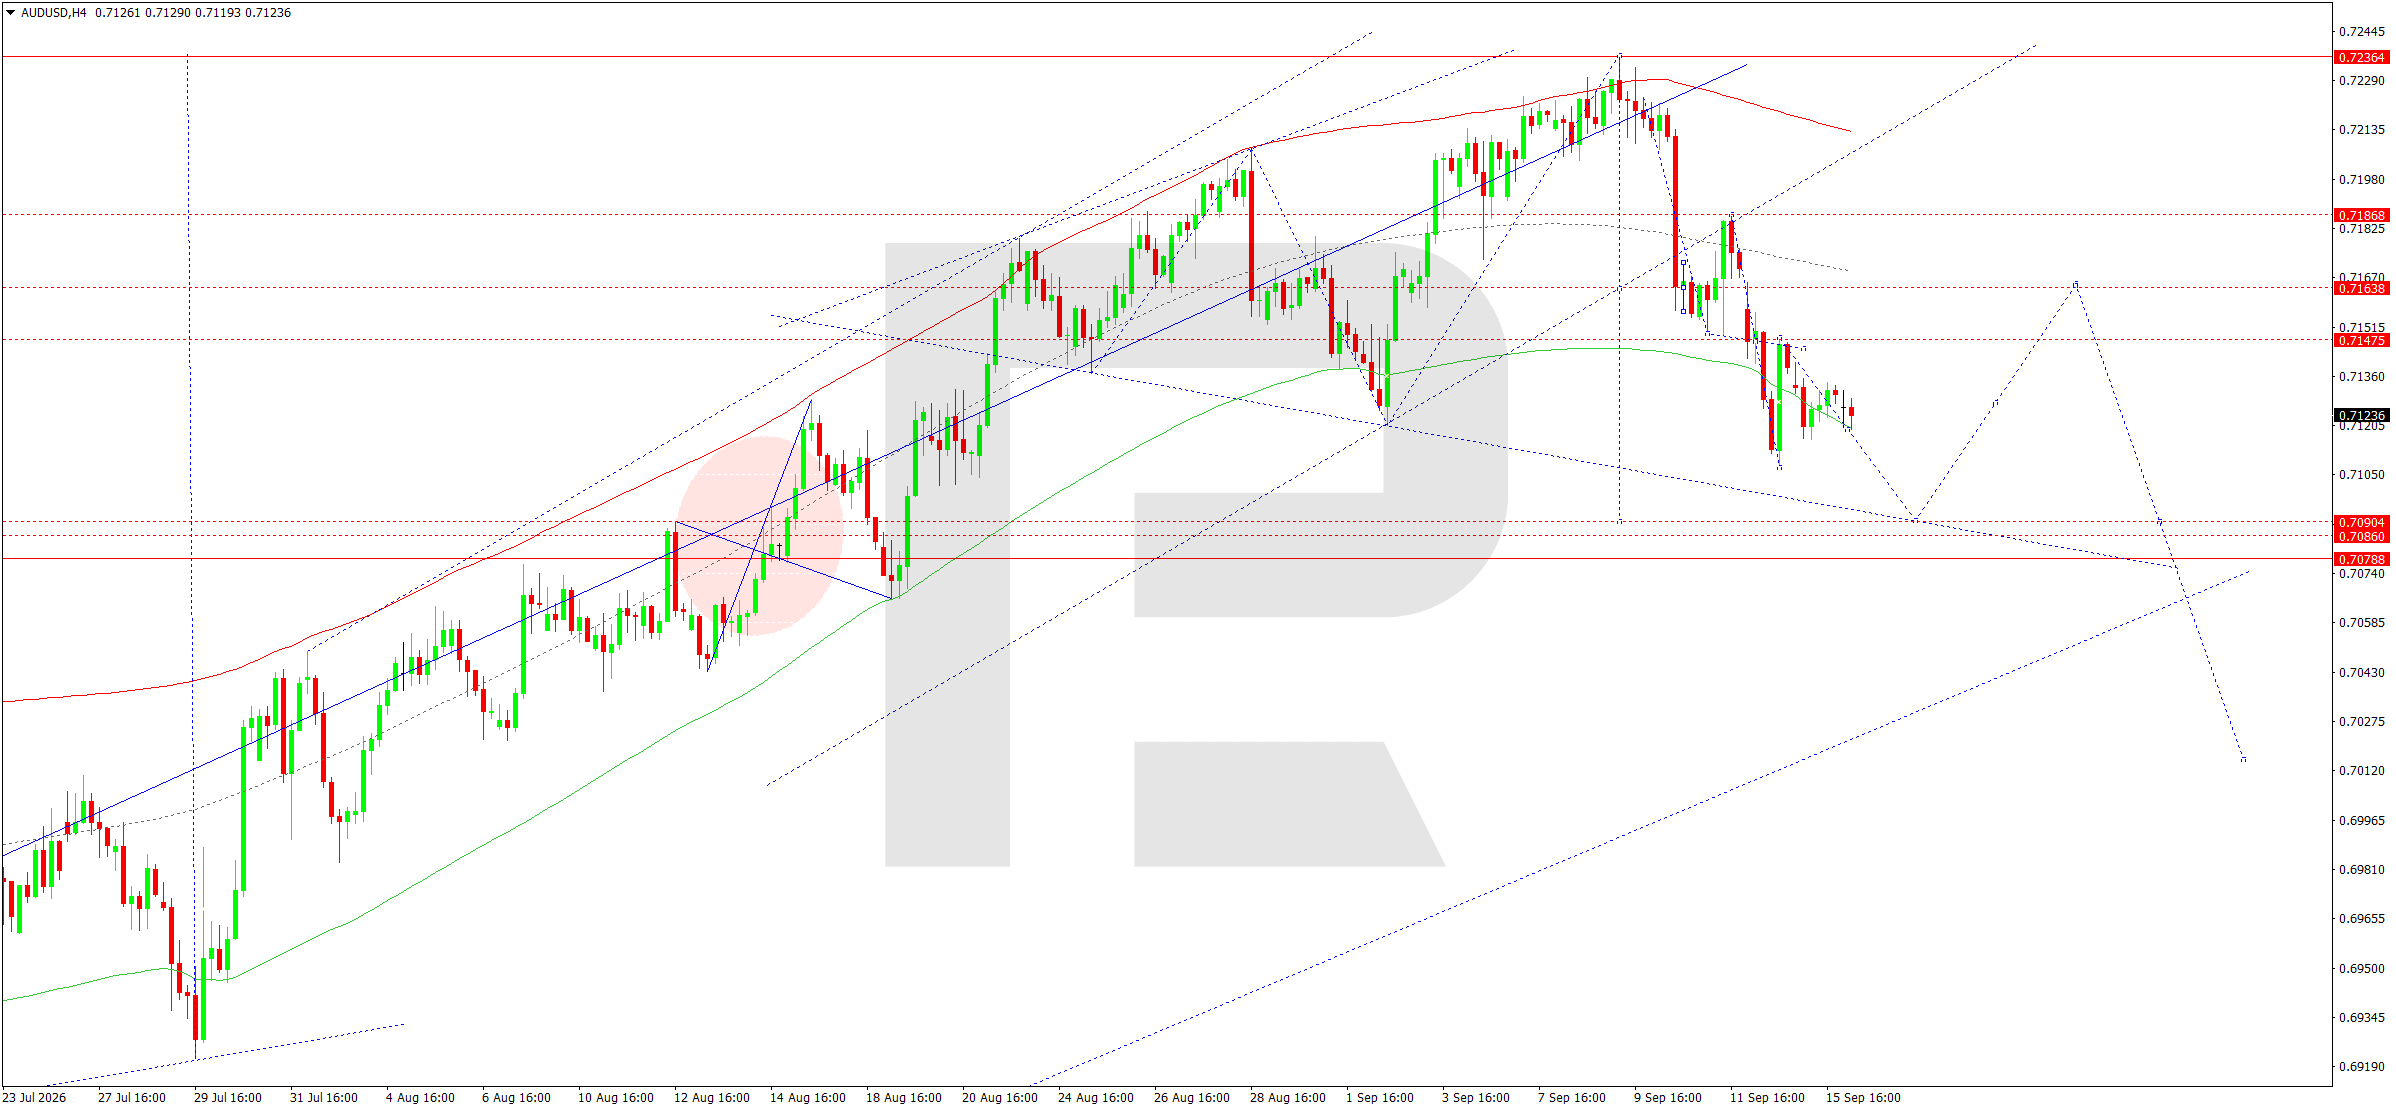
On the H4 chart, AUDUSD formed a downward impulse towards 0.7108 before moving into a local consolidation range. The subsequent recovery towards 0.7147 was limited, after which the price declined again into the 0.7118–0.7120 area. Today, a continuation of the downtrend towards 0.7090 remains the main scenario. This level is the first target of the current wave.
The Elliott wave structure and the downward wave matrix, with a pivot point at 0.7161, confirm the bearish bias. The price has consolidated below the central part of the Price Envelope and is moving towards its lower boundary around 0.7090. The 0.7147 and 0.7161 levels provide additional resistance. After 0.7090 is reached, a consolidation range and a corrective recovery towards 0.7161 may form, with a retest from below. However, while the price remains below this level, any rise should be viewed as a correction within the current bearish structure. A deeper target is located around 0.7079.
AUDUSD forecast scenario
Trading scenario: SELL
- Price at the time of writing: 0.7129
- Entry price: 0.7124
- Stop loss: 0.7150
- Take profit: 0.7090
- Risk-to-reward ratio: 1:1.3
The trade idea is valid until 8:00 AM on 17 September 2026 (server time, UTC+3).
USDCAD forecast
As of the morning of 16 September, the fundamental backdrop for USDCAD is supporting elevated volatility in the pair. The Federal Reserve concludes its meeting today, and the market is almost fully pricing in a 25-basis-point rate hike. Higher US yields and expectations of a tighter monetary policy path have strengthened the dollar against the Canadian currency. The Canadian dollar declined for a fifth consecutive trading session the previous day, while USDCAD rose into the 1.3915–1.3930 area. Weaker Canadian housing market data added further pressure.
The Bank of Canada kept its key rate unchanged at 2.25% at its 2 September meeting but warned that it was prepared to raise rates if inflation remained persistently high. Canada's August CPI was 3.0% year-on-year, while the CPI-median and CPI-trim core measures remained around 2%. High oil prices can traditionally support the Canadian dollar by improving the terms of trade, but the energy shock is also increasing domestic inflation and bond yields. At present, the effect of the strong US dollar and Fed expectations outweighs the support from oil. The balance could change rapidly after the Fed decision.
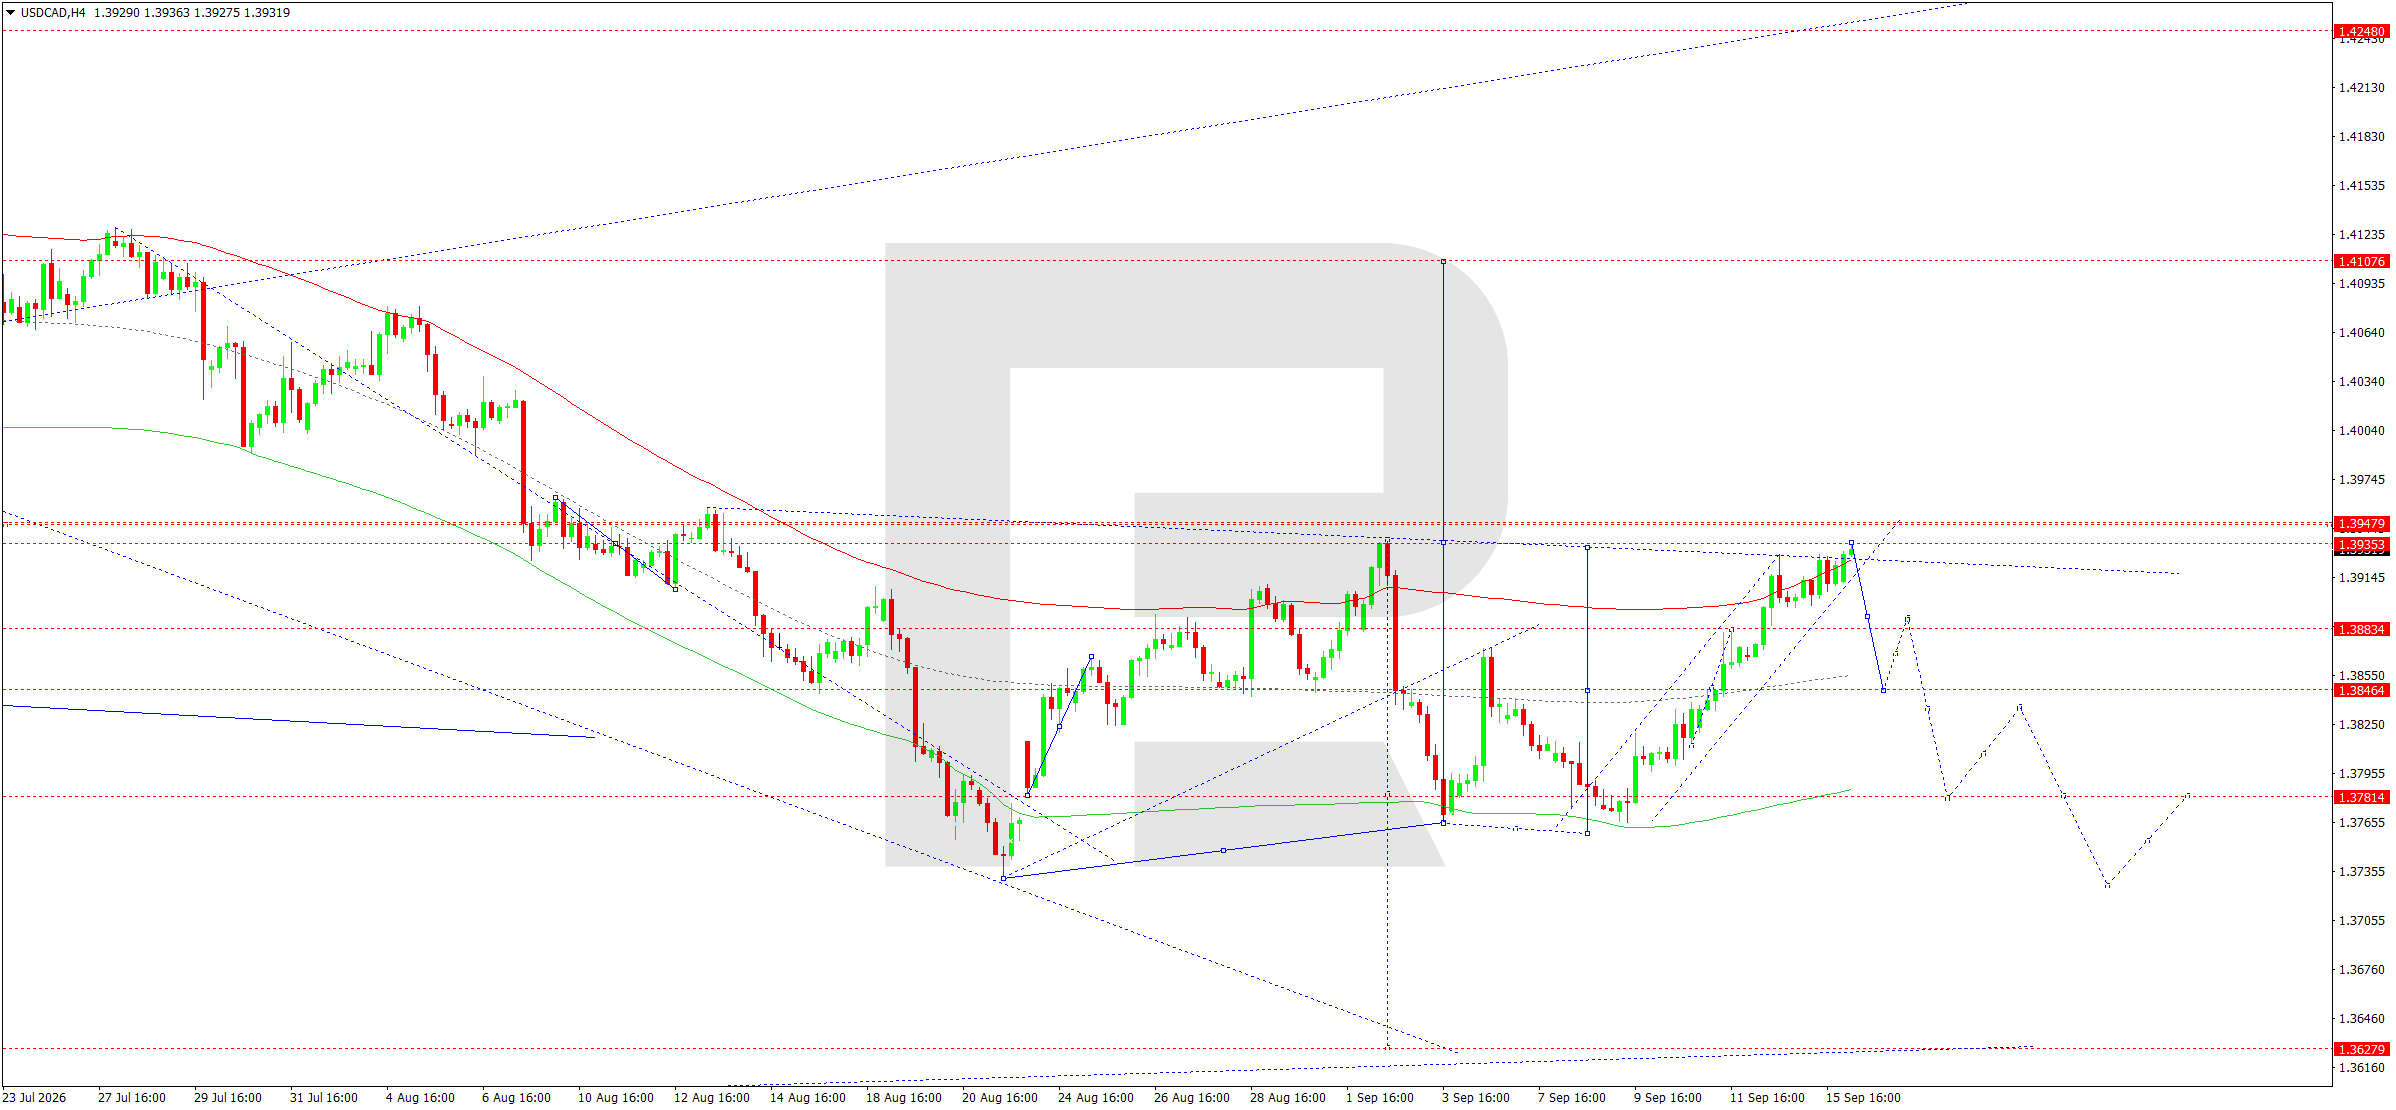
On the H4 chart, USDCAD formed a full upward wave from the 1.3760 area and reached the upper boundary of the local range at 1.3935. Today, a compact consolidation is expected to develop directly below this resistance area. The market could still make a brief extension higher towards 1.3950, but once this move is completed, the probability of a reversal and correction towards 1.3830 will increase.
The Elliott wave structure and the wave matrix, with a pivot point around 1.3833, show that the current upward impulse is approaching its upper target area. The price is testing the upper boundary of the Price Envelope at 1.3935–1.3950. A failure to consolidate above it would signal the end of the current upward move. The first downside target is 1.3883, followed by 1.3830–1.3846. If a full downward wave develops, the next target area is around 1.3781–1.3733. Therefore, after the upper boundary of the range is tested, priority gradually shifts towards a corrective scenario. Consolidation above 1.3950 would temporarily invalidate this scenario.
USDCAD forecast scenario
Trading scenario: SELL
- Price at the time of writing: 1.3928
- Entry price: 1.3923
- Stop loss: 1.3955
- Take profit: 1.3830
- Risk-to-reward ratio: 1:2.9
The trade idea is valid until 8:00 AM on 17 September 2026 (server time, UTC+3).
XAUUSD forecast
As of 16 September, XAUUSD is in focus ahead of the Federal Reserve decision. Gold was recovering by around 0.8% this morning, holding near 4,328 USD per ounce. The market is almost fully pricing in a 25-basis-point Fed rate hike. This creates a mixed environment for gold: on the one hand, elevated inflation and geopolitical uncertainty support demand for safe-haven assets; on the other, higher interest rates and bond yields increase the opportunity cost of holding a metal that generates no interest income.
Additional pressure in previous sessions came from the US dollar and the yield on 10-year US Treasuries, which rose above 5%. The oil shock increased concerns about another wave of inflation and strengthened expectations of a hawkish Fed stance. At the same time, persistent tensions in the Middle East are preventing investors from abandoning defensive gold positions entirely. The fundamental backdrop therefore remains mixed, but ahead of the Fed decision the interest-rate factor is limiting the potential for a sustained recovery in XAUUSD. The market's main reaction will depend not only on the rate decision itself but also on the assessment of the future monetary policy path.
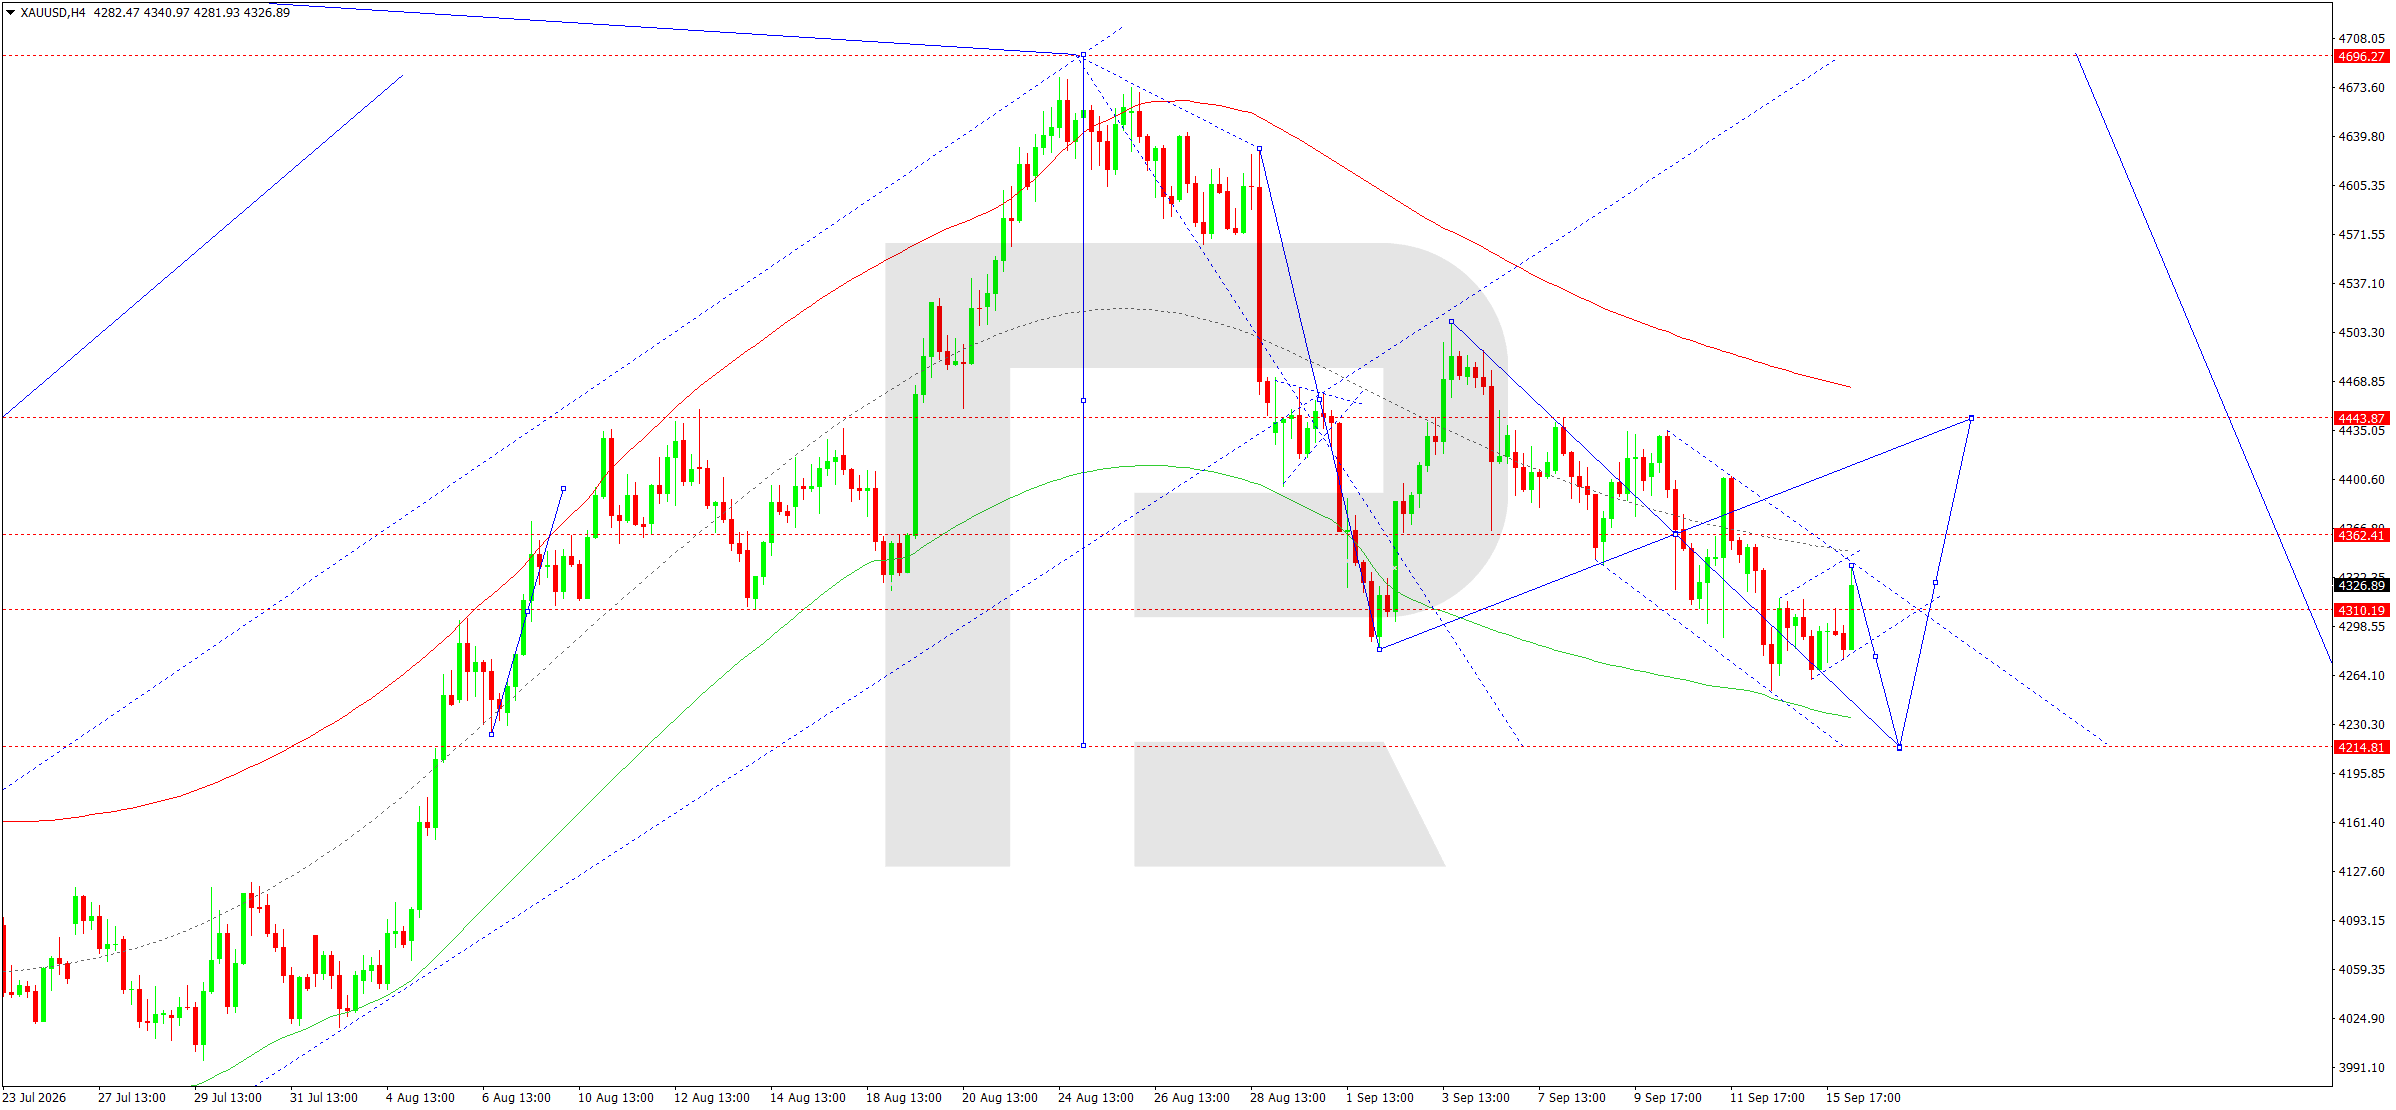
On the H4 chart, XAUUSD continues to form a bearish structure within a broad range. After declining towards 4,253, the market corrected to the 4,339 area, but the rise failed to develop into a sustained recovery. Today, the market is trading around the central 4,310–4,325 area. A decline towards 4,215 remains the main scenario and is viewed as the first key target of the current impulse.
The Elliott wave structure and the downward wave matrix, with a pivot point around 4,362, confirm continued selling pressure. The price remains below descending dynamic resistance levels and is forming a sequence of lower highs. The 4,310 level is effectively an intermediate balance area, while the 4,215 area corresponds to the lower boundary of the Price Envelope. After this level is tested, a new consolidation range and a corrective rise towards 4,310 may form, followed by 4,362 and 4,433 if the price breaks higher. However, while the price remains below 4,362, the priority is still a continuation of the current downward wave.
XAUUSD forecast scenario
Trading scenario: SELL
- Price at the time of writing: 4,325
- Entry price: 4,320
- Stop loss: 4,365
- Take profit: 4,215
- Risk-to-reward ratio: 1:2.3
The trade idea is valid until 8:00 AM on 17 September 2026 (server time, UTC+3).
US 500 forecast
As of the morning of 16 September, the fundamental backdrop for the US 500 remains tense ahead of the Federal Reserve decision. US stock indices closed lower in the previous session: the S&P 500 lost around 0.45%, while the Nasdaq fell by around 0.78%. Pressure came simultaneously from a sharp rise in oil prices, inflation concerns and higher US bond yields. The yield on 10-year US Treasuries moved above 5%, reaching its highest level since 2007. This combination is particularly sensitive for high-multiple companies, as a higher risk-free rate reduces the present value of future cash flows.
Today, the market is almost fully pricing in a 25-basis-point Fed rate hike. As a result, the decision itself is partly reflected in prices, while the main source of volatility is likely to be the subsequent signal on the future path of rates. During the Asian session, global equities made a cautious recovery attempt amid some easing in oil prices and stabilisation in bonds, but overall risk appetite remains limited. Weakness in the technology sector has added further pressure in recent days. Therefore, ahead of the Fed meeting, the fundamental environment for the US 500 remains predominantly defensive.
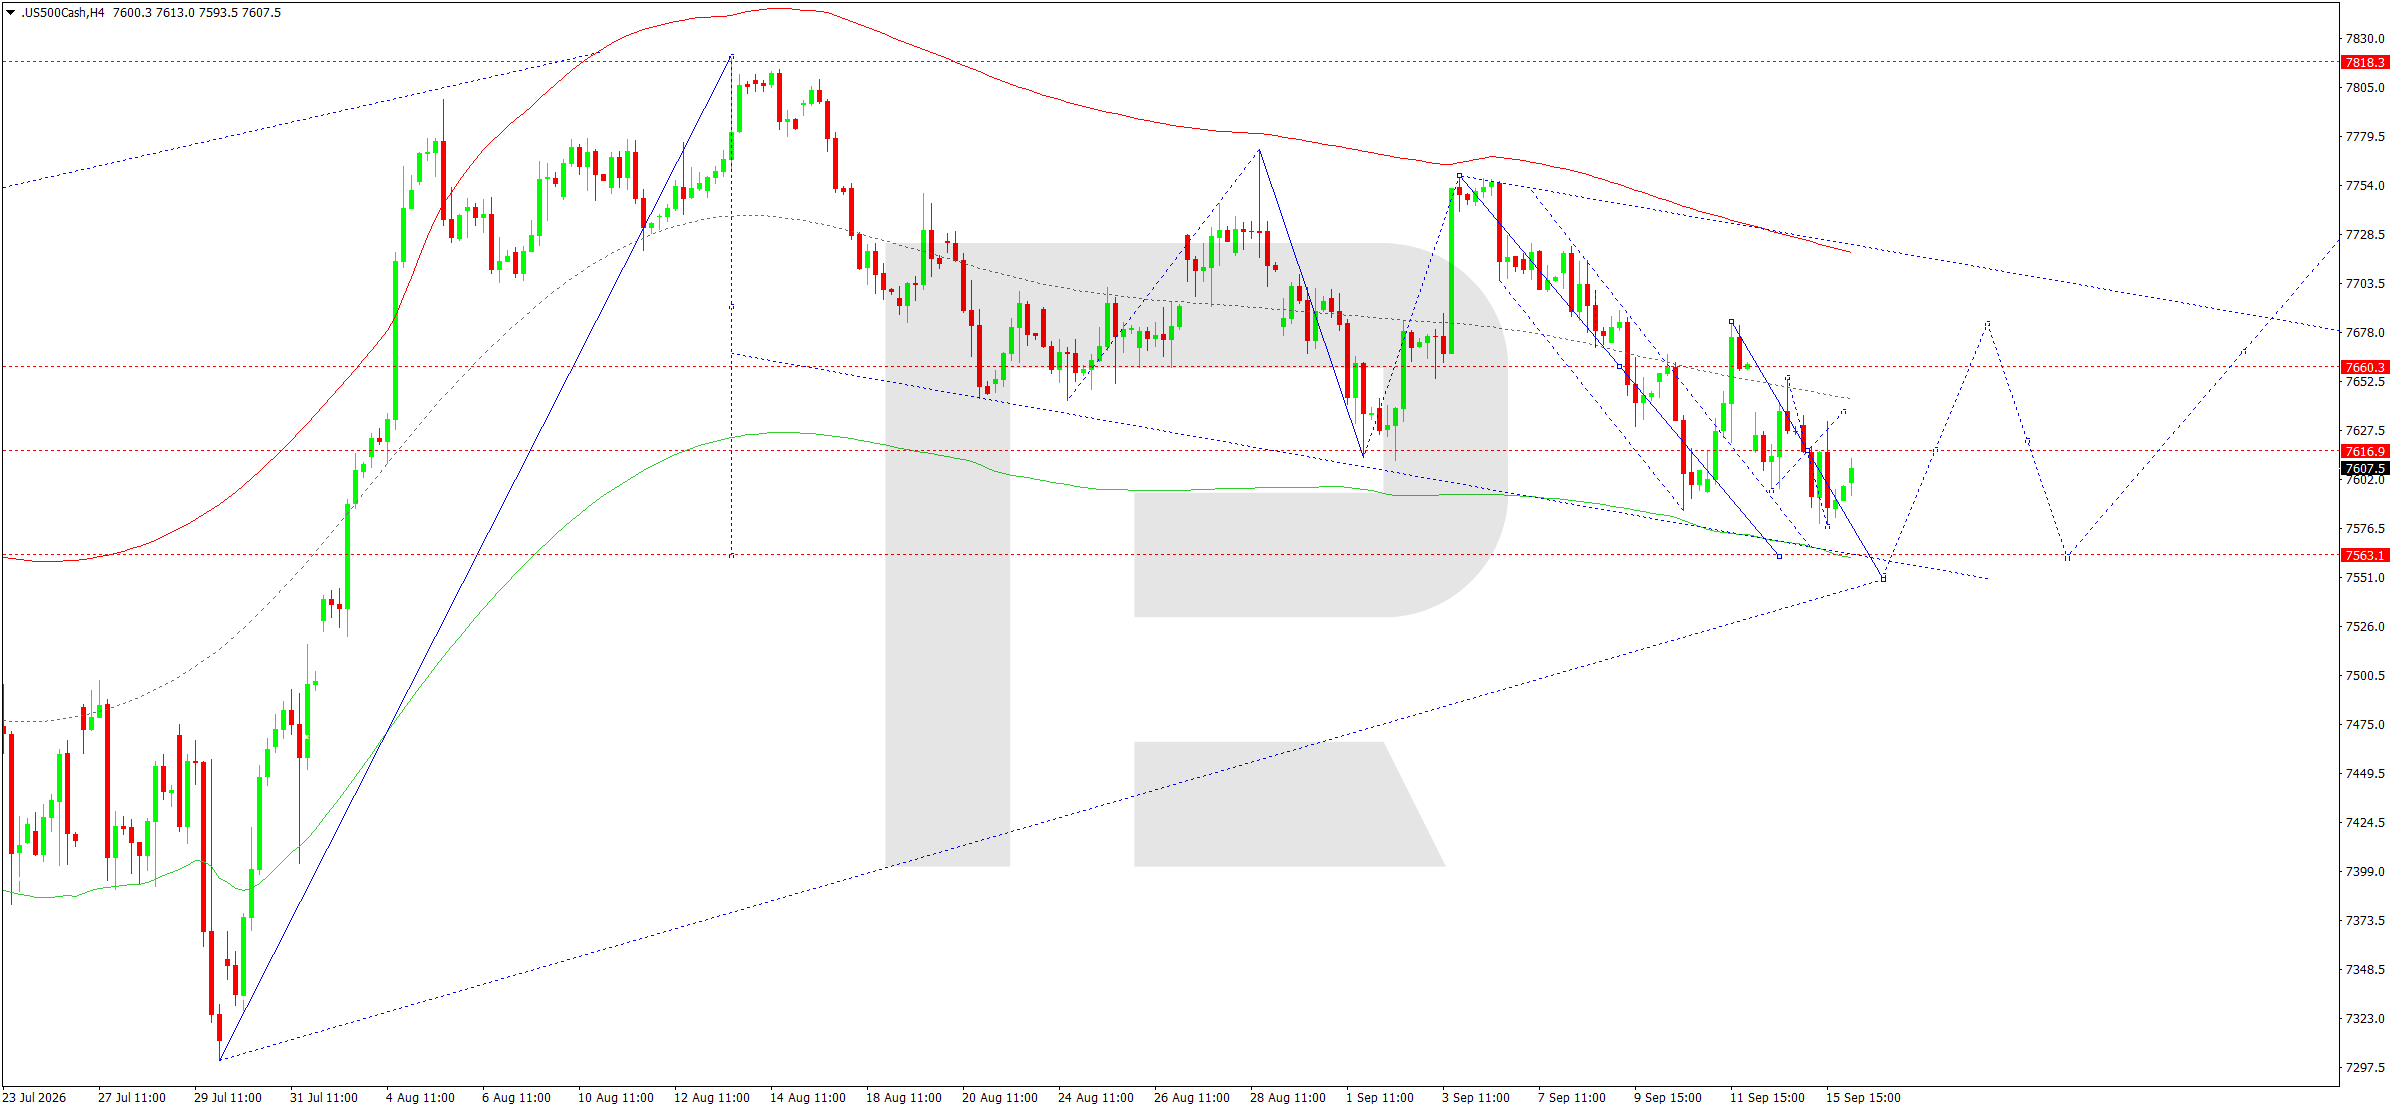
On the H4 chart, the US 500 completed a local upward wave towards 7,652 and then declined towards 7,598. Today, a consolidation range is expected to develop around 7,616. The current structure remains within a descending channel formed after the September high. A downside breakout from the consolidation would put 7,561 in focus as the main target.
The Elliott wave structure and the downward wave matrix, with a pivot point around 7,660, confirm the bearish scenario. The price remains below the central area of the Price Envelope at 7,660–7,666 and has yet to show a sustained recovery above it. Local rises towards 7,616–7,652 are viewed as corrective moves. A breakout below 7,561 could extend the impulse towards the lower boundary of the current channel. The alternative scenario would require a return above 7,660 followed by consolidation above 7,678, creating conditions for a deeper upward correction. Until then, the main direction remains downward.
US 500 forecast scenario
Trading scenario: SELL
- Price at the time of writing: 7,604
- Entry price: 7,599
- Stop loss: 7,620
- Take profit: 7,561
- Risk-to-reward ratio: 1:1.8
The trade idea is valid until 8:00 AM on 17 September 2026 (server time, UTC+3).
BTCUSD forecast
As of the morning of 16 September, the fundamental backdrop for BTCUSD remains unfavourable for short-term demand for risk assets. The Federal Reserve concludes its meeting today, and the market is pricing in a 25-basis-point rate hike with a high probability. At the same time, US government bond yields are near multi-year highs and the dollar has strengthened. For Bitcoin, this combination traditionally increases the cost of capital and reduces the appeal of speculative assets that do not provide fixed income. BTC fell by around 4–5% the previous day and returned to the 75,000–76,000 area.
Another source of pressure is the regulatory situation surrounding cryptocurrencies in the US: the Senate failed to advance procedural consideration of a major digital asset regulation bill. Against this backdrop, Bitcoin and shares of several cryptocurrency companies declined. Over a broader horizon, institutional interest has not disappeared entirely: inflows into Bitcoin exchange-traded products have recovered in recent weeks. However, in the short term, the combination of high bond yields, expectations of Fed tightening and elevated market volatility remains the more important factor.
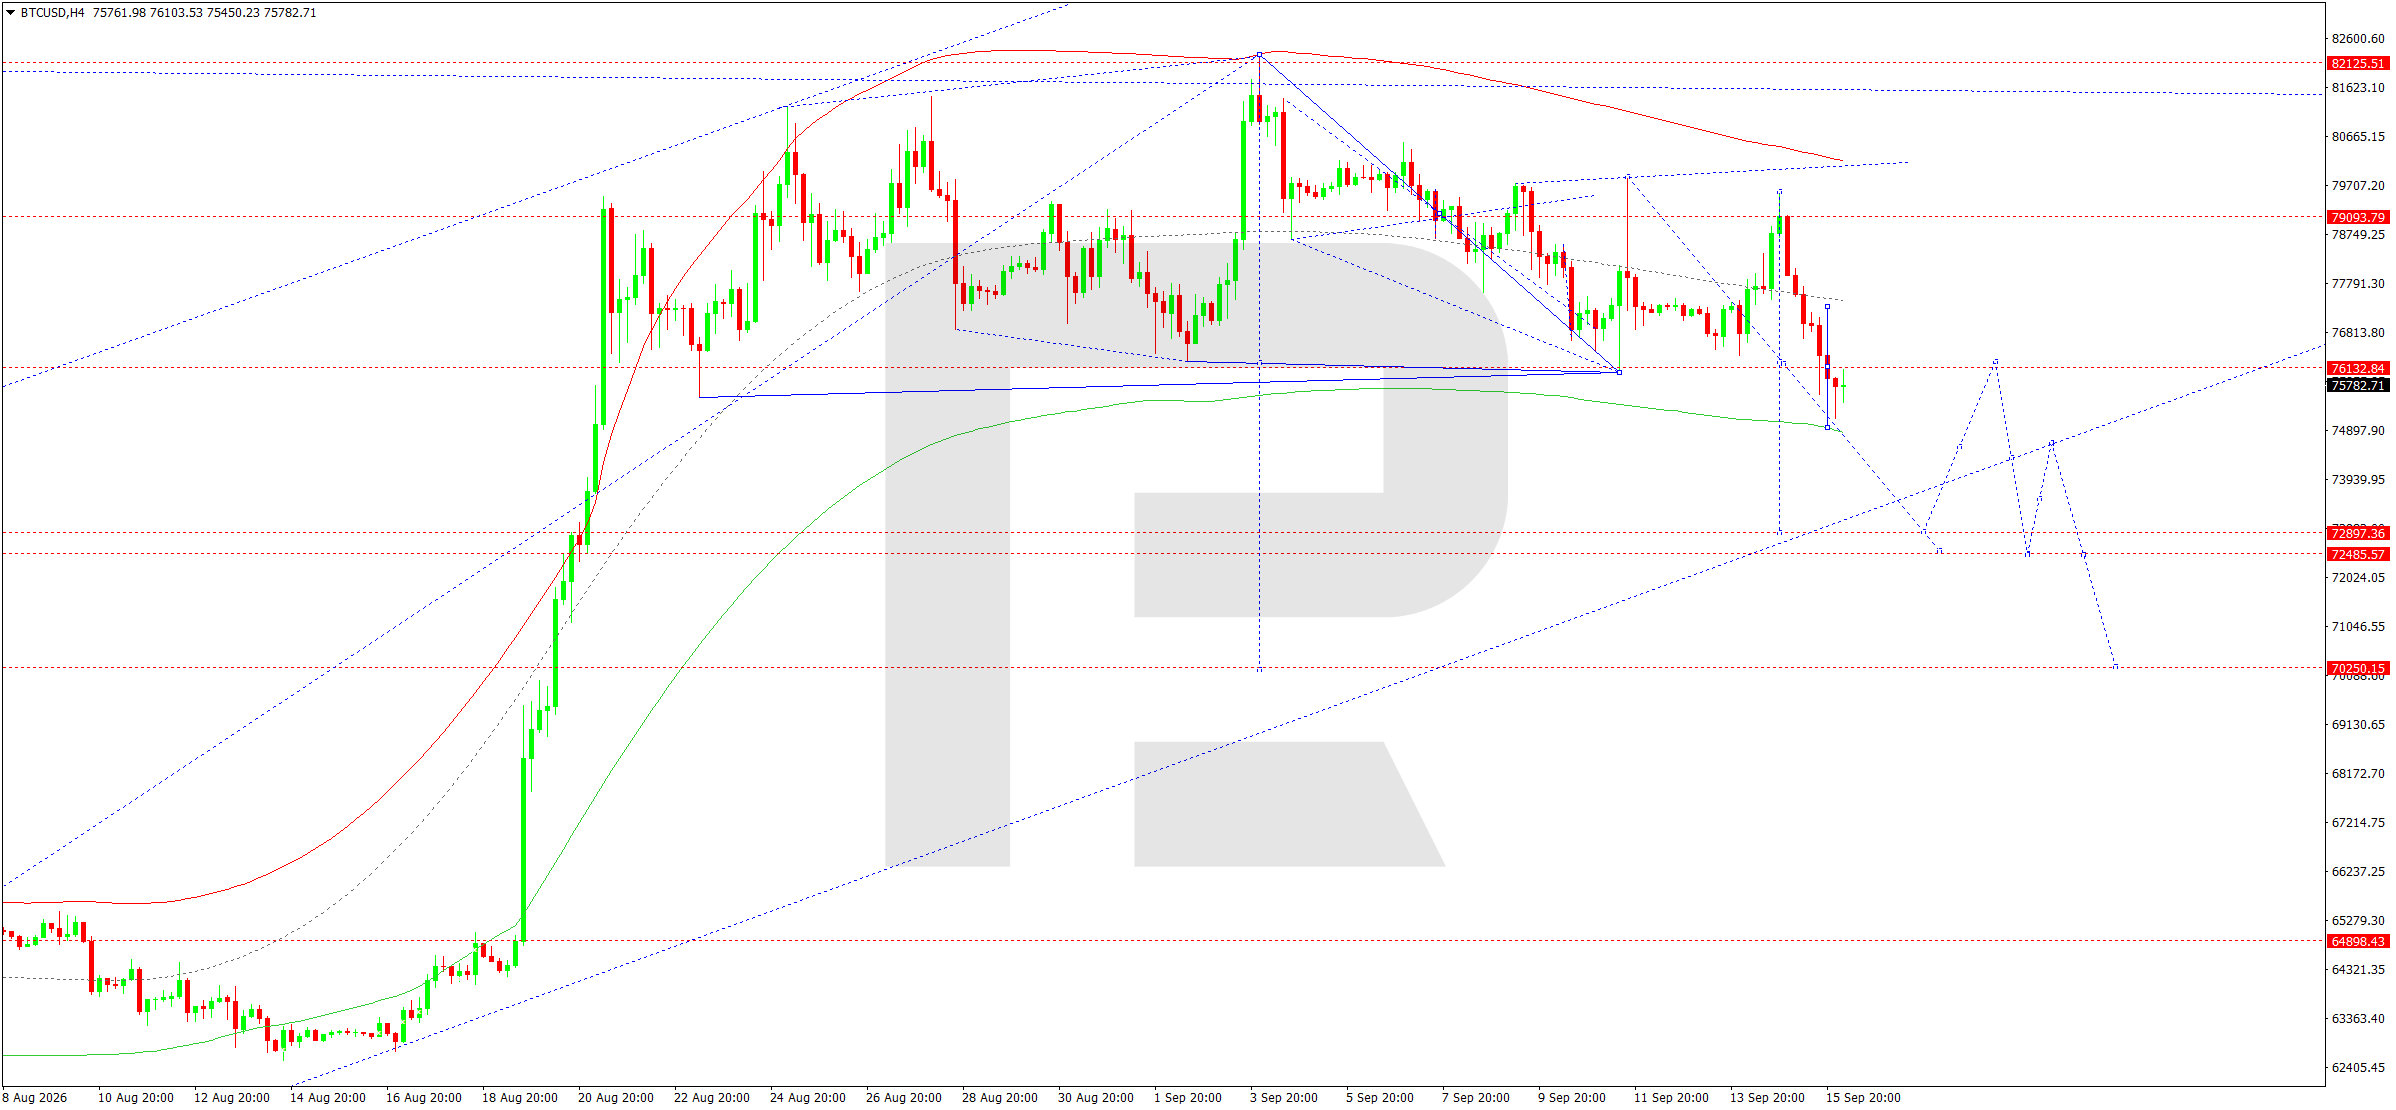
On the H4 chart, BTCUSD completed a corrective structure towards 74,960 and then recovered to 76,135. This rise does not yet change the broader bearish structure. Today, another downward impulse is expected to develop, with the first target around 72,890. The next target remains 72,485. If selling pressure intensifies, the next significant target is the 70,250 area.
The Elliott wave structure and the downward wave matrix, with a pivot point at 76,132, confirm the bearish bias. The market previously completed a corrective move towards the upper boundary of the Price Envelope around 79,090 but failed to consolidate in this area. It then quickly returned below the central part of the structure. The 76,132 level now acts as a key resistance area and a potential pivot point. While BTCUSD remains below it, the main scenario is a continued move towards the lower boundary of the Envelope at 72,890. Corrective rebounds may remain large, but only a decisive return above 79,090 would change the current H4 structure and postpone the lower targets.
BTCUSD forecast scenario
Trading scenario: SELL
- Price at the time of writing: 75,829
- Entry price: 75,824
- Stop loss: 76,450
- Take profit: 72,890
- Risk-to-reward ratio: 1:4.7
The trade idea is valid until 8:00 AM on 17 September 2026 (server time, UTC+3).
Editors’ picks
 EURUSD forecast 2026–2027: technical analysis, price levels & predictions
EURUSD has recovered from the July lows and is trading near 1.1545 — back in bullish territory. The pair has reclaimed EMA65 on the daily, formed a bullish EMA crossover on H4, and the US-eurozone GDP gap has narrowed sharply (US 1.5% vs eurozone 1.0%). Goldman Sachs and Deutsche Bank both now target 1.2500 by year-end. A confirmed close above 1.1700 opens the path to 1.1805. We break down the key levels, three trading scenarios, and what the unprecedented 9-3 FOMC dissent vote means for EURUSD.
 Gold (XAUUSD) forecast 2026: technical analysis, price levels & predictions
Gold has reversed its downtrend and is trading near 4,360 USD, back above both EMA65 and EMA200. ETF flows turned positive in July with 3 billion USD of net inflows, and central banks bought 288.9 tonnes in Q2 — up 62% year-on-year. A breakout above 4,500 USD opens the path to 4,855 USD and the 5,597 USD all-time high. We break down the key levels, three trading scenarios with entry triggers, and what J.P. Morgan, Deutsche Bank and Goldman Sachs are forecasting for gold in 2026.
Forecasts presented in this section only reflect the author’s private opinion and should not be considered as guidance for trading. RoboForex bears no responsibility for trading results based on trading recommendations described in these analytical reviews.