
Daily technical analysis and forecast for 17 September 2026
Daily technical analysis and forecast for EURUSD, USDJPY, GBPUSD, AUDUSD, USDCAD, XAUUSD, US 500, and BTCUSD for 17 September 2026.
Each scenario on this page reflects the market structure on the H4 chart as of 10:00 UTC+3 on 17 September 2026. The assessment considers the current H4 chart structure, key support and resistance levels, the direction of the medium-term movement, and the prevailing fundamental backdrop.
EURUSD forecast
As of the morning of 17 September, the main driver for EURUSD remains the sharp shift in US interest-rate expectations. The Federal Reserve raised the target rate range by 25 basis points to 3.75–4.00% on 16 September, while the median projection from committee members points to one more increase before the end of 2026. At the same time, the two-year US Treasury yield rose towards its highest level since mid-2024, while the US Dollar Index reached a seven-week high. For the euro, this creates direct pressure through a wider short-term yield differential in favour of the dollar. Strong US retail sales for August and faster import-price growth are providing additional support for tighter policy by keeping inflation risks elevated.
The European Central Bank also raised the deposit rate to 2.50% a week earlier in response to an energy-driven inflation impulse, but the ECB's caution and weaker eurozone growth prospects are limiting support for the single currency. Higher oil and gas prices remain a two-sided factor: they support expectations of higher interest rates, but at the same time worsen Europe's trade balance and consumption outlook. Therefore, the fundamental backdrop at the start of the European session remains moderately negative for EURUSD. Global risk appetite is also important: US equity indices fell after the Fed decision, while short-term yields rose. This combination usually supports demand for the dollar as a higher-yielding and more liquid currency. Expectations of further ECB tightening remain a potential stabilising factor for the euro, but a sustained reversal in the pair would require either weaker economic data or softer Fed rhetoric.
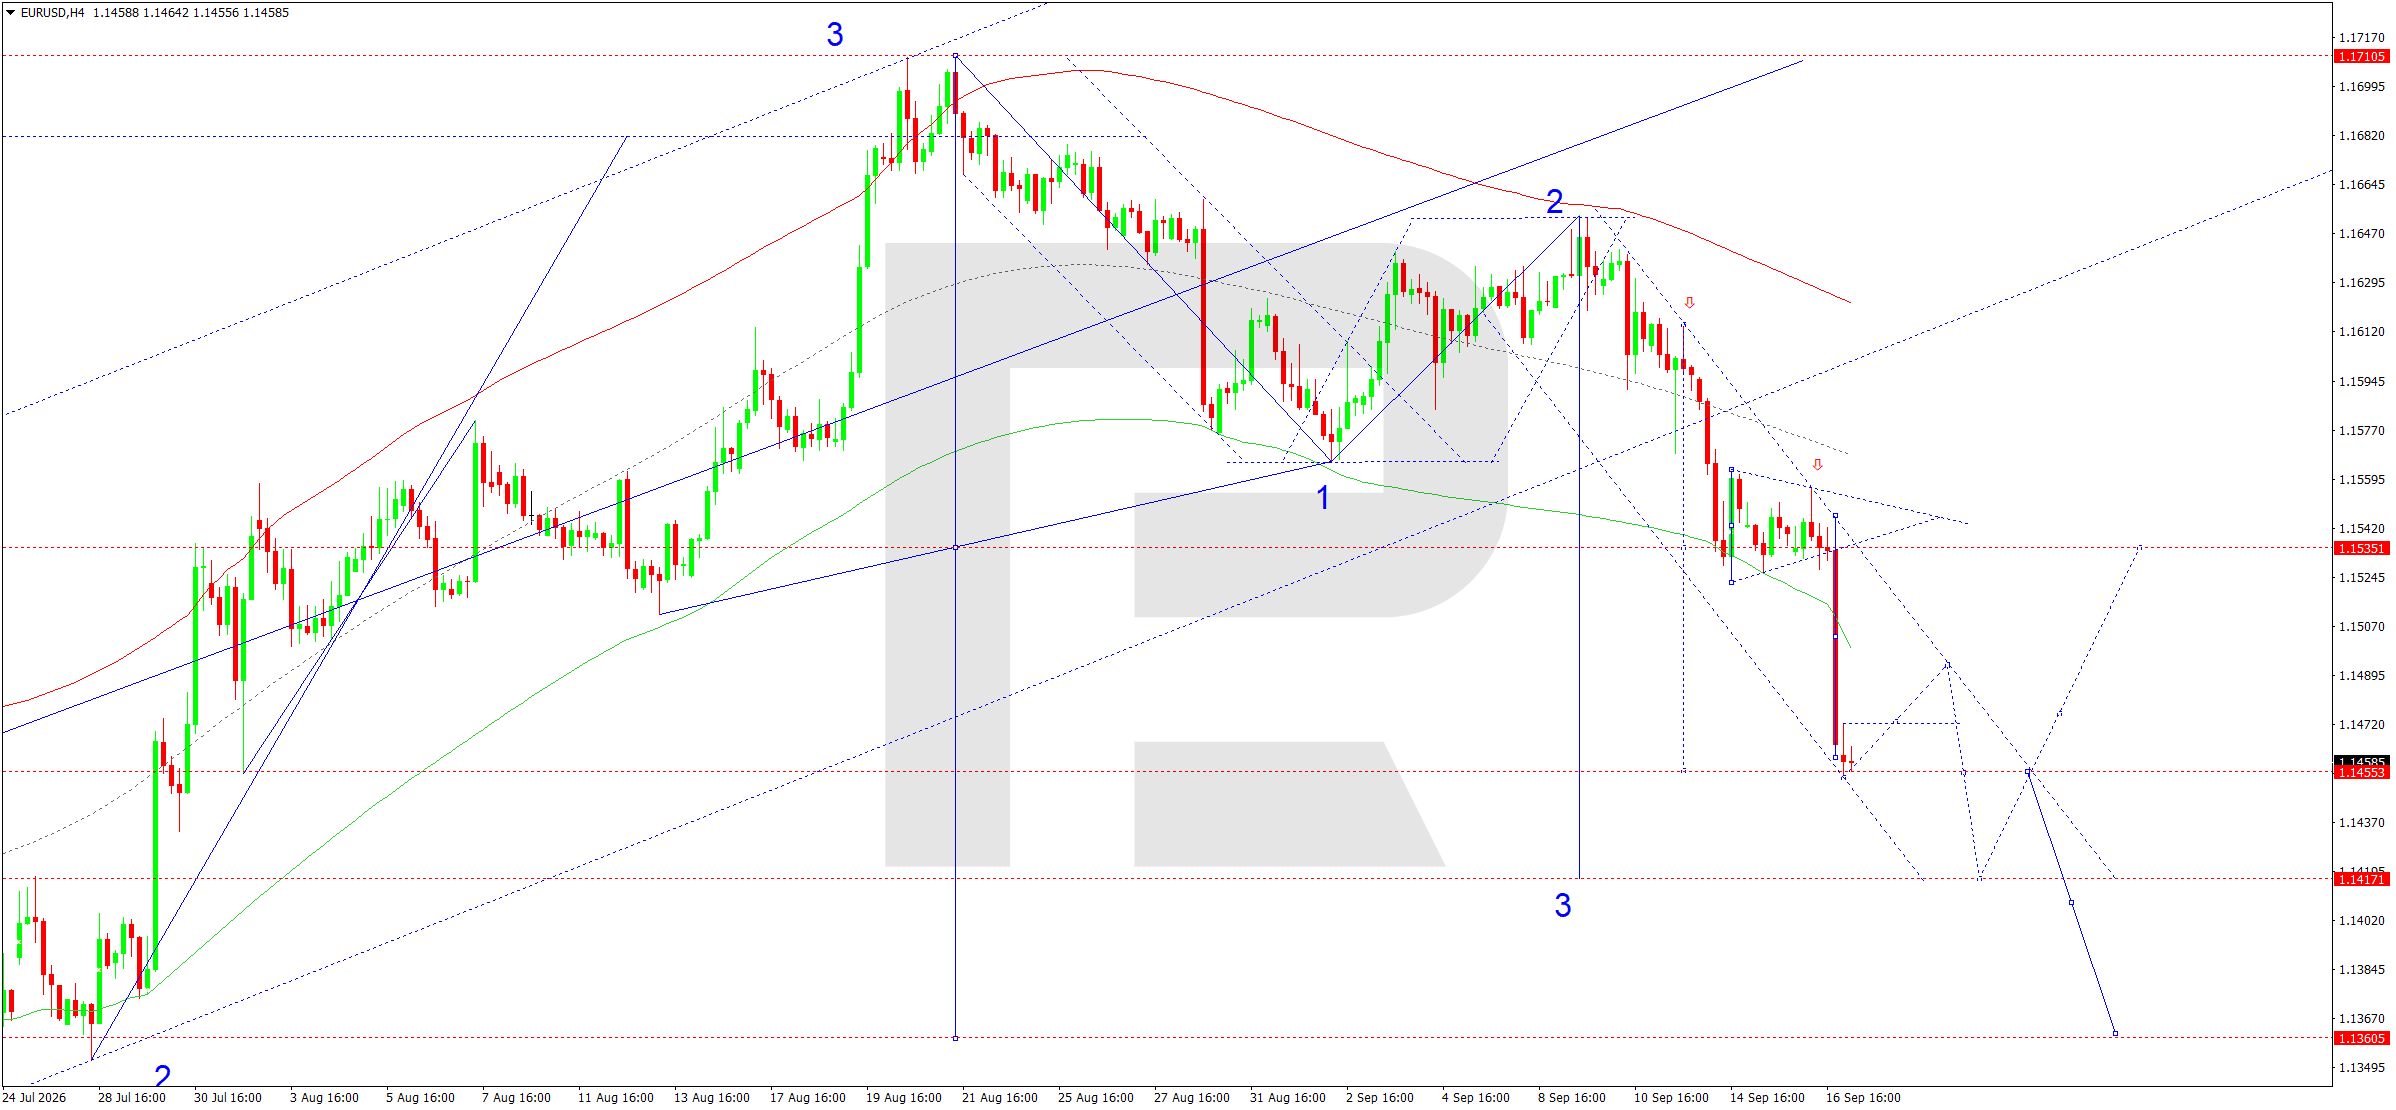
On the H4 chart, EURUSD completed a downward wave towards 1.1453, confirming the development of the third wave in the bearish structure. Today, 17 September 2026, after the strong downside impulse, a narrow consolidation range above the reached target appears likely. An upside breakout could trigger a correction towards 1.1495, while continued selling pressure would put 1.1417 in focus as the next target.
The Elliott wave structure and the wave matrix, with a pivot point at 1.1534, confirm the main scenario. This level remains the key resistance within the current structure. The market has reached the lower boundary of the Price Envelope at 1.1453, so a local rebound towards the central line at 1.1495–1.1530 would not contradict the broader downtrend. While the price remains below 1.1534, any corrective rise is viewed as preparation for the next move lower. A return below 1.1453 would increase the probability of the third wave extending towards 1.1417 and then create conditions for a deeper decline. For the coming day, the preference remains for selling once the corrective pullback is complete. The 1.1495–1.1534 area remains a supply zone. While the price stays below it, any rise should be viewed as a correction within the bearish wave.
EURUSD forecast scenario
Trading scenario: SELL
- Price at the time of writing: 1.1464
- Entry price: 1.1459
- Stop loss: 1.1496
- Take profit: 1.1417
- Risk-to-reward ratio: 1:1.1
The trade idea is valid until 8:00 AM on 18 September 2026 (server time, UTC+3).
USDJPY forecast
As of the morning of 17 September, the key factor for USDJPY remains the divergence in expectations surrounding the Federal Reserve and the Bank of Japan. The Fed raised the target rate range by 25 basis points to 3.75–4.00% the previous day and indicated that another increase remains possible before the end of the year. This supported the dollar and lifted the two-year US Treasury yield, keeping the interest-rate differential in favour of the US currency.
At the same time, the BoJ began its two-day meeting on 17–18 September. The market expects Japan's policy rate to rise from 1.00% to 1.25%, which would be its highest level in around three decades. However, for the yen, not only the rate move itself but also Governor Kazuo Ueda's comments on the future pace of tightening will matter. Following the yen's appreciation at the beginning of the month, part of these expectations is already priced in, so cautious BoJ rhetoric could trigger profit-taking on long yen positions. Japanese authorities have also reiterated their readiness to counter excessive currency-market moves. For the coming session, the fundamental balance remains mixed: a strong dollar is supporting USDJPY, but expectations of a BoJ rate increase are limiting the pair's sustained upside potential. Volatility in the Japanese government bond market is another factor, as rising long-term yields reflect both inflation expectations and concerns about fiscal policy. If the BoJ confirms a gradual pace of further tightening, the US-Japan yield spread will remain wide, which could limit yen appreciation even after a rate increase. By contrast, a more hawkish signal from Ueda would increase the risk of a rapid decline in USDJPY.
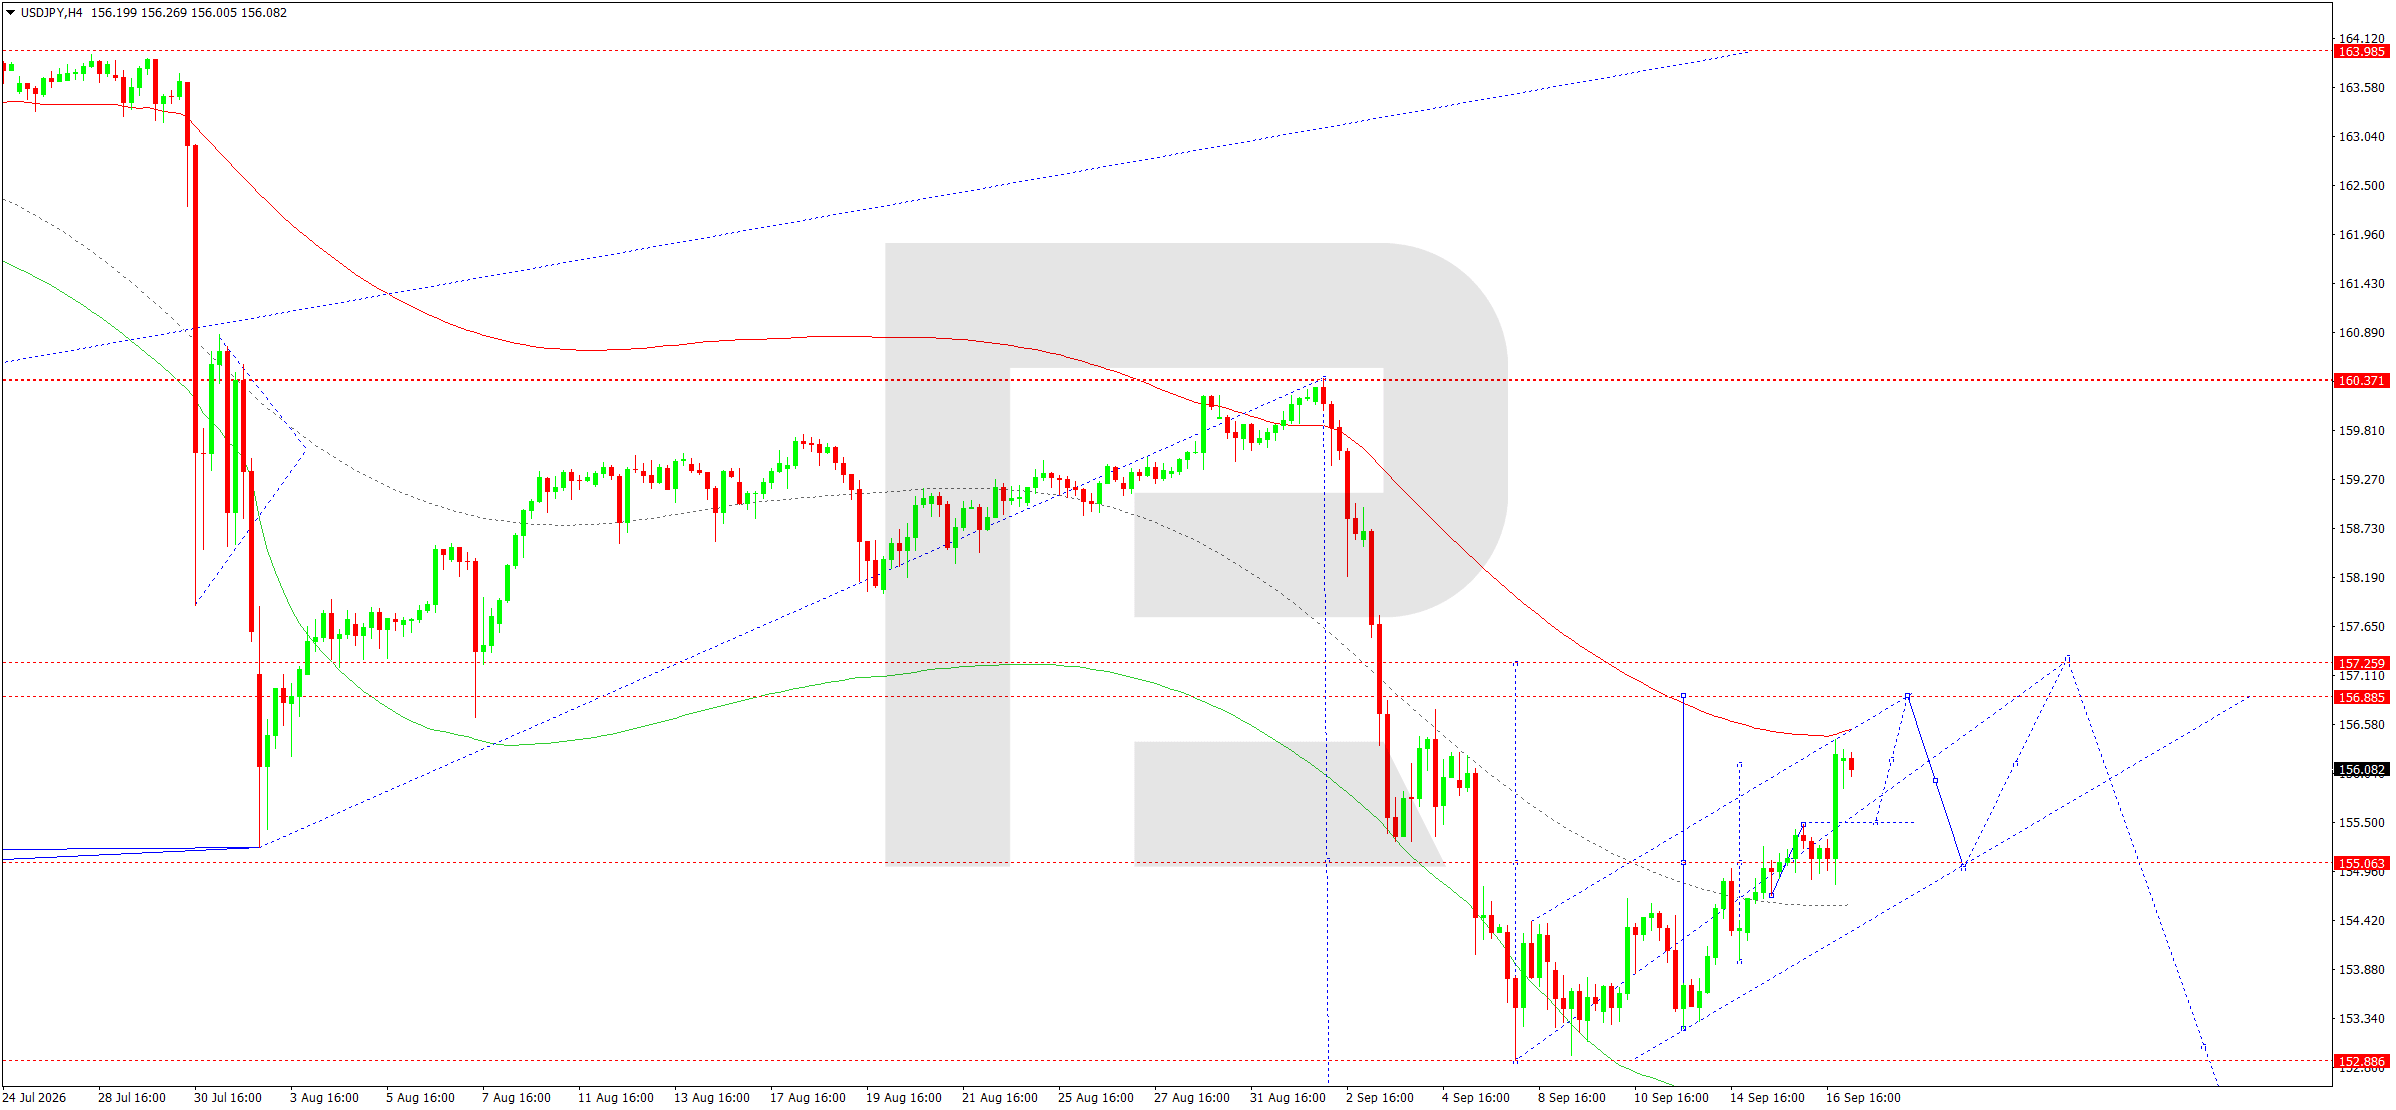
On the H4 chart, USDJPY found support around 154.83 and formed an upward impulse towards 156.36. Today, 17 September 2026, after reaching the local target, a consolidation range is expected to develop below the 156.36 area. During the first half of the day, a correction towards 155.05–155.49 remains the main scenario, after which growth could resume towards 156.88 and then 157.30.
The Elliott wave structure and the upward wave matrix, with a pivot point at 155.05, confirm this scenario. The market has completed an upward leg near the upper part of the local channel and is showing signs of slowing. The central line of the Price Envelope is around 155.06 and acts as the correction target. Holding above 155.05 would support the bullish structure and keep a retest of 156.36 in play, followed by a move towards the upper boundary of the Envelope at 156.85–156.88. A breakout below 155.05 would deepen the pullback and bring the 154.80 area back into focus. For the coming day, SELL is preferred in anticipation of a correction, without changing the medium-term bullish structure. The 156.36–156.88 area remains a supply zone. While the price stays below it, the technical picture allows for a return towards the matrix at 155.05 before the next impulse.
USDJPY forecast scenario
Trading scenario: SELL
- Price at the time of writing: 155.68
- Entry price: 155.63
- Stop loss: 156.15
- Take profit: 155.06
- Risk-to-reward ratio: 1:1.1
The trade idea is valid until 8:00 AM on 18 September 2026 (server time, UTC+3).
GBPUSD forecast
As of the morning of 17 September, the main drivers for GBPUSD are the Federal Reserve decision and expectations surrounding the Bank of England meeting. The Fed raised the target rate range by 25 basis points to 3.75–4.00% the previous day and kept open the possibility of another increase before the end of the year. This strengthened the dollar and pushed short-term US bond yields higher. In the UK, inflation accelerated to 3.1% year-on-year in August, a five-month high, mainly due to energy and fuel prices. At the same time, core inflation held at 2.6% and services inflation at 3.4%, somewhat reducing the urgency of immediate tightening.
The market largely expects the BoE to keep the policy rate unchanged at 3.75% today, but attention will focus on the Monetary Policy Committee vote and comments on the risk of further price increases. High UK government bond yields and limited fiscal space are adding pressure on the pound, while higher oil prices are lifting inflation expectations. As a result, sterling may remain volatile ahead of the BoE decision, and a more hawkish tone from the regulator could support a short-term correction higher. However, the strong dollar following the Fed decision continues to create an unfavourable external backdrop for GBPUSD. The BoE's quantitative tightening programme is another important factor. The regulator may slow the pace of balance-sheet reduction, which could ease some pressure in the gilt market. The pound's reaction will therefore depend on the combination of the rate decision, voting split and balance-sheet policy.
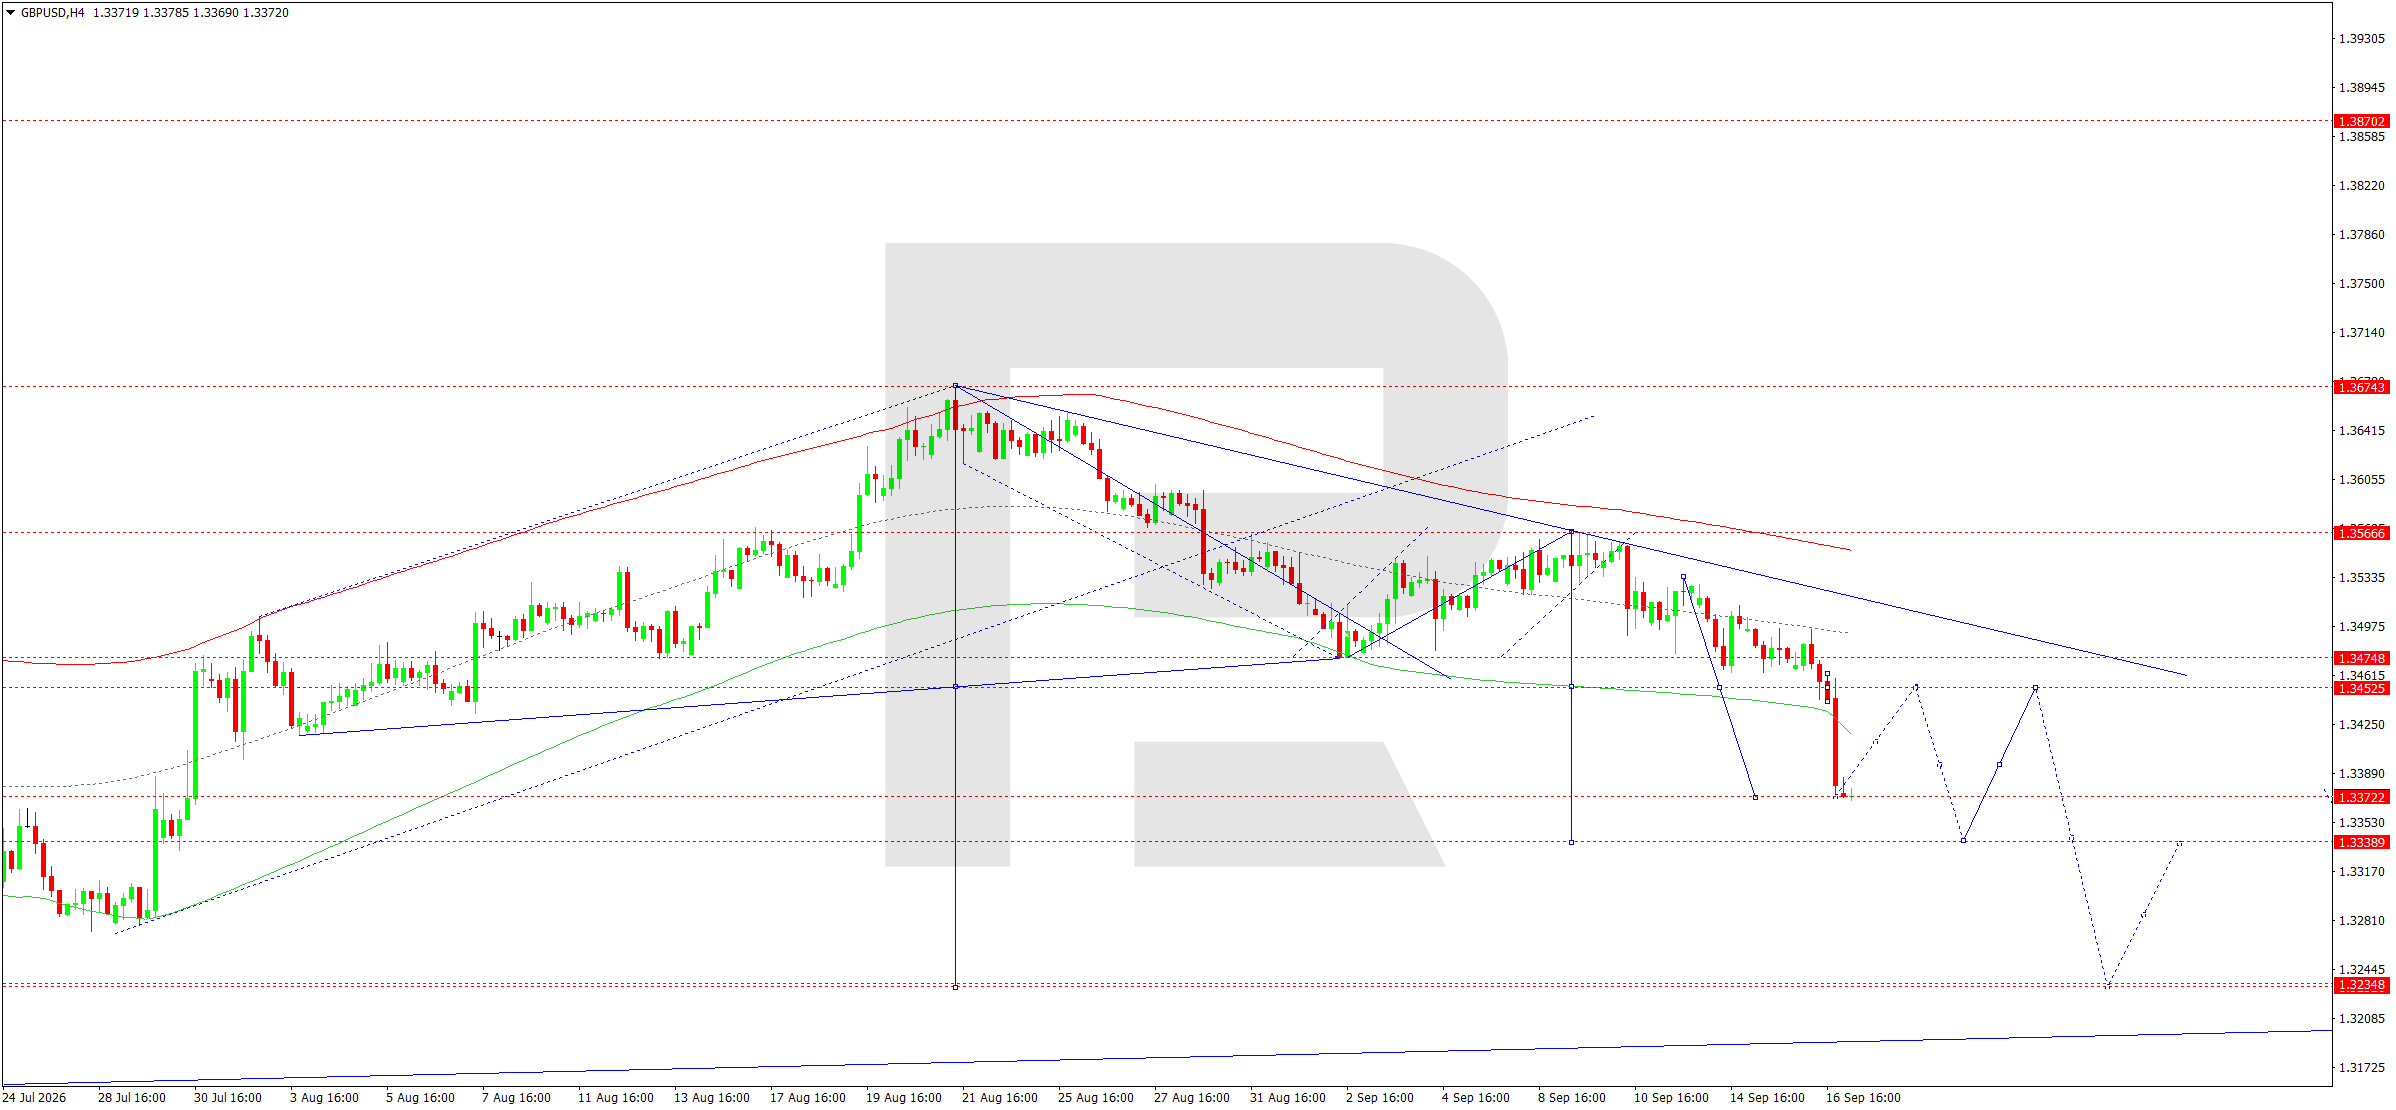
On the H4 chart, GBPUSD completed a downward wave towards 1.3370 and reached the lower part of the current bearish structure. Today, 17 September 2026, an upward corrective leg towards 1.3425 is expected to develop, where an important internal resistance area is located. A consolidation range is effectively forming around this level, and once it is complete, the probability of a renewed decline towards 1.3339 and then the local target at 1.3235 remains in place.
The Elliott wave structure and the downward wave matrix, with a pivot point around 1.3452, confirm the main scenario. The market has reached the lower boundary of the Price Envelope at 1.3370, making a rebound towards its central line at 1.3425 a natural correction after the strong impulse. While the price remains below 1.3452, the broader trend stays bearish and the rise is viewed as a correction within the main wave, with subsequent selling remaining the priority. A return below 1.3370 would confirm a continuation of the wave towards 1.3339. Consolidation above 1.3452 would temporarily ease selling pressure and could extend the correction towards 1.3475. For the coming day, a tactical BUY towards the central line of the Envelope is considered, after which the priority would shift back towards selling if a reversal signal appears. The 1.3425–1.3452 area remains key: failure to consolidate above it would confirm seller dominance and bring 1.3370 back into focus.
GBPUSD forecast scenario
Trading scenario: BUY
- Price at the time of writing: 1.3382
- Entry price: 1.3387
- Stop loss: 1.3364
- Take profit: 1.3425
- Risk-to-reward ratio: 1:1.7
The trade idea is valid until 8:00 AM on 18 September 2026 (server time, UTC+3).
AUDUSD forecast
As of the morning of 17 September, the fundamental backdrop for AUDUSD remains mixed. The Federal Reserve raised the target rate range by 25 basis points to 3.75–4.00% the previous day and left the door open to further tightening before the end of the year. The reaction included higher short-term US bond yields and a stronger dollar, limiting the Australian currency's upside potential. At the same time, the Reserve Bank of Australia is keeping the cash rate at 4.35% after three increases in 2026 and maintains a hawkish stance due to inflation. The latest available data show that inflation in July was 3.5% year-on-year, while the trimmed mean was 3.6%, above the RBA's target range.
The International Monetary Fund also noted today that Australia may need additional rate increases if inflationary pressure persists. The market has raised the probability of an RBA move at the 29 September meeting. At the same time, employment declined by around 15,800 in July, while unemployment remained around 4.5%, pointing to a cooling labour market. Therefore, support for the AUD from RBA expectations is being offset by a stronger US dollar and cautious global risk appetite. Commodity-market dynamics also matter: high energy prices support inflation expectations in Australia, but at the same time worsen the global growth outlook and demand for cyclical currencies. China remains an important factor for the AUD, as any signs of weaker Chinese demand could offset the advantage of higher Australian interest rates. Ahead of the RBA meeting, the market is likely to remain highly sensitive to inflation and external trade signals.
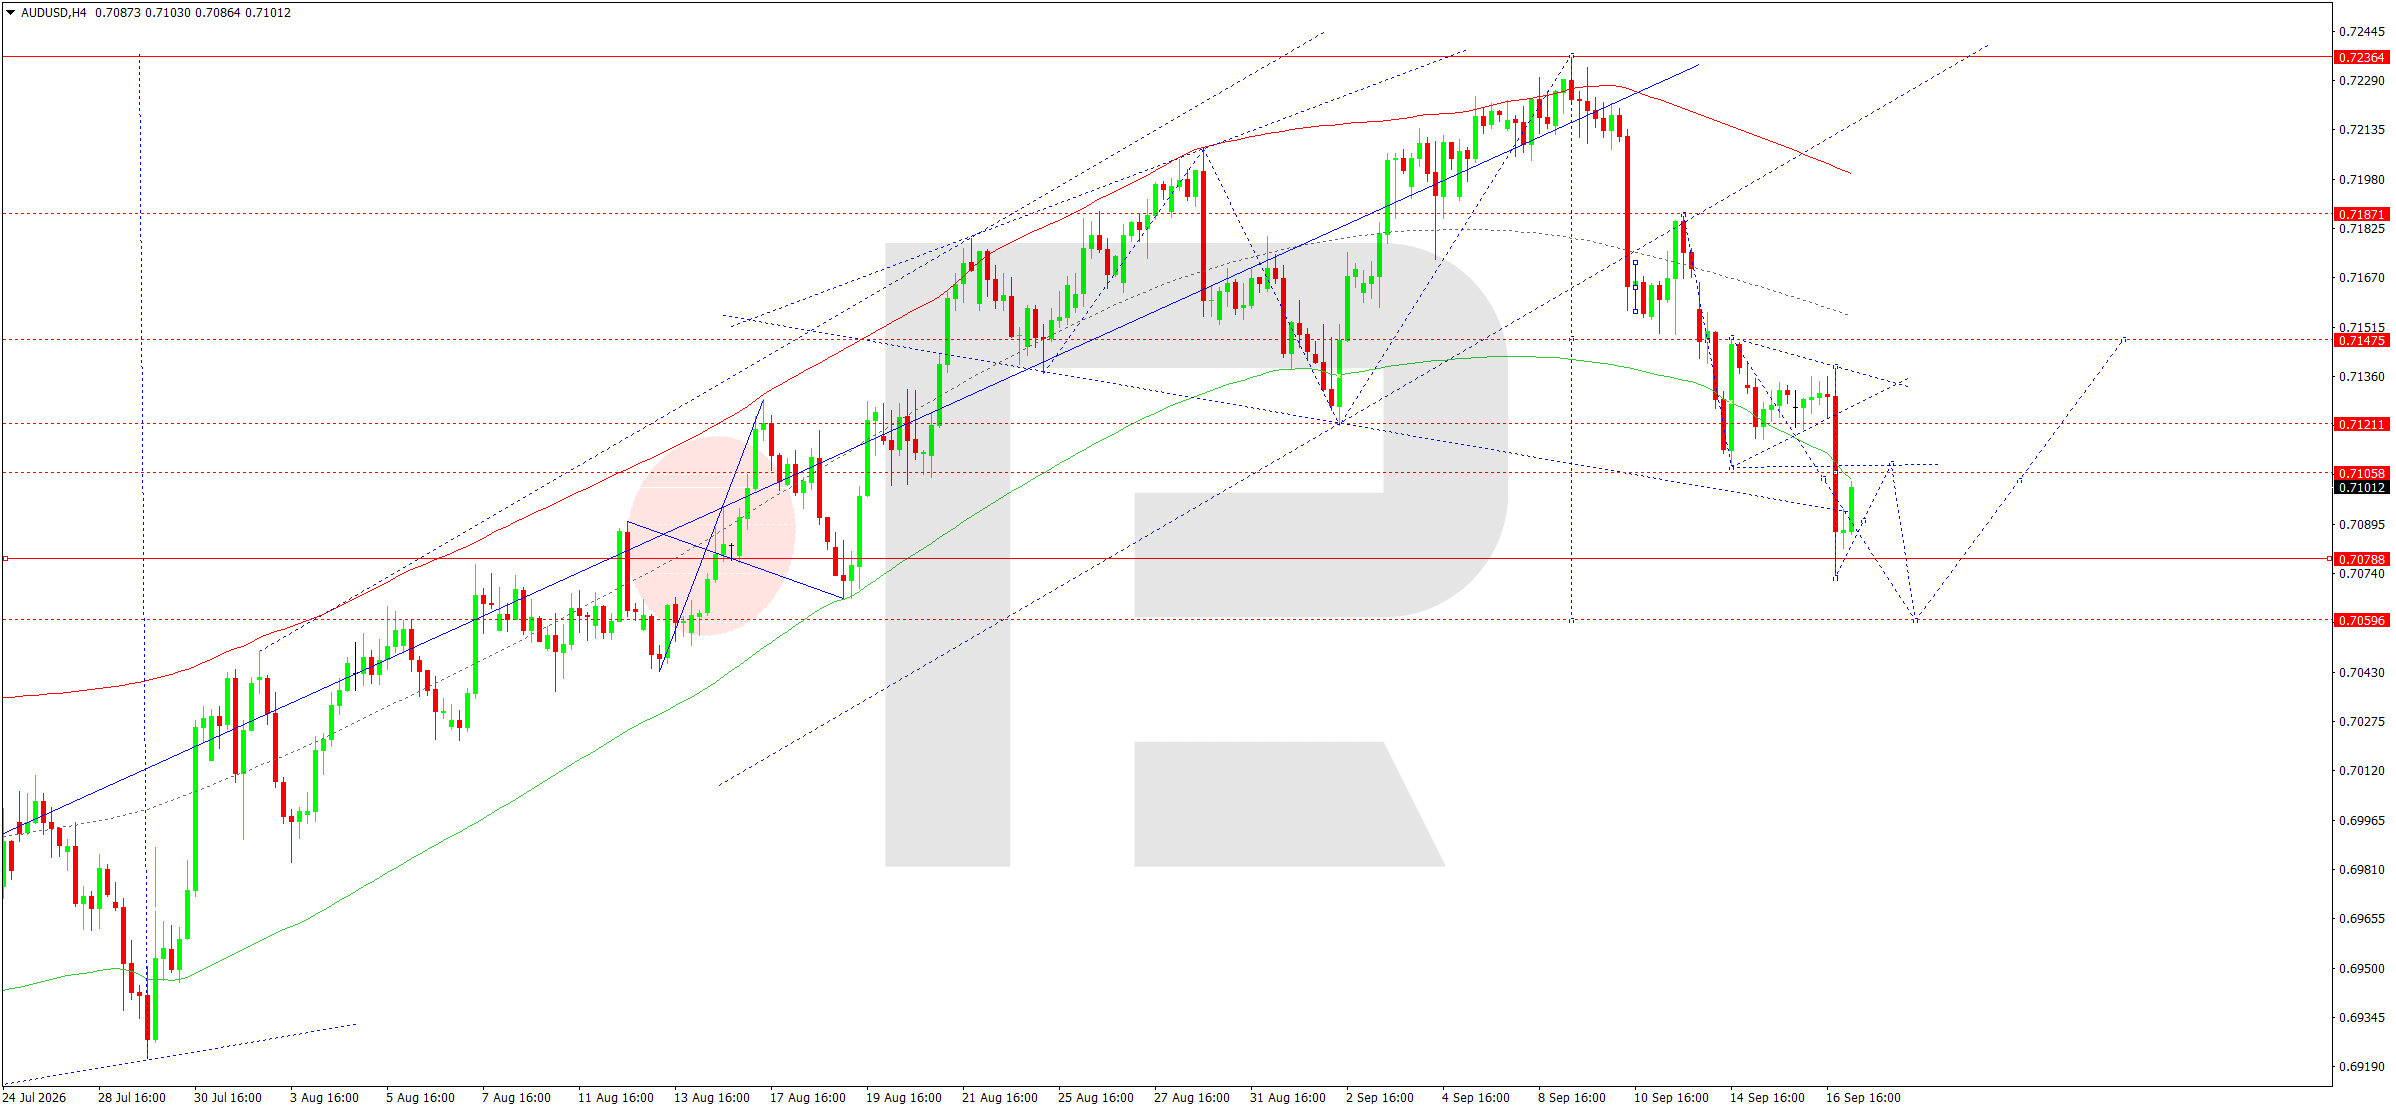
On the H4 chart, AUDUSD completed a downward impulse towards the 0.7073 area and formed a consolidation above the support level. Today, 17 September 2026, an upward leg towards 0.7107 has already formed. In the near-term structure, there is still scope for the correction to continue towards 0.7121, after which the priority would shift back towards a decline to 0.7060.
The Elliott wave structure and the downward wave matrix, with a pivot point at 0.7147, confirm this scenario. The price tested the lower boundary of the Price Envelope around 0.7073 and is returning towards its central line. The 0.7121–0.7147 area is a key resistance zone: while the market remains below it, the corrective rise does not change the broader downtrend. A rejection from 0.7121 would increase the probability of another test of 0.7073, while a breakout below this support would open the way towards 0.7060 and then 0.7059. Consolidation above 0.7147 would temporarily invalidate the bearish scenario and allow for a move towards 0.7187. For today, the main scenario remains SELL for a continuation of the broader downward wave after the local correction is complete. If the price fails to consolidate above 0.7121, buyer weakness will persist. Only a sustained breakout above 0.7147 would require a reassessment of the downside scenario.
AUDUSD forecast scenario
Trading scenario: SELL
- Price at the time of writing: 0.7113
- Entry price: 0.7108
- Stop loss: 0.7130
- Take profit: 0.7060
- Risk-to-reward ratio: 1:2.2
The trade idea is valid until 8:00 AM on 18 September 2026 (server time, UTC+3).
USDCAD forecast
As of the morning of 17 September, the US dollar continues to have the advantage against the Canadian dollar. The Federal Reserve raised the target rate range by 25 basis points to 3.75–4.00% on 16 September and left open the possibility of another increase before the end of the year. The decision supported short-term Treasury yields and lifted the dollar to seven-week highs. The Bank of Canada kept its key rate unchanged at 2.25% at its 2 September meeting but indicated that rate increases might be needed if inflationary pressure remained persistent. Minutes released on 16 September confirmed concerns that high energy prices could have a more prolonged impact. Canada's inflation held at 3.0% year-on-year in August, while the main core inflation measures remained near 2%, so the urgency for BoC tightening is still lower than for the Fed.
Oil is another factor for the Canadian dollar: high prices support Canada's export revenues, but the oil market has moved into a correction after the recent surge. Against this backdrop, the interest-rate differential and the resilience of US economic data continue to favour the USD. Fundamentally, this supports an elevated USDCAD level, although after the pair's strong rise a technical correction appears likely. Canada-US trade relations add uncertainty, as tariffs increase business costs and constrain growth. For the BoC, this creates a difficult combination: weak demand reduces the need for tight policy, while expensive energy keeps inflation risks elevated. While core inflation remains contained, higher US interest rates are limiting CAD appreciation.
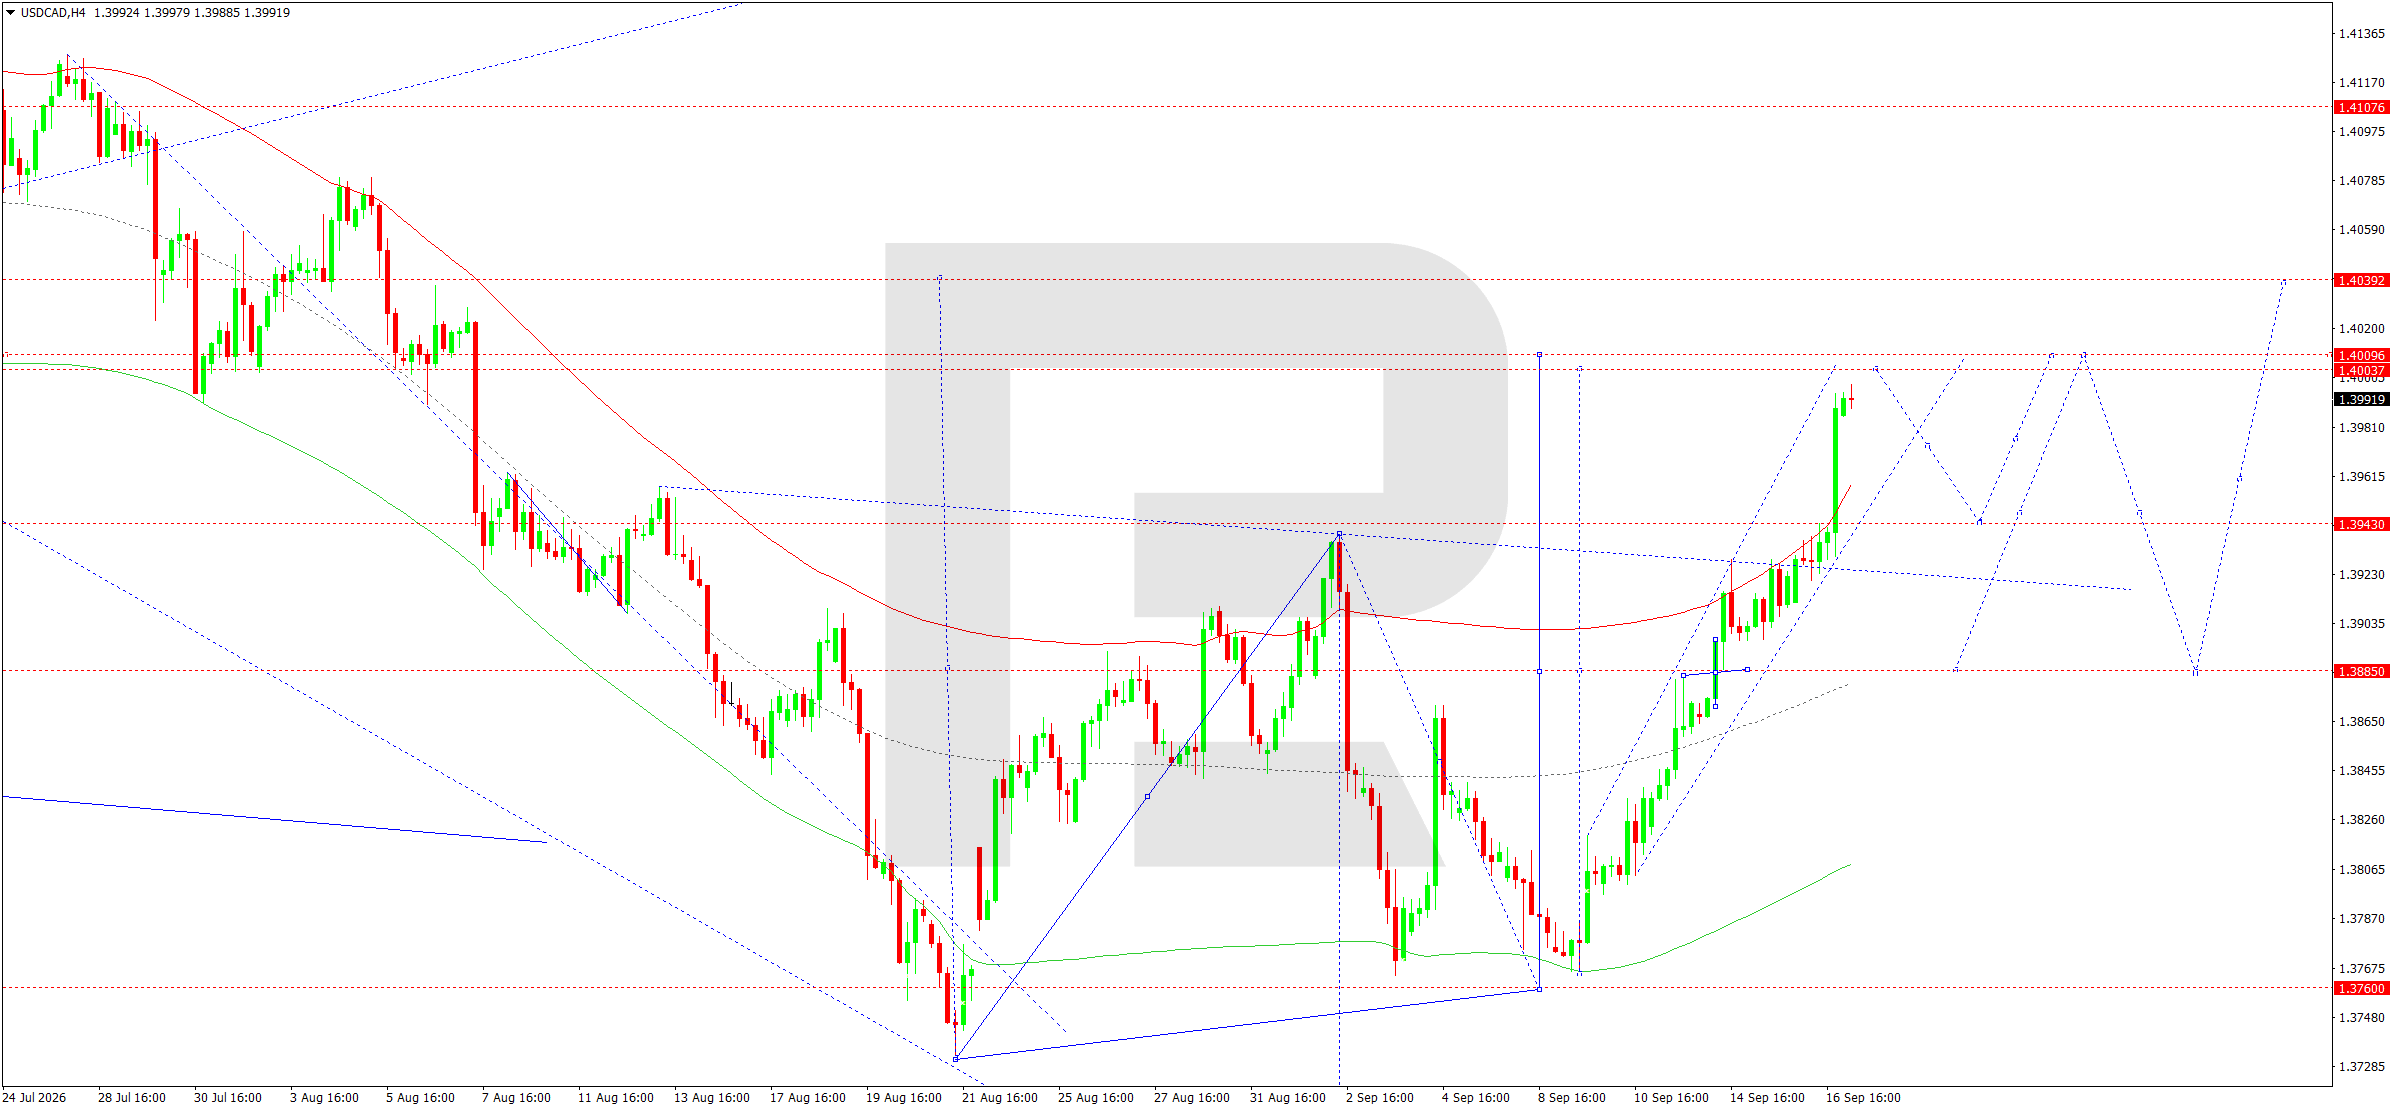
On the H4 chart, USDCAD completed an upward wave towards 1.3994 and reached the upper boundary of the current structure. Today, 17 September 2026, a compact consolidation range is expected to form below the 1.3994–1.4000 area. An upside breakout could allow for a brief test of 1.4000–1.4009, but the main scenario remains a correction towards 1.3943.
The Elliott wave structure and the upward wave matrix, with a pivot point around 1.3885, confirm this scenario. The price has reached the upper boundary of the Price Envelope, increasing the likelihood of profit-taking after the extended impulse. The 1.3943 level is the first downside target and the nearest area where buyers may attempt to regain control. If the decline extends, the next target will be 1.3885, which coincides with the centre of the matrix and a key support area. Holding above 1.3885 would keep the medium-term uptrend intact.
Consolidation above 1.4009, by contrast, would invalidate the corrective scenario and open the way towards 1.4039. For today, the preference is SELL as a correction within the broader uptrend. The 1.3994–1.4009 area remains a supply zone where a local top may form. A return below 1.3970 would be the first confirmation that the pullback is developing. For the uptrend to resume, buyers would need sustained consolidation above 1.4009; without it, the risk of a decline towards 1.3943 remains elevated.
USDCAD forecast scenario
Trading scenario: SELL
- Price at the time of writing: 1.3992
- Entry price: 1.3987
- Stop loss: 1.4010
- Take profit: 1.3943
- Risk-to-reward ratio: 1:1.9
The trade idea is valid until 8:00 AM on 18 September 2026 (server time, UTC+3).
XAUUSD forecast
As of the morning of 17 September, the key factor for XAUUSD remains the market reaction to the Federal Reserve decision. The Fed raised the target rate range by 25 basis points to 3.75–4.00% the previous day and left the door open to another increase before the end of the year. In principle, this is negative for gold, as high interest rates and a stronger dollar increase the opportunity cost of holding the metal. Following the decision, the two-year US Treasury yield rose and the US Dollar Index reached a seven-week high. However, gold recovered by around 0.8% this morning after falling to a six-week low, indicating continued demand for safe-haven assets.
The metal is being supported by geopolitical risks in the Middle East, high energy prices and concerns about the resilience of the global economy amid a new tightening cycle. At the same time, lower oil prices following the recent surge are reducing the inflation premium in gold. As a result, the fundamental picture remains mixed: a hawkish Fed is limiting upside potential, while geopolitics and hedging demand are supporting buyers. For the coming session, this increases the likelihood of volatile consolidation with rebounds while downward pressure remains in place. New Fed projections point to higher inflation and another rate increase in 2026. This adds pressure through yields, but also supports demand for protection against inflationary and political risks. Therefore, rising yields could limit the recovery, while geopolitical news is likely to continue supporting safe-haven demand.
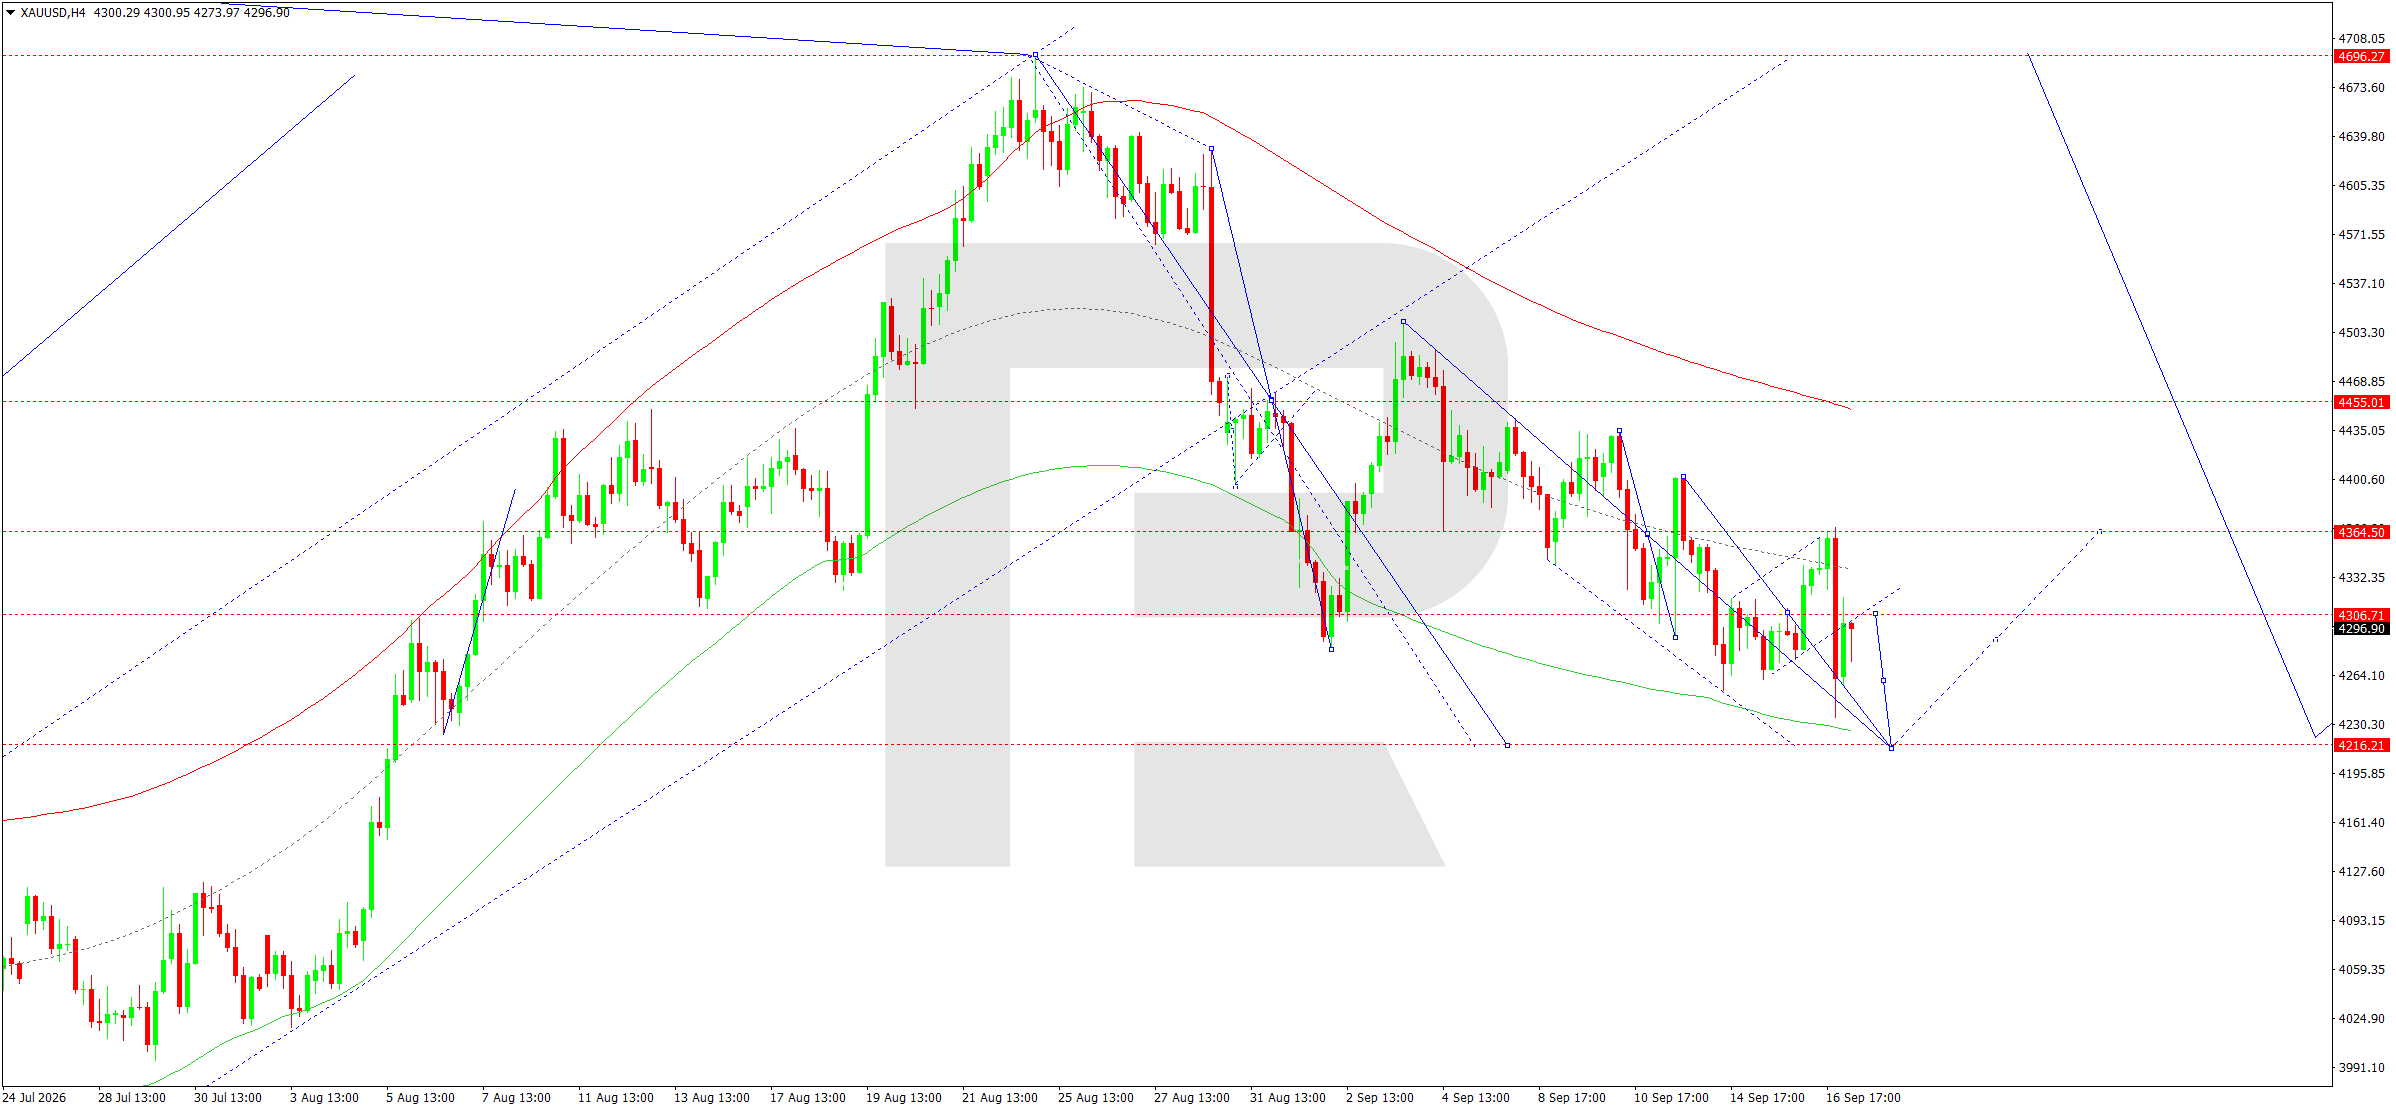
On the H4 chart, XAUUSD continues to form a range around 4,364. Today, 17 September 2026, after declining towards 4,235, the market recovered to 4,318. In the near-term structure, consolidation below this area is likely, with scope for the correction to extend towards 4,364. Once the recovery is complete, the main downside target remains 4,216, which is the target of the current bearish wave.
The Elliott wave structure and the downward wave matrix, with a pivot point around 4,364, confirm the scenario. The price has tested the lower part of the Price Envelope and is attempting to return to its central area. While the price remains below 4,364, the downtrend is intact. Consolidation above 4,364 could extend the correction towards the upper boundary of the Envelope in the 4,455–4,464 area, but this remains the alternative scenario for now.
A return below 4,300 would increase selling pressure and raise the probability of another test of 4,235, followed by 4,216. Tactically, a BUY is considered for the coming day in anticipation of a corrective move towards the centre of the matrix, without changing the broader bearish trend. The 4,318–4,364 area remains the zone where buyer strength will be tested. If the market forms a downside reversal there, the priority will quickly shift back towards selling. A change in the medium-term picture would require consolidation at least above 4,364 followed by a breakout above 4,455.
XAUUSD forecast scenario
Trading scenario: BUY
- Price at the time of writing: 4,306
- Entry price: 4,311
- Stop loss: 4,285
- Take profit: 4,364
- Risk-to-reward ratio: 1:2.0
The trade idea is valid until 8:00 AM on 18 September 2026 (server time, UTC+3).
US 500 forecast
As of the morning of 17 September, the key factor for the US 500 is the reassessment of US monetary policy. The Federal Reserve raised the target rate range by 25 basis points to 3.75–4.00% on 16 September, the first increase in three years, and the median projection points to one more hike before the end of 2026. For the equity market, this means persistently high discount rates and pressure on expensive segments, especially technology companies. US indices closed lower after the Fed decision, while short-term Treasury yields rose. High energy prices and the associated inflation risks remain an additional negative factor. At the same time, August retail sales confirm the resilience of the economy and reduce the likelihood of a sharp deterioration in corporate earnings. S&P 500 futures were recovering this morning alongside Asian markets as stabilisation in long-term yields partially eased the pressure.
However, the broader backdrop remains highly sensitive to new signals on rates, oil and geopolitics. For the index, this creates a combination of a resilient economy and tight financial conditions, increasing the likelihood of continued volatility. Pressure on semiconductor and other high-valuation growth companies that are sensitive to yields remains another constraint. At the same time, the absence of signs of a sharp slowdown is supporting cyclical sectors. Therefore, intraday recovery attempts will depend on stabilisation in the bond market, while another rise in yields could bring sellers back.
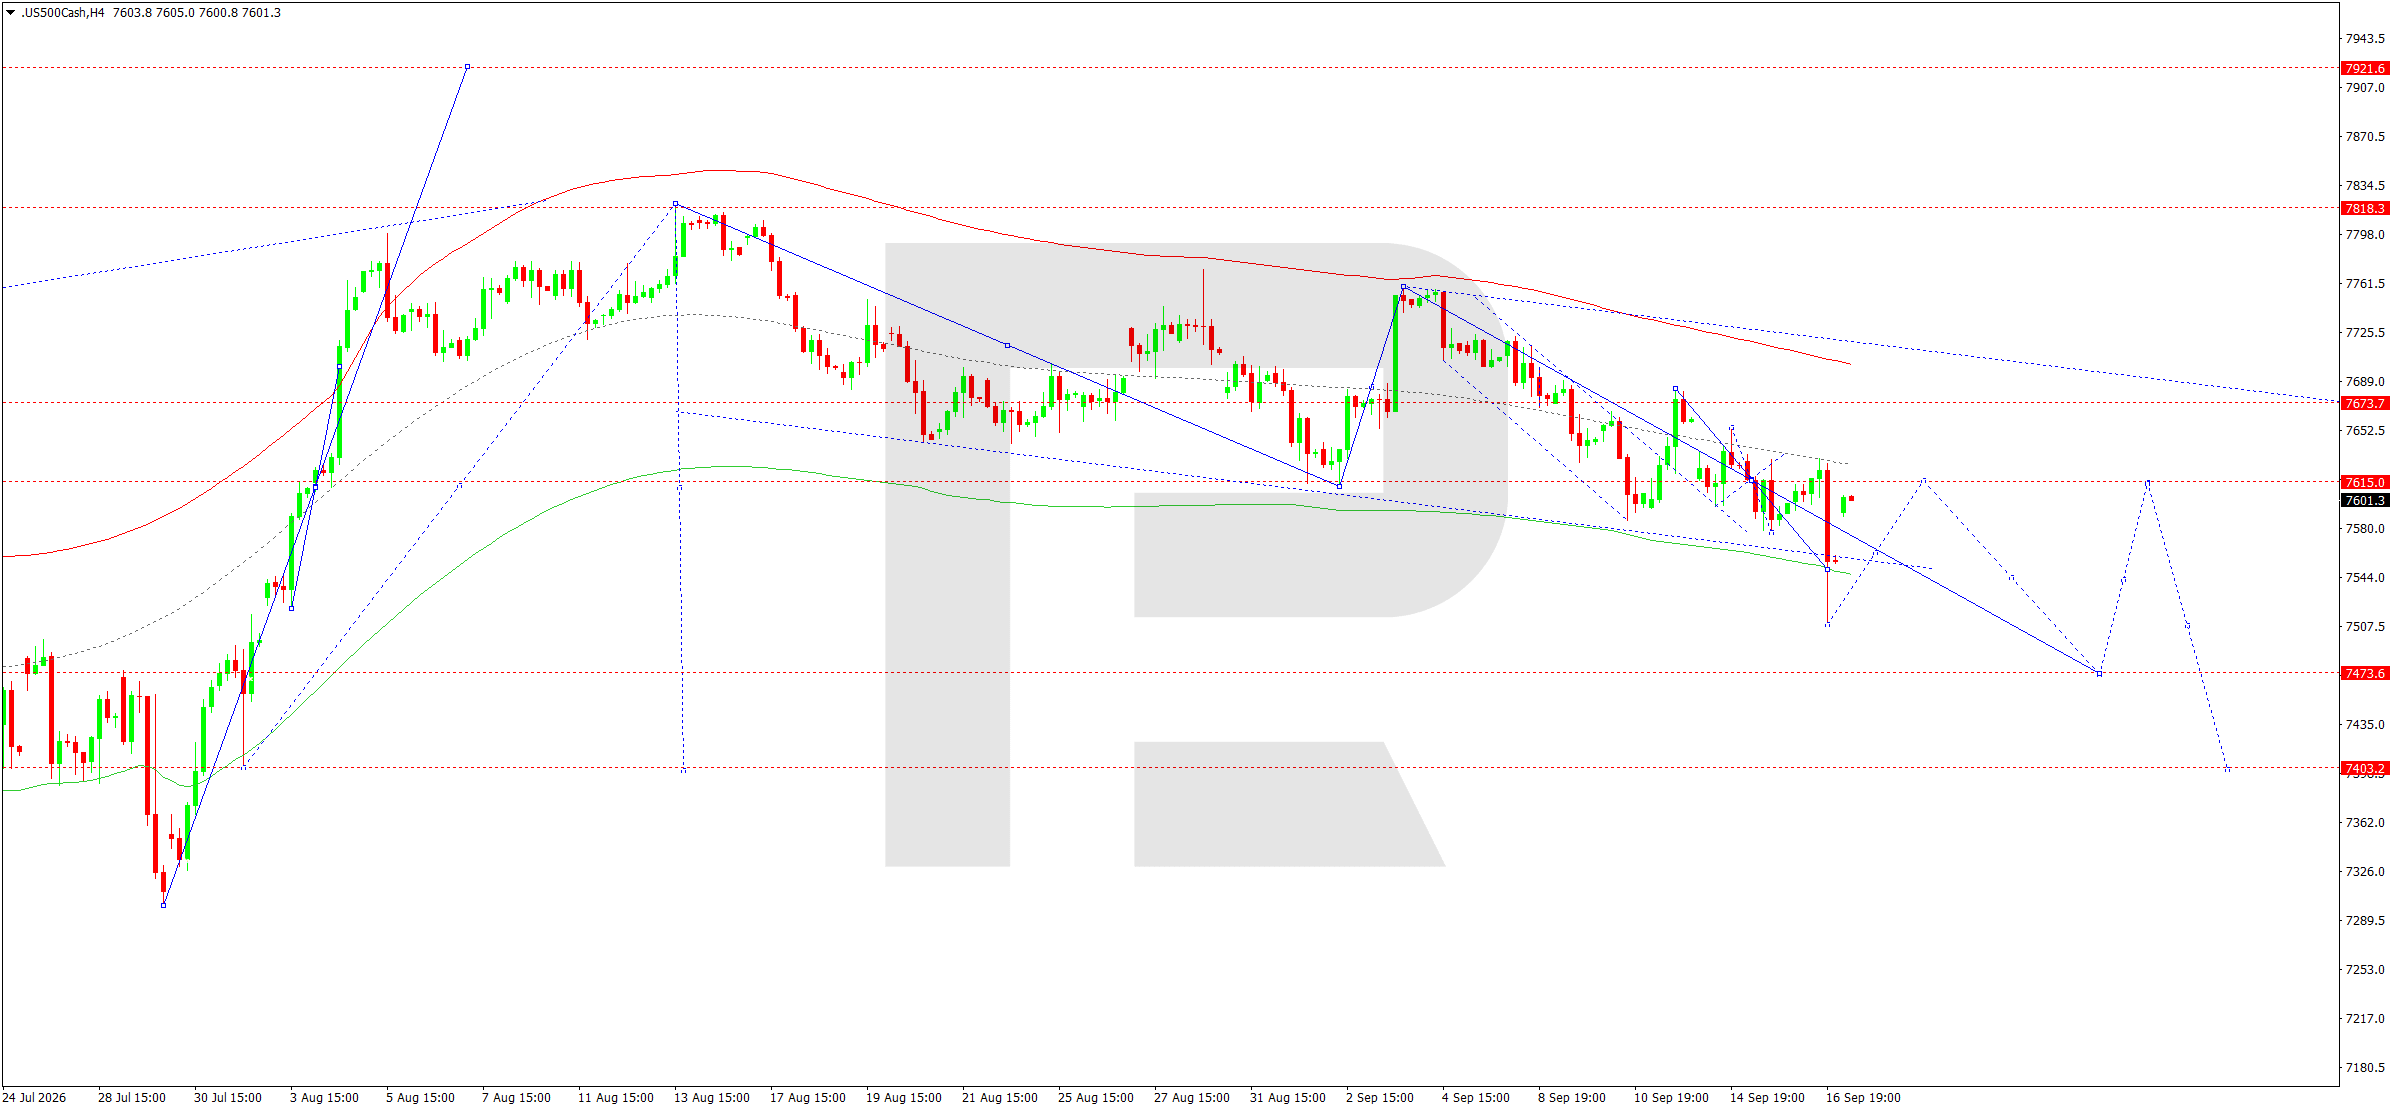
On the H4 chart, the US 500 completed a downward structure towards 7,506 and then returned to the 7,607 area. Today, 17 September 2026, the scenario remains the development of a consolidation range around 7,615. An upside breakout could allow for a corrective test of 7,644, but failure to consolidate above this area would keep the risk of a further decline towards 7,474 in place.
The Elliott wave structure and the downward wave matrix, with a pivot point around 7,615, confirm this scenario. The index is trading below the central line of the Price Envelope, while a sequence of lower local highs continues to maintain selling pressure. The 7,615 level acts as a key balance point: a return above it would allow the correction to extend, but the 7,644–7,674 area remains resistance. A move below 7,560 would provide an additional signal for the continuation of the downward wave. The 7,474 target corresponds to the lower part of the current channel and remains the priority.
Consolidation above 7,674 would weaken the bearish structure and require a reassessment of the scenario. For the day, the preference remains SELL for a continuation of the main downward wave after the consolidation is complete. The 7,615–7,644 area is viewed as the nearest supply zone. If a reversal forms there, the probability of a test of 7,560 and 7,474 would increase noticeably. Only sustained consolidation above 7,674 would neutralise the local pressure and return the index to a broader sideways range.
US 500 forecast scenario
Trading scenario: SELL
- Price at the time of writing: 7,607
- Entry price: 7,602
- Stop loss: 7,645
- Take profit: 7,474
- Risk-to-reward ratio: 1:3.0
The trade idea is valid until 8:00 AM on 18 September 2026 (server time, UTC+3).
BTCUSD forecast
As of the morning of 17 September, the backdrop for BTCUSD remains tense. The Federal Reserve raised the target rate range by 25 basis points to 3.75–4.00% on 16 September and left the door open to another increase before the end of the year. For Bitcoin, this means tight US dollar financial conditions, higher yields on risk-free assets and pressure on high-volatility instruments. At the same time, the US Dollar Index rose to a seven-week high, further limiting demand for cryptocurrencies.
Another negative factor was the US Senate's decision not to advance the Clarity Act, which was intended to provide greater regulatory certainty for digital assets. Following the vote, Bitcoin and cryptocurrency-related shares remained under pressure. On the other hand, the market has already priced in the Fed's tightening, while the absence of a sharp sell-off after the decision indicates demand from buyers on dips. Treasury yield dynamics, capital flows into risk assets and the stock market's reaction remain important.
If yields continue to rise, pressure on BTC could increase. A stabilisation in rates could trigger a rebound, but the fundamental balance does not yet provide grounds to consider the correction complete. Overall risk appetite also remains important: equities declined after the Fed decision while short-term yields rose, which is unfavourable for cryptocurrencies. Geopolitical risks have a mixed effect: they support safe-haven assets, but for BTC they more often increase volatility and reduce speculative positioning. Therefore, the current recovery is still more appropriately viewed as corrective.
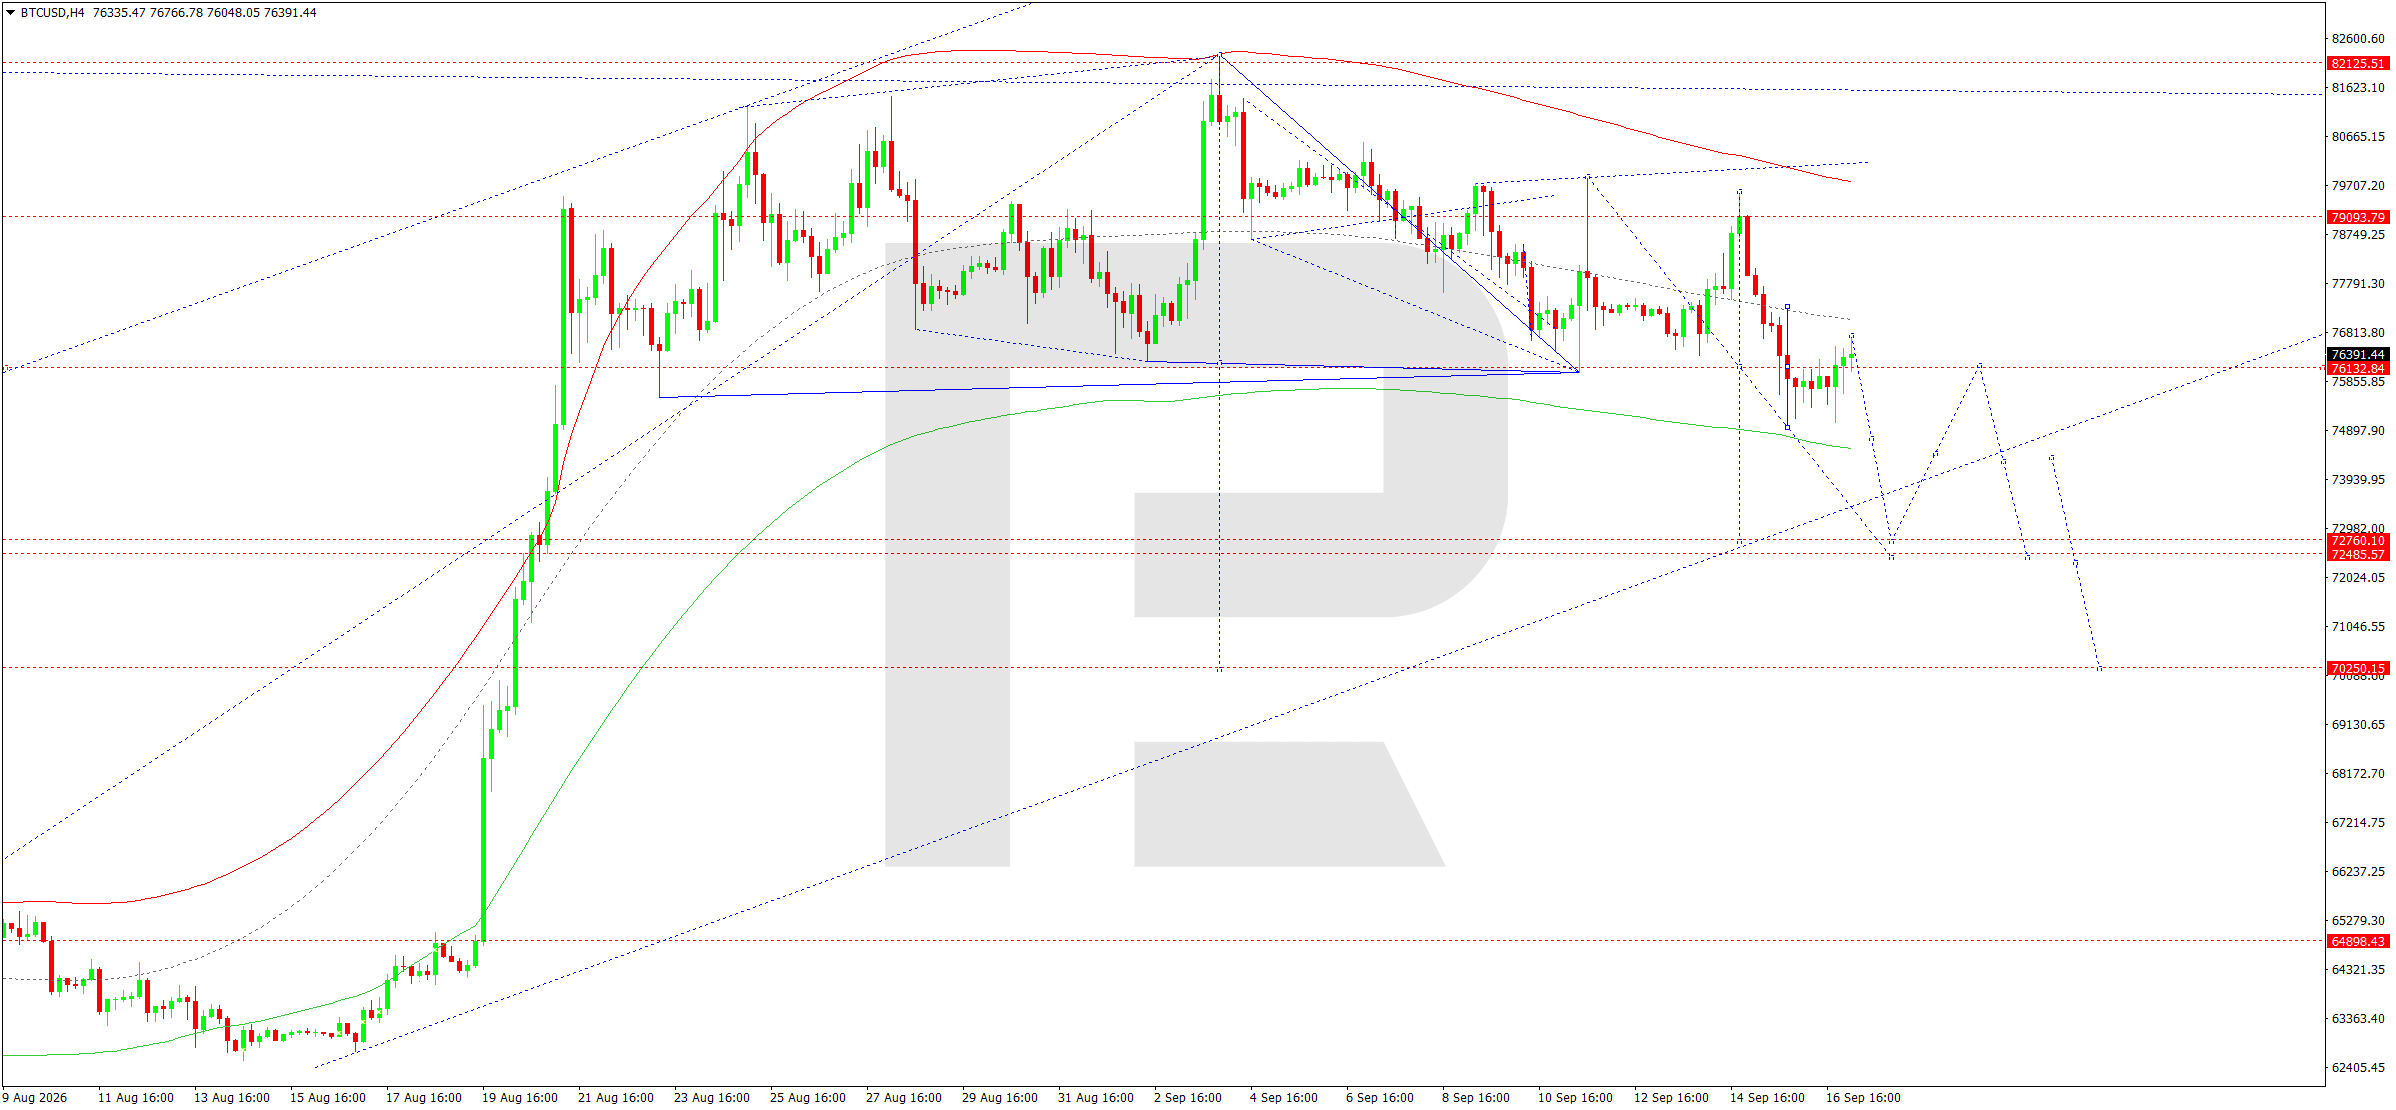
On the H4 chart, BTCUSD completed a downward structure towards the 74,960 area and then rebounded from the lower part of the range. Today, 17 September 2026, a corrective upward wave is developing with a target at 77,270. Once it is complete, the main scenario remains another decline towards 72,760 and then 72,485, where the local target of the bearish structure is located.
The Elliott wave structure and the downward wave matrix, with a pivot point at 76,132, confirm this scenario. The price tested the lower boundary of the Price Envelope around 75,000 and moved back above the centre of the matrix. This creates scope for a further recovery towards the central line of the Envelope in the 77,270–77,300 area. However, while the market remains below 79,093, the trend stays bearish. A rejection from 77,270–77,300 would increase the probability of a new impulse towards 72,760. A breakout below 72,485 would open the way towards 70,250.
Only consolidation above 79,093 would weaken the bearish structure and allow for a return towards 81,600–82,125. For the coming day, a tactical BUY is considered to complete the corrective leg, after which the priority would shift back towards selling. The 77,270–77,300 area is the first supply zone and a key test of buyer strength. If the market fails to consolidate above it, a renewed move below 76,132 would confirm the end of the rebound. An upside reversal would require a breakout above both 77,300 and 79,093.
BTCUSD forecast scenario
Trading scenario: BUY
- Price at the time of writing: 76,555
- Entry price: 76,560
- Stop loss: 75,960
- Take profit: 77,270
- Risk-to-reward ratio: 1:1.2
The trade idea is valid until 8:00 AM on 18 September 2026 (server time, UTC+3).
Editors’ picks
 EURUSD forecast 2026–2027: technical analysis, price levels & predictions
EURUSD has recovered from the July lows and is trading near 1.1545 — back in bullish territory. The pair has reclaimed EMA65 on the daily, formed a bullish EMA crossover on H4, and the US-eurozone GDP gap has narrowed sharply (US 1.5% vs eurozone 1.0%). Goldman Sachs and Deutsche Bank both now target 1.2500 by year-end. A confirmed close above 1.1700 opens the path to 1.1805. We break down the key levels, three trading scenarios, and what the unprecedented 9-3 FOMC dissent vote means for EURUSD.
 Gold (XAUUSD) forecast 2026: technical analysis, price levels & predictions
Gold has reversed its downtrend and is trading near 4,360 USD, back above both EMA65 and EMA200. ETF flows turned positive in July with 3 billion USD of net inflows, and central banks bought 288.9 tonnes in Q2 — up 62% year-on-year. A breakout above 4,500 USD opens the path to 4,855 USD and the 5,597 USD all-time high. We break down the key levels, three trading scenarios with entry triggers, and what J.P. Morgan, Deutsche Bank and Goldman Sachs are forecasting for gold in 2026.
Forecasts presented in this section only reflect the author’s private opinion and should not be considered as guidance for trading. RoboForex bears no responsibility for trading results based on trading recommendations described in these analytical reviews.