
Daily technical analysis and forecast for 22 September 2026
Daily technical analysis and forecast for EURUSD, USDJPY, GBPUSD, AUDUSD, USDCAD, XAUUSD, US 500, and BTCUSD for 22 September 2026.
Each scenario on this page reflects the market structure on the H4 chart as of 10:00 UTC+3 on 22 September 2026. The assessment considers the current H4 chart structure, key support and resistance levels, the direction of the medium-term movement, and the prevailing fundamental backdrop.
EURUSD forecast
As of 22 September 2026, the fundamental backdrop for EURUSD remains mixed, but with a moderate advantage for the dollar. The European Central Bank raised its key rates by 25 basis points on 10 September, taking the deposit rate to 2.50%, as the energy shock and geopolitical tensions keep inflation above target. Today, ECB Chief Economist Philip Lane also noted that the impact of expensive energy may prove more persistent and that inflation is expected to return to target only from mid-2027. This supports expectations that the ECB will maintain a restrictive stance.
At the same time, the Federal Reserve raised the target rate range to 3.75–4.00% on 16 September, pointing to resilient economic activity and persistent elevated inflationary pressure. Expectations of further Fed tightening are providing additional support to the dollar. For the euro, a widening risk premium on French bonds and broader fiscal uncertainty in the eurozone remain restraining factors. As a result, the fundamental balance does not give the euro a sustained advantage, although local corrective rises in the pair remain possible if US bond yields decline.
In the broader market, the dollar remains resilient, while the decline in the 10-year Treasury yield is partly limiting further strengthening. Oil dynamics remain another factor: Brent is holding above 100 USD per barrel, increasing inflation risks for both the US and eurozone. Intraday volatility may therefore remain elevated.
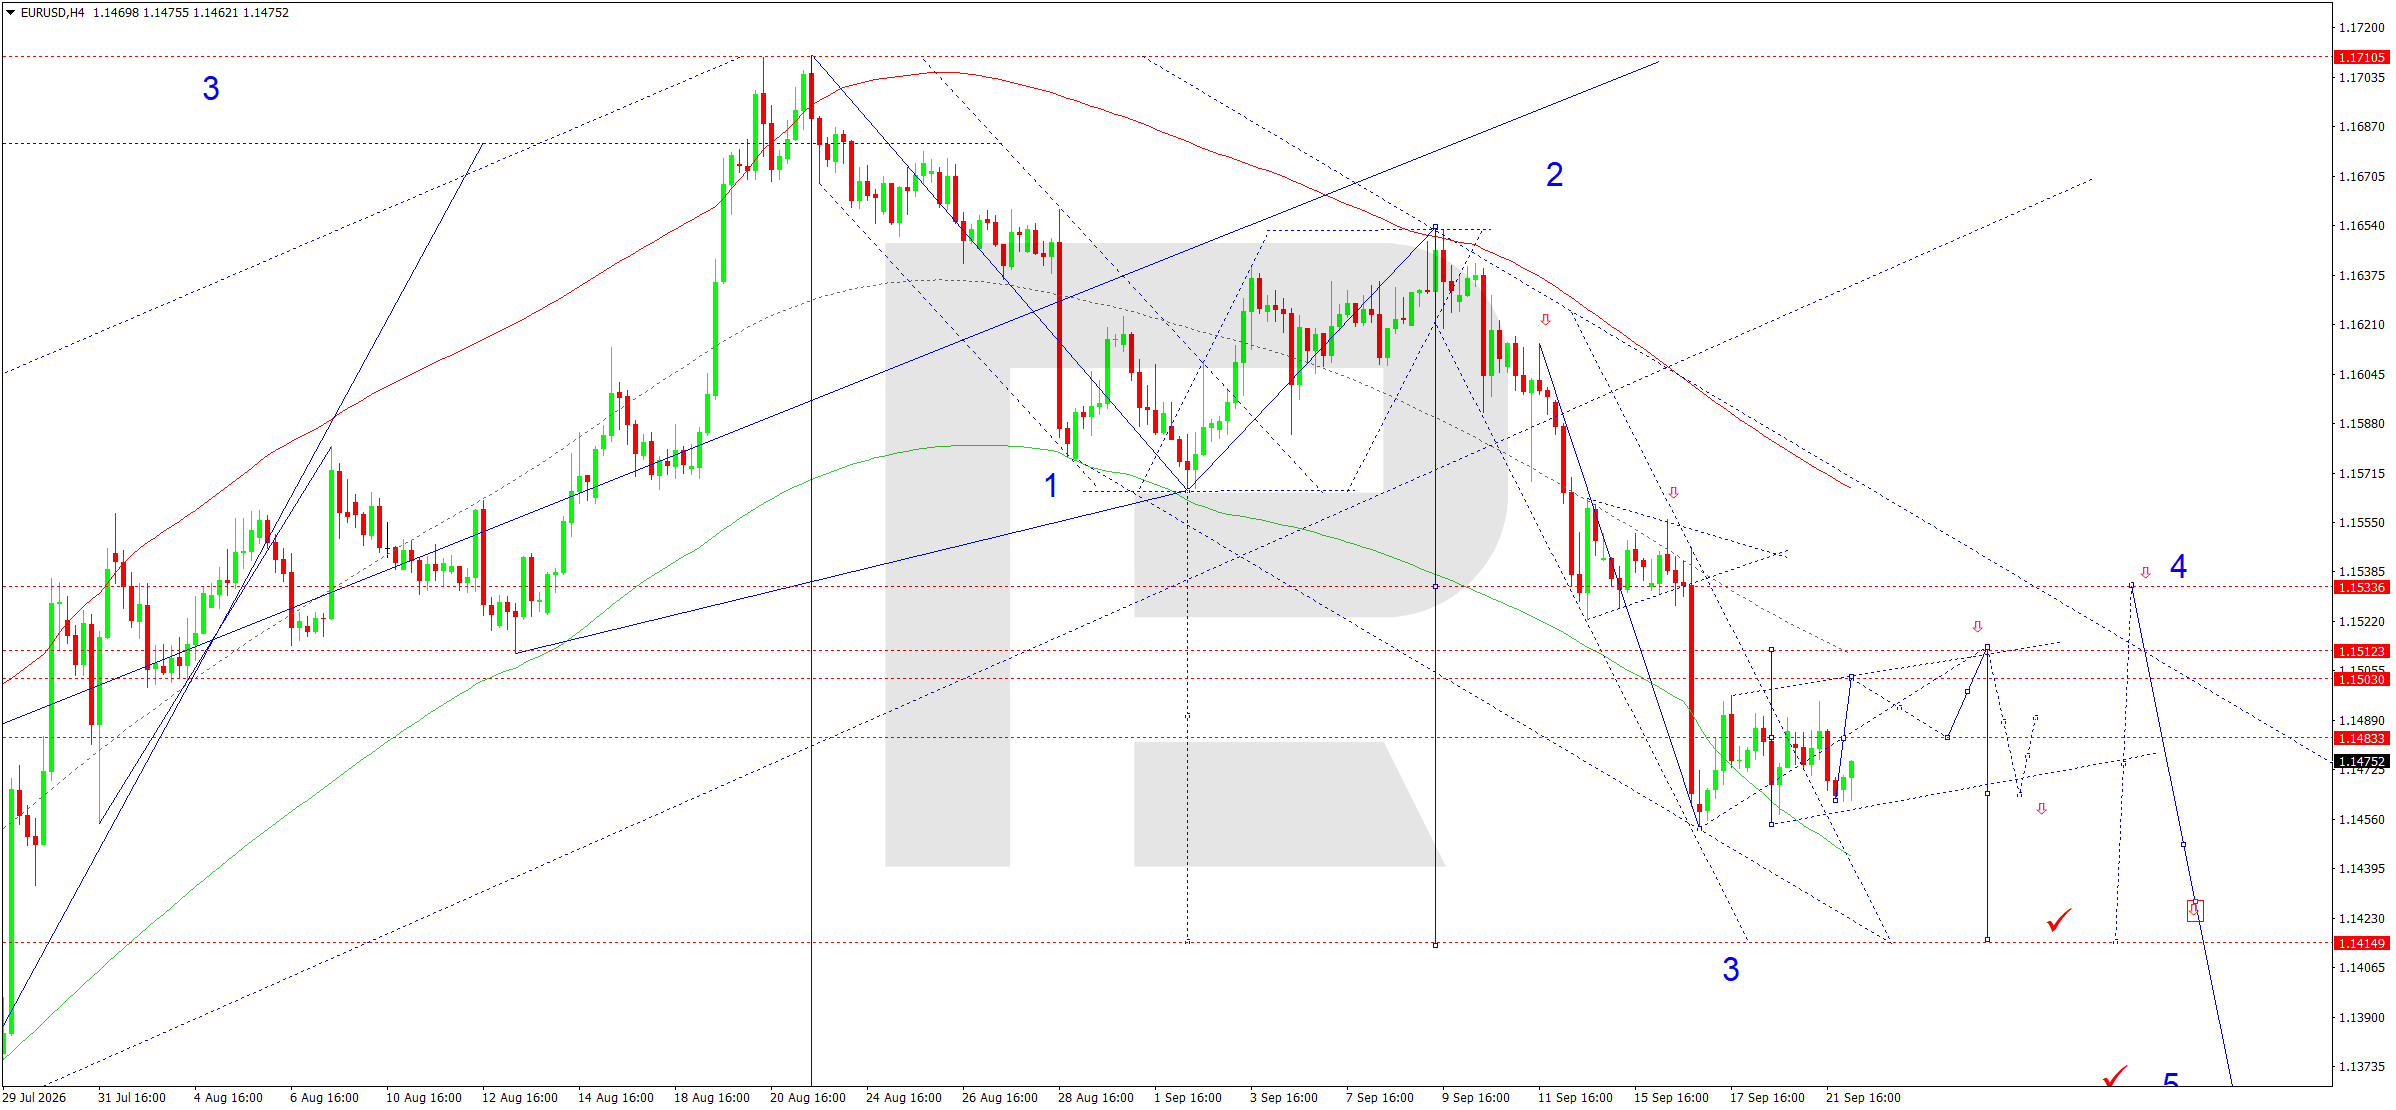
On the H4 chart, after a downward impulse EURUSD formed a local base around 1.1455 and moved into consolidation near 1.1483. For 22 September, the main scenario remains an expansion of the range upwards towards 1.1503, with a possible test of 1.1515. The current structure shows that the market is in a corrective phase after the third downward wave formed. Short-term priority is therefore given to growth, although this rise is viewed specifically as a correction within the broader bearish structure.
The scenario is confirmed by the Elliott Wave structure and the wave Matrix with a pivot around 1.1535. The price previously completed the local target of the third wave near the lower boundary of the Price Envelope at 1.1453. A recovery towards the central line of the Envelope at 1.1503–1.1555 remains technically possible. If the price consolidates above 1.1503, the next target will be 1.1515. Failure to hold above 1.1470 and a return below 1.1455 would strengthen the downward impulse again. The medium-term downside target remains 1.1415.
EURUSD forecast scenario
Trading scenario: BUY
- Price at the time of writing: 1.1475
- Entry price: 1.1480
- Stop Loss: 1.1455
- Take Profit: 1.1515
- Risk-to-reward ratio: 1:1.40
The trade idea is valid until 8:00 AM on 23 September 2026 (server time, UTC+3).
USDJPY forecast
As of 22 September 2026, the key factor for USDJPY remains the difference in the pace of monetary tightening in the US and Japan. The Federal Reserve raised the target rate range by 25 basis points to 3.75–4.00% on 16 September and emphasised that inflation remains elevated while economic activity continues to expand at a steady pace. The market continues to price in the possibility of further tightening, supporting yields on dollar assets and demand for the US currency.
The Bank of Japan also raised its policy rate by 25 basis points to 1.25% on 18 September, the highest level in 31 years, but the decision was taken by a 7–2 vote. Two dissenting members and the absence of a more hawkish signal on the next steps led to yen weakness even after the rate increase. On Tuesday morning, USDJPY was holding around 157.5, while the market continued to assume that the BoJ would move more cautiously than the Fed. The fundamental backdrop therefore remains in favour of the dollar, although the possibility of Japanese authorities intervening in the FX market could increase volatility.
High oil prices remain another factor, worsening Japan's trade balance and potentially increasing imported inflation. At the same time, hopes for diplomatic contacts regarding the Middle East have temporarily reduced long-term US yields and supported global risk appetite. For the yen, this creates a conflicting environment: lower yields limit the rise in USDJPY, but the high level of US rates and the persistent carry trade continue to work against the Japanese currency.
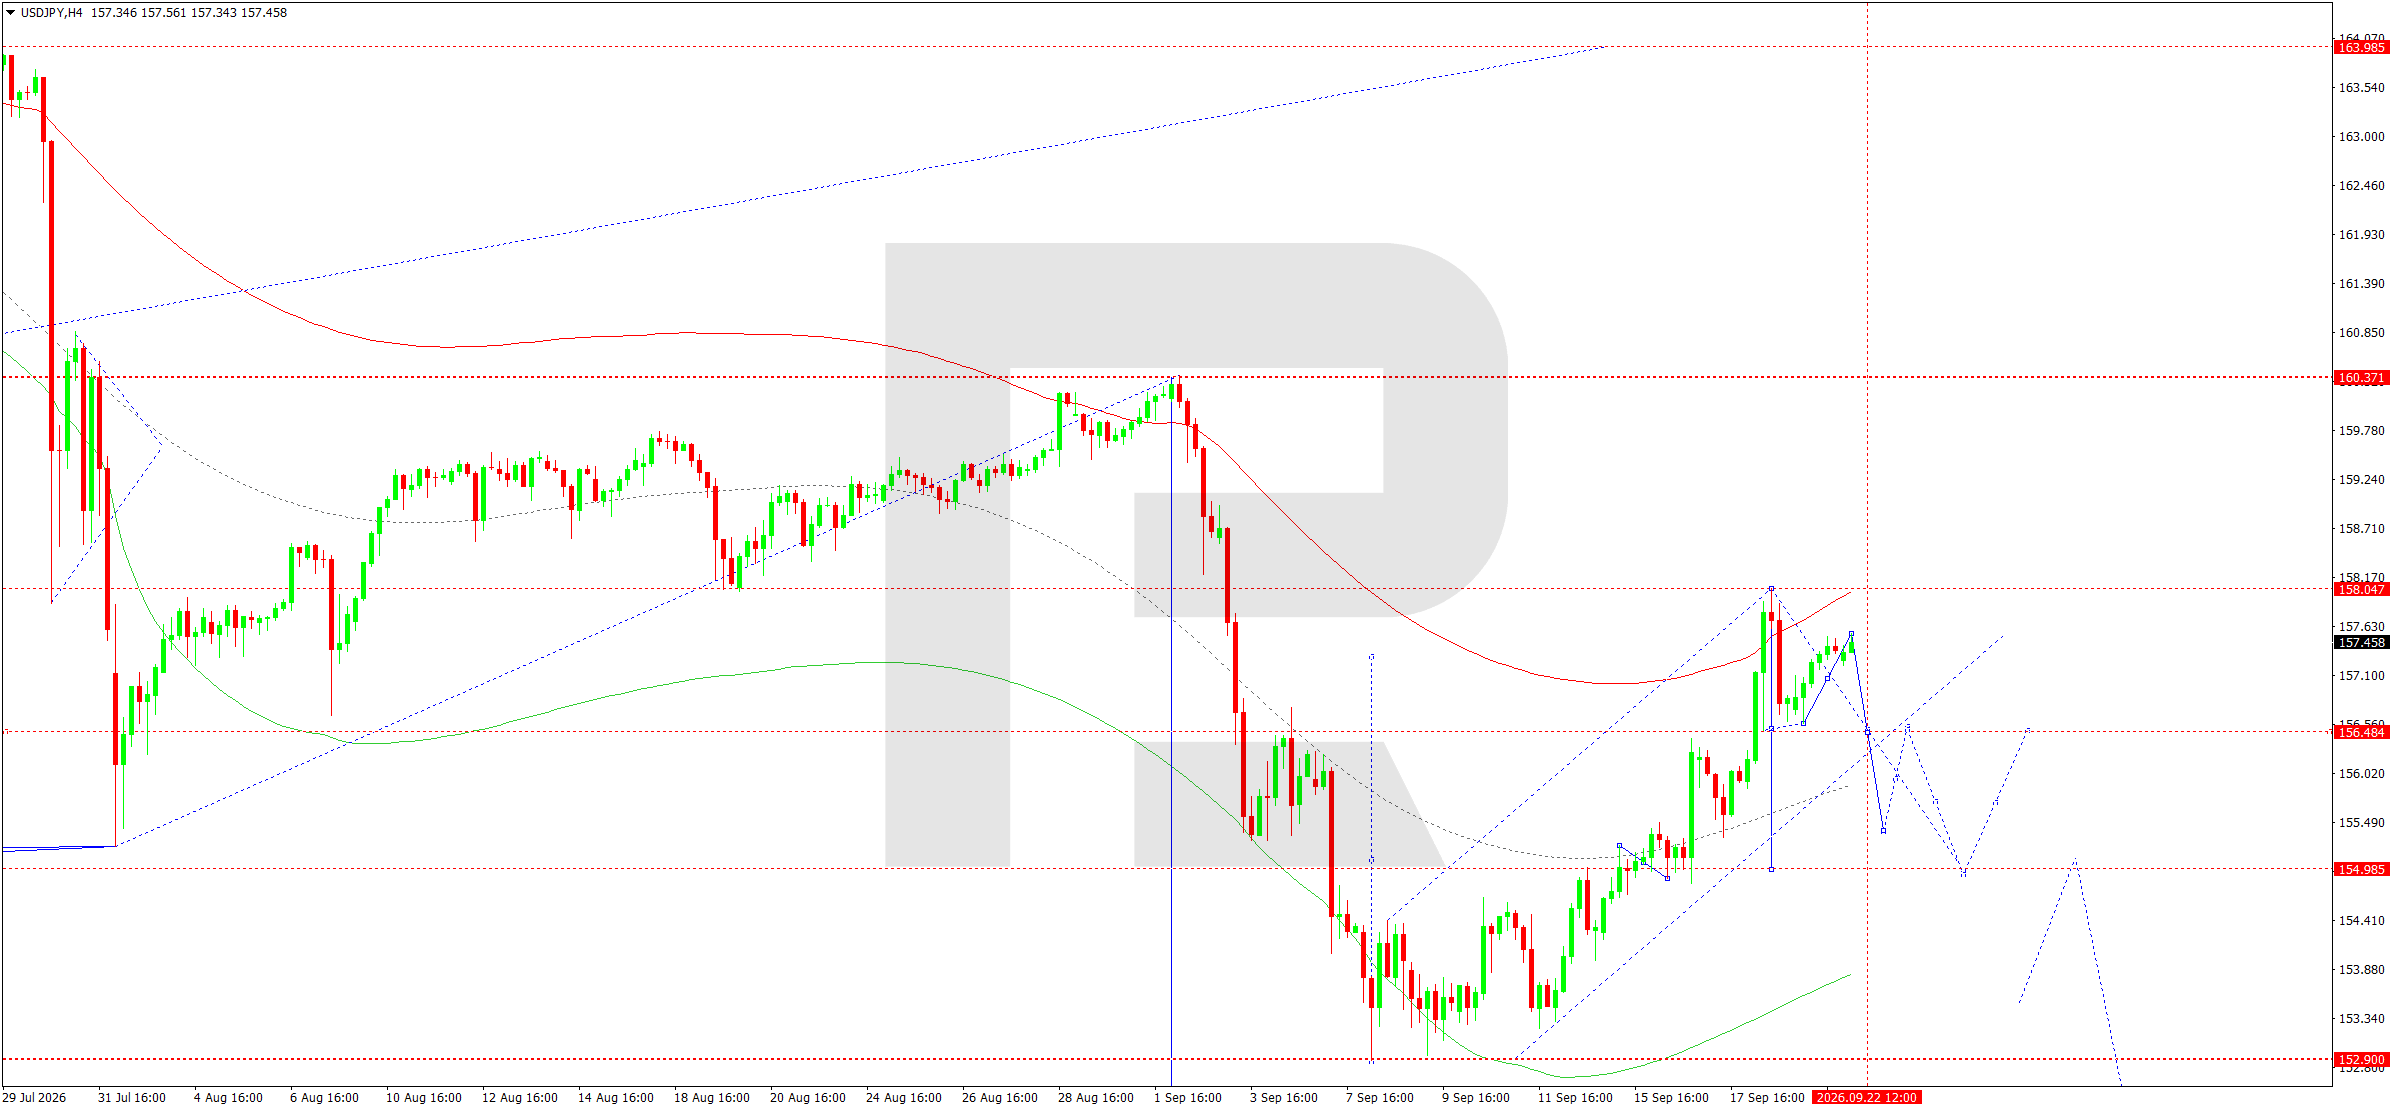
On the H4 chart, USDJPY found support around 156.57 and formed an upward wave towards 157.55. The current structure points to the completion of the local impulse and the likelihood of a correction forming. The main scenario for 22 September is a decline towards 156.80. If this support is broken, the next targets will be 156.48 and 155.15. Once the correction is complete, the market may recover towards 156.50–156.80, but at the current stage the preference remains for selling.
The Elliott Wave structure and the rising Matrix, with its pivot around 155.05, confirm the probability of a corrective move. The price has approached the upper boundary of the Price Envelope around 158.00, where an area of increased supply is forming. A return to the central line of the Envelope near 156.50 is the main technical objective. A firm breakout below 156.48 would extend the downside potential towards 154.98–155.15 and then 153.60. The alternative would be a breakout above 158.05, which would temporarily invalidate the corrective scenario.
USDJPY forecast scenario
Trading scenario: SELL
- Price at the time of writing: 157.46
- Entry price: 157.41
- Stop Loss: 158.05
- Take Profit: 155.15
- Risk-to-reward ratio: 1:3.53
The trade idea is valid until 8:00 AM on 23 September 2026 (server time, UTC+3).
GBPUSD forecast
As of 22 September 2026, the fundamental backdrop for GBPUSD is shaped by differences in the signals from the Bank of England and the Federal Reserve. The Bank of England kept the policy rate unchanged at 3.75% on 17 September by a 6–3 majority, with three Monetary Policy Committee members voting for an increase to 4.00%. The main reason for caution remains the energy shock: UK inflation accelerated to 3.1% in August, and the BoE expects further pressure from fuel and utility costs. This configuration limits the downside potential in UK bond yields and provides some support to the pound.
However, the Federal Reserve raised the target rate range to 3.75–4.00% on 16 September and maintained a hawkish tone, highlighting resilient demand and elevated inflation. For GBPUSD, this means the pound has no clear advantage in terms of the interest-rate differential. A recovery in global risk appetite and the decline in the 10-year Treasury yield are additional factors partly easing pressure from the dollar. At the same time, persistently expensive energy is worsening the outlook for UK consumption and growth, leaving the fundamental backdrop for the pound neutral to negative.
The market will also be sensitive to comments from BoE and Fed officials as investors assess the probability of further tightening before the end of the year. The decline in oil from recent highs is temporarily easing inflation pressure on the UK economy, but Brent remains above 100 USD per barrel. The pound may therefore continue to experience elevated intraday volatility.
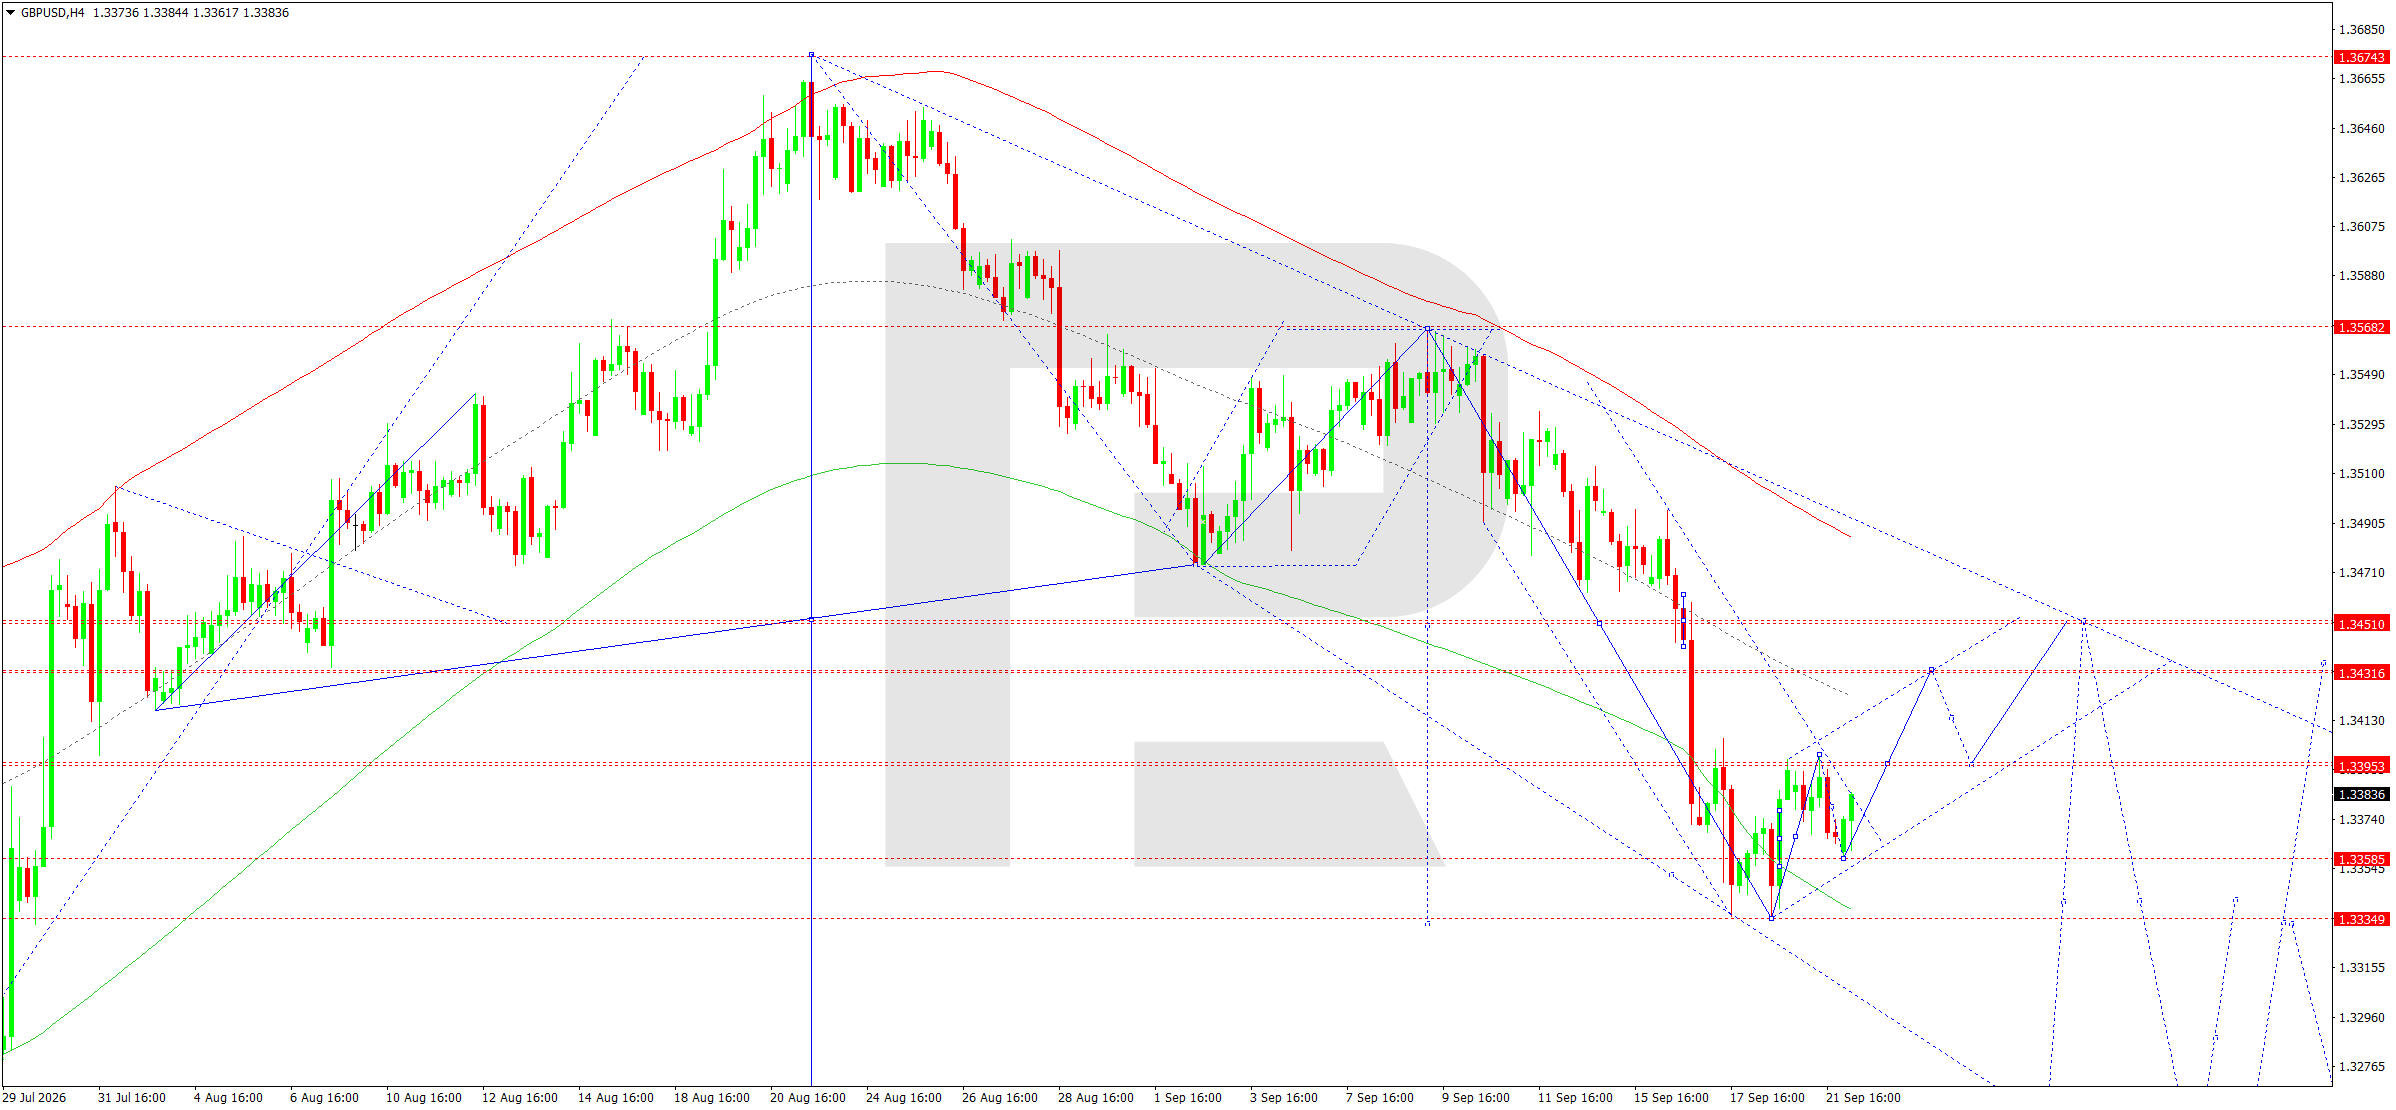
On the H4 chart, GBPUSD completed a downward wave around 1.3357 and formed a local base above the 1.3334–1.3358 area. On 22 September, a corrective upward wave towards 1.3393 is expected. The nearest consolidation area is forming around this level. A firm breakout above 1.3393 would open the potential for a move towards 1.3431 and then resistance at 1.3451. While the price remains above the local low, growth remains relevant in the short term.
The Elliott Wave structure and the declining-wave Matrix, with its pivot around 1.3452, confirm the corrective nature of the current recovery. The price previously moved towards the lower boundary of the Price Envelope around 1.3336. The central line of the Envelope lies in the 1.3431 area and remains the main corrective target. If the market fails to consolidate above 1.3393 and returns below 1.3358, selling pressure will increase. A breakout below 1.3334 would open the way towards 1.3295 and then 1.3275.
GBPUSD forecast scenario
Trading scenario: BUY
- Price at the time of writing: 1.3384
- Entry price: 1.3389
- Stop Loss: 1.3355
- Take Profit: 1.3431
- Risk-to-reward ratio: 1:1.24
The trade idea is valid until 8:00 AM on 23 September 2026 (server time, UTC+3).
AUDUSD forecast
As of 22 September 2026, the fundamental backdrop for AUDUSD has become more balanced as expectations of further monetary tightening in Australia have strengthened. The Reserve Bank of Australia is keeping the cash rate at 4.35%, but today RBA Governor Michele Bullock said that some upside inflation risks are beginning to materialise because of high energy prices and persistent domestic demand. The next meeting is scheduled for 29 September, and the market has sharply increased the probability of another rate rise. This factor supports the Australian dollar.
On the other hand, the Federal Reserve raised the target rate range to 3.75–4.00% on 16 September and maintained a hawkish signal on inflation, so the US dollar remains fundamentally resilient. Global risk appetite is also important for the AUD: the recovery in technology shares and the decline in US bond yields support high-beta currencies. At the same time, oil remains above 100 USD per barrel, preserving inflation risks. As a result, the short-term fundamental balance allows for an AUDUSD recovery, but the upside is limited by the strong dollar.
The situation in China and expectations of upcoming talks between the US and China remain another factor for the Australian currency, as changes in trade prospects directly affect Australia's commodity exports and broader risk demand. While market sentiment remains optimistic, the AUD receives support. However, any deterioration in global sentiment could quickly restore demand for the US dollar.
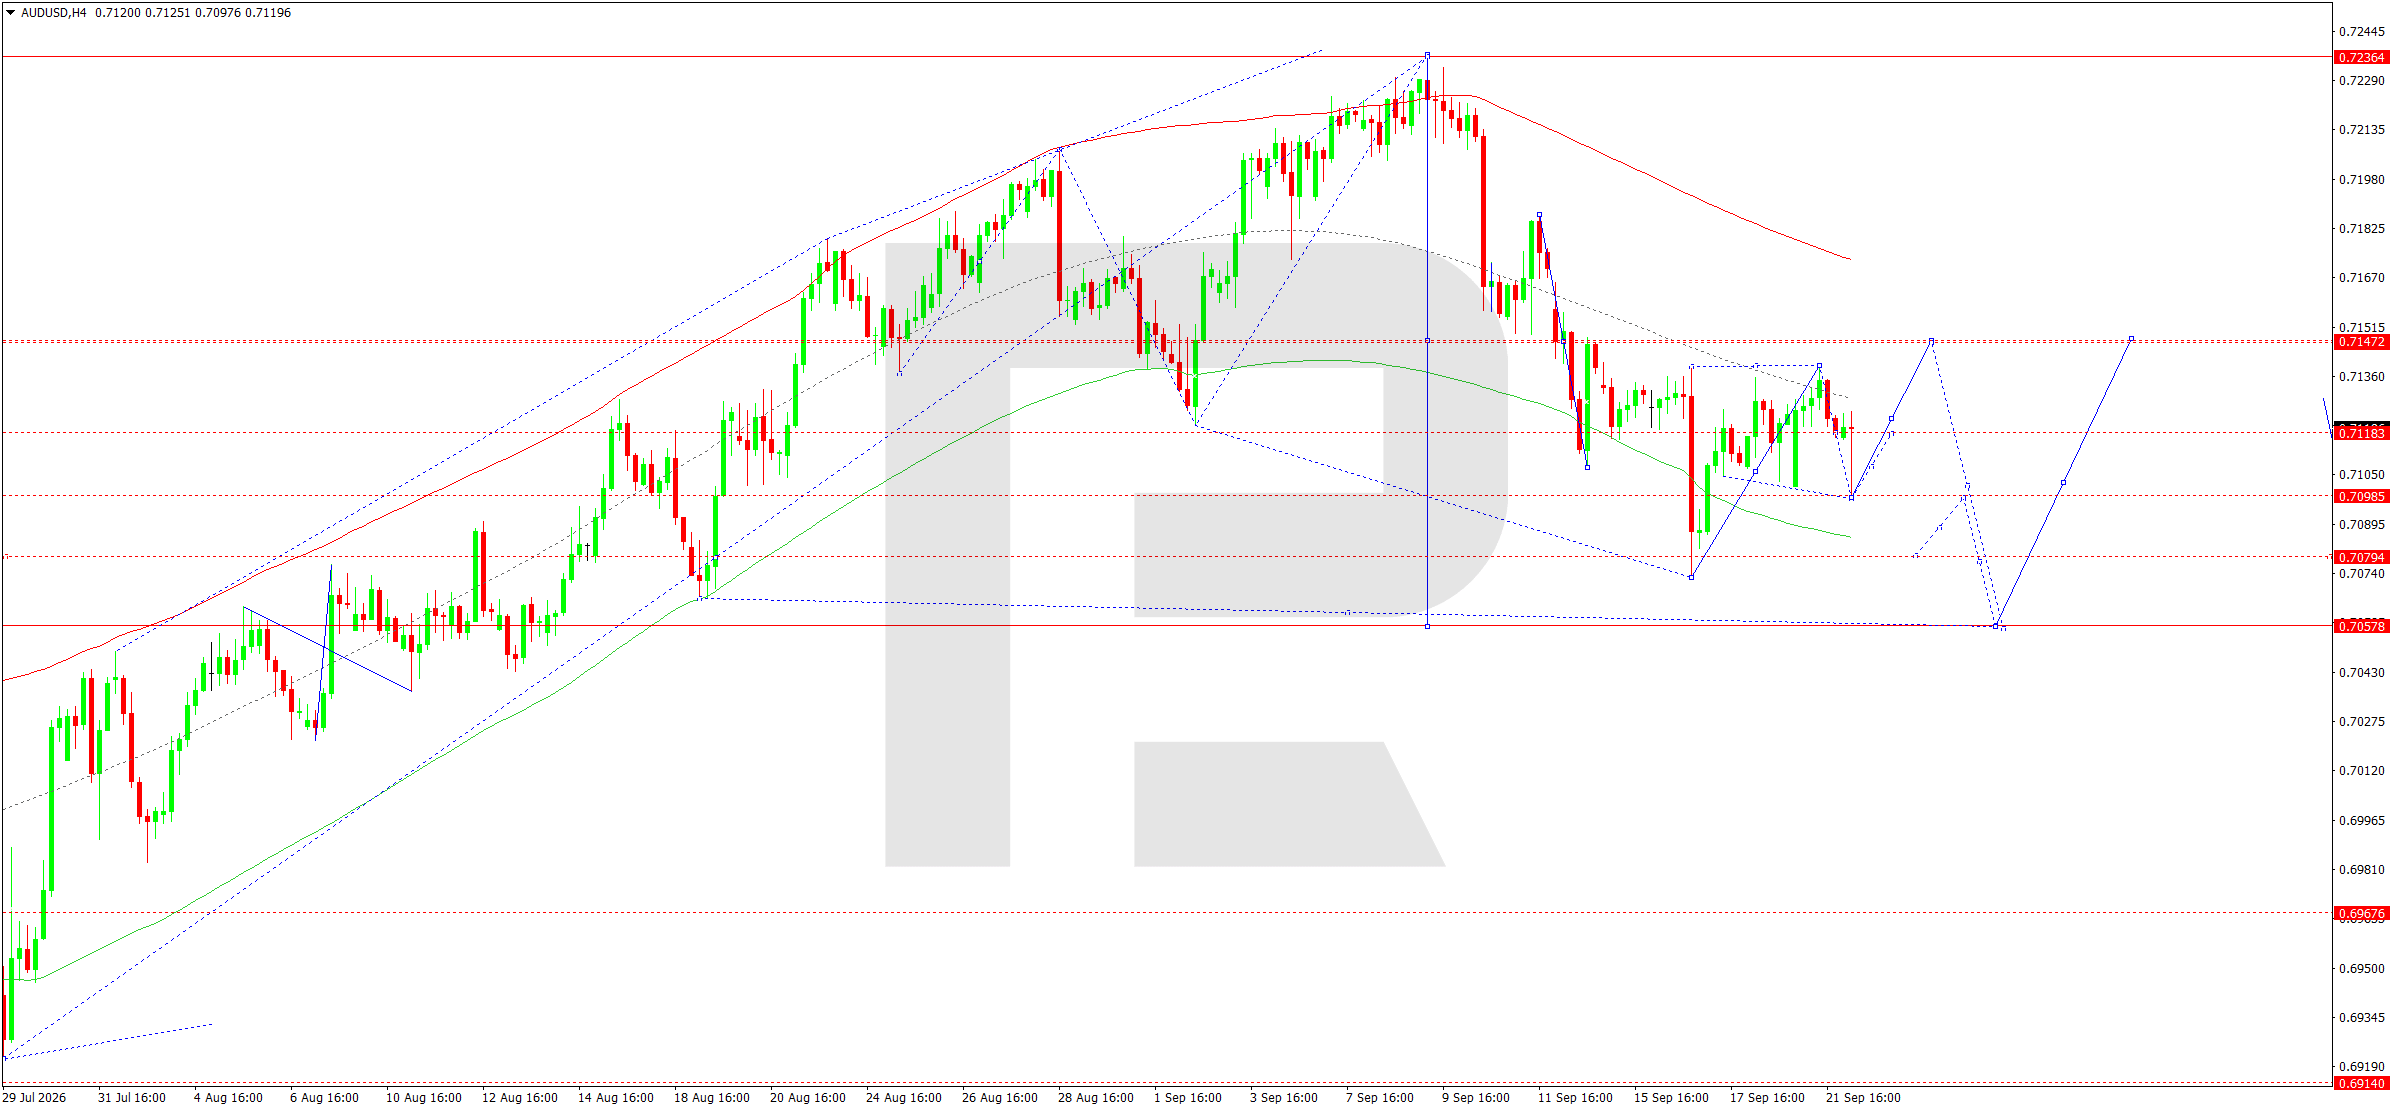
On the H4 chart, after rising towards 0.7138, AUDUSD corrected into the 0.7099 area and then recovered towards 0.7120. On 22 September, another decline towards 0.7095–0.7098 remains possible, after which a recovery towards 0.7142 and 0.7147 would become relevant. The 0.7147 area is key intraday resistance and also the centre of the current downward-wave Matrix. Until it is broken firmly, growth should be viewed as corrective.
The Elliott Wave structure shows a local correction developing after the downward impulse completed. The price previously tested the 0.7097 area and returned to the central part of the Price Envelope. Consolidation above 0.7125 would increase the probability of a move towards the upper boundary of the Envelope at 0.7147. If buyers manage to consolidate the price above 0.7147, the next target will be the 0.7180 area. A rejection from 0.7142–0.7147 would preserve the main bearish scenario, with a return towards 0.7111, then 0.7095 and 0.7079.
AUDUSD forecast scenario
Trading scenario: BUY
- Price at the time of writing: 0.7120
- Entry price: 0.7125
- Stop Loss: 0.7108
- Take Profit: 0.7147
- Risk-to-reward ratio: 1:1.29
The trade idea is valid until 8:00 AM on 23 September 2026 (server time, UTC+3).
USDCAD forecast
As of 22 September 2026, the fundamental backdrop for USDCAD remains mixed. The Bank of Canada kept its key rate unchanged at 2.25% on 2 September, noting both elevated inflation risks and growing uncertainty due to new trade barriers. August inflation remained around 3%, while core measures stayed closer to 2%, which has not yet forced the BoC to tighten policy immediately.
At the same time, the Federal Reserve raised the target rate range to 3.75–4.00% on 16 September and maintained a hawkish tone. The widening interest-rate differential in favour of the US supports the dollar and explains why USDCAD remains resilient above 1.4000. Oil remains an important source of support for the Canadian dollar, with Brent trading above 100 USD per barrel. However, BoC Governor Tiff Macklem warned that new US tariffs could materially slow Canadian growth in the fourth quarter. High oil prices therefore support the CAD, while trade risks and the lower BoC rate work in the opposite direction.
In the commodities market, oil is recovering slightly on Tuesday after several sessions of decline amid expectations of possible contacts between the US and Iran, while volatility remains high. For the CAD, this means continued support from export revenues but without a sustained impulse. If oil prices rise again, the USDCAD correction could accelerate; if oil weakens, the interest-rate advantage may bring dollar buyers back into the market.
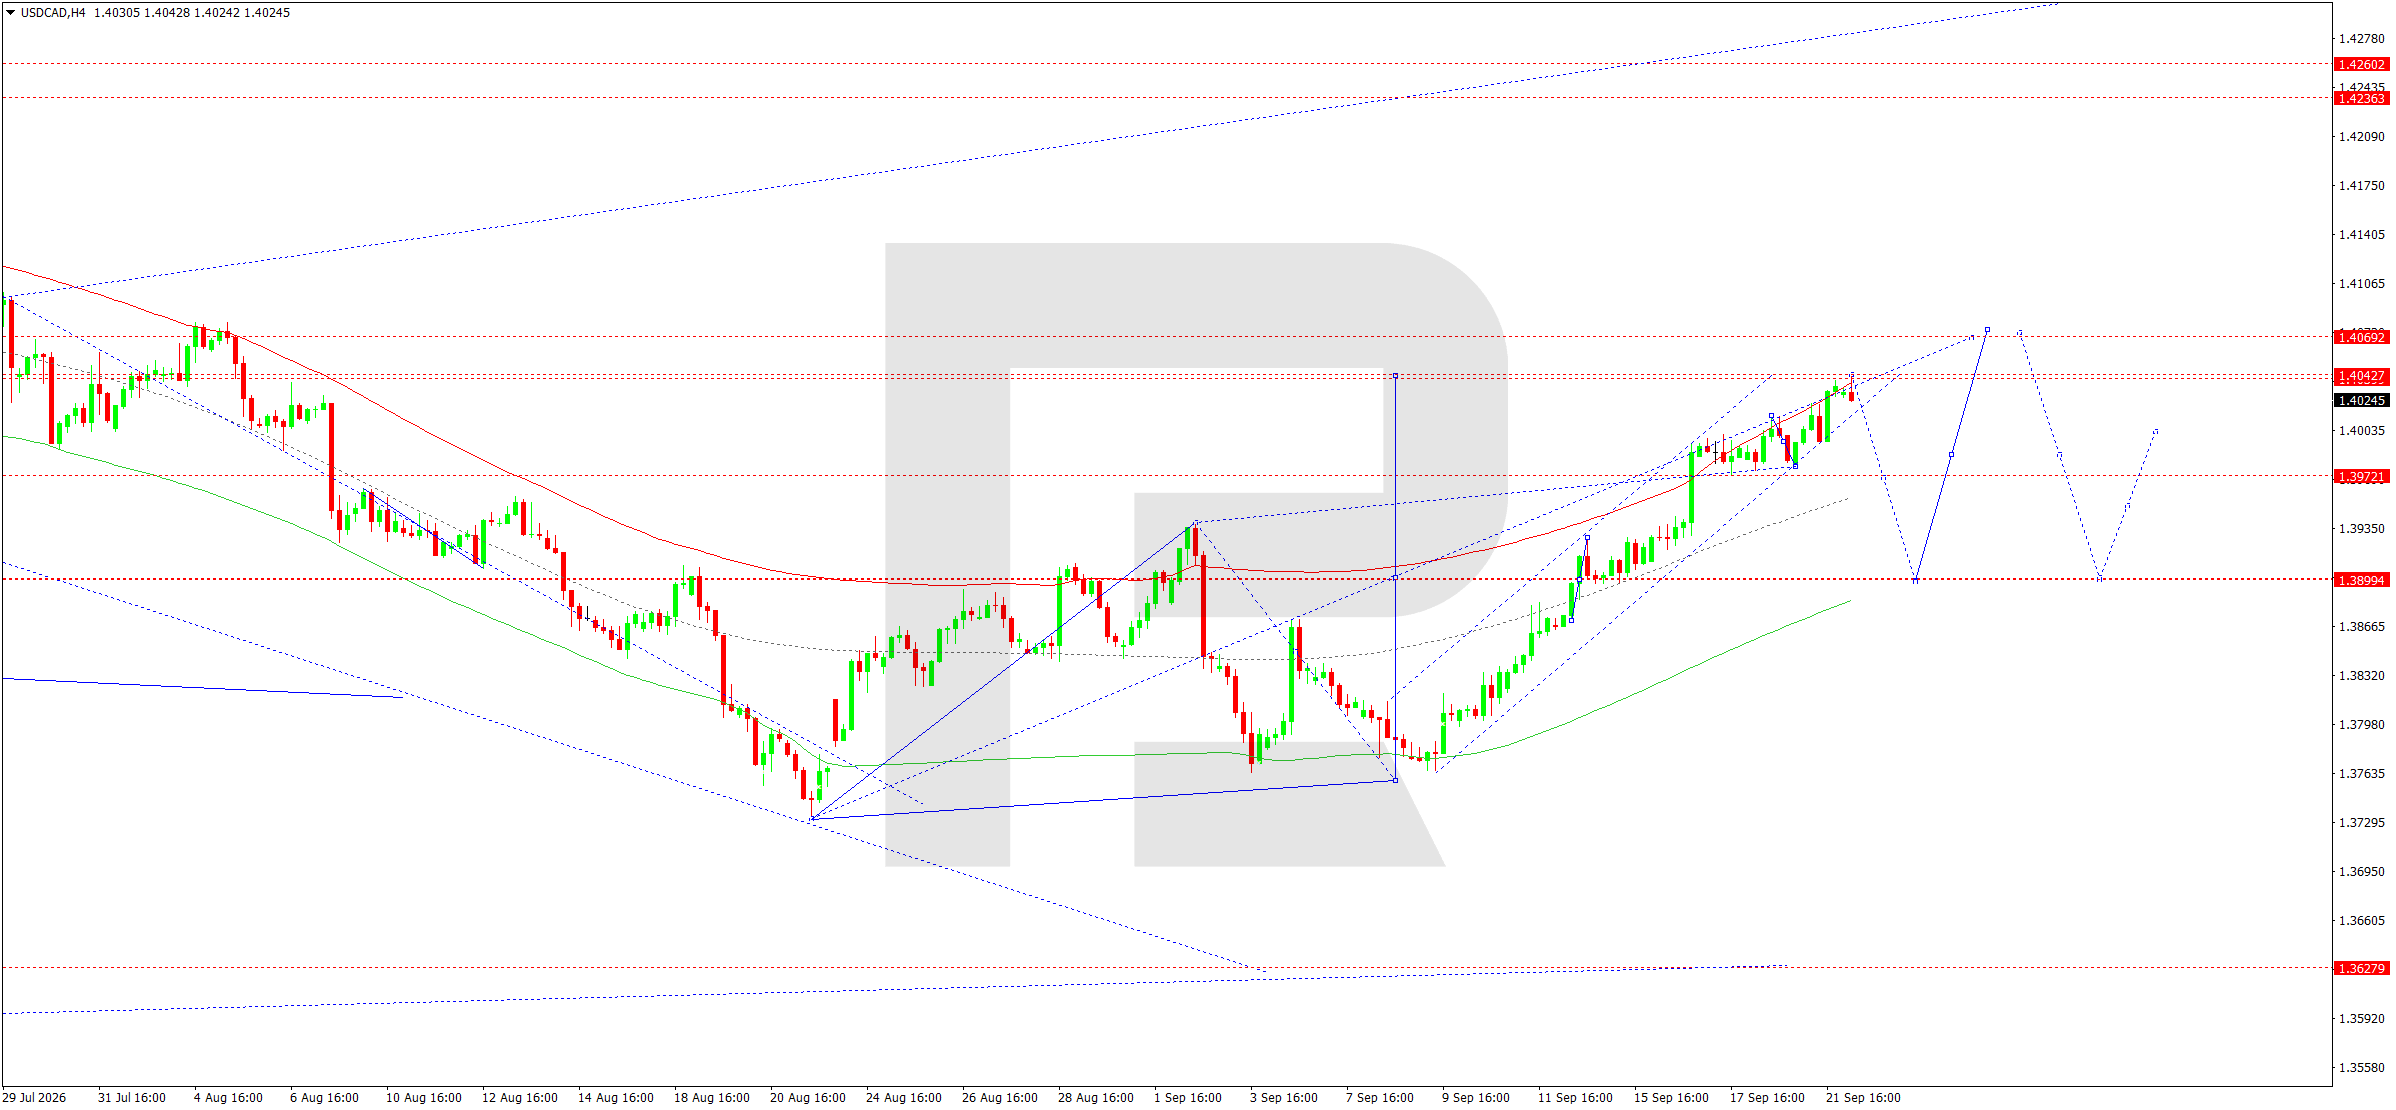
On the H4 chart, USDCAD completed a sustained upward wave and reached the 1.4042–1.4045 area. For 22 September, the main scenario is the formation of a compact range below this resistance. A brief move higher could test 1.4069–1.4070. However, failure to consolidate above 1.4045 would create the conditions for a correction to begin. A breakout below 1.4022 would confirm a move towards 1.3972 and then 1.3899.
The Elliott Wave structure and the rising-wave Matrix, with its pivot around 1.3899, show that the current impulse has approached the upper boundary of the Price Envelope. The 1.4042–1.4070 area is therefore viewed as a zone where the local upward phase may complete. The main corrective target remains the lower boundary of the Envelope at 1.3899. Intermediate support is located around 1.3972. If the market holds 1.3972 and returns above 1.4045, growth could resume towards 1.4069. For today, the technical preference is for selling from resistance.
USDCAD forecast scenario
Trading scenario: SELL
- Price at the time of writing: 1.4025
- Entry price: 1.4020
- Stop Loss: 1.4070
- Take Profit: 1.3899
- Risk-to-reward ratio: 1:2.42
The trade idea is valid until 8:00 AM on 23 September 2026 (server time, UTC+3).
XAUUSD forecast
As of 22 September 2026, the fundamental backdrop for gold remains mixed. The Federal Reserve raised the target rate range by 25 basis points to 3.75–4.00% on 16 September and highlighted persistent inflation risks. Expectations that rates will remain high for longer, together with the possibility of further tightening, are limiting demand for gold as a non-yielding asset. On Monday, pressure increased as the dollar strengthened, although the decline in the 10-year Treasury yield and persistent geopolitical uncertainty partly offset this factor.
On Tuesday morning, gold was holding near 4,340, while Brent remained above 100 USD per barrel. High energy prices support inflation expectations while also sustaining defensive demand for the metal. Expectations of diplomatic contacts over the Middle East remain another source of volatility. If the geopolitical premium falls, gold may come under renewed pressure. If tensions intensify or US bond yields continue to decline, the market will have room for corrective growth.
Fed officials have continued to point to the risk of strong demand and more persistent inflation following the September meeting. This supports the scenario of rates staying high for longer and limits gold's longer-term upside. At the same time, equities are recovering, reducing some safe-haven demand.
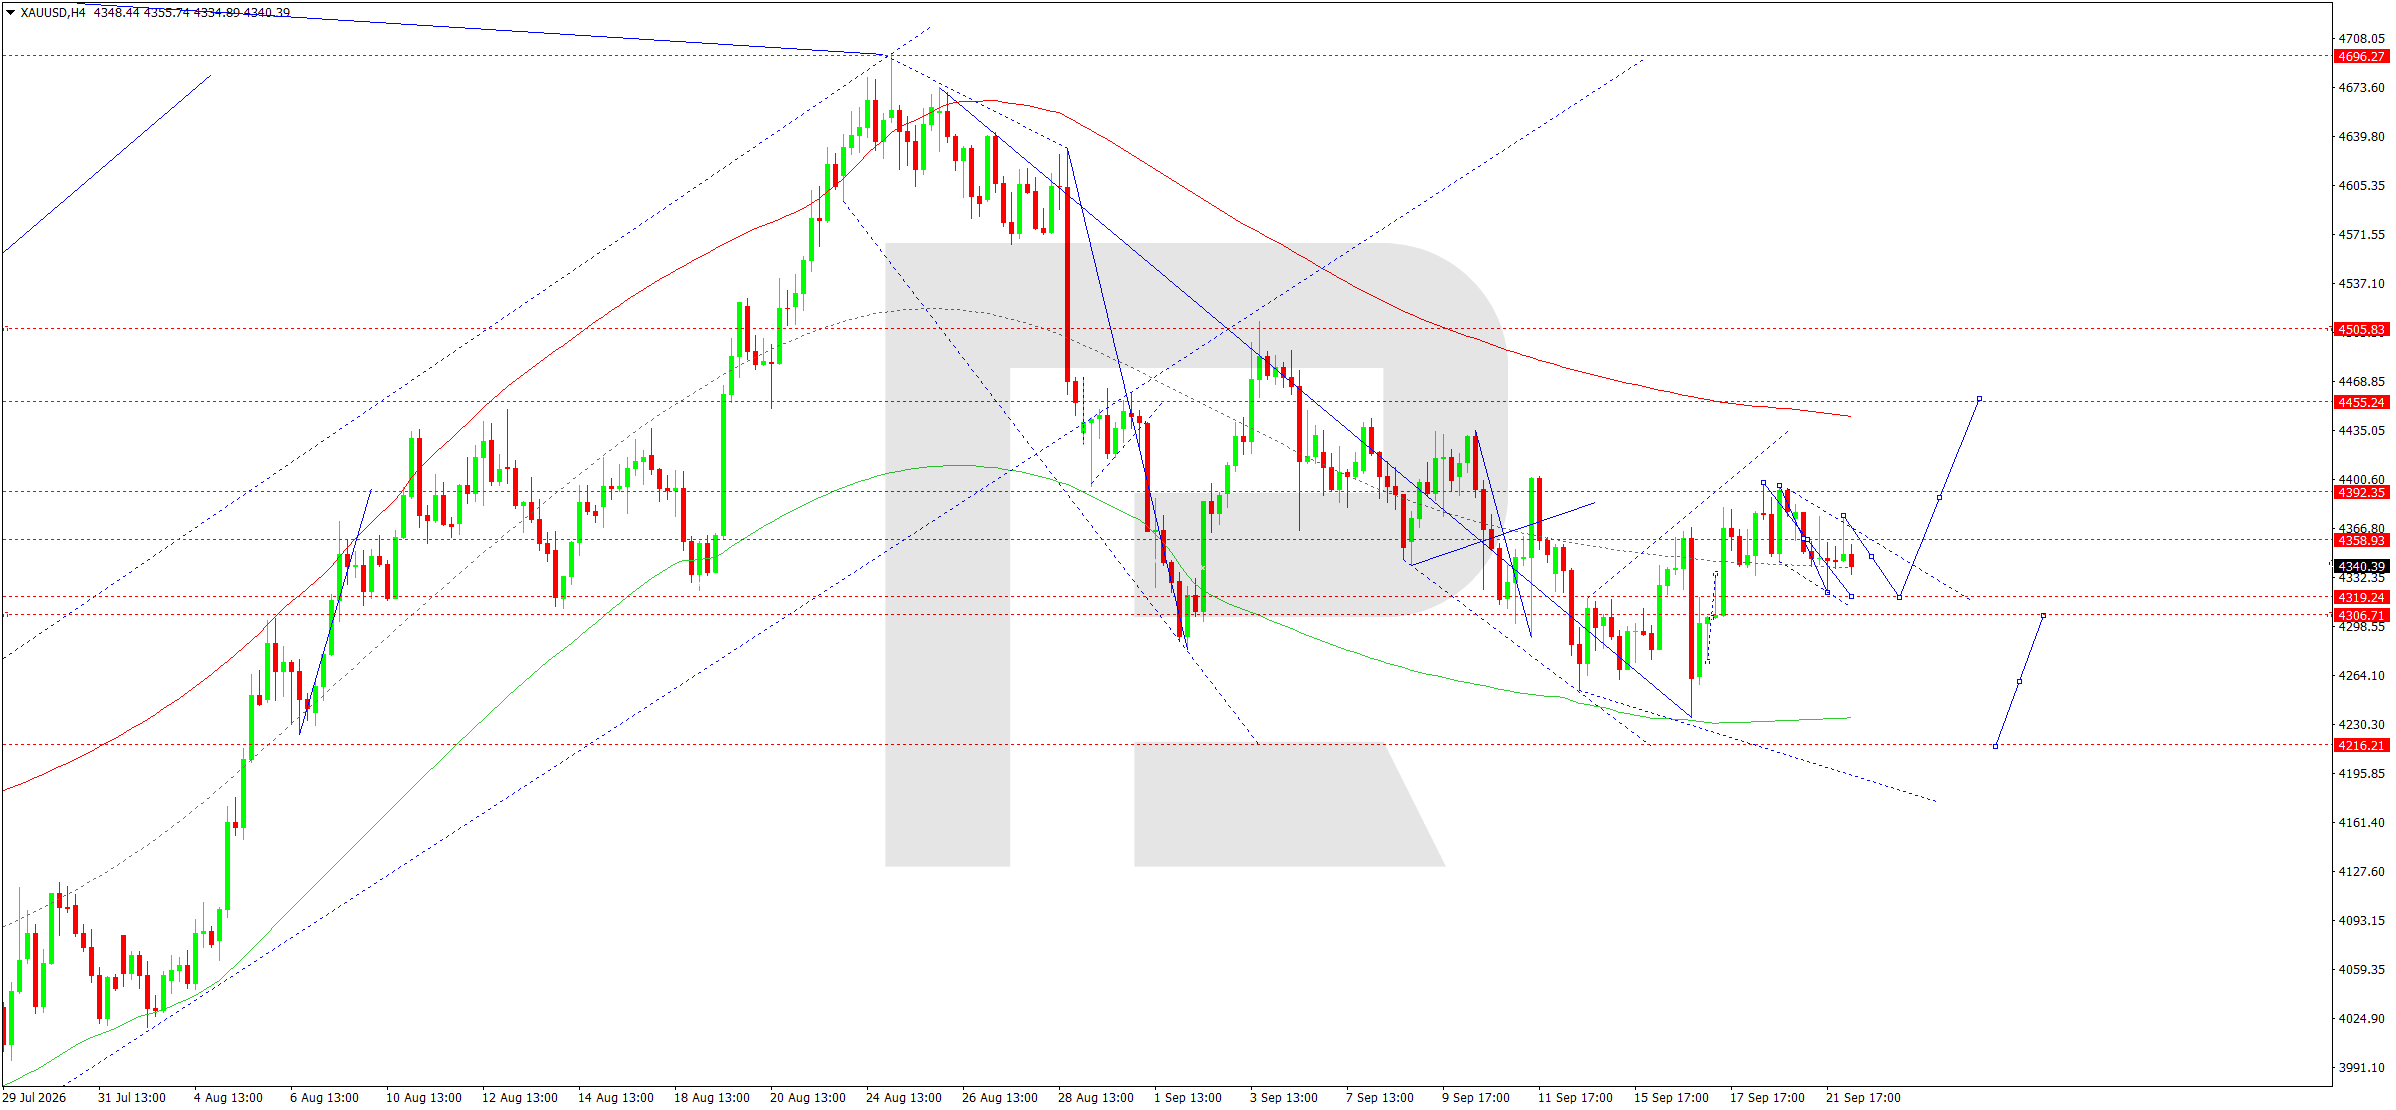
On the H4 chart, XAUUSD continues to develop a broad range around 4,358. The price remains within an expanding structure, with the nearest levels at 4,319–4,306 below and 4,392–4,455 above. For 22 September, the main short-term scenario is a recovery towards 4,392 and then 4,455. This rise is viewed as a correction within the broader downward wave.
The Elliott Wave structure and the declining-wave Matrix, with its pivot around 4,465, confirm that medium-term pressure remains. The market previously moved towards the lower part of the Price Envelope near 4,235 and then formed a recovery. The upper boundary of the Envelope is around 4,455 and remains the key corrective target. If the price fails to consolidate above this area, a return towards 4,333 and then 4,306 is likely. A firm breakout below 4,306 would open the potential for a move towards 4,216. Consolidation above 4,455 would allow the market to test the 4,506 area.
XAUUSD forecast scenario
Trading scenario: BUY
- Price at the time of writing: 4,340
- Entry price: 4,345
- Stop Loss: 4,319
- Take Profit: 4,455
- Risk-to-reward ratio: 1:4.23
The trade idea is valid until 8:00 AM on 23 September 2026 (server time, UTC+3).
US 500 forecast
As of 22 September 2026, the fundamental backdrop for the US 500 combines strong risk appetite with persistent pressure from the high cost of capital. The Federal Reserve raised the target rate range to 3.75–4.00% on 16 September, pointing to resilient economic activity and elevated inflation. The market continues to price in the possibility of another rate increase in the coming months, so bond yields remain an important constraint on equities.
At the same time, US indices recovered sharply on Monday: the S&P 500 gained around 1.5%, while the Nasdaq closed at a record high amid renewed demand for artificial-intelligence-related shares. The 10-year Treasury yield fell below 5%, providing additional support to technology-sector valuations. The decline in oil from recent highs also temporarily eased inflation concerns, although Brent remains above 100 USD per barrel. As a result, the short-term backdrop for the index remains constructive, but sensitivity to interest rates is still high.
Another factor is the diplomatic agenda surrounding the Middle East and expected contacts between the US and China. Improving expectations support risk appetite and cyclical sectors, while deterioration in the negotiation backdrop could push oil and yields higher again. The upward structure remains heavily dependent on large technology companies, so semiconductor-sector performance will be important for the sustainability of the impulse.
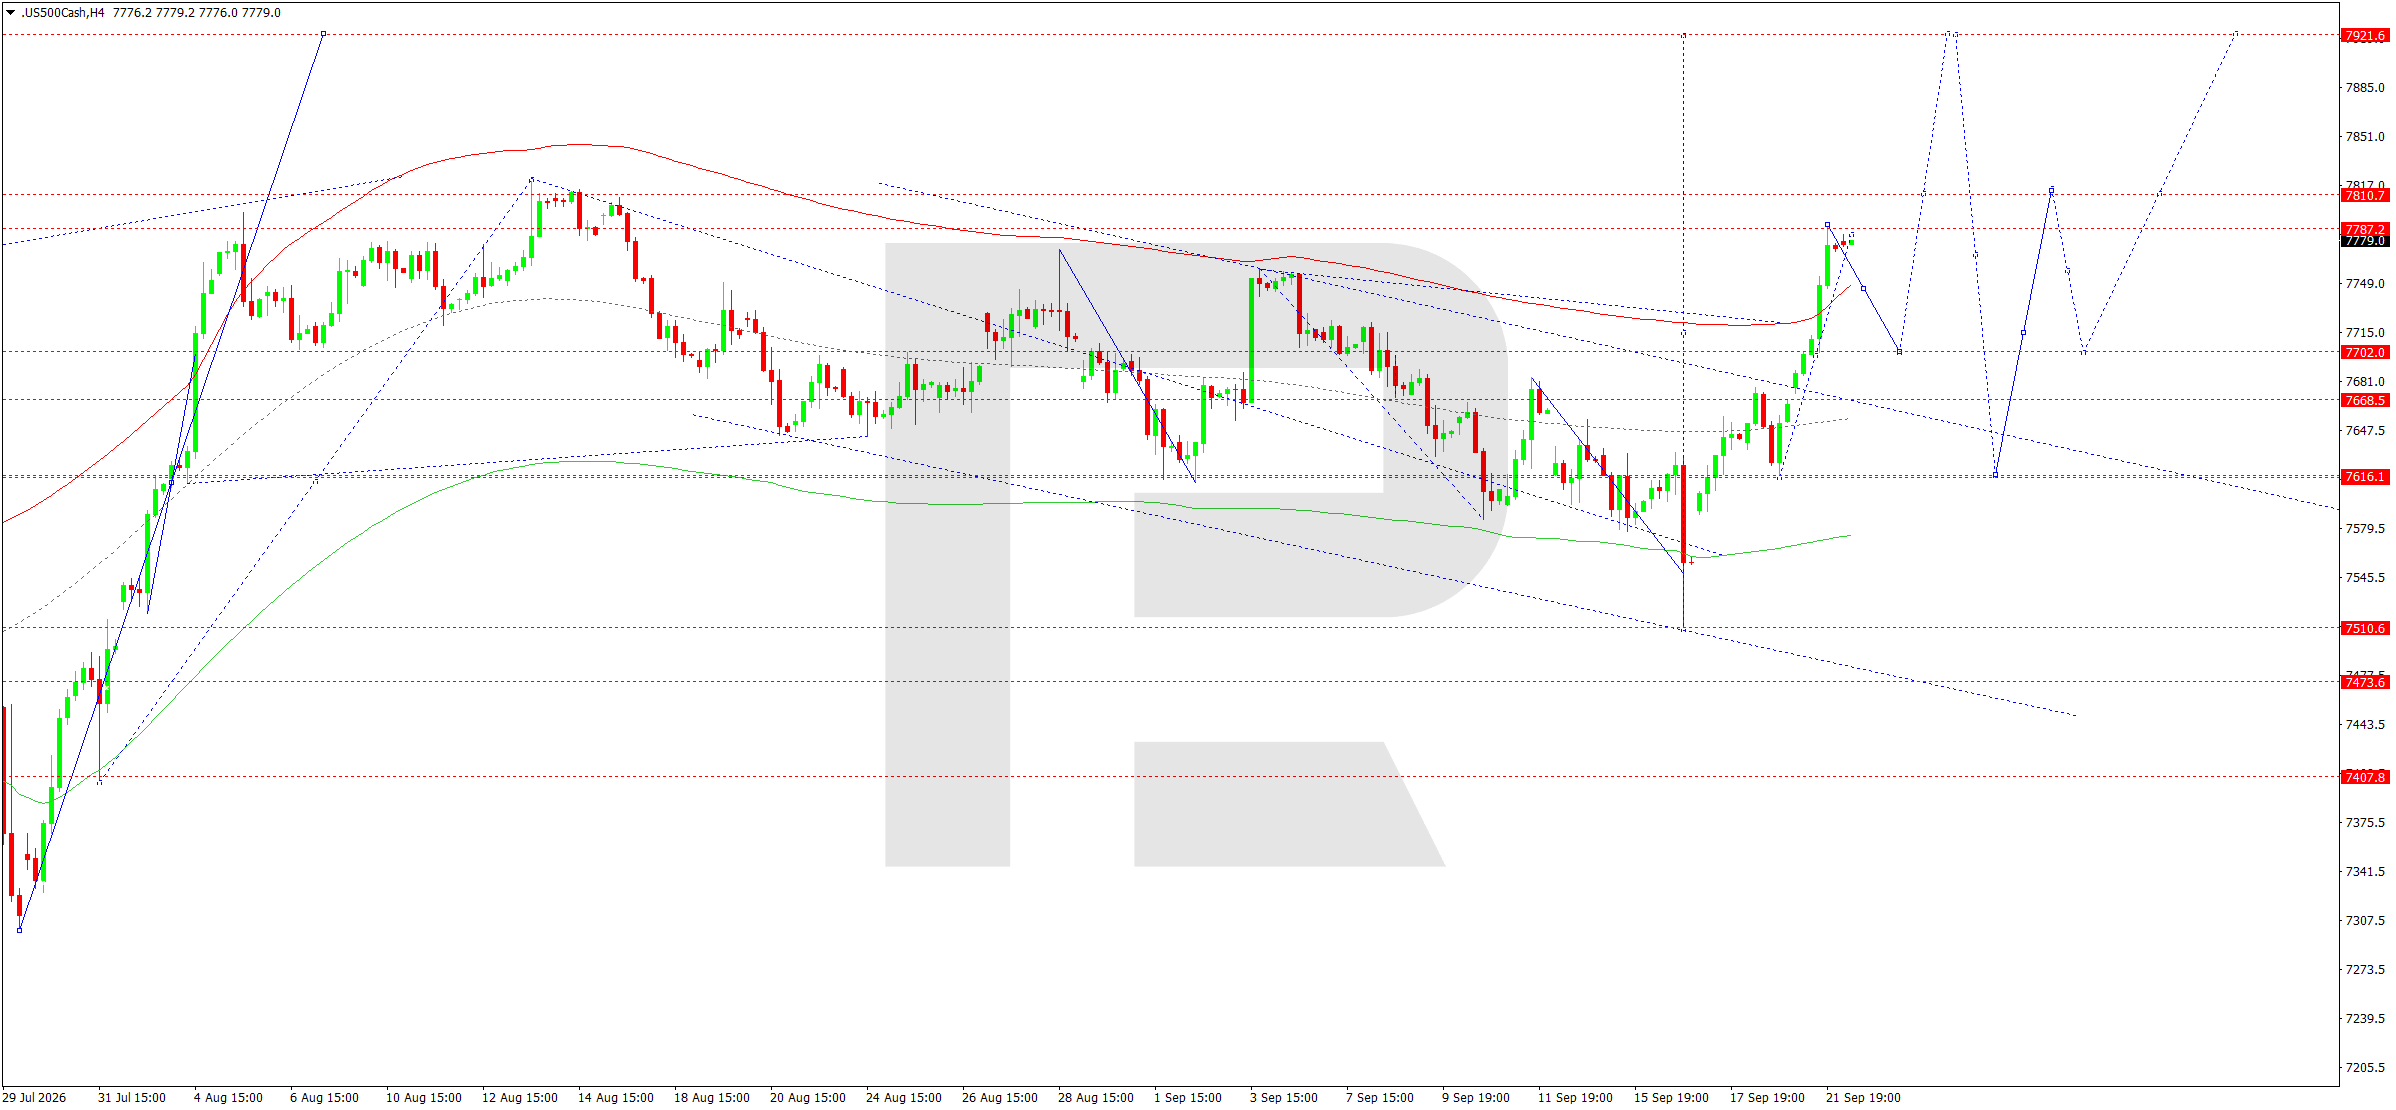
On the H4 chart, the US 500 completed an upward impulse towards 7,787 and formed a local consolidation directly below this resistance zone. On 22 September, another test of 7,810 is possible, but failure to consolidate above 7,787–7,810 would increase the probability of a correction towards 7,702. This level is central to the current structure and is the nearest main downside target.
The Elliott Wave structure and the rising-wave Matrix, with its pivot around 7,702, show that the market is completing a local upward phase near the upper part of the range. The price has already broken above the descending channel line but is now in an area where supply appeared previously. A return below 7,770 would increase selling pressure and open the way towards 7,702 and then 7,668. A breakout below 7,702 would extend the correction towards 7,616. If the market consolidates firmly above 7,810, the next technical target will be the 7,922 area. For today, the technical preference is for selling from resistance after the strong impulse in the previous session.
US 500 forecast scenario
Trading scenario: SELL
- Price at the time of writing: 7,779
- Entry price: 7,774
- Stop Loss: 7,811
- Take Profit: 7,702
- Risk-to-reward ratio: 1:1.95
The trade idea is valid until 8:00 AM on 23 September 2026 (server time, UTC+3).
BTCUSD forecast
As of 22 September 2026, the fundamental backdrop for BTCUSD has improved markedly following a sharp recovery in risk appetite. On Monday, Bitcoin rose by more than 6% and reached an eight-month high above 87,000 amid inflows into exchange-traded funds, a short squeeze and a broader rally in technology shares. Recent steps by US regulators to develop tokenised-asset infrastructure also provided additional support to the market.
At the same time, the Federal Reserve raised the target rate range to 3.75–4.00% on 16 September, and market participants continue to factor in the possibility of further tightening. The high cost of capital and the risk of another rise in Treasury yields remain the main macroeconomic risks for cryptocurrencies. Regulatory uncertainty also persists: last week, the US Senate failed to advance a comprehensive bill on the structure of the crypto market, while reports emerged today of an investigation into Binance over compliance with the sanctions regime.
An important external factor remains Bitcoin's correlation with US technology assets. While the Nasdaq and semiconductor sector retain momentum, demand for BTC receives support even with the Fed maintaining a hawkish stance. The decline in oil from recent highs has also eased some inflation concerns. However, if US yields resume their rise, the crypto market could quickly shift from strong risk appetite to profit-taking. On Tuesday morning, after reaching an eight-month high, Bitcoin was already showing a local pullback.
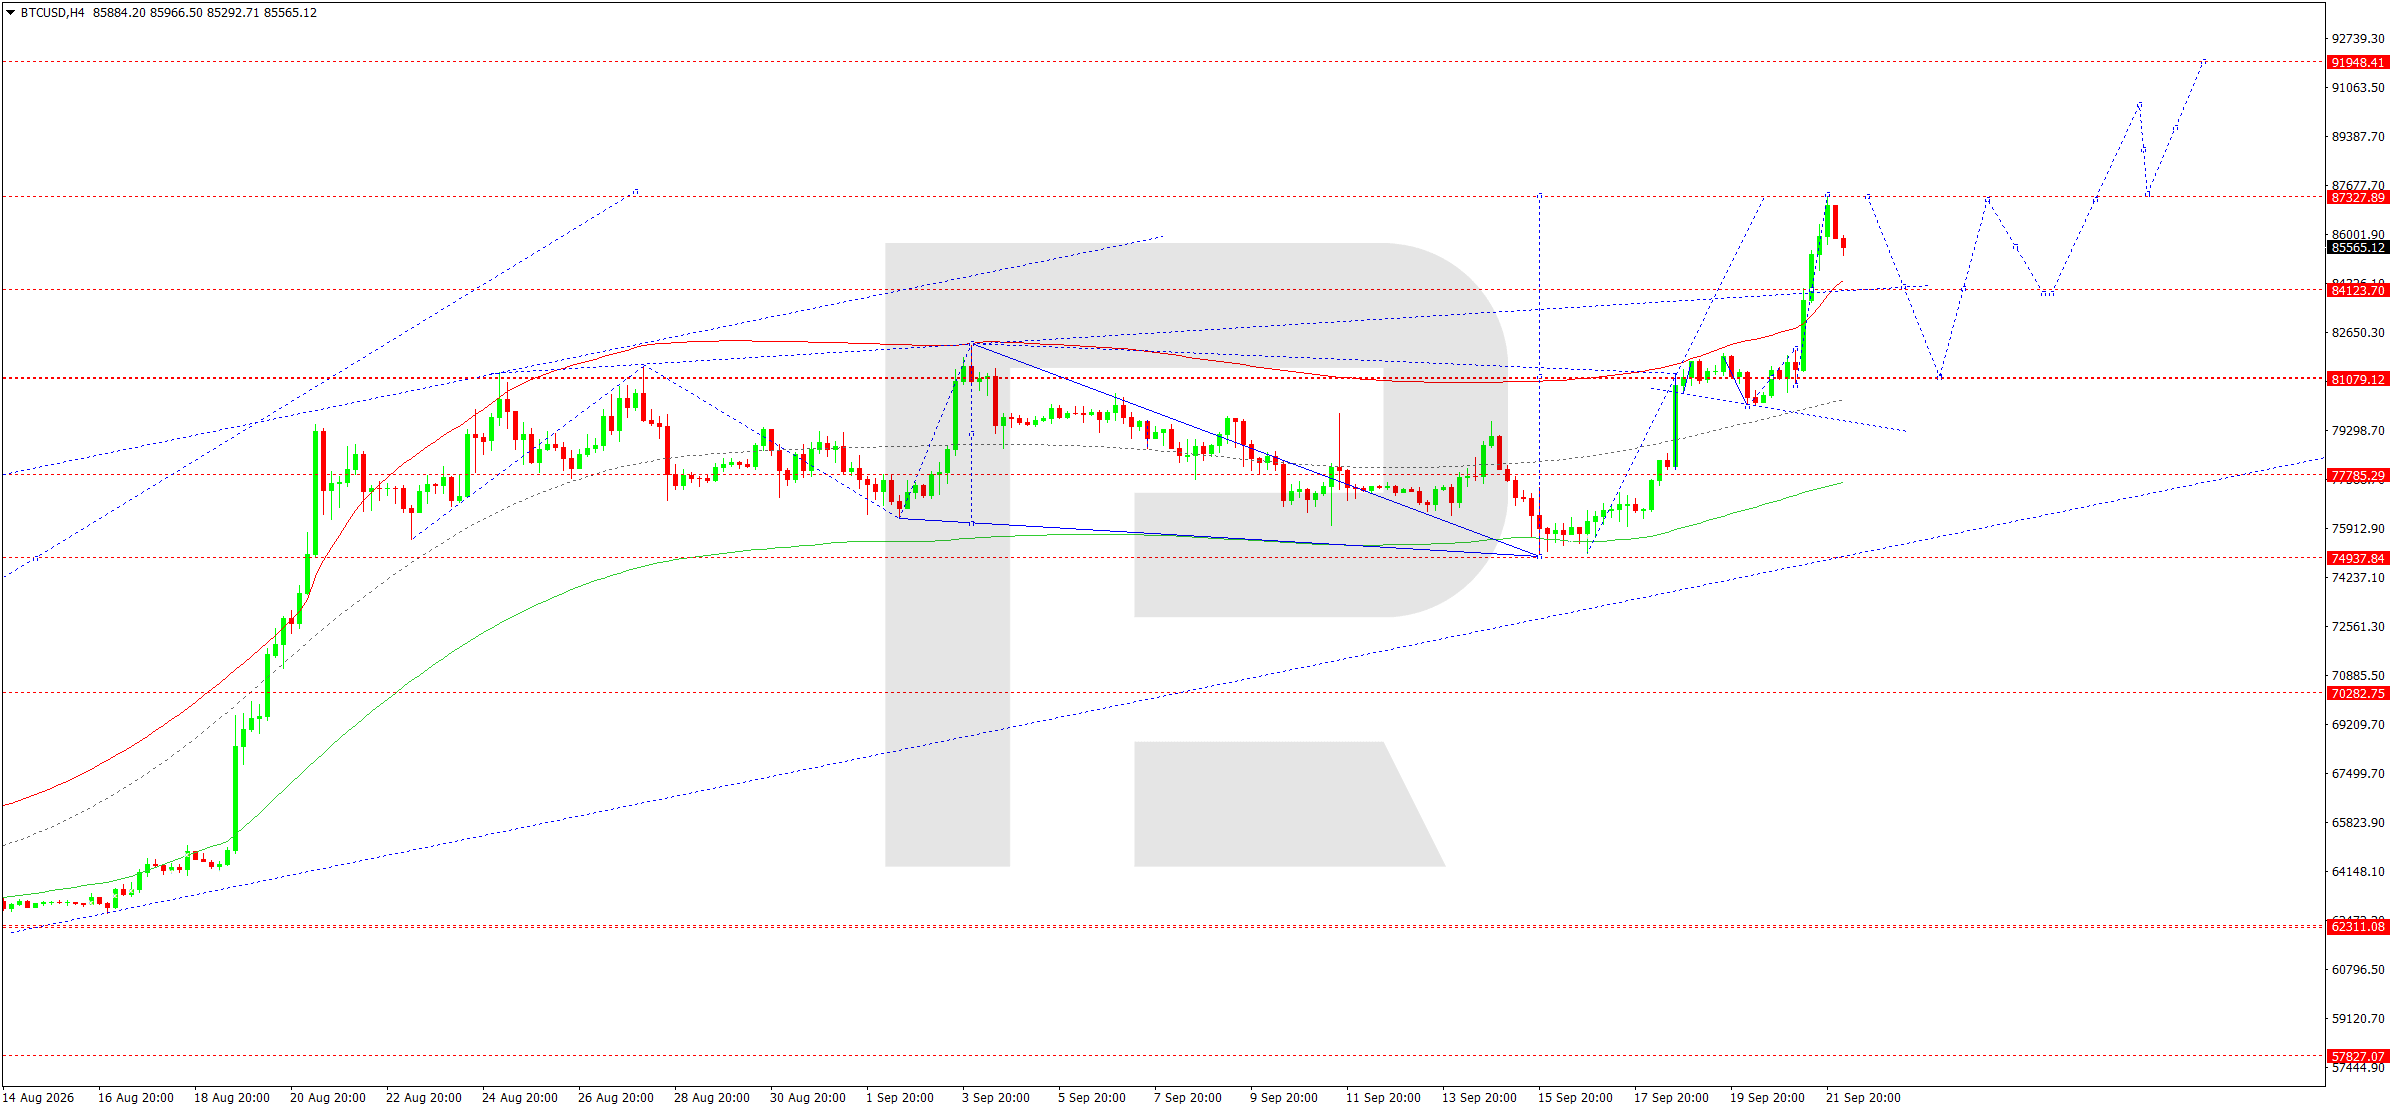
On the H4 chart, BTCUSD completed a strong upward wave from the 81,079 area towards 87,327 and formed a local consolidation directly below resistance. For 22 September, the main scenario is a correction after the impulse has completed. The first downside target is the 84,124 area, and if this level is broken, the market may continue towards 81,079. Once support forms in this area, growth may resume towards 87,327 and then 91,910.
The Elliott Wave structure and the rising-wave Matrix, with its pivot around 81,080, confirm the key role of this area. The price reached the upper boundary of the Price Envelope near 87,327, increasing the probability of a return towards its central line. While the market remains below 87,327, sellers retain the short-term advantage. A firm breakout below 84,124 would strengthen the corrective scenario and open the way towards 81,079. If this support holds, a new upward wave could send the price towards 91,910–91,948. An early consolidation above 87,327 would invalidate the deeper-correction scenario.
BTCUSD forecast scenario
Trading scenario: SELL
- Price at the time of writing: 85,565
- Entry price: 85,560
- Stop Loss: 87,327
- Take Profit: 81,079
- Risk-to-reward ratio: 1:2.54
The trade idea is valid until 8:00 AM on 23 September 2026 (server time, UTC+3).
Editors’ picks
 EURUSD forecast 2026–2027: technical analysis, price levels & predictions
The EURUSD outlook for 2026 and 2027: key levels on the daily chart, three trading scenarios and the policy gap between the Fed and the ECB that drives the pair.
 Gold (XAUUSD) forecast 2026: technical analysis, price levels & predictions
Where gold could trade in 2026: key levels, three trading scenarios with entry triggers and the forecasts from J.P. Morgan, Deutsche Bank and Goldman Sachs.
Forecasts presented in this section only reflect the author’s private opinion and should not be considered as guidance for trading. RoboForex bears no responsibility for trading results based on trading recommendations described in these analytical reviews.