
Daily technical analysis and forecast for 23 September 2026
Daily technical analysis and forecast for EURUSD, USDJPY, GBPUSD, AUDUSD, USDCAD, XAUUSD, US 500, and BTCUSD for 23 September 2026.
Each scenario on this page reflects the market structure on the H4 chart as of 10:00 UTC+3 on 23 September 2026. The assessment considers the current H4 chart structure, key support and resistance levels, the direction of the medium-term movement, and the prevailing fundamental backdrop.
EURUSD forecast
As of 23 September 2026, EURUSD remains under pressure from a strong dollar despite a more hawkish stance from the European regulator. The European Central Bank raised its key rates by 25 basis points on 10 September, taking the deposit rate to 2.50%. The decision was explained by persistent inflationary pressure, primarily linked to expensive energy and the conflict in the Middle East. The final eurozone inflation estimate for August was 3.2% year-on-year, while core inflation held around 2.4%, so the possibility of further ECB tightening remains.
However, the yield advantage remains on the dollar's side. The Federal Reserve raised the target rate range to 3.75–4.00% on 16 September, highlighting resilient economic activity and elevated inflation. August CPI accelerated to 3.4% year-on-year, while retail sales rose by 1.2% month-on-month, confirming that domestic demand remains firm. On 22 September, Fed officials again emphasised elevated inflation risks. Against this backdrop, the US dollar index is holding near two-month highs, while the euro was trading around 1.1446 on the morning of 23 September.
Energy-market dynamics are another factor. Brent was holding near 99 USD on the morning of 23 September after declining on reports of restored supply through Saudi infrastructure and hopes of diplomatic progress surrounding Iran. Cheaper energy slightly reduces inflation risks for the eurozone, but at the same time lessens the need for aggressive ECB tightening. The picture for the dollar remains more resilient: US bond yields are still high, and the market continues to price in the possibility of another Fed rate increase. Therefore, the fundamental balance at the start of the European session remains moderately negative for EURUSD, although news from the Middle East could trigger sharp corrective moves.
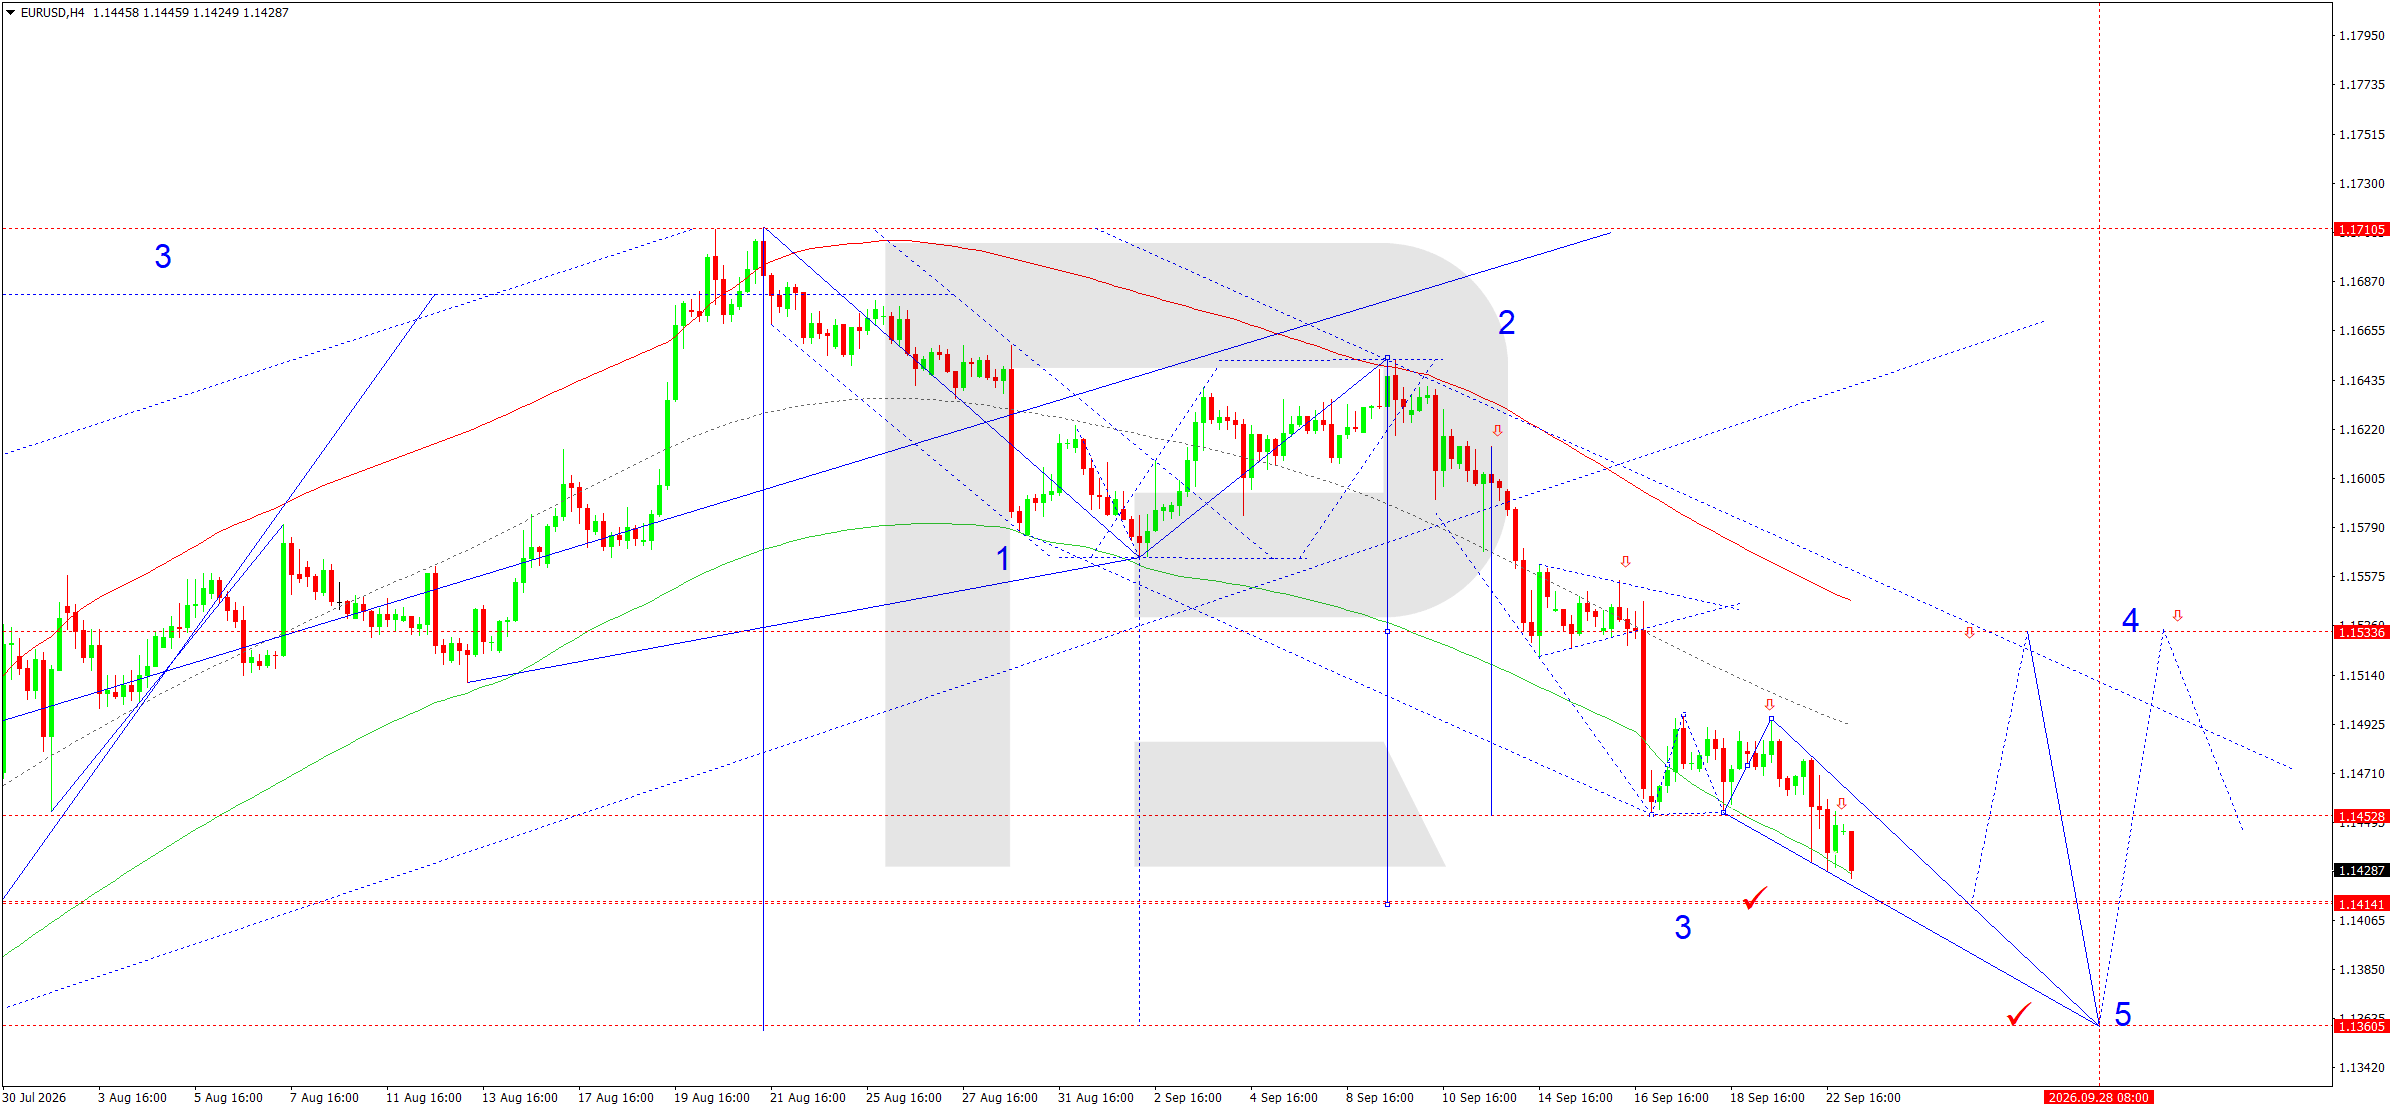
On the H4 chart, a pronounced downward structure remains intact. After rejecting 1.1475, the market broke below 1.1452 and continued to form the third downward wave. The current price around 1.1429 is below the descending averages and beneath the central part of the Price Envelope, preserving the sellers' advantage. The Elliott Wave structure and the wave Matrix with a pivot around 1.1535 confirm the scenario of further decline.
On H1, the bias also remains bearish: a sequence of lower highs confirms continued pressure within the current sellers' channel.
The nearest target is 1.1415. Before it is tested, a local correction towards 1.1452 is possible and would be viewed as a retest of the broken support from below. While the price remains below 1.1452–1.1475, any recovery does not change the main direction. A firm breakout below 1.1415 would open the way towards 1.1361, where the chart shows the next projected target of the fifth wave. A return above 1.1475 would weaken the pressure and require a reassessment of the short-term wave count, but the main scenario for the day remains selling in line with the continuation of the current impulsive structure.
EURUSD forecast scenario
Trading scenario: SELL
- Price at the time of writing: 1.1429
- Entry price: 1.1424
- Stop Loss: 1.1453
- Take Profit: 1.1361
- Risk-to-reward ratio: 1:2.17
The trade idea is valid until 8:00 AM on 24 September 2026 (server time, UTC+3).
USDJPY forecast
As of 23 September 2026, USDJPY remains near 157.50, while the fundamental backdrop continues to be highly volatile. The Bank of Japan raised its short-term policy rate to 1.25% on 18 September, the highest level in 31 years. The regulator indicated that further steps would depend on inflation, but the absence of a hawkish signal about rapid follow-up increases and two votes against the decision limited support for the yen. After the meeting, the Japanese currency weakened and the market once again focused on the yield differential between the US and Japan.
The Federal Reserve raised the target rate range to 3.75–4.00% on 16 September and highlighted persistent upside inflation risks. August CPI reached 3.4% year-on-year, while strong retail sales and a resilient labour market give the Fed room for further tightening. On 22 September, US officials again stressed that inflation remains a more important risk than weakening employment. This supports the dollar and keeps USDJPY at elevated levels.
The possibility of FX intervention remains another factor. After USDJPY rose towards the 157–158 area, Japanese authorities have been closely monitoring the exchange rate, while the market previously reacted to reports of rate checks. This threat can accelerate downward pullbacks even while the dollar remains strong. At the same time, lower oil prices slightly ease inflation pressure for import-dependent Japan. At the start of the day, the fundamental balance remains mixed: Fed rates support the dollar, while intervention risk and BoJ tightening support the yen.
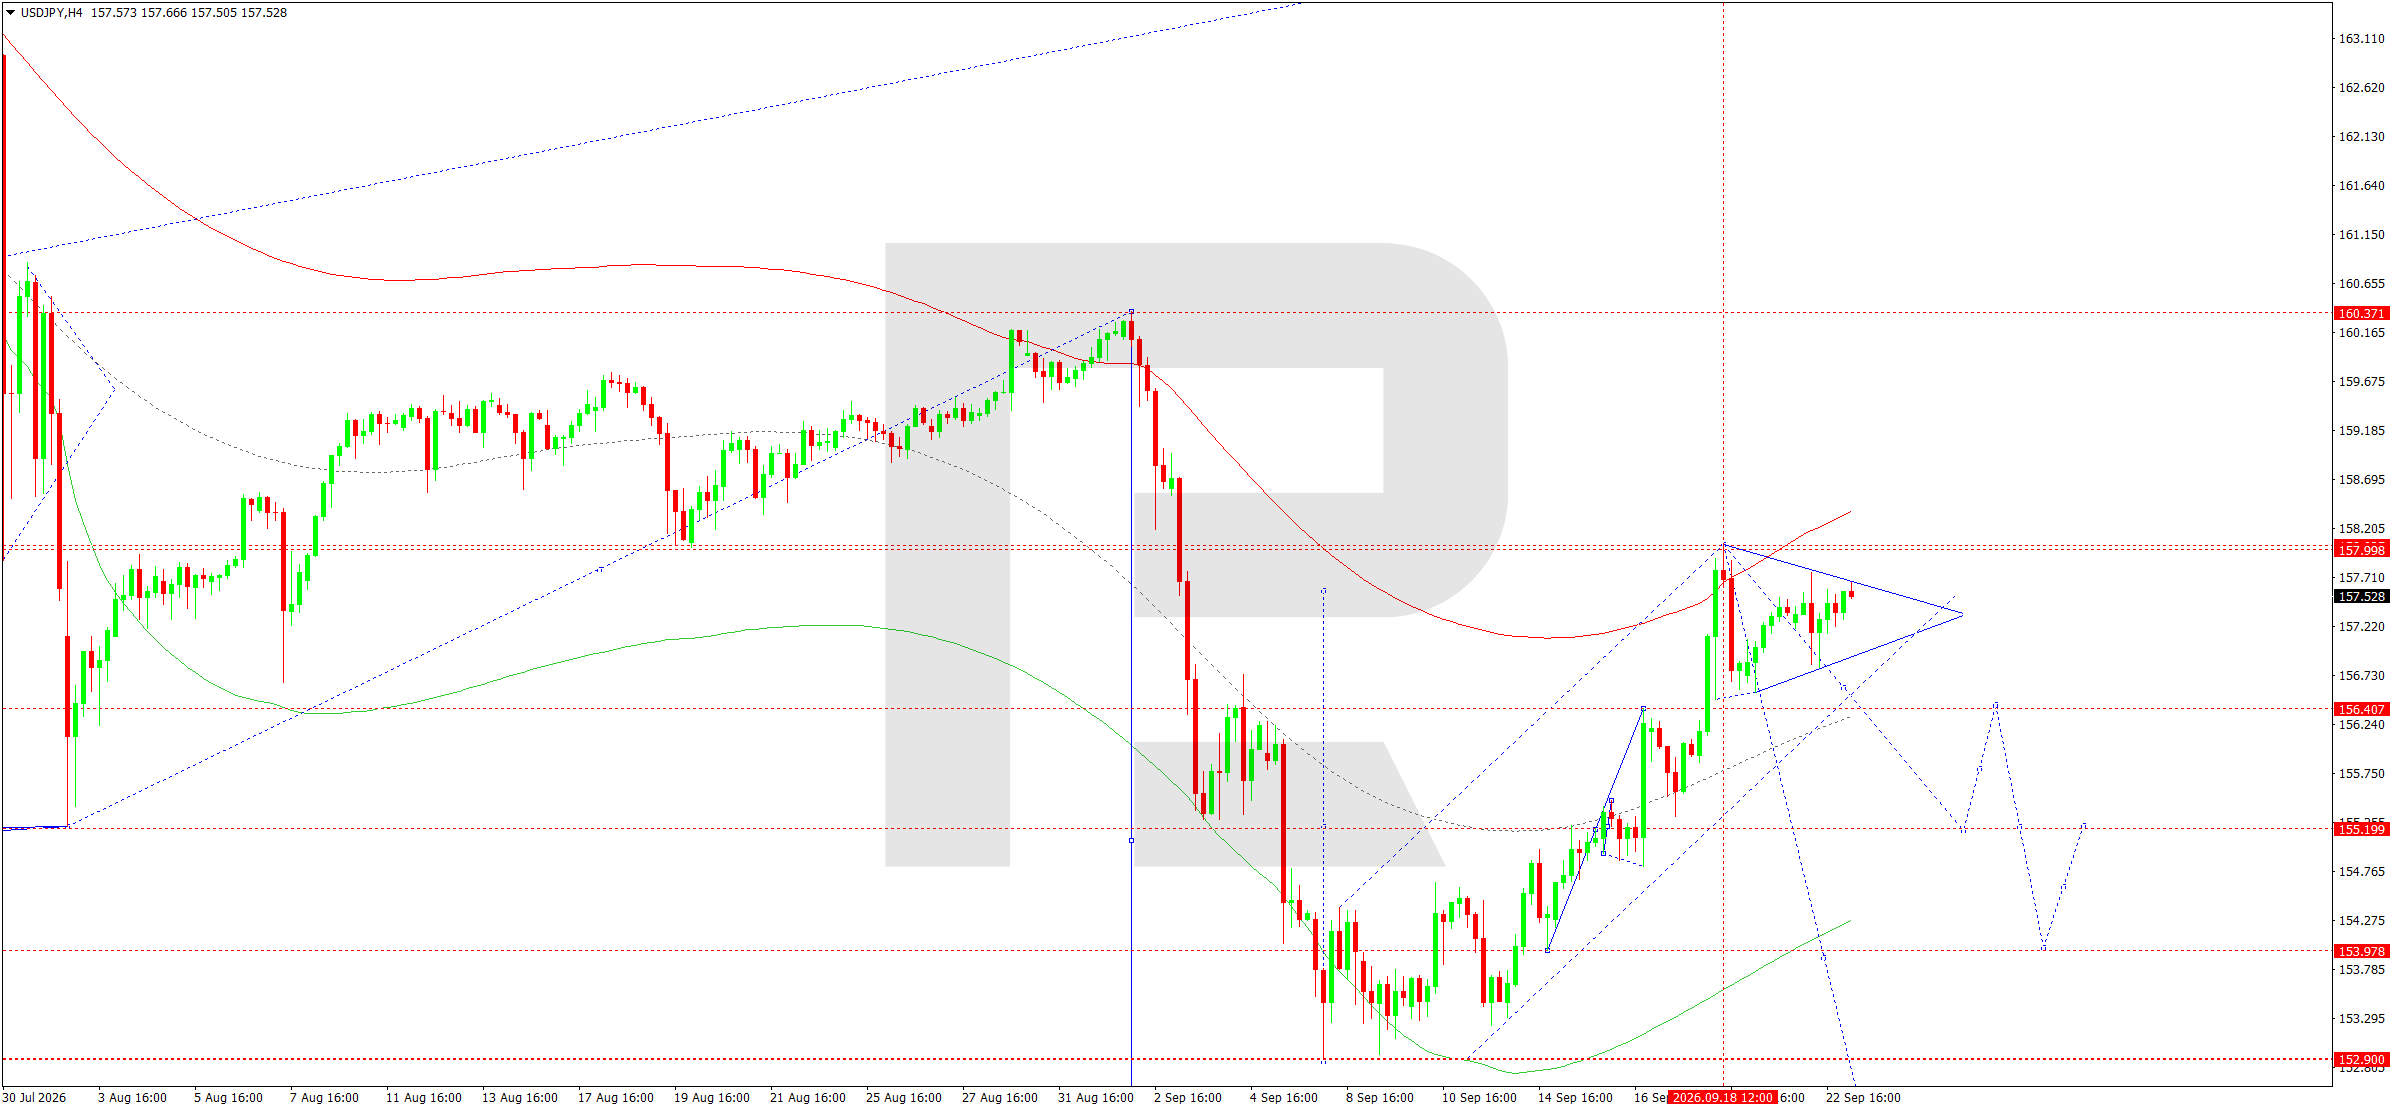
On the H4 chart, the pair found support around 156.82 and formed an upward wave towards 157.60. The current price around 157.53 is consolidating below the upper boundary of the local structure and near the descending average. A narrowing triangle is forming, increasing the probability of an impulsive breakout. The Elliott Wave structure and the rising-wave Matrix with a pivot around 155.05 allow for the start of a correction from the upper boundary of the Price Envelope.
On H1, the reaction to 157.60–158.00 is important.
Failure to consolidate above this area would confirm buyer weakness and create a convenient zone for the decline to continue. The sequence of lower highs remaining intact after a breakout from the triangle would provide additional confirmation of the scenario. Conversely, a rapid return above 158.00 would indicate a false downside breakout and increase the probability of further growth. Therefore, the price reaction at resistance will be particularly important today.
The main scenario assumes a decline towards the central line of the Envelope in the 156.50–156.70 area. A breakout below 156.40 would increase pressure and open the way towards 155.20, where the next pivot is expected to form. If the decline continues, the target will be 154.00. The alternative scenario would require consolidation above 158.00; in that case, the bearish idea would be postponed. Until that happens, selling from the current area is technically consistent with the expected correction.
USDJPY forecast scenario
Trading scenario: SELL
- Price at the time of writing: 157.53
- Entry price: 157.48
- Stop Loss: 158.00
- Take Profit: 156.50
- Risk-to-reward ratio: 1:1.88
The trade idea is valid until 8:00 AM on 24 September 2026 (server time, UTC+3).
GBPUSD forecast
As of 23 September 2026, the pound remains under pressure near two-month lows against the dollar. The Bank of England kept the policy rate unchanged at 3.75% on 17 September by a 6–3 vote, while three committee members preferred an increase to 4.00%. The regulator noted that the conflict in the Middle East continues to support high energy prices and could intensify inflation in the coming quarters. UK August CPI accelerated to 3.1% year-on-year, while core inflation remained around 2.6% and services inflation around 3.4%.
On the other hand, the Federal Reserve raised the target rate range to 3.75–4.00% on 16 September. The acceleration in US inflation to 3.4% and a 1.2% rise in retail sales strengthened expectations of a longer period of tight policy. This supports Treasury yields and demand for the dollar, leaving GBPUSD vulnerable to further declines.
Weak fiscal data have become an additional negative factor for sterling. UK public borrowing in August came in above expectations, reducing fiscal room ahead of the October budget. At the same time, reports of a possible reopening of the Strait of Hormuz pushed oil lower and partly reduced the risk of a new energy shock. For the pound, this is a mixed factor: lower energy prices help the inflation outlook but may weaken expectations of future BoE rate increases. Therefore, the fundamental backdrop at the start of the day remains broadly neutral to negative for GBPUSD.
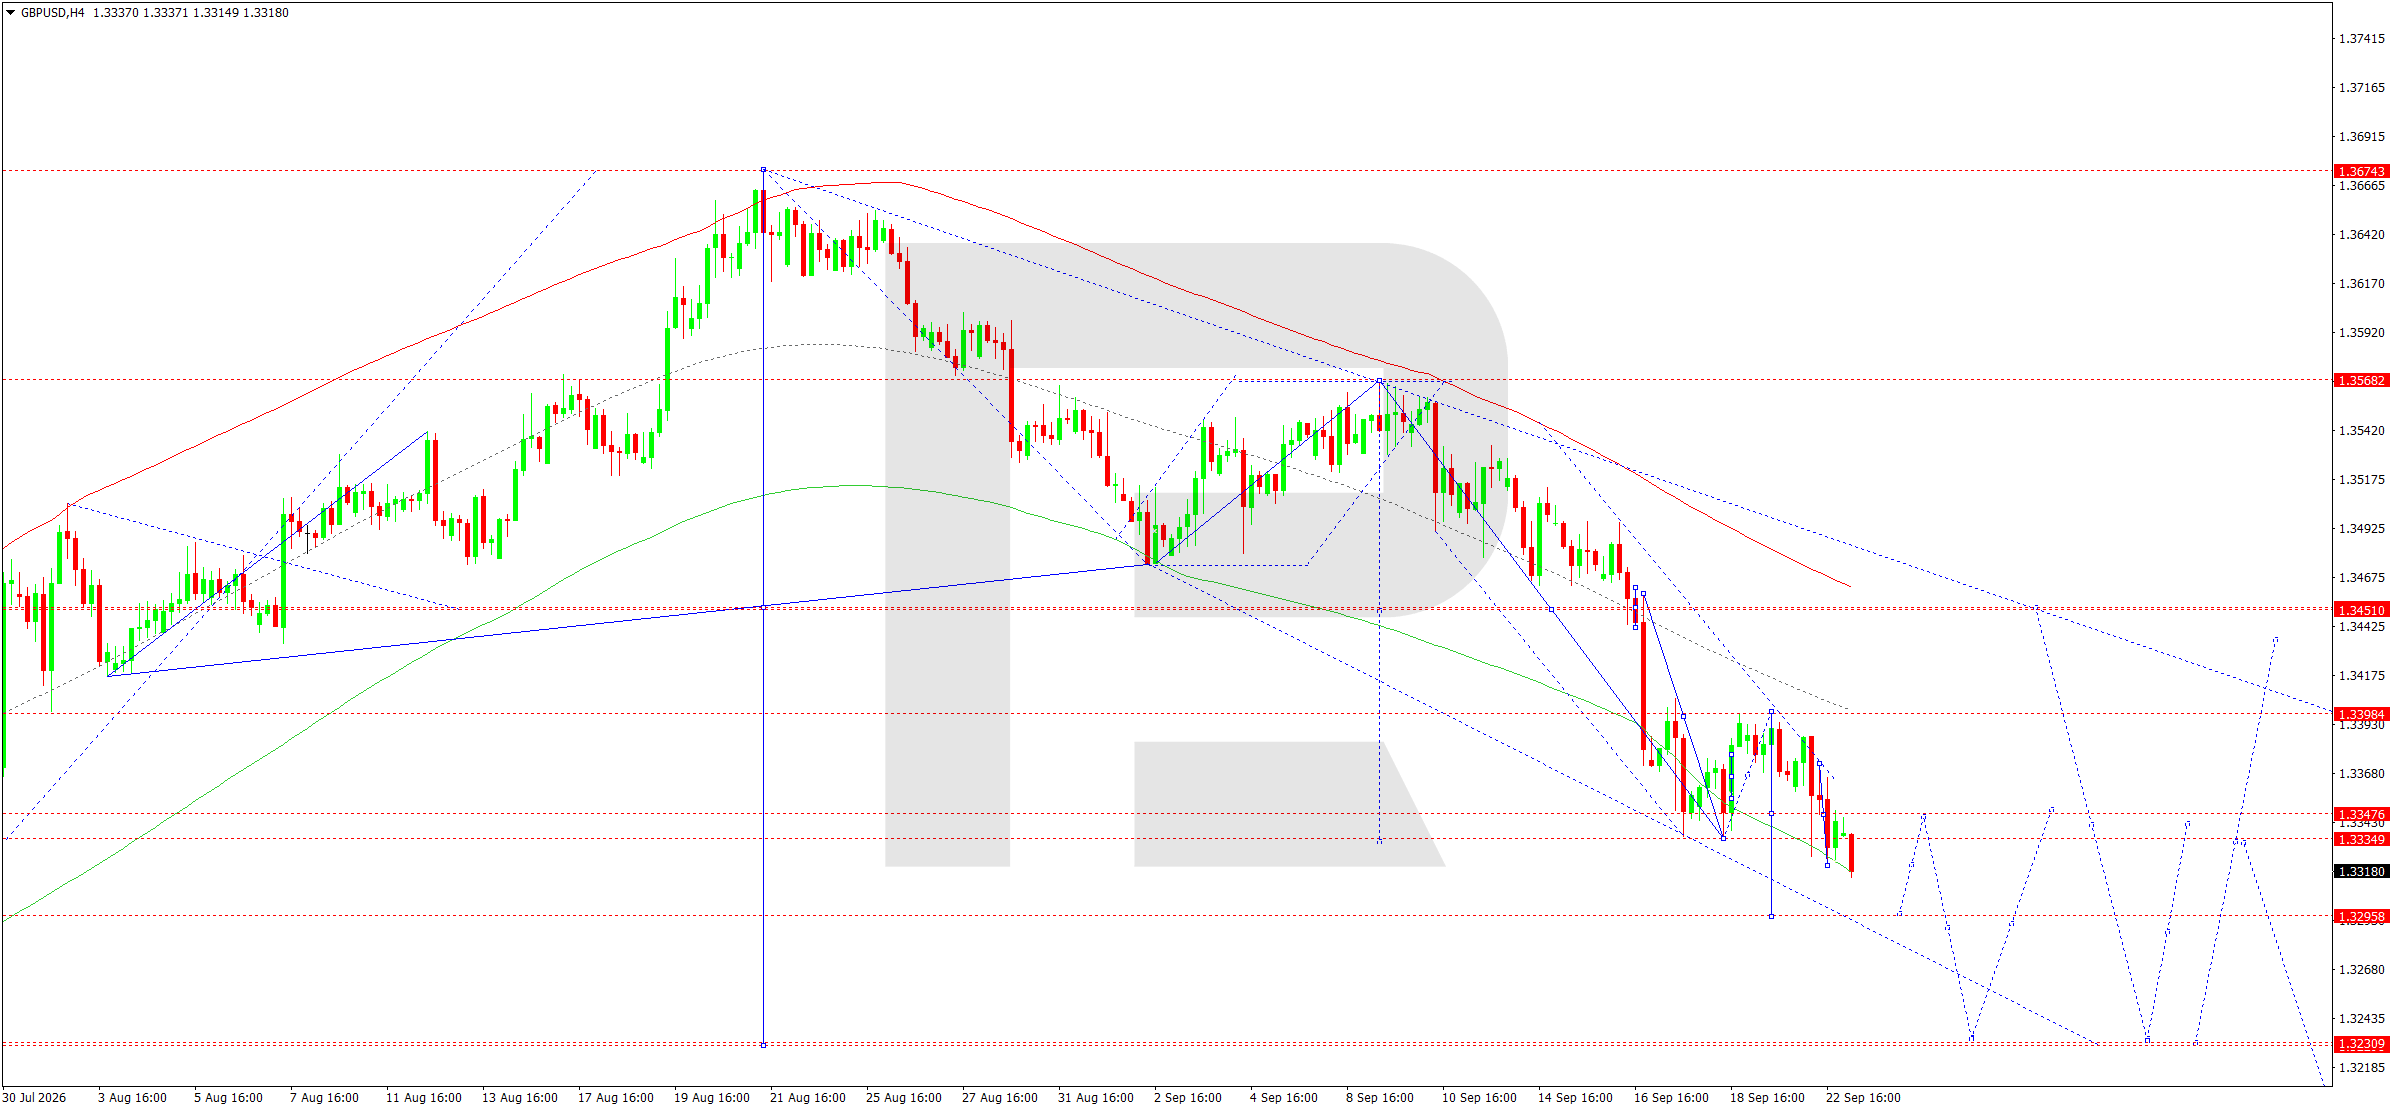
On the H4 chart, the pair continues to maintain a steady downward structure. After breaking below 1.3450, the market accelerated its decline and reached the 1.3315 area. The current price around 1.3318 is below the main averages and within a descending channel, confirming the sellers' advantage. The Elliott Wave structure and the declining-wave Matrix with a pivot around 1.3452 remain consistent with a continuation of the impulse.
The Price Envelope also points to persistent pressure: the market has reached its lower boundary around 1.3315, so a technical pause is possible before another downward impulse. If the correction remains limited to the 1.3340 area, this will confirm that sellers remain in control. Another reference point is 1.3335: failure to consolidate above it would increase the probability of a quick return below 1.3315 and a move towards the next support level.
The main trend over the relevant horizon remains bearish while the price holds firmly below the 1.3398–1.3450 area.
The nearest target is 1.3295. Before it is reached, a correction towards 1.3340–1.3348 is possible, where local resistance and the lower part of the previously broken range are located. Such a return would be viewed as a retest from below. A breakout below 1.3295 would open the way towards 1.3231, the next projected H4 target. On H1, the sequence of lower highs remains intact, so while the price stays below 1.3348, any recovery looks corrective. Consolidation above 1.3398 would be the first sign of weakening in the bearish scenario.
GBPUSD forecast scenario
Trading scenario: SELL
- Price at the time of writing: 1.3318
- Entry price: 1.3313
- Stop Loss: 1.3348
- Take Profit: 1.3231
- Risk-to-reward ratio: 1:2.34
The trade idea is valid until 8:00 AM on 24 September 2026 (server time, UTC+3).
AUDUSD forecast
As of 23 September 2026, AUDUSD remains under pressure from a strong dollar, although Australia's domestic backdrop looks comparatively hawkish. The Reserve Bank of Australia is keeping the cash rate at 4.35% after three increases this year. RBA Governor Michele Bullock said on 22 September that inflation risks may materialise because of persistently high energy prices and excess domestic demand. The next meeting is scheduled for 29 September, so the market continues to price in the possibility of further tightening. The latest available data show annual inflation at 3.5% in July and trimmed-mean inflation at 3.6%, both above the 2–3% target range.
The Federal Reserve raised the target rate range to 3.75–4.00% on 16 September, after which officials continued to emphasise persistent inflation risks. US August CPI accelerated to 3.4%, while retail sales rose by 1.2%, supporting demand for the dollar. The strong US backdrop limits the effect of expectations for another RBA rate increase.
The external environment for the Australian dollar is mixed. Brent's decline towards 99 USD reduces global inflation risks and supports risk appetite, although it also reduces the commodity premium. China has kept its key lending rates unchanged, while the yuan strengthened ahead of US-China talks, providing moderate support to Asian currencies. Overall, AUDUSD receives some local fundamental support from a hawkish RBA, but until new Australian data are released the strong dollar remains the dominant factor.
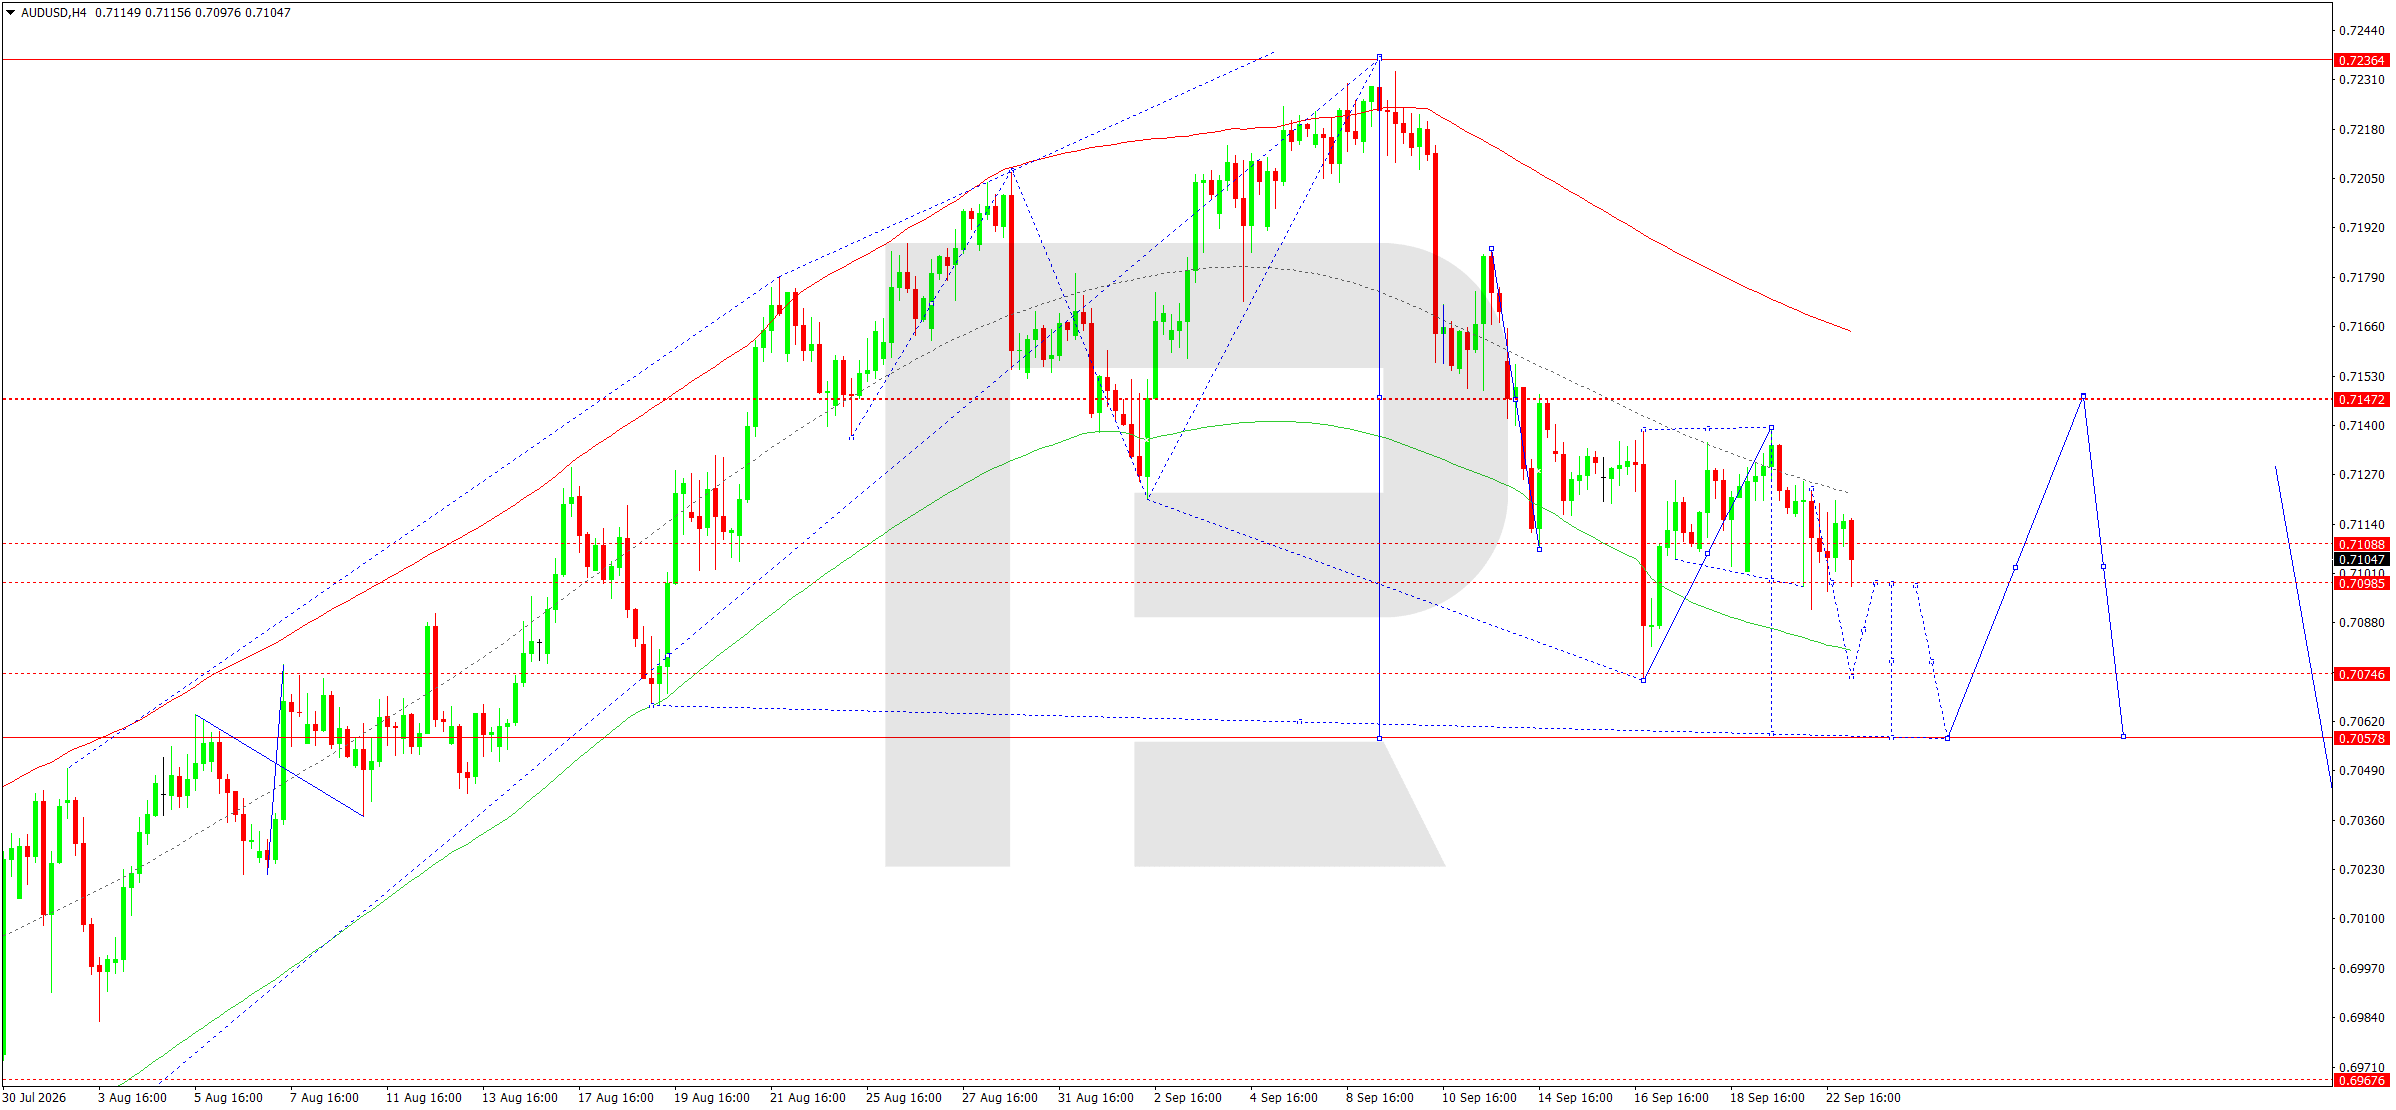
On the H4 chart, the pair formed a downward structure after reversing from 0.7236. The market has already tested 0.7091 and is now trading around 0.7105. The price remains below the descending longer-term average, while local highs continue to fall. The declining-wave Matrix with a pivot around 0.7147 and the Elliott Wave structure confirm that the bearish scenario remains intact.
The chart also shows a series of attempts to stabilise in the 0.7090–0.7110 area, but these have not yet formed a full reversal base. To change the short-term balance, buyers need to return the price above 0.7125 and then consolidate above 0.7147. Until then, any recovery within the current channel remains corrective. A fresh break below the local low at 0.7090 with stronger momentum on the lower timeframe would provide additional confirmation of the decline. The main trend for the day therefore remains directed towards lower targets.
The nearest target is 0.7074, corresponding to the lower boundary of the Price Envelope. Before the decline continues, a return towards 0.7125 is possible, where the central line of the Envelope and local resistance are located. Such a rise should be viewed as a correction. A breakout below 0.7074 would open the way towards 0.7058. On H1, holding below 0.7110–0.7125 would confirm seller pressure. A return above 0.7147 would invalidate the immediate downside scenario and require a fresh assessment of the structure.
AUDUSD forecast scenario
Trading scenario: SELL
- Price at the time of writing: 0.7105
- Entry price: 0.7100
- Stop Loss: 0.7126
- Take Profit: 0.7058
- Risk-to-reward ratio: 1:1.62
The trade idea is valid until 8:00 AM on 24 September 2026 (server time, UTC+3).
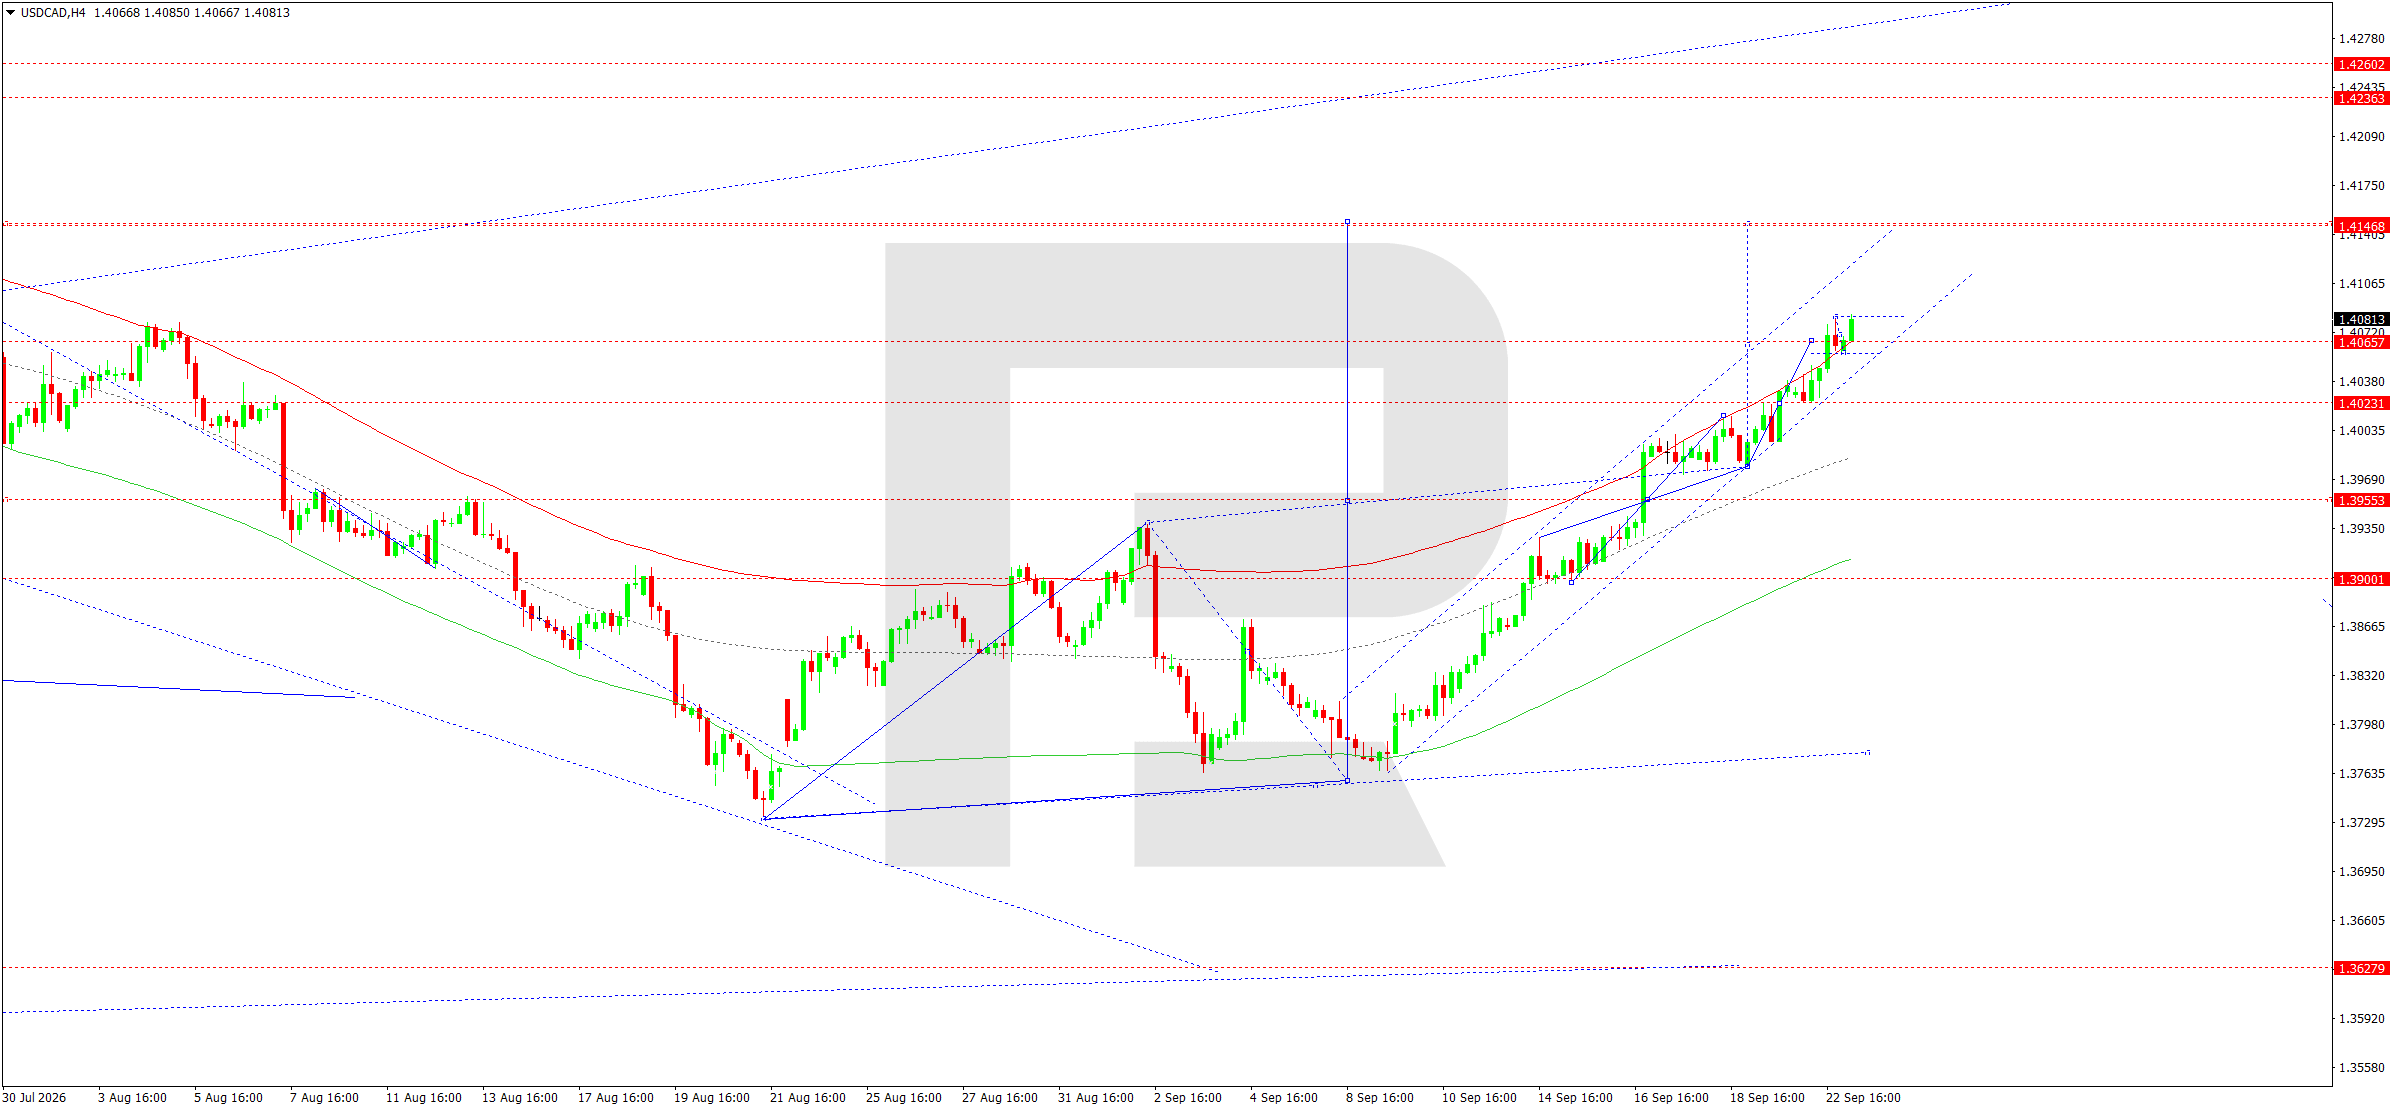
USDCAD forecast
As of 23 September 2026, USDCAD is holding near seven-week highs as the yield differential continues to favour the US dollar. The Bank of Canada kept its key rate unchanged at 2.25% on 2 September. The regulator noted the economy's resilience but also acknowledged rising inflation risks due to high energy prices and trade uncertainty. Canada's August inflation remained at 3.0% year-on-year, while the main core-inflation measures stayed close to 2%. This allows the BoC to maintain a cautious stance and avoid rushing into another rate increase.
The Federal Reserve, by contrast, raised the target rate range to 3.75–4.00% on 16 September. US inflation accelerated to 3.4% in August, while retail sales rose by 1.2%, supporting expectations of further tightening. This week, Fed officials again stressed that inflation risks remain elevated. The divergence between the two regulators widens the dollar's yield advantage and puts pressure on the Canadian currency. On 22 September, USDCAD rose towards 1.4075, corresponding to the Canadian dollar's weakest level in almost seven weeks.
Oil remains an important countervailing factor. Brent declined towards 99 USD amid reports of restored supply through Saudi Arabia and possible diplomatic progress around Iran. For Canada, lower oil prices reduce support for the export-linked currency and further reinforce the bullish fundamental bias in USDCAD. At the same time, a sharp recovery in oil could quickly change the balance.
On the H4 chart, a sustained upward trend remains in place. After reversing from the 1.3760 area, the market formed a sequence of higher lows and reached 1.4087. The current price around 1.4081 is near the upper boundary of the local channel and above the main averages. The rising-wave Matrix with a pivot around 1.3899 confirms that the main bullish structure remains intact.
It is important to distinguish between the main and local horizons. The medium-term H4 structure remains bullish, so the proposed sell is aimed only at a corrective move within the prevailing rise. If the market holds above 1.4058 and then consolidates above 1.4087, the corrective scenario will lose relevance and priority will return to growth towards 1.4147 and 1.4168. The reaction to 1.4058 will determine the pair's intraday balance.
A compact consolidation below 1.4087 is likely in the coming hours. A breakout higher would make 1.4147–1.4168 the next target.
However, the price's position near the upper boundary of the Price Envelope increases the probability of a correction. A breakout below 1.4058 would be the first signal of a decline towards the central line of the Envelope around 1.4025, followed by 1.3957. On H1, a decline below 1.4058 would confirm a local reversal. Since the price is already near projected resistance, selling the correction is preferred for the trade scenario, with the stop kept above the local high.
USDCAD forecast scenario
Trading scenario: SELL
- Price at the time of writing: 1.4081
- Entry price: 1.4076
- Stop Loss: 1.4110
- Take Profit: 1.4025
- Risk-to-reward ratio: 1:1.50
The trade idea is valid until 8:00 AM on 24 September 2026 (server time, UTC+3).
XAUUSD forecast
As of 23 September 2026, gold is trading under the influence of two opposing forces: tight US monetary policy and persistent geopolitical risk. The Federal Reserve raised the target rate range to 3.75–4.00% on 16 September, while subsequent comments from officials confirmed their readiness to keep policy restrictive until inflation begins to return sustainably towards 2%. August US CPI accelerated to 3.4% year-on-year, while strong retail-sales data are providing additional support to high bond yields. This is negative for gold because it increases the opportunity cost of holding a non-yielding asset.
On 22 September, gold declined towards 4,325 USD per ounce amid expectations that rates would remain high for longer. At the same time, oil prices fell below 100 USD per barrel following reports of restored supply through Saudi Arabia and possible diplomatic progress regarding Iran. Lower oil prices reduce inflation expectations and partly weaken demand for safe-haven assets. However, the conflict in the Middle East continues, and the risk of negotiations breaking down remains a source of support for gold.
The fundamental backdrop at the start of the day is therefore neutral to negative: high rates and a strong dollar limit growth, while geopolitics prevent a sustained decline. This increases the likelihood of continued broad and volatile consolidation.
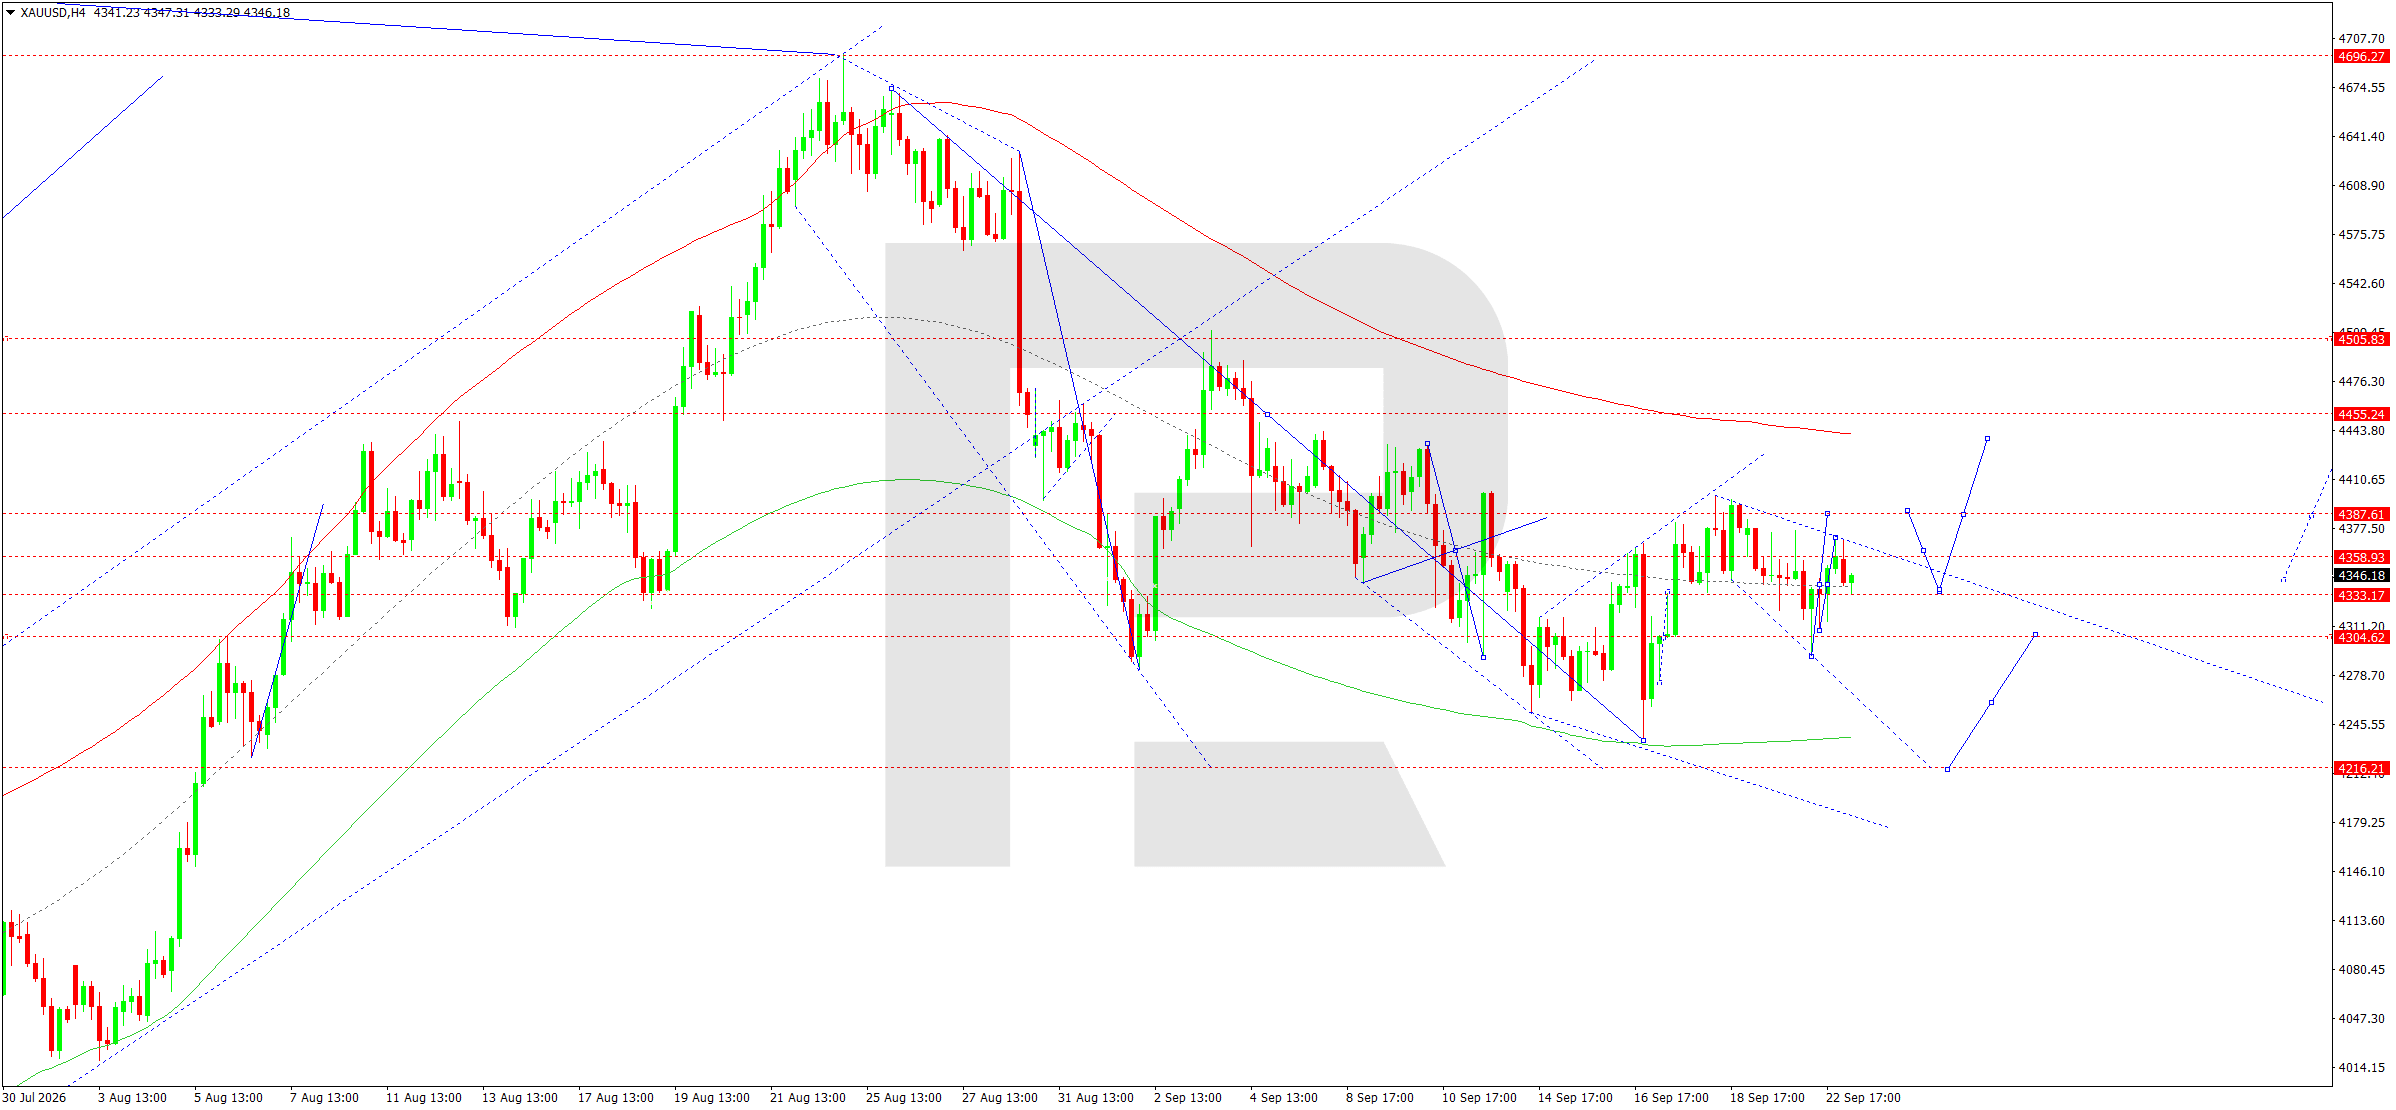
On the H4 chart, XAUUSD continues to form a broad range around 4,340. The current price around 4,346 is within a local downward structure after reversing from the September high. The declining-wave Matrix with a pivot around 4,465 and the descending longer-term average continue to exert pressure from above. At the same time, the Price Envelope allows for another corrective upward wave.
The chart structure remains two-stage. First, the market may complete a recovery towards the upper part of the local Envelope, after which the reaction in the 4,400–4,455 area will be key to resuming the main decline. A rejection from this area would bring 4,333, then 4,305 and 4,216 back into focus. Consolidation above 4,455, by contrast, would disrupt the current model and require a reassessment of the medium-term wave count. Until then, corrective growth remains the priority.
The nearest resistance is located in the 4,388–4,400 area. A breakout would allow the market to extend the correction towards 4,455, where an important boundary of the main structure lies. While 4,333–4,305 holds, the probability of such a move remains significant. Therefore, at the current stage the preference is for buying the correction rather than selling directly in the middle of the range. On H1, consolidation above 4,388 would confirm growth. If the price breaks below 4,305, the correction scenario will be invalidated and the market will have room to move towards 4,216, the lower boundary of the Envelope and the main downside target. The overall H4 trend remains bearish, so the proposed buy is viewed exclusively as a local corrective trade.
XAUUSD forecast scenario
Trading scenario: BUY
- Price at the time of writing: 4,346
- Entry price: 4,351
- Stop Loss: 4,304
- Take Profit: 4,455
- Risk-to-reward ratio: 1:2.21
The trade idea is valid until 8:00 AM on 24 September 2026 (server time, UTC+3).
US 500 forecast
As of 23 September 2026, the US equity market is receiving support from lower oil prices and sustained demand for technology shares, although tight monetary policy limits the potential for broad gains. The Federal Reserve raised the target rate range to 3.75–4.00% on 16 September, citing resilient economic activity and elevated inflation. August CPI accelerated to 3.4% year-on-year, while retail sales rose by 1.2%, so the market continues to price in the possibility of another rate increase. High Treasury yields remain the main risk for equity valuations.
At the same time, lower oil prices improved investor sentiment. Brent was holding near 99 USD on the morning of 23 September after part of Saudi supply was restored and amid hopes of diplomatic easing in the Middle East. Lower energy prices reduce inflation expectations and pressure on corporate margins. Against this backdrop, the technology sector remains the leader: the Nasdaq previously reached a fresh record on renewed interest in artificial intelligence. However, gains remain uneven: on 22 September, the S&P 500 financial sector fell by around 2%, while the banking index lost about 3%.
The fundamental backdrop is therefore moderately positive for the index, although sensitivity to yields and Fed comments remains high. Lower oil prices support risk appetite, while another rise in yields could quickly restore pressure on the market.
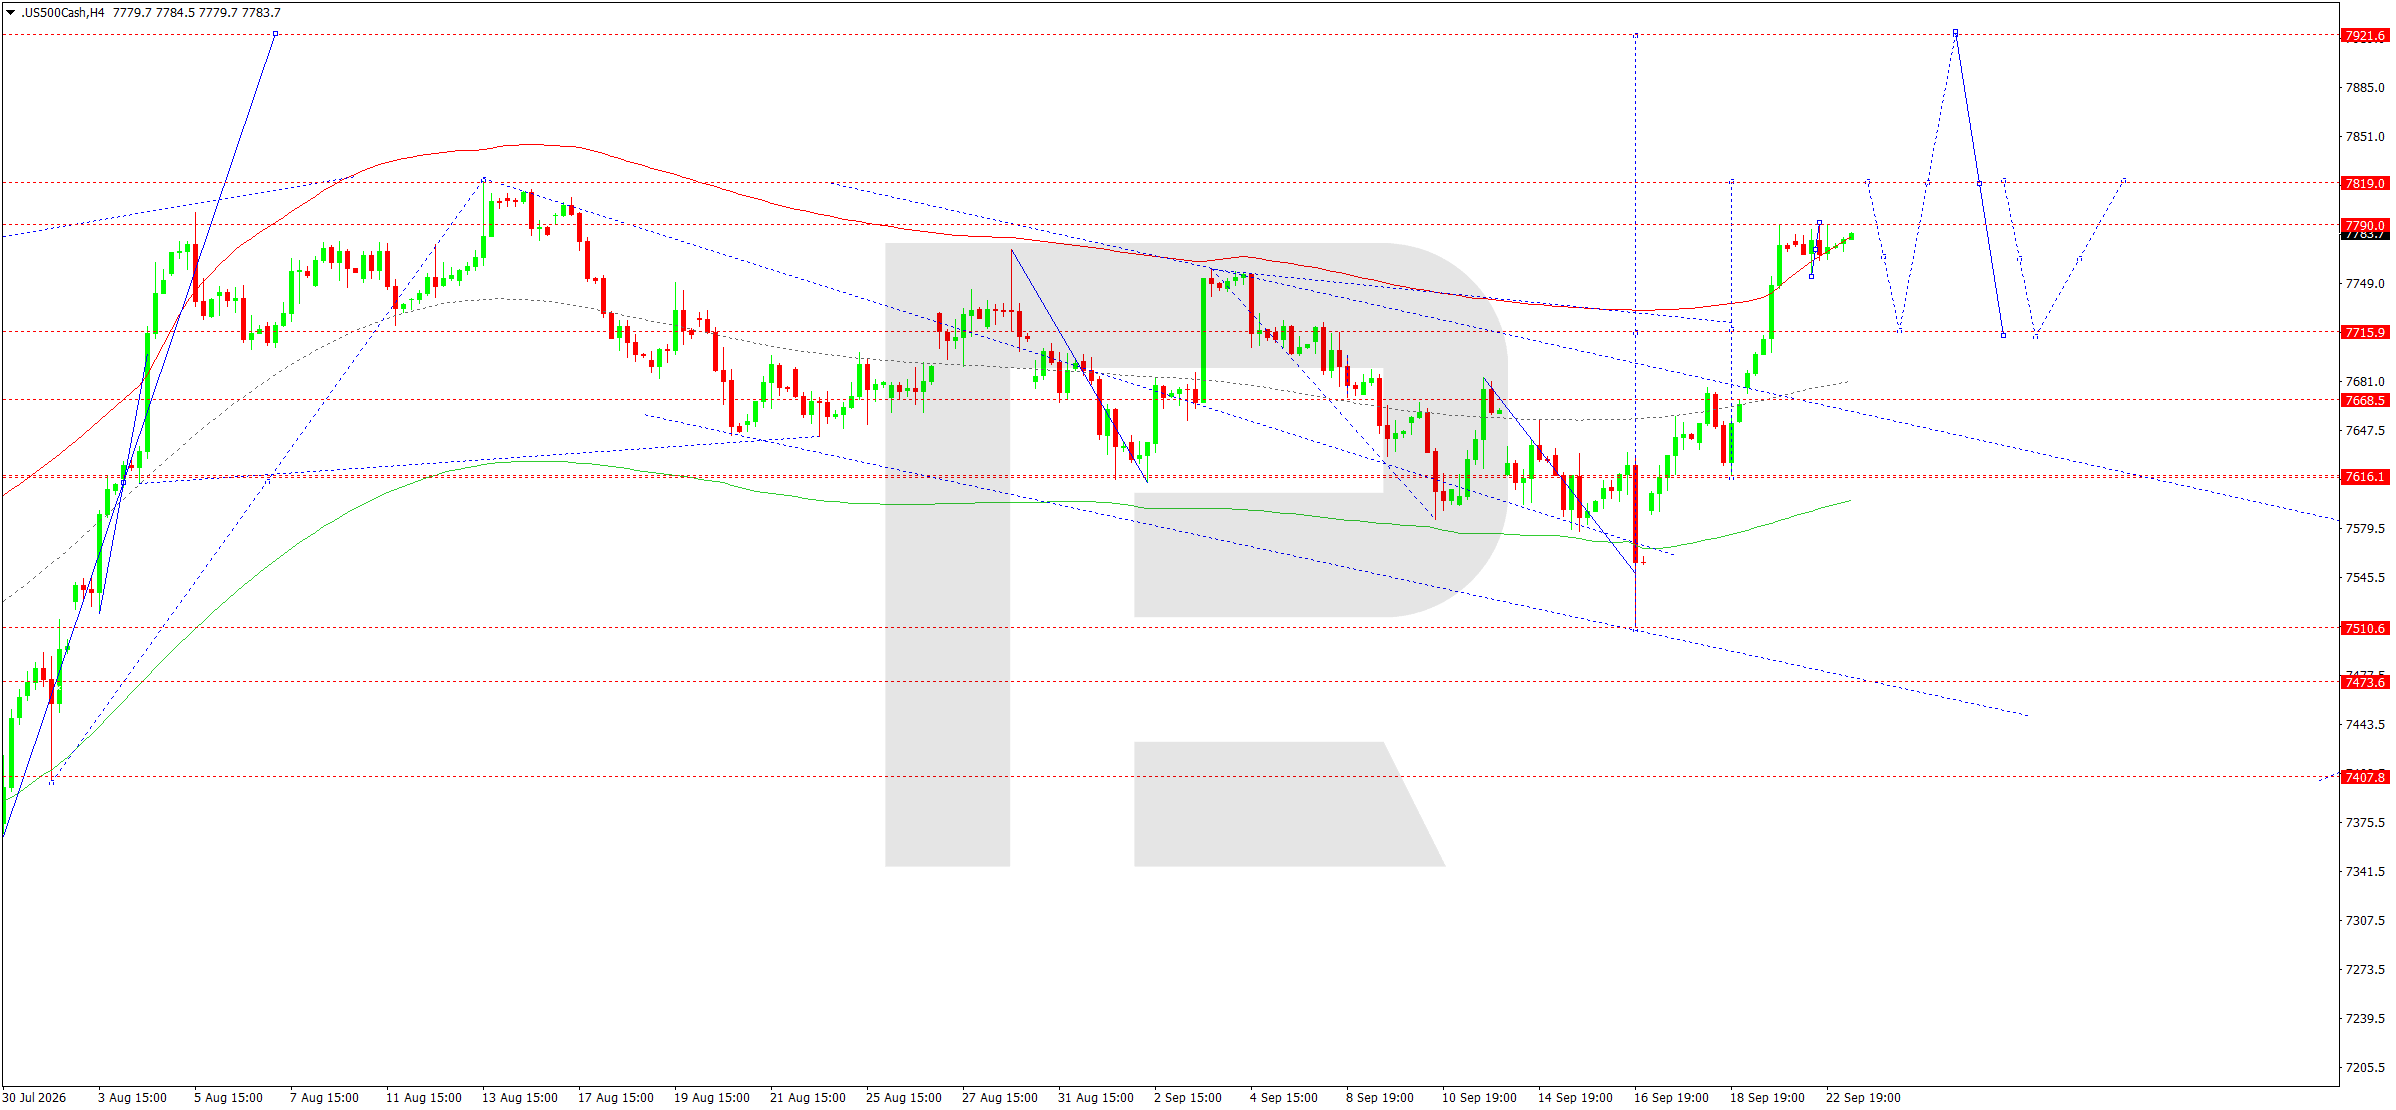
On the H4 chart, the US 500 formed a pronounced upward wave from the 7,511 area and reached resistance at 7,790. The current price around 7,784 is holding directly below the upper boundary of the local Price Envelope. The rising-wave Matrix with a pivot around 7,702 confirms that the positive structure remains intact, while a breakout above the descending channel line strengthened buyers' positions.
A key feature of the current structure is the price's position near the upper edge of the range after a rapid impulse. This increases the risk of short-term profit-taking, so further growth should preferably be confirmed by a breakout above 7,790 rather than merely touching the level. Holding above 7,790 on H1 would signal that buyers remain in control. A rejection from 7,819–7,820, by contrast, would create conditions for a return towards the central part of the Envelope during the trading day.
The market is currently forming a compact consolidation below 7,790. Consolidation above this level would create conditions for an extension towards 7,819–7,820 and, if momentum persists, towards 7,922. On H1, holding above 7,750–7,760 is important: while this area remains support, the correction looks limited. If the price fails to consolidate above 7,790 and returns below 7,716, the way will open towards 7,669 and 7,616. The main intraday scenario remains an attempt to complete the upward impulse towards 7,820, after which the probability of a correction towards 7,720 will increase.
US 500 forecast scenario
Trading scenario: BUY
- Price at the time of writing: 7,784
- Entry price: 7,789
- Stop Loss: 7,759
- Take Profit: 7,820
- Risk-to-reward ratio: 1:1.03
The trade idea is valid until 8:00 AM on 24 September 2026 (server time, UTC+3).
BTCUSD forecast
As of 23 September 2026, BTCUSD remains in an area of elevated demand following a strong recovery in September, although the short-term picture is becoming more sensitive to profit-taking. The Federal Reserve raised the target rate range to 3.75–4.00% on 16 September, and subsequent statements from officials confirmed that fighting inflation remains a priority. August CPI accelerated to 3.4% year-on-year, while strong retail sales reinforced expectations of further tightening. High rates and yields usually limit demand for the most volatile assets, so this factor remains the main macroeconomic risk for Bitcoin.
At the same time, global risk appetite improved thanks to lower oil prices and renewed gains in the technology sector. The Nasdaq reached fresh record levels, while Bitcoin rose to an eight-month high near 87,359 USD at the start of the week. The advance was accompanied by short-position liquidations and improving sentiment in the cryptocurrency segment. Brent's decline towards 99 USD reduced concerns about an inflation shock, supporting demand for risk.
The fundamental backdrop therefore remains moderately positive, but after the rapid rise the market is vulnerable to a correction. A strong dollar and expectations of further Fed rate increases create resistance, while positive sentiment in the equity market supports buyers.
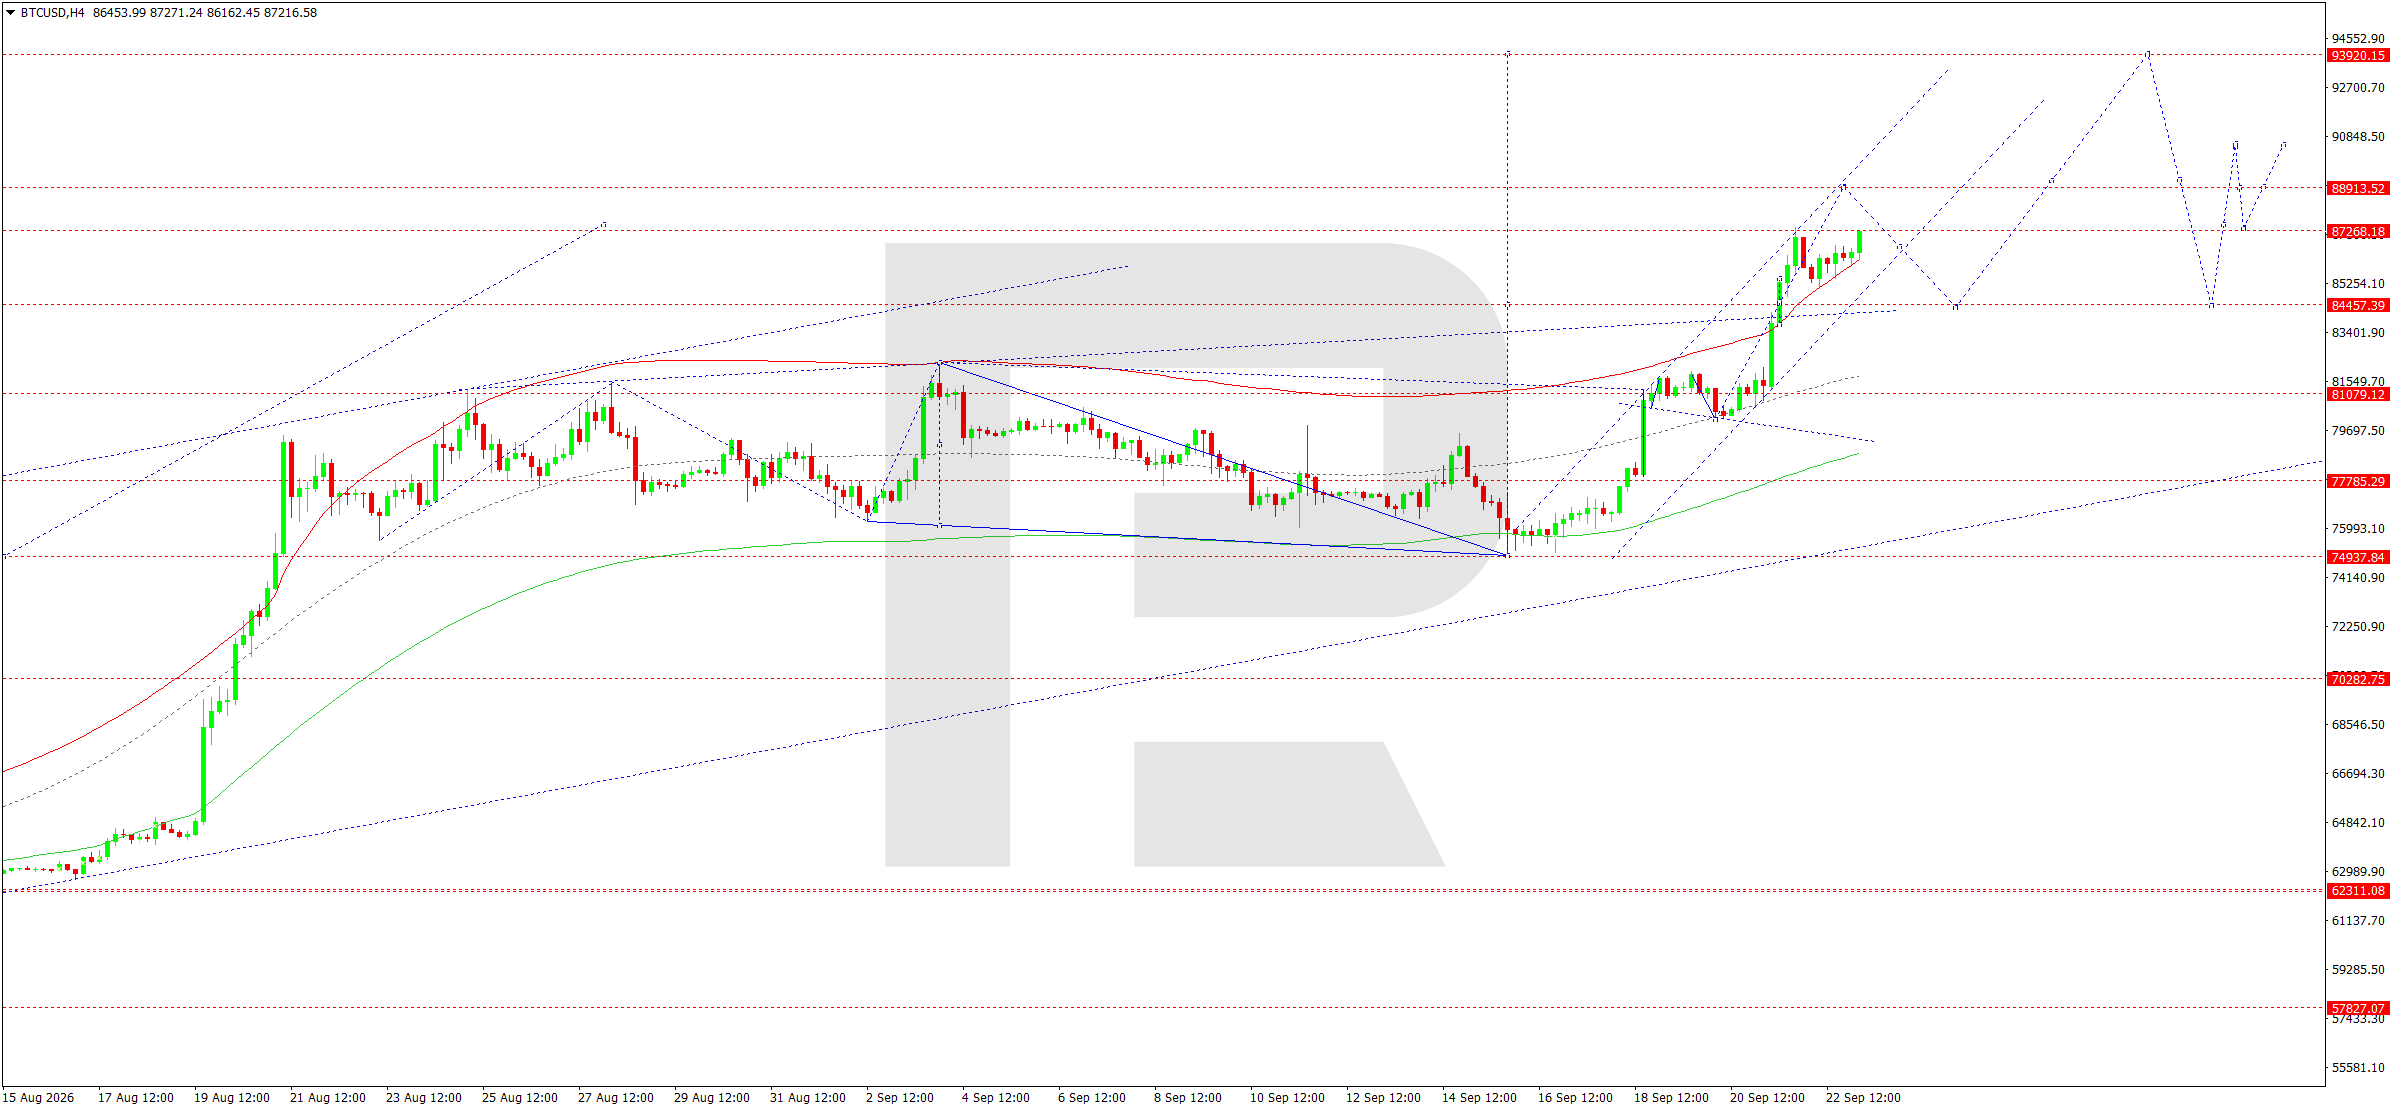
On the H4 chart, BTCUSD completed a powerful upward wave from the 74,938 area and reached the 87,268–87,337 zone. The current price around 87,217 is at the upper boundary of the local Price Envelope and directly below resistance. The rising-wave Matrix with a pivot around 84,457 confirms the medium-term bullish structure, although the price's position after the impulse increases the probability of a corrective pullback.
The chart also shows price acceleration after the breakout above 81,079, leaving the market noticeably extended from average values. This configuration is often followed by a return towards the centre of the previous impulse before the trend resumes. The 84,457 area therefore has a dual role: it acts both as technical support and as a test of the sustainability of the latest upward wave. If buyers actively defend this area, the structure will remain constructive. A weak reaction, by contrast, would increase the probability of a deeper correction. Therefore, selling is viewed only as a short-term trade against the market's main upward trend.
The main scenario is a decline towards 84,457, where the central line of the Envelope and a key support area are located. On H1, the first confirmation will be a breakout below local support at 86,200–86,000. After a correction towards 84,457, the market may form a new upward wave towards 88,914 and then 93,920. If 84,457 is broken firmly to the downside, the next targets will be 81,079 and 77,785. Until 84,457 is broken, the decline is viewed as a correction within the main upward structure. Consolidation above 87,337 without a prior pullback would weaken the sell scenario and open the way towards 88,914.
BTCUSD forecast scenario
Trading scenario: SELL
- Price at the time of writing: 87,217
- Entry price: 87,212
- Stop Loss: 88,100
- Take Profit: 84,457
- Risk-to-reward ratio: 1:3.10
The trade idea is valid until 8:00 AM on 24 September 2026 (server time, UTC+3).
Editors’ picks
 EURUSD forecast 2026–2027: technical analysis, price levels & predictions
The EURUSD outlook for 2026 and 2027: key levels on the daily chart, three trading scenarios and the policy gap between the Fed and the ECB that drives the pair.
 Gold (XAUUSD) forecast 2026: technical analysis, price levels & predictions
Where gold could trade in 2026: key levels, three trading scenarios with entry triggers and the forecasts from J.P. Morgan, Deutsche Bank and Goldman Sachs.
Forecasts presented in this section only reflect the author’s private opinion and should not be considered as guidance for trading. RoboForex bears no responsibility for trading results based on trading recommendations described in these analytical reviews.