
Daily technical analysis and forecast for 24 September 2026
Daily technical analysis and forecast for EURUSD, USDJPY, GBPUSD, AUDUSD, USDCAD, XAUUSD, US 500, and BTCUSD for 24 September 2026.
Each scenario on this page reflects the market structure on the H4 chart as of 10:00 UTC+3 on 24 September 2026. The assessment considers the current H4 chart structure, key support and resistance levels, the direction of the medium-term movement, and the prevailing fundamental backdrop.
EURUSD forecast
As of 24 September 2026, the fundamental backdrop for EURUSD is driven primarily by the contrast between the resilience of the US economy and the more hawkish stance of both central banks. The US Federal Reserve raised the target rate range by 25 basis points to 3.75–4.00% on 16 September, stressing that inflation remains elevated. The dollar received additional support from the preliminary US Composite PMI for September, which rose to 58.4, the highest level in more than five years, while stronger demand was accompanied by increased price pressure. Against this backdrop, US bond yields remain high, limiting demand for the euro.
The ECB also raised rates by 25 basis points on 10 September, taking the deposit rate to 2.50%, as the energy shock continues to support inflation. At the same time, the latest eurozone PMI showed the fastest growth in business activity in more than three years. This reduces the risk of a sharp deterioration in the regional economy, but does not yet change the dollar's short-term advantage, especially while US yields remain high and the geopolitical risk premium persists.
Oil and gas dynamics remain another factor. Hopes of diplomatic progress between the US and Iran periodically reduce energy prices, but the situation remains unstable, so inflation expectations react quickly to new headlines. For EURUSD, this means increased sensitivity to yield movements and changing expectations for the next Fed and ECB meetings. Intraday volatility may rise around US data releases, but until new weak US data emerge, the fundamental balance remains more favourable for the dollar.
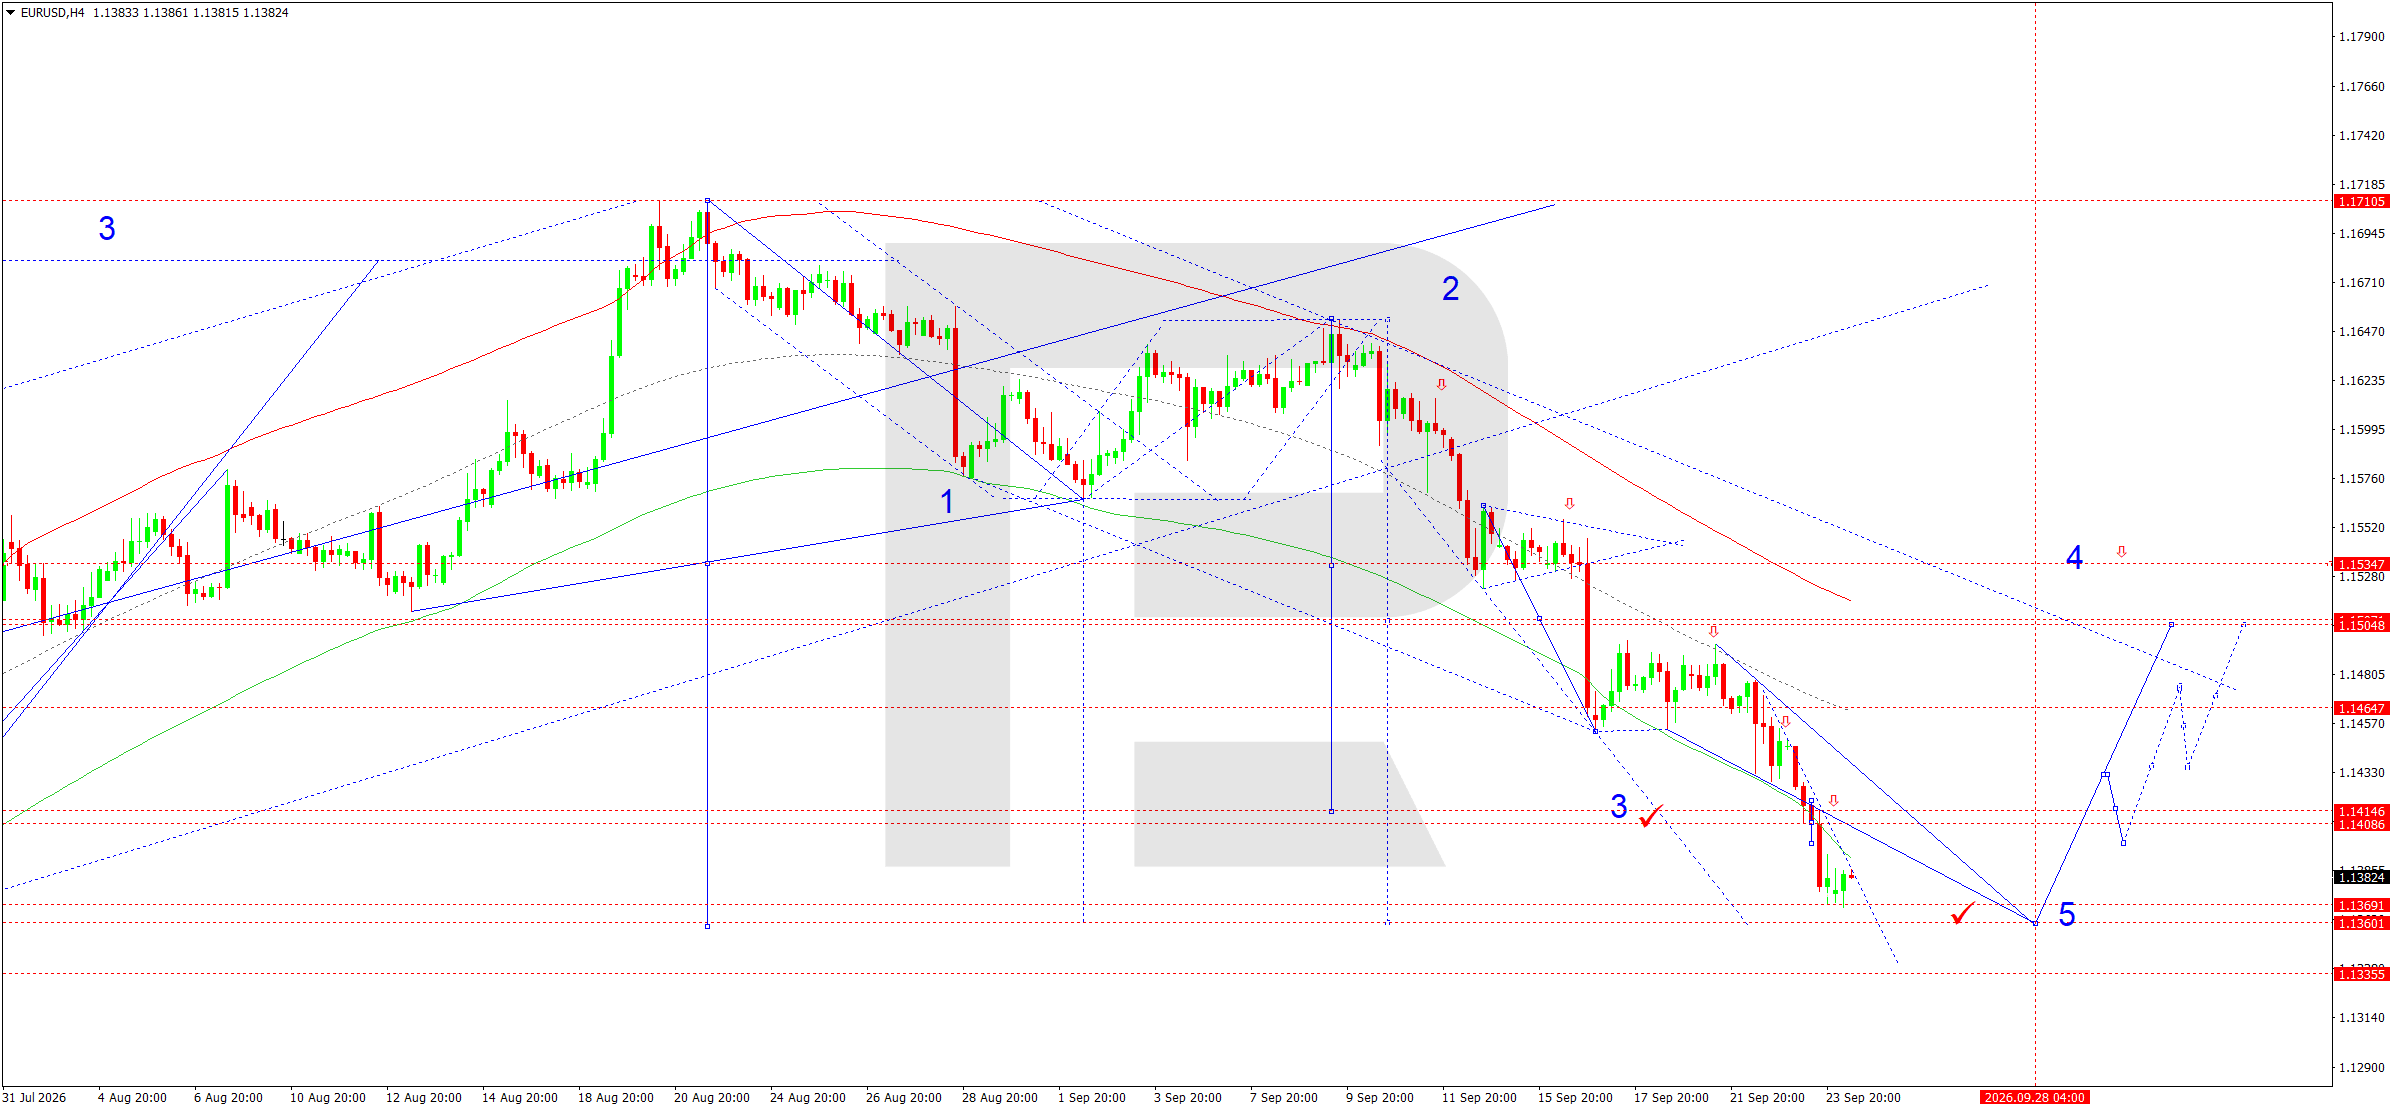
On the H4 chart, EURUSD maintains a pronounced downward structure. The market completed a decline towards 1.1369 and consolidated below the previously broken 1.1414 level. Today, 24 September, the main scenario remains a continuation lower towards 1.1360. Before that, a local correction towards 1.1396 with a test of the broken area from below is possible, but while the price remains beneath it, sellers retain the advantage.
The scenario is confirmed by the Elliott Wave structure, descending channels, and the wave Matrix with a pivot at 1.1535. The price remains below the main dynamic resistance levels, while the breakout below 1.1414 strengthened the third leg of the decline and opened the way towards the lower boundary of the Price Envelope. The 1.1369–1.1360 area is the nearest target and a potential zone for completion of the current leg. A firm breakout below 1.1360 would extend the potential towards 1.1336, while a return above 1.1414 would weaken the bearish scenario. The main H4 trend remains downward, so selling on local corrections remains preferred.
EURUSD forecast scenario
Trading scenario: SELL
- Price at the time of writing: 1.1390
- Entry price: 1.1385
- Stop Loss: 1.1409
- Take Profit: 1.1360
- Risk-to-reward ratio: 1:1.33
The trade idea is valid until 8:00 AM on 25 September 2026 (server time, UTC+3).
USDJPY forecast
The fundamental backdrop for USDJPY remains mixed, but in the short term the dollar still has the advantage. The Fed raised the rate by 25 basis points on 16 September to a range of 3.75–4.00%, while a strong preliminary US Composite PMI reading of 58.4 for September reinforced expectations that US monetary policy will remain tight. Rising Treasury yields, including the 10-year yield climbing towards multi-year highs, support the dollar and increase the cost of holding low-yielding currencies.
The Bank of Japan also raised rates on 18 September, taking the target for the uncollateralised overnight rate to 1.25%. The decision marked another step in policy normalisation, but the yen's reaction was muted because the market did not receive a sufficiently hawkish signal on the pace of further increases. The risk of FX intervention by the Japanese authorities remains another factor, especially if USDJPY quickly approaches the 159.00–160.00 area. The fundamental backdrop therefore supports further growth in the pair while also increasing the probability of sharp pullbacks.
Lower oil prices partly improve conditions for Japan as an energy importer, but the yield differential between the US and Japan remains significant. Another important constraint on the pair's rise is that BoJ tightening has already begun: the new 1.25% rate takes effect from 24 September. At the same time, Japanese officials previously conducted rate checks, which the market sees as a warning ahead of possible action. USDJPY may therefore experience elevated intraday volatility while rising. For buyers, the key condition is for the price to remain above 157.77, while fundamental confirmation would require further growth in US yields without new signals of a softer Fed stance.
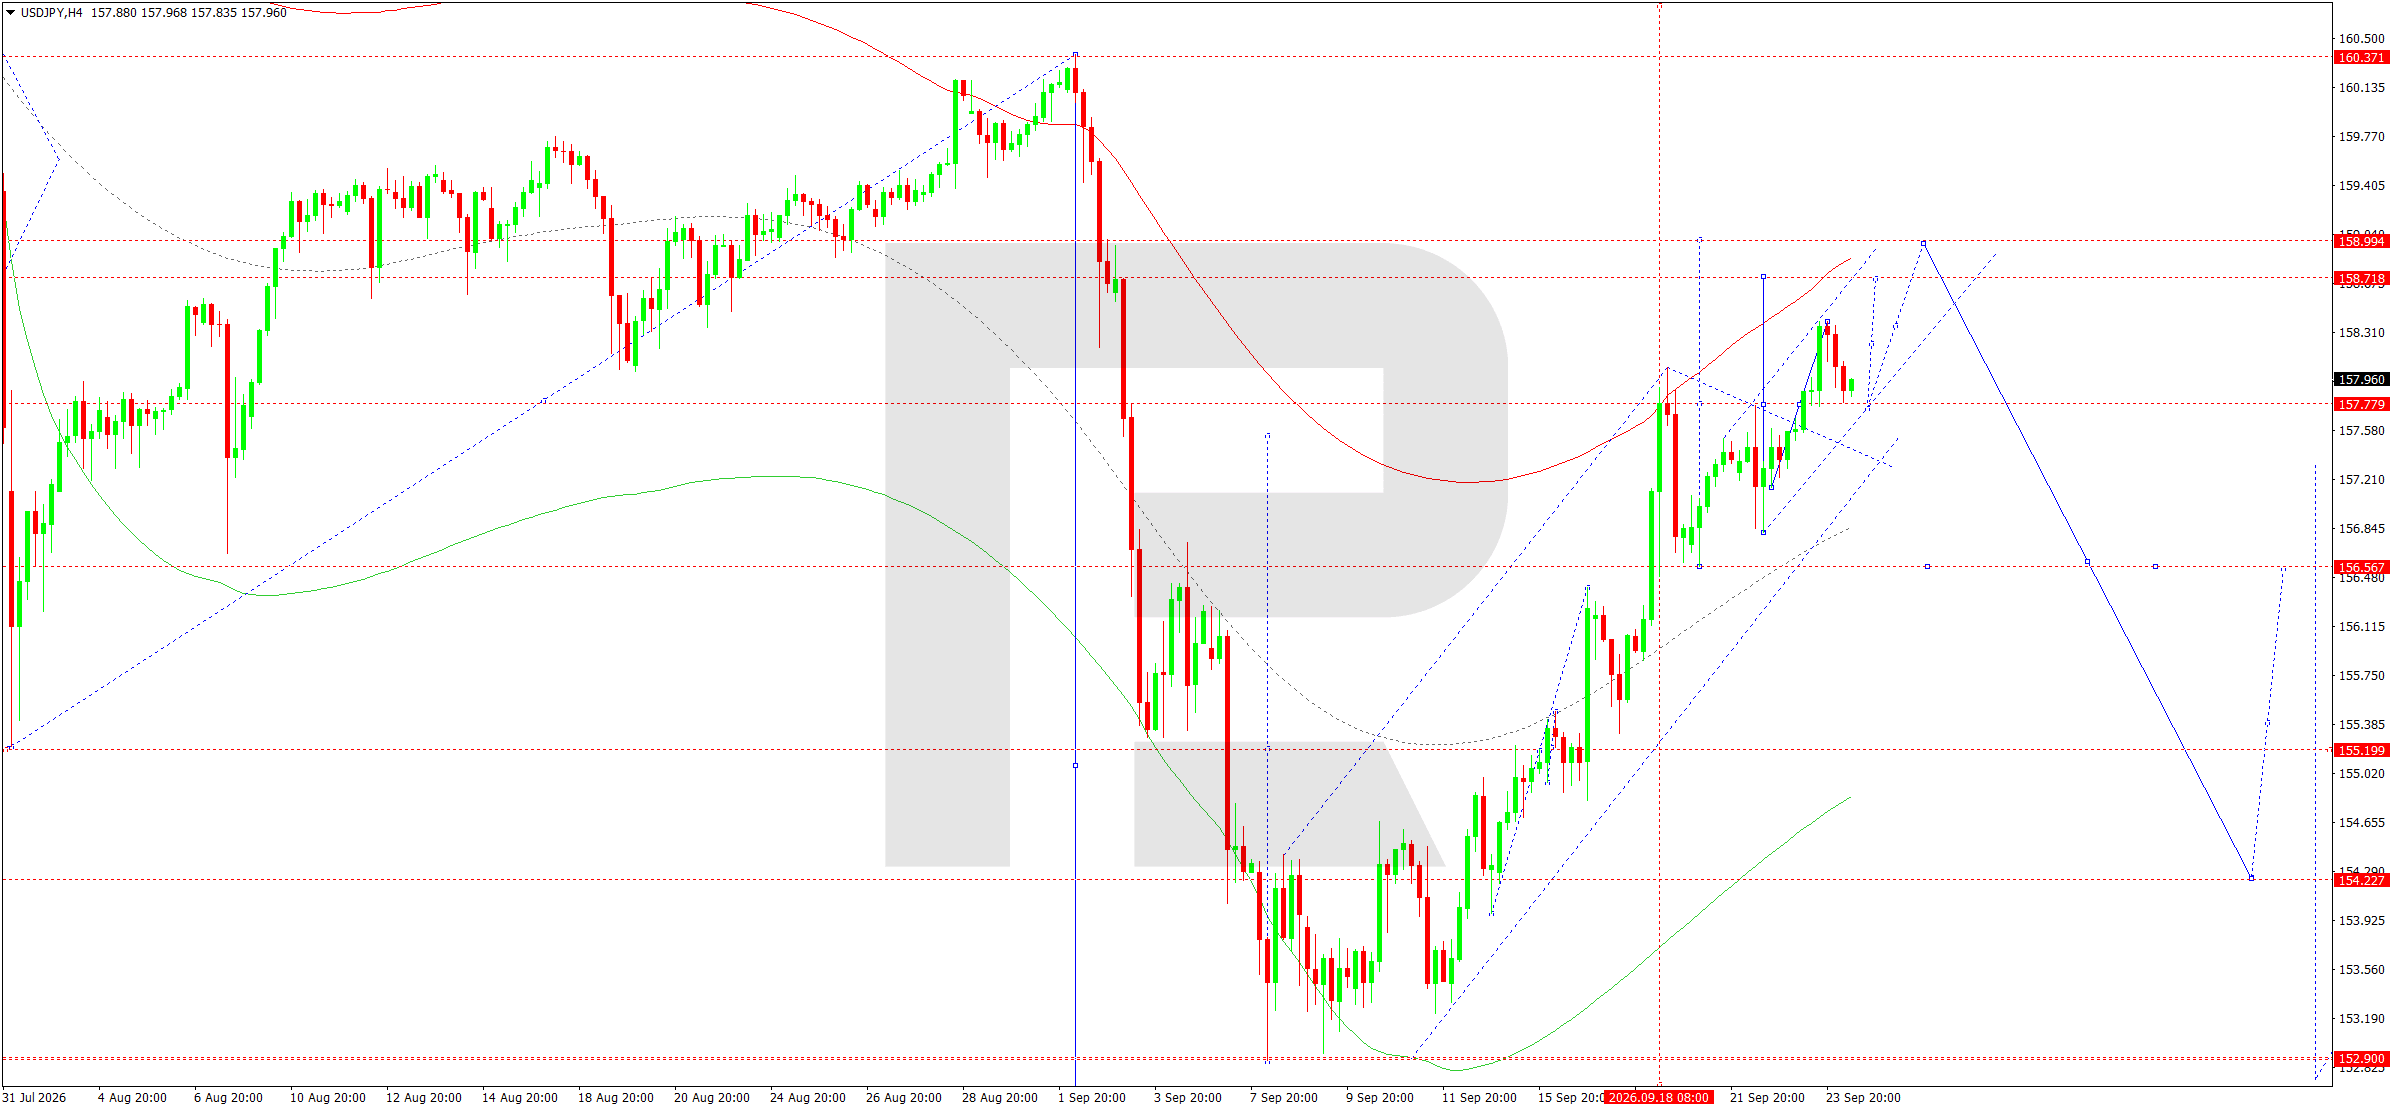
On the H4 chart, after finding support at 157.77, USDJPY maintains an upward structure and is moving towards 158.17. Once this level is reached, a local correction back towards 157.77 is possible, but if support holds, the main scenario assumes further growth towards 159.00. The current configuration points to the formation of another pivot within the rising channel.
The scenario is confirmed by the Elliott Wave structure and the rising-wave Matrix with a pivot at 155.20. The market previously formed an impulse from the 152.90 area and rose towards the upper part of the Price Envelope around 158.37. The correction did not break the sequence of higher lows. The 158.72 and 158.99 levels are the nearest resistance areas, while 157.77 remains the key support for continuation of the move. A breakout above 159.00 would increase the potential towards 160.37, while a move below 157.77 would raise the probability of a deeper correction towards 156.57. The main H4 trend remains upward, so buying after local pullbacks remains preferred.
USDJPY forecast scenario
Trading scenario: BUY
- Price at the time of writing: 158.20
- Entry price: 158.25
- Stop Loss: 157.75
- Take Profit: 159.00
- Risk-to-reward ratio: 1:1.50
The trade idea is valid until 8:00 AM on 25 September 2026 (server time, UTC+3).
GBPUSD forecast
The fundamental backdrop for GBPUSD remains mixed. The Bank of England kept the policy rate unchanged at 3.75% at its September meeting, although the decision was taken by a 6–3 majority, with three members of the Committee voting for an increase to 4.00%. This configuration shows that inflation risks remain significant for the UK regulator. Consumer inflation accelerated to 3.1% in August, while rising energy costs due to the conflict in the Middle East increase the risk of further price pressure. Sterling also received support from August retail sales, which rose by 0.5% month-on-month against expectations of a decline.
At the same time, the preliminary UK PMI for September showed a slowdown: the services business activity index fell to 51.7, while companies reported faster growth in costs and selling prices. This creates an unfavourable combination of weaker growth and persistent inflation. On the dollar side, support comes from the Fed's rate increase, strong US PMI data, and high Treasury yields. Therefore, even with expectations of further BoE tightening intact, the short-term fundamental balance remains unfavourable for GBPUSD.
Oil dynamics are an additional source of volatility: lower prices reduce inflation concerns for the UK but may also weaken the case for a rapid rate increase. For the next session, the 1.3250–1.3287 area remains an important resistance zone. While the price trades below it, any rebounds retain a corrective character. Fundamentally, dollar resilience and rising global yields increase pressure on the pair, while sterling would require either a signal of accelerating UK inflation or more hawkish rhetoric from BoE officials to gain support.
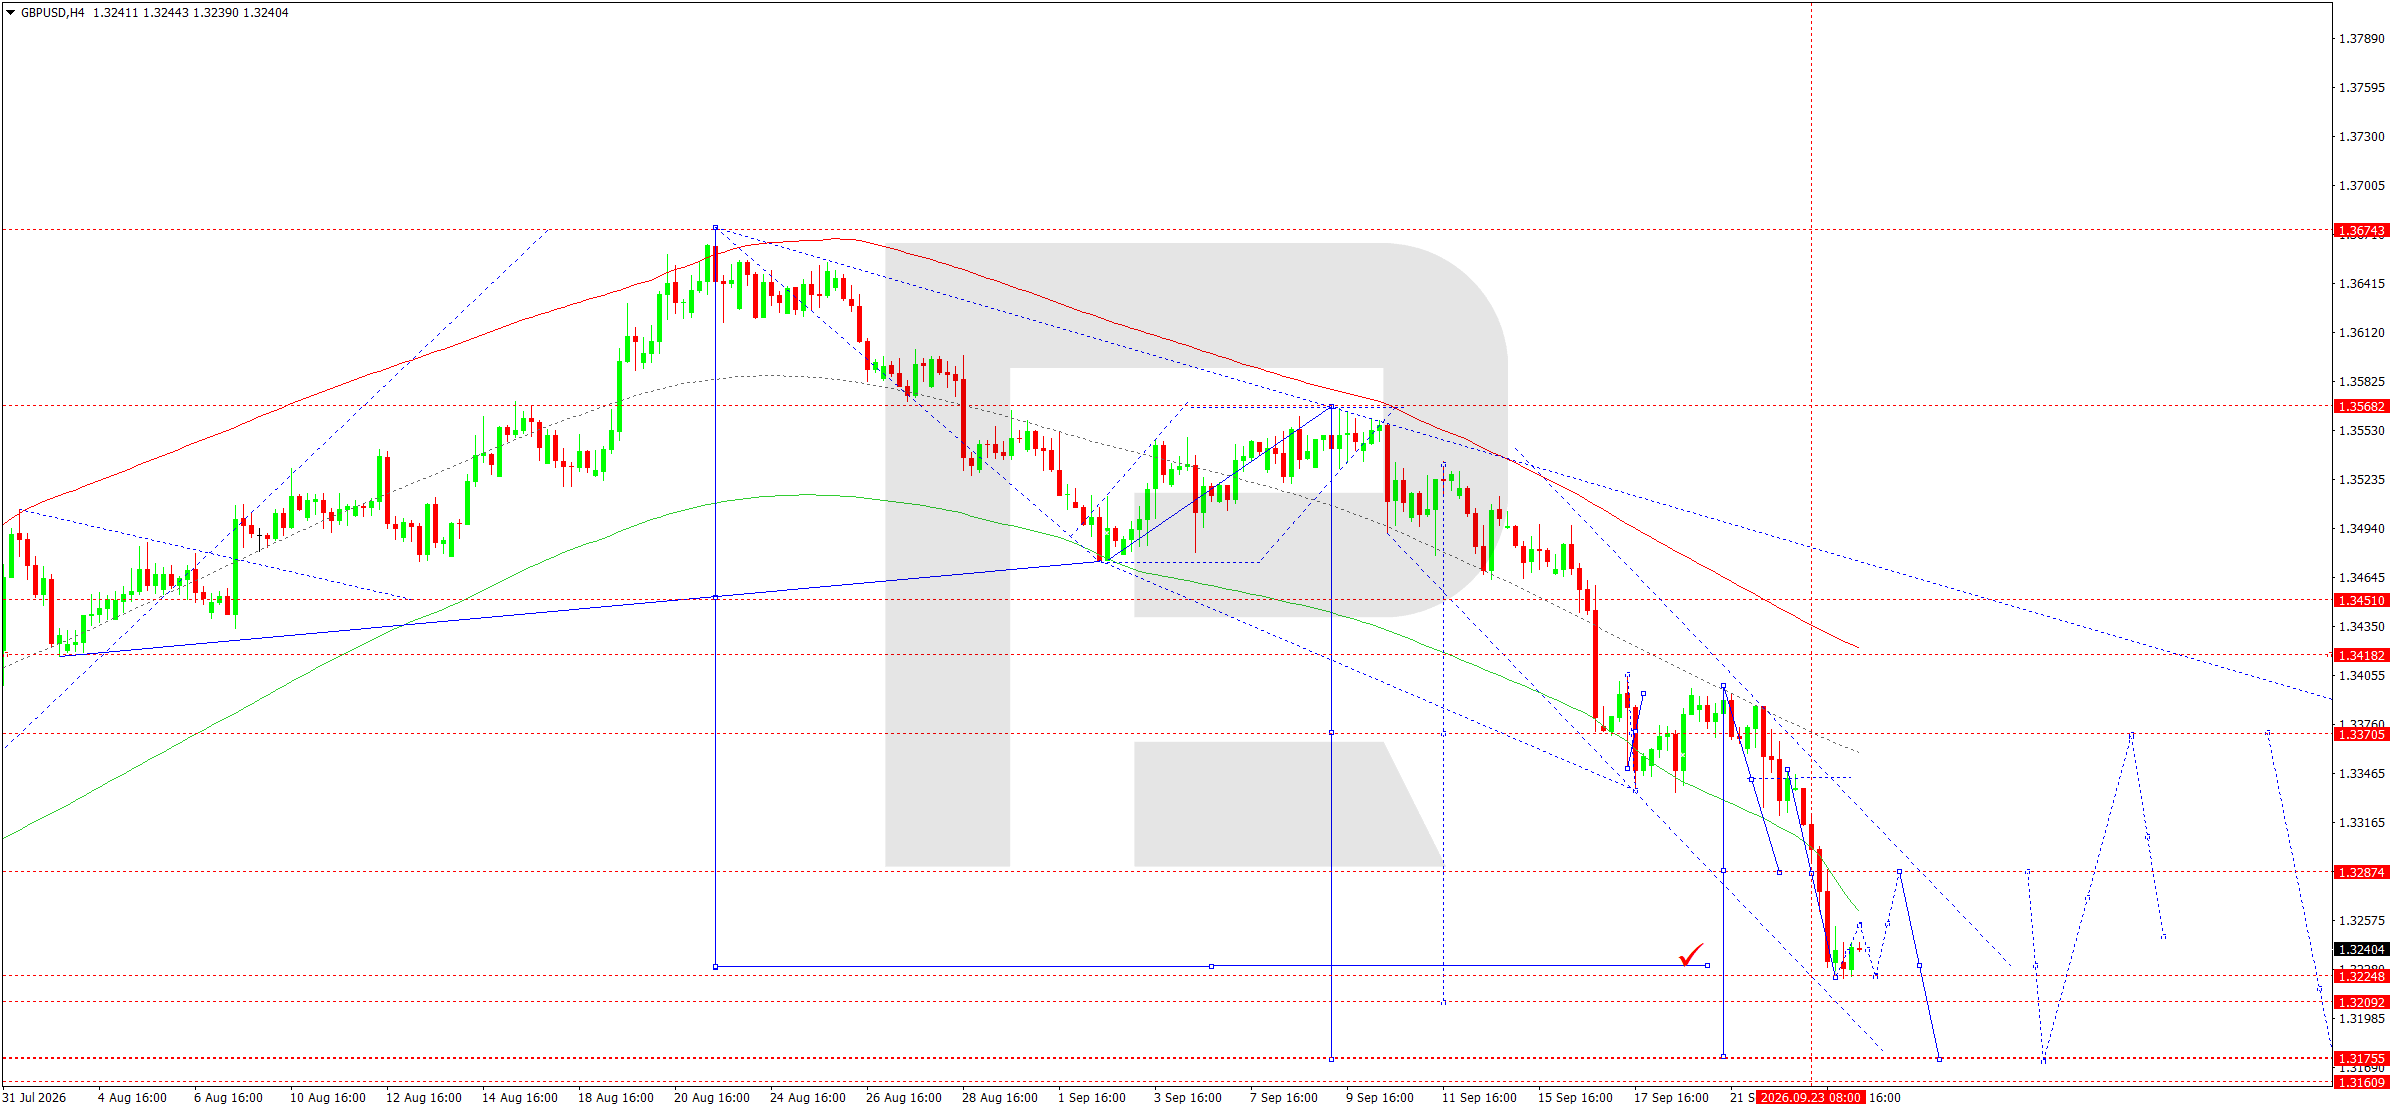
On the H4 chart, GBPUSD completed a downward wave towards 1.3224 and maintains a steady bearish structure. Today, 24 September 2026, the main scenario remains a continuation of the move towards 1.3175. Before a new downward impulse, a correction towards 1.3250 is possible, but it should be viewed as a technical retest of previously broken support.
The scenario is confirmed by the Elliott Wave structure and the declining-wave Matrix with a pivot at 1.3370. The price remains below key moving averages and within a descending channel. The breakout of the 1.3287 area accelerated the decline towards the lower boundary of the Price Envelope at 1.3224. The next important target is 1.3175, and if it is broken the market could extend the move towards 1.3161. To invalidate the immediate bearish scenario, the price would need to return above 1.3287 and consolidate above this zone. Until that happens, the sequence of lower highs and lower lows remains intact, so the main H4 trend stays bearish and the priority is to sell after local corrections.
GBPUSD forecast scenario
Trading scenario: SELL
- Price at the time of writing: 1.3239
- Entry price: 1.3234
- Stop Loss: 1.3260
- Take Profit: 1.3175
- Risk-to-reward ratio: 1:2.27
The trade idea is valid until 8:00 AM on 25 September 2026 (server time, UTC+3).
AUDUSD forecast
The fundamental backdrop for AUDUSD is shaped by expectations of renewed monetary tightening in Australia, although a strong dollar and deterioration in some domestic data are limiting the Australian currency's potential. The Reserve Bank of Australia is keeping the cash rate at 4.35% after three increases in 2026. In recent days, the regulator's leadership has again stressed that inflation risks may materialise because of high energy prices and persistent domestic demand. The next meeting is scheduled for 29 September, and the market is pricing in a high probability of another 25-basis-point rate increase.
At the same time, fresh labour-market data sent a mixed signal. Employment rose by 39,500 in August, but unemployment unexpectedly increased to 4.6%, the highest in around five years, as labour-force participation rose. Inflation remains above the RBA's target: the latest published monthly CPI stood at 3.5% year-on-year, while underlying price pressure also remains elevated. China is another important factor for AUDUSD: the People's Bank of China kept its key lending rates unchanged, while weaker momentum in the Chinese economy is limiting support for commodity currencies.
At the same time, the Fed's rate increase and strong US September PMI support the US dollar. As a result, expectations of an RBA rate increase are easing pressure on the AUD but have not yet reversed the bearish backdrop. Commodity-market dynamics and global risk appetite also need to be taken into account. Lower oil prices reduce some inflation pressure, but high US bond yields make dollar assets relatively more attractive. Therefore, even ahead of a potentially hawkish RBA decision, an AUDUSD recovery requires a return above technical resistance levels; without this, fundamental support for the Australian currency remains insufficient to reverse the trend.
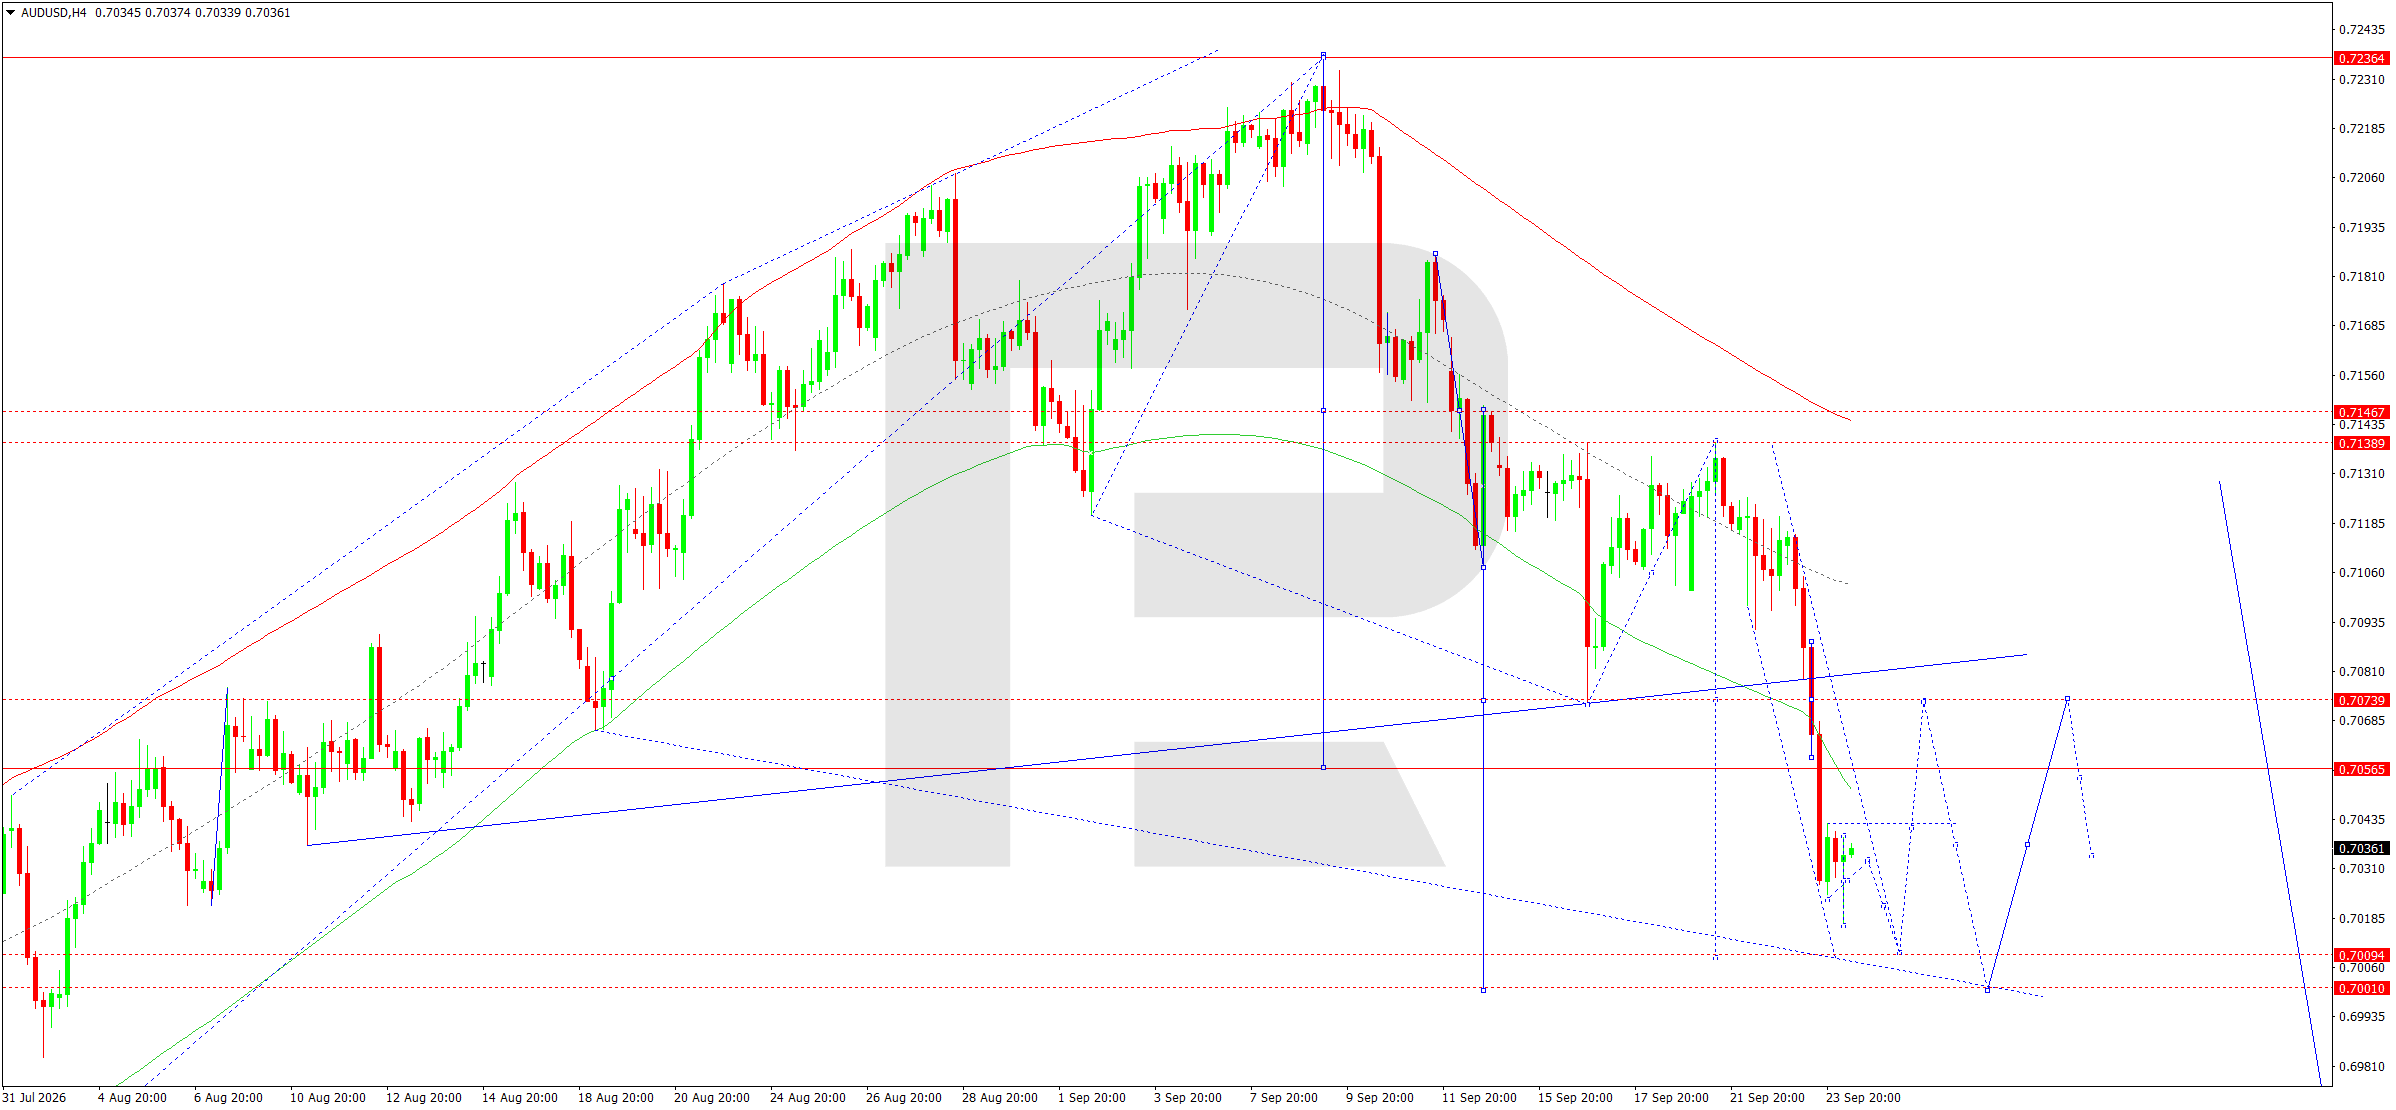
On the H4 chart, AUDUSD completed a downward wave towards 0.7017 after a firm breakout below the 0.7056 area. Today, 24 September, a local corrective move towards 0.7042 is expected, after which the main scenario assumes a continuation of the decline towards 0.7009. The 0.7009–0.7001 zone is the nearest support area and the lower target of the current impulse.
The scenario is confirmed by the Elliott Wave structure and the declining-wave Matrix with a pivot at 0.7147. The price is below the main dynamic resistance levels, while the descending channel maintains a sequence of lower highs. A return towards 0.7042 should be viewed as a retest of the broken area while the market remains below 0.7056. A breakout below 0.7009 would open the potential towards 0.7001 and then the psychological 0.6980 area. Only consolidation above 0.7074 would weaken the current bearish impulse. The main H4 trend remains downward, so selling on corrections remains preferred.
AUDUSD forecast scenario
Trading scenario: SELL
- Price at the time of writing: 0.7030
- Entry price: 0.7025
- Stop Loss: 0.7038
- Take Profit: 0.7009
- Risk-to-reward ratio: 1:1.23
The trade idea is valid until 8:00 AM on 25 September 2026 (server time, UTC+3).
USDCAD forecast
The fundamental backdrop for USDCAD favours continued strong demand for the dollar, although expensive oil continues to support the Canadian currency. The Bank of Canada kept the overnight rate unchanged at 2.25% on 2 September. The regulator is monitoring two opposing risks: US tariffs are worsening Canada's growth outlook, while the energy shock is supporting inflation. BoC Governor Tiff Macklem warned on 21 September that new US tariffs could push Canadian economic growth in the fourth quarter below 1%, compared with an earlier forecast of around 1.5%.
Canadian inflation held at 3.0% year-on-year in August, while core measures remained around 2%, which does not yet require immediate policy tightening. At the same time, the August labour market weakened significantly: the economy lost 41,700 jobs, although unemployment remained at 6.4%. Oil is supporting the Canadian dollar because prices remain elevated due to the conflict in the Middle East, despite attempts by the US and Iran to make progress towards a diplomatic solution. On the US side, the set of factors is stronger: the Fed has already raised rates, the September US PMI reached 58.4, and Treasury yields remain high.
Therefore, the interest-rate differential and the relative resilience of the US economy support further gains in USDCAD, while oil limits the pace of the move. Intraday, the pair is particularly sensitive to oil news and US-Canada trade relations. A decline in Brent could weaken the Canadian dollar further, while another spike in oil could trigger a deeper correction in USDCAD. As long as the macroeconomic gap remains in favour of the US, fundamental pullbacks in the pair look more corrective than signals of a sustainable downward reversal.
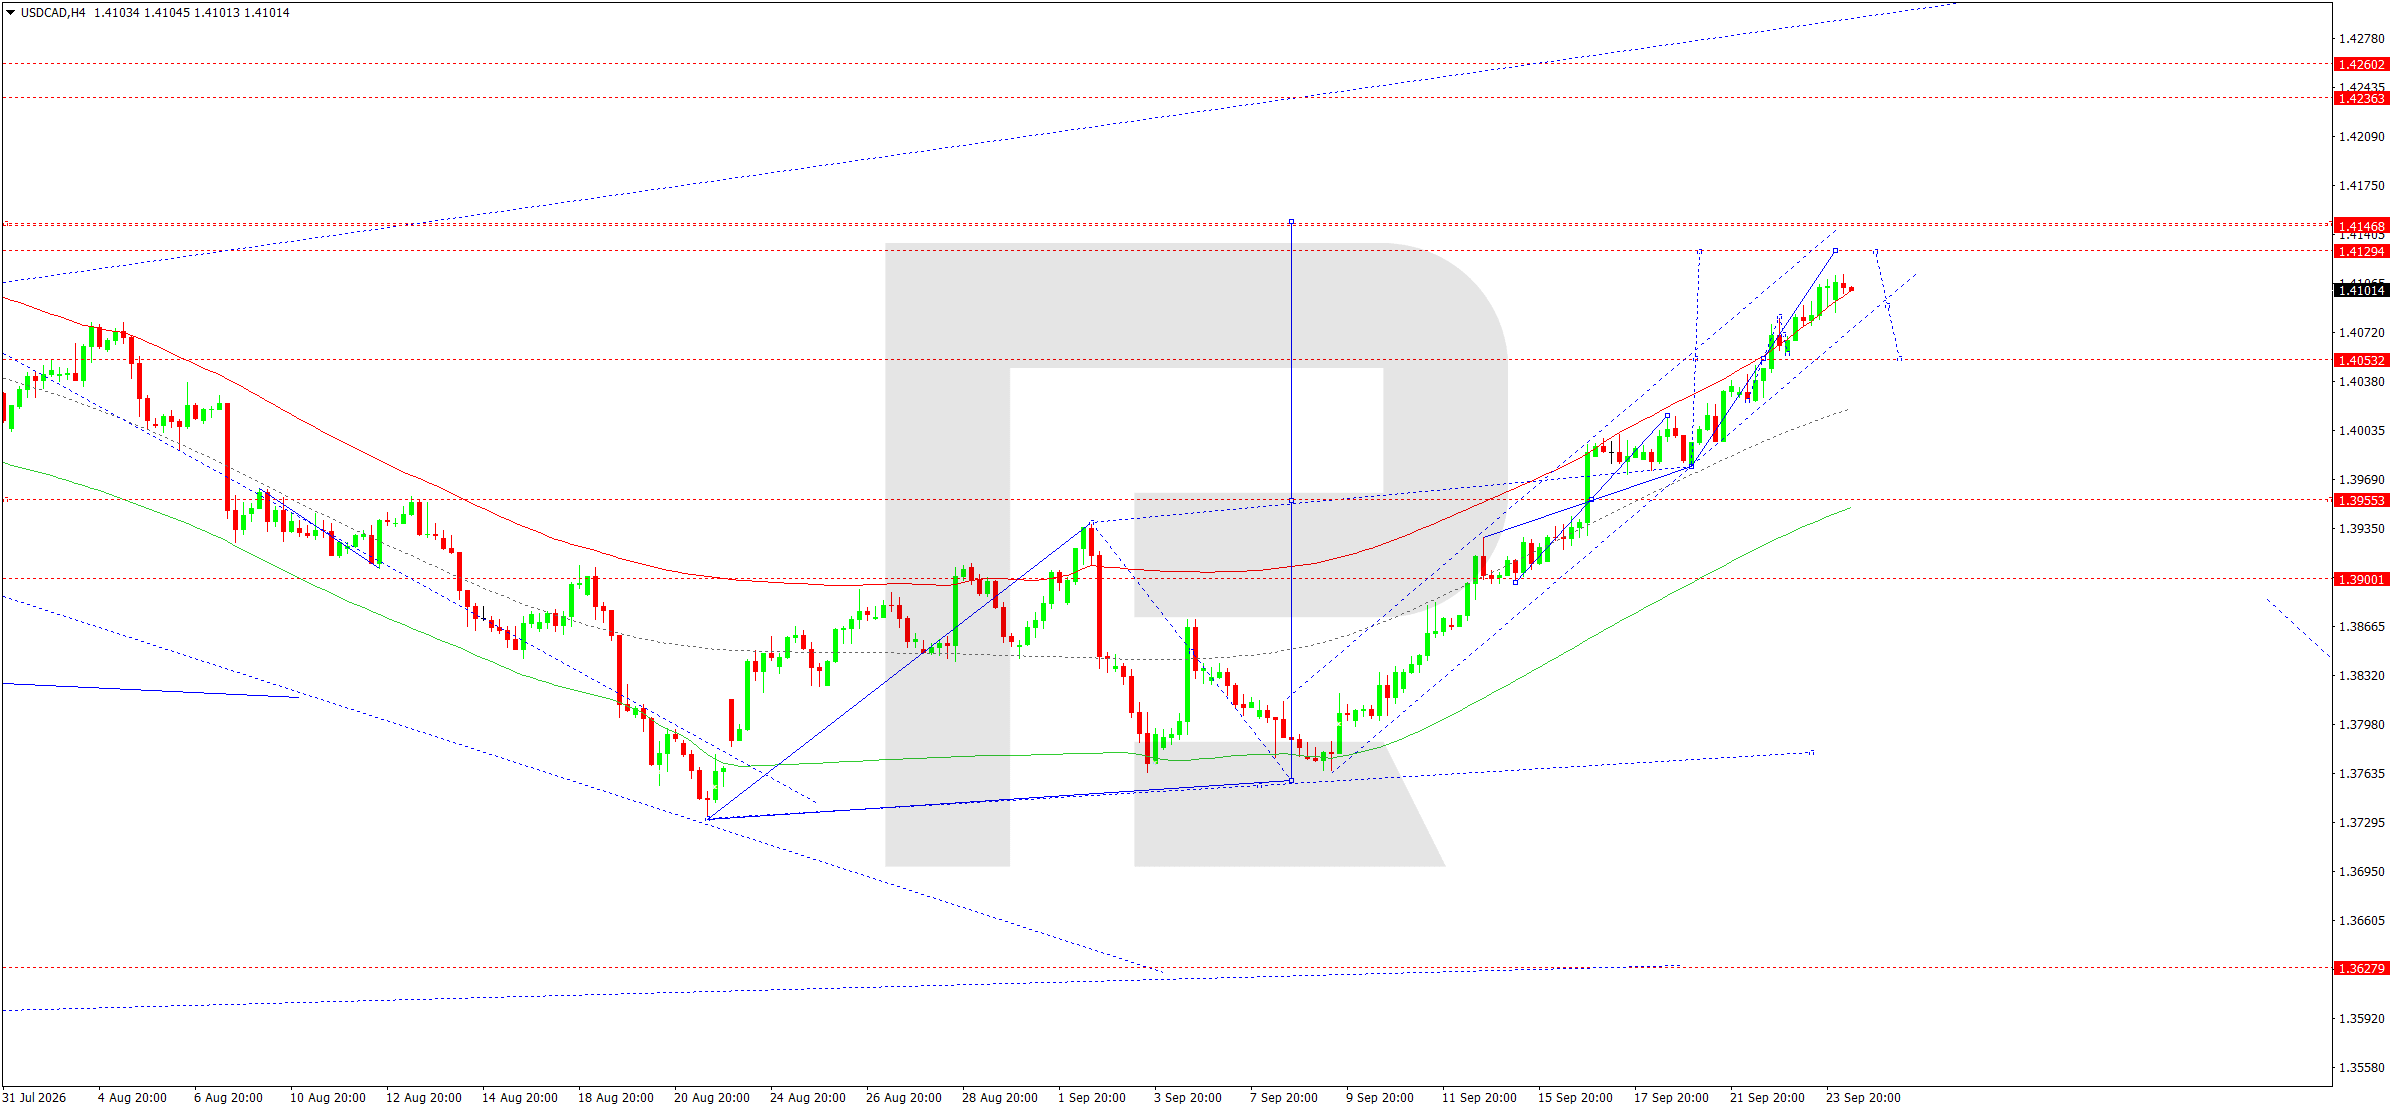
On the H4 chart, USDCAD maintains a pronounced upward trend. The market formed a rising wave towards 1.4113 and approached the upper part of the current Price Envelope. Today, 24 September, the development of a compact consolidation below resistance remains relevant. A breakout higher would make 1.4129 the next target, followed by the 1.4147 area. Once the impulse is complete, a correction towards 1.4055 is likely.
The scenario is confirmed by the Elliott Wave structure and the rising-wave Matrix with a pivot at 1.3955. The sequence of higher lows remains intact, and the price is holding above the dynamic averages and within the rising channel. The 1.4053 level is the nearest support. While it remains intact, priority stays with further growth. A move below 1.4053 would open the way towards 1.4022 and then 1.3955, but the main scenario assumes a test of 1.4129 first. The H4 trend remains upward, so buying with a short-term target at the nearest resistance remains preferred.
USDCAD forecast scenario
Trading scenario: BUY
- Price at the time of writing: 1.4063
- Entry price: 1.4068
- Stop Loss: 1.4038
- Take Profit: 1.4129
- Risk-to-reward ratio: 1:2.03
The trade idea is valid until 8:00 AM on 25 September 2026 (server time, UTC+3).
XAUUSD forecast
The fundamental backdrop for XAUUSD remains unfavourable in the short term due to the Fed's more hawkish stance and rising US bond yields. Following the September rate increase to 3.75–4.00%, the market continues to assess the probability of further tightening. A strong preliminary US Composite PMI reading of 58.4 strengthened the case for keeping rates high, while the 10-year Treasury yield climbed to its highest level since 2007. For gold, this means a higher opportunity cost of holding a non-yielding asset and additional support for the dollar.
At the same time, a geopolitical risk premium remains. The conflict between the US and Iran supports demand for safe-haven assets, although reports that the two sides are prepared to continue diplomatic contacts periodically reduce this premium. Oil remains near elevated levels after sharp swings, so inflation risks have not disappeared entirely. On 23 September, gold fell by more than 1% under pressure from hawkish rate expectations, while trading remained subdued on the morning of 24 September. Safe-haven demand therefore limits the depth of the decline, but has not yet offset pressure from yields and a strong dollar. A reversal in the fundamental impulse would require either a noticeable decline in US yields or a renewed sharp deterioration in the geopolitical backdrop.
The state of the equity market is another factor. A decline in US indices amid rising yields could provide some support to gold as a defensive asset, although this effect is usually limited when the dollar strengthens at the same time. Therefore, the key combination for the current session remains the movement in 10-year US Treasury yields, the dollar index, and news from the Middle East. If yields continue to rise, the technical scenario of a decline towards 4,218 will receive fundamental confirmation during the next trading session.
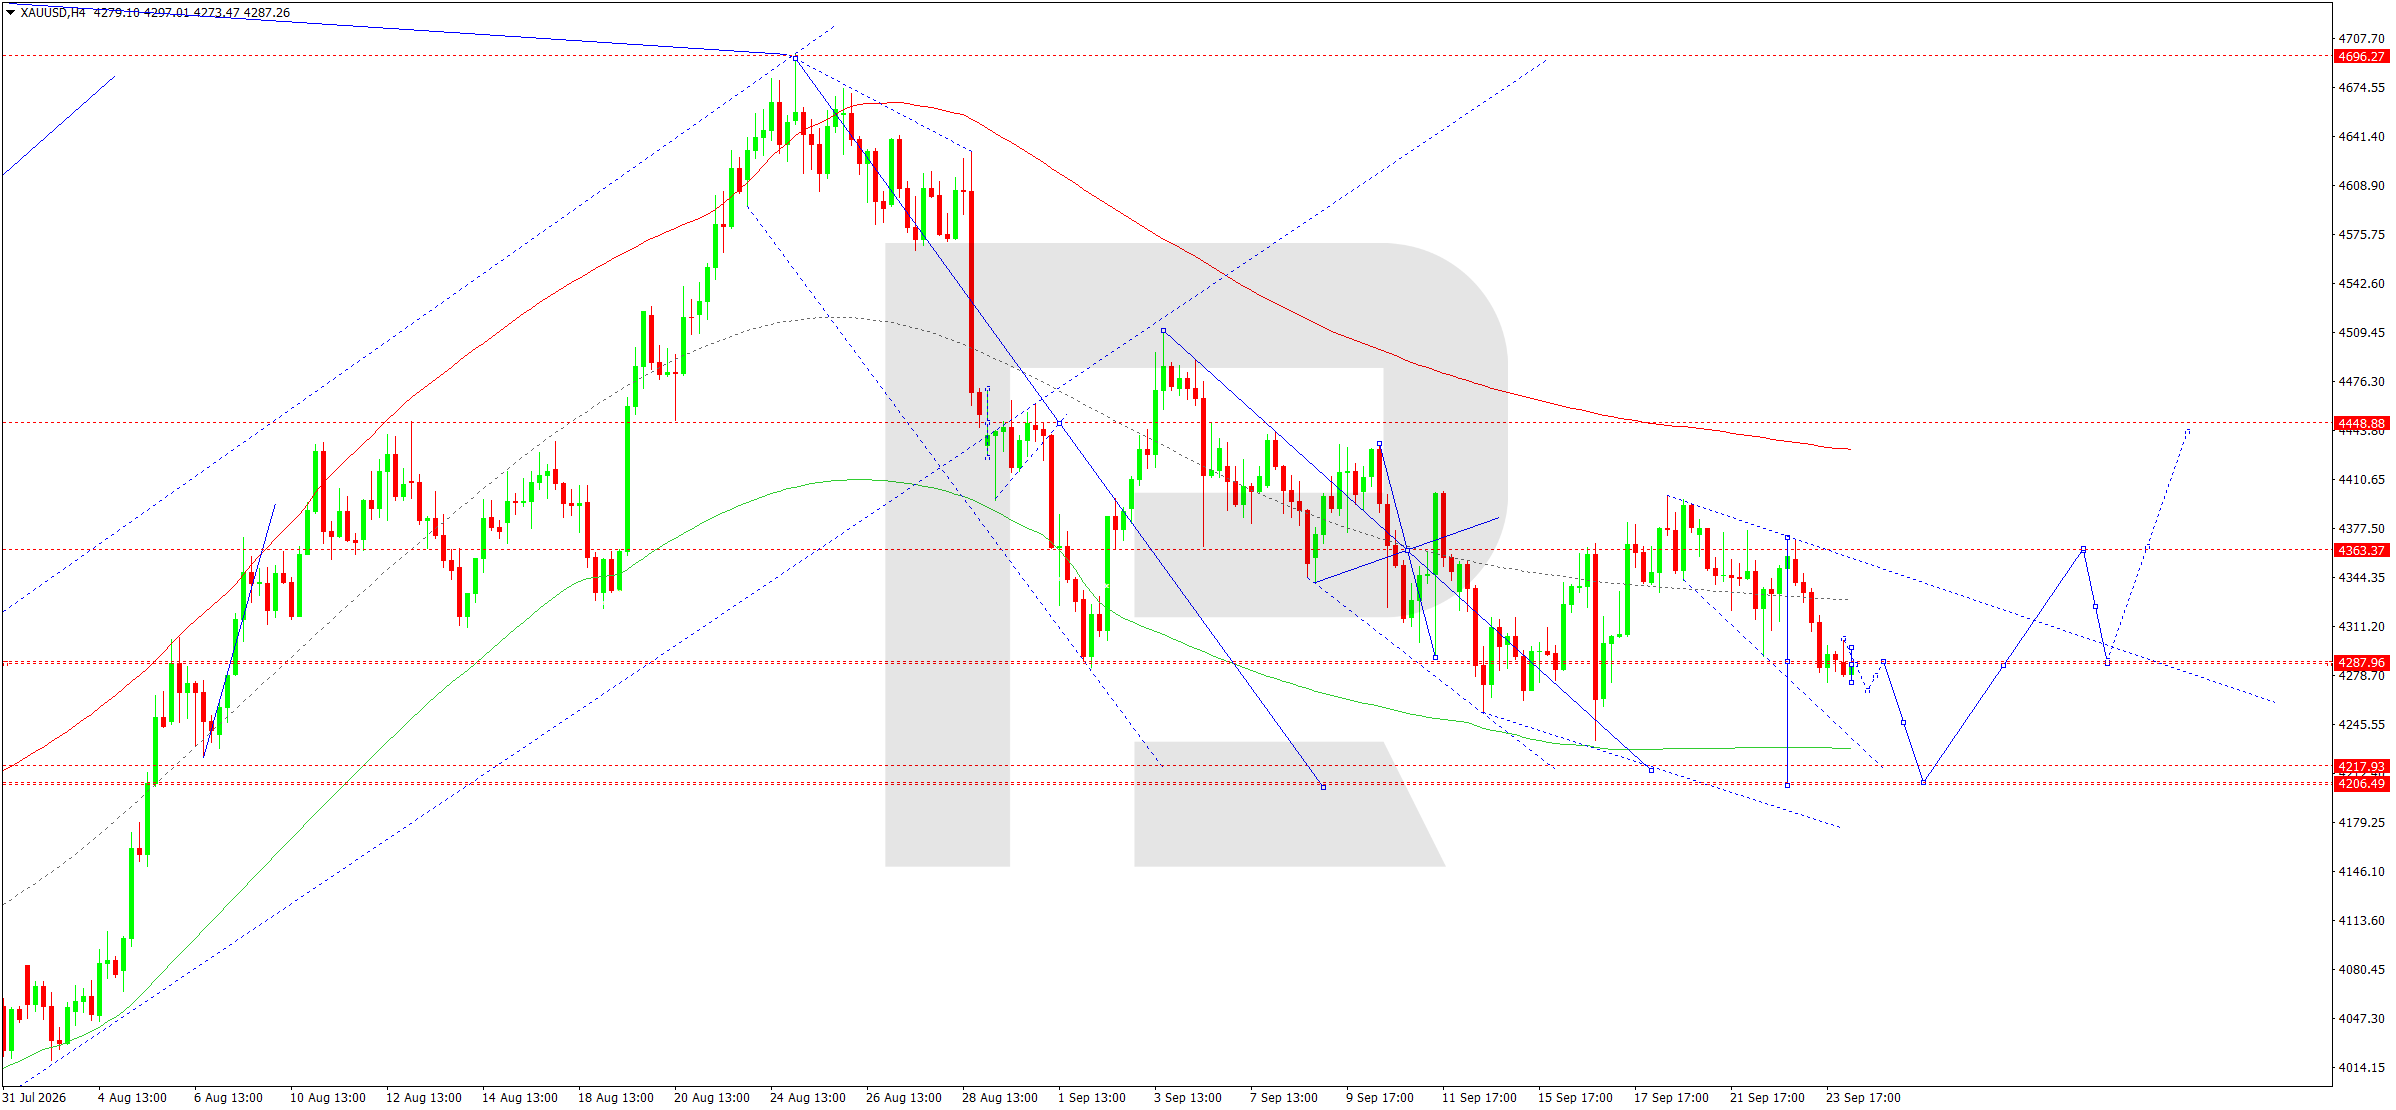
On the H4 chart, XAUUSD continues to form a consolidation range around 4,288 after another downward wave. Today, 24 September, the main scenario remains a downside breakout from this structure towards 4,218. A firm break of support would extend the potential towards 4,208, which is viewed as the first local target for continuation of the downtrend.
The scenario is confirmed by the Elliott Wave structure and the declining-wave Matrix with a pivot at 4,363. The price remains below key dynamic resistance levels and within a bearish structure. The 4,288 area acts as a local balance point, while 4,363 remains important resistance and the upper boundary of the nearest range. A decline towards 4,218 corresponds to a move towards the lower part of the Price Envelope. After reaching this area, a correction back towards 4,290 is possible, but while the price remains below 4,363, any rise should be viewed as corrective. A breakout below 4,208 would open the way towards 4,179, while a return above 4,363 would weaken the bearish setup. The main H4 trend remains downward, so selling remains preferred.
XAUUSD forecast scenario
Trading scenario: SELL
- Price at the time of writing: 4,282
- Entry price: 4,277
- Stop Loss: 4,300
- Take Profit: 4,218
- Risk-to-reward ratio: 1:2.57
The trade idea is valid until 8:00 AM on 25 September 2026 (server time, UTC+3).
US 500 forecast
The fundamental backdrop for the US 500 remains tense due to a combination of strong economic activity, high bond yields, and a more hawkish Fed. After the 16 September rate increase to 3.75–4.00%, market participants began pricing in a greater probability of further tightening. The preliminary US Composite PMI for September rose to 58.4, the highest since July 2021, while faster new-order growth was accompanied by stronger price pressure. Against this backdrop, the 10-year Treasury yield climbed to its highest levels since 2007, increasing the discount rate applied to future corporate earnings and putting pressure on equities.
At the same time, the fundamental picture is not uniformly negative. Earlier in the week, the market received support from renewed optimism around artificial intelligence: the technology sector and Nasdaq reached new highs, while lower oil prices temporarily eased inflation concerns. However, on 23 September, rising oil prices and yields again pushed the main indices lower. Additional sources of uncertainty include US-Iran talks and expectations of a US-China summit. Sustainable growth in the US 500 therefore requires stabilisation in yields and the absence of a new energy shock. Until that happens, high rates and expensive oil create conditions for profit-taking after the recent rise. The market's reaction to US yields is particularly important for intraday dynamics.
If 10-year yields consolidate at elevated levels, pressure on growth companies and the technology sector may persist, supporting a move in the US 500 towards 7,657. Conversely, lower yields driven by softer Fed comments or diplomatic progress in the Middle East could restore demand for risk. For now, technical profit-taking coincides with a deterioration in financing conditions, making a corrective scenario logical for the next trading session.
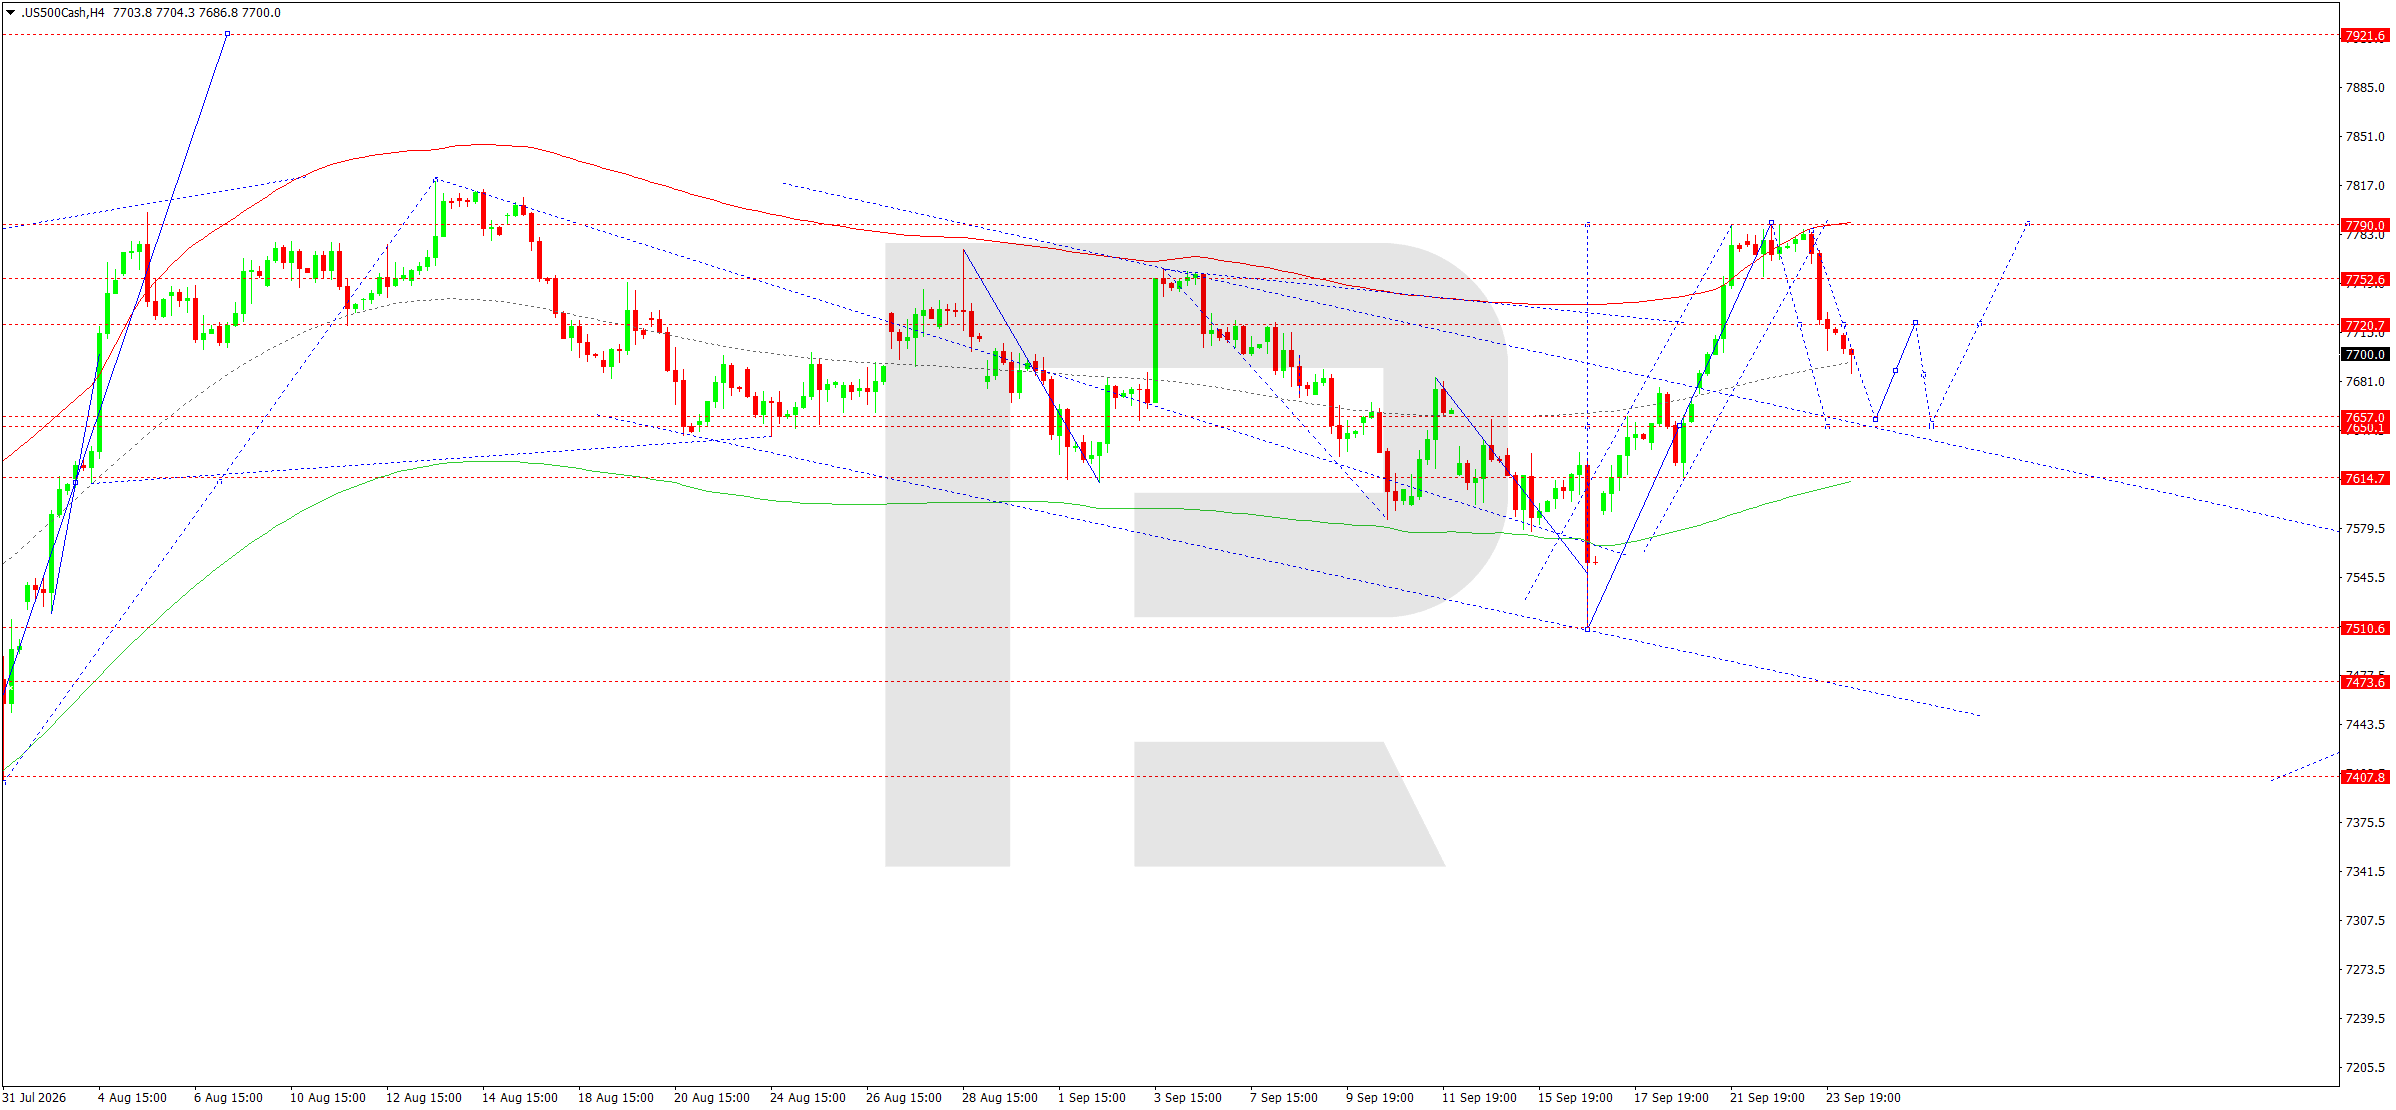
On the H4 chart, the US 500 completed an upward structure towards 7,790 and formed a consolidation range directly below this resistance. After an unsuccessful attempt to continue higher, an impulsive downward wave emerged. Today, 24 September, the main scenario is an expansion of the range lower towards 7,657.
The scenario is confirmed by the Elliott Wave structure and the rising-wave Matrix with a pivot around 7,650. The upper boundary of the Price Envelope runs through the 7,790 area, where the market received a reversal signal. The 7,721 level acts as intermediate resistance, while the 7,657–7,650 area is the nearest corrective target and a key support zone. A breakout below 7,650 would increase the probability of a decline towards 7,615, while a return above 7,753 would reopen the way towards 7,790. The medium-term structure still retains elements of growth, but the short-term H4 impulse is directed lower. Therefore, selling with a target at the lower part of the range is preferred for the current session.
US 500 forecast scenario
Trading scenario: SELL
- Price at the time of writing: 7,689
- Entry price: 7,684
- Stop Loss: 7,700
- Take Profit: 7,657
- Risk-to-reward ratio: 1:1.69
The trade idea is valid until 8:00 AM on 25 September 2026 (server time, UTC+3).
BTCUSD forecast
As of 24 September 2026, the fundamental backdrop for BTCUSD remains mixed and largely dependent on global risk appetite. At the start of the week, Bitcoin received support from a strong recovery in technology shares and lower US Treasury yields: on 21 September, the cryptocurrency gained more than 6% as risk sentiment improved. However, the subsequent rise in yields and the Fed's hawkish stance renewed pressure. Following the September rate increase to 3.75–4.00%, strong US PMI data and accelerating price pressure reinforced expectations of a longer period of expensive money. For BTC, this means tighter liquidity conditions and greater appeal of fixed-income dollar instruments.
The regulatory backdrop also remains mixed. On 15 September, the US Senate failed to advance a comprehensive cryptocurrency regulation bill, after which Bitcoin fell by around 4%. At the same time, the US Securities and Exchange Commission announced a five-year exemption for trading tokenised equities, supporting the development of digital-asset infrastructure, although the decision does not guarantee a direct impact on BTC demand. Geopolitics and oil dynamics also matter through the channel of inflation expectations and yields. As a result, the fundamental backdrop does not rule out a continued medium-term recovery, but rising rates and yields increase the risk of a correction over the next session.
A key external indicator for BTCUSD remains the behaviour of the Nasdaq and US bond yields. A renewed decline in yields could quickly restore demand for digital assets, while 10-year yields holding near multi-year highs would support the correction. Another risk is the market's high sensitivity to flows into cryptocurrency funds and to new statements from US regulators, so intraday volatility may remain elevated in the current session.
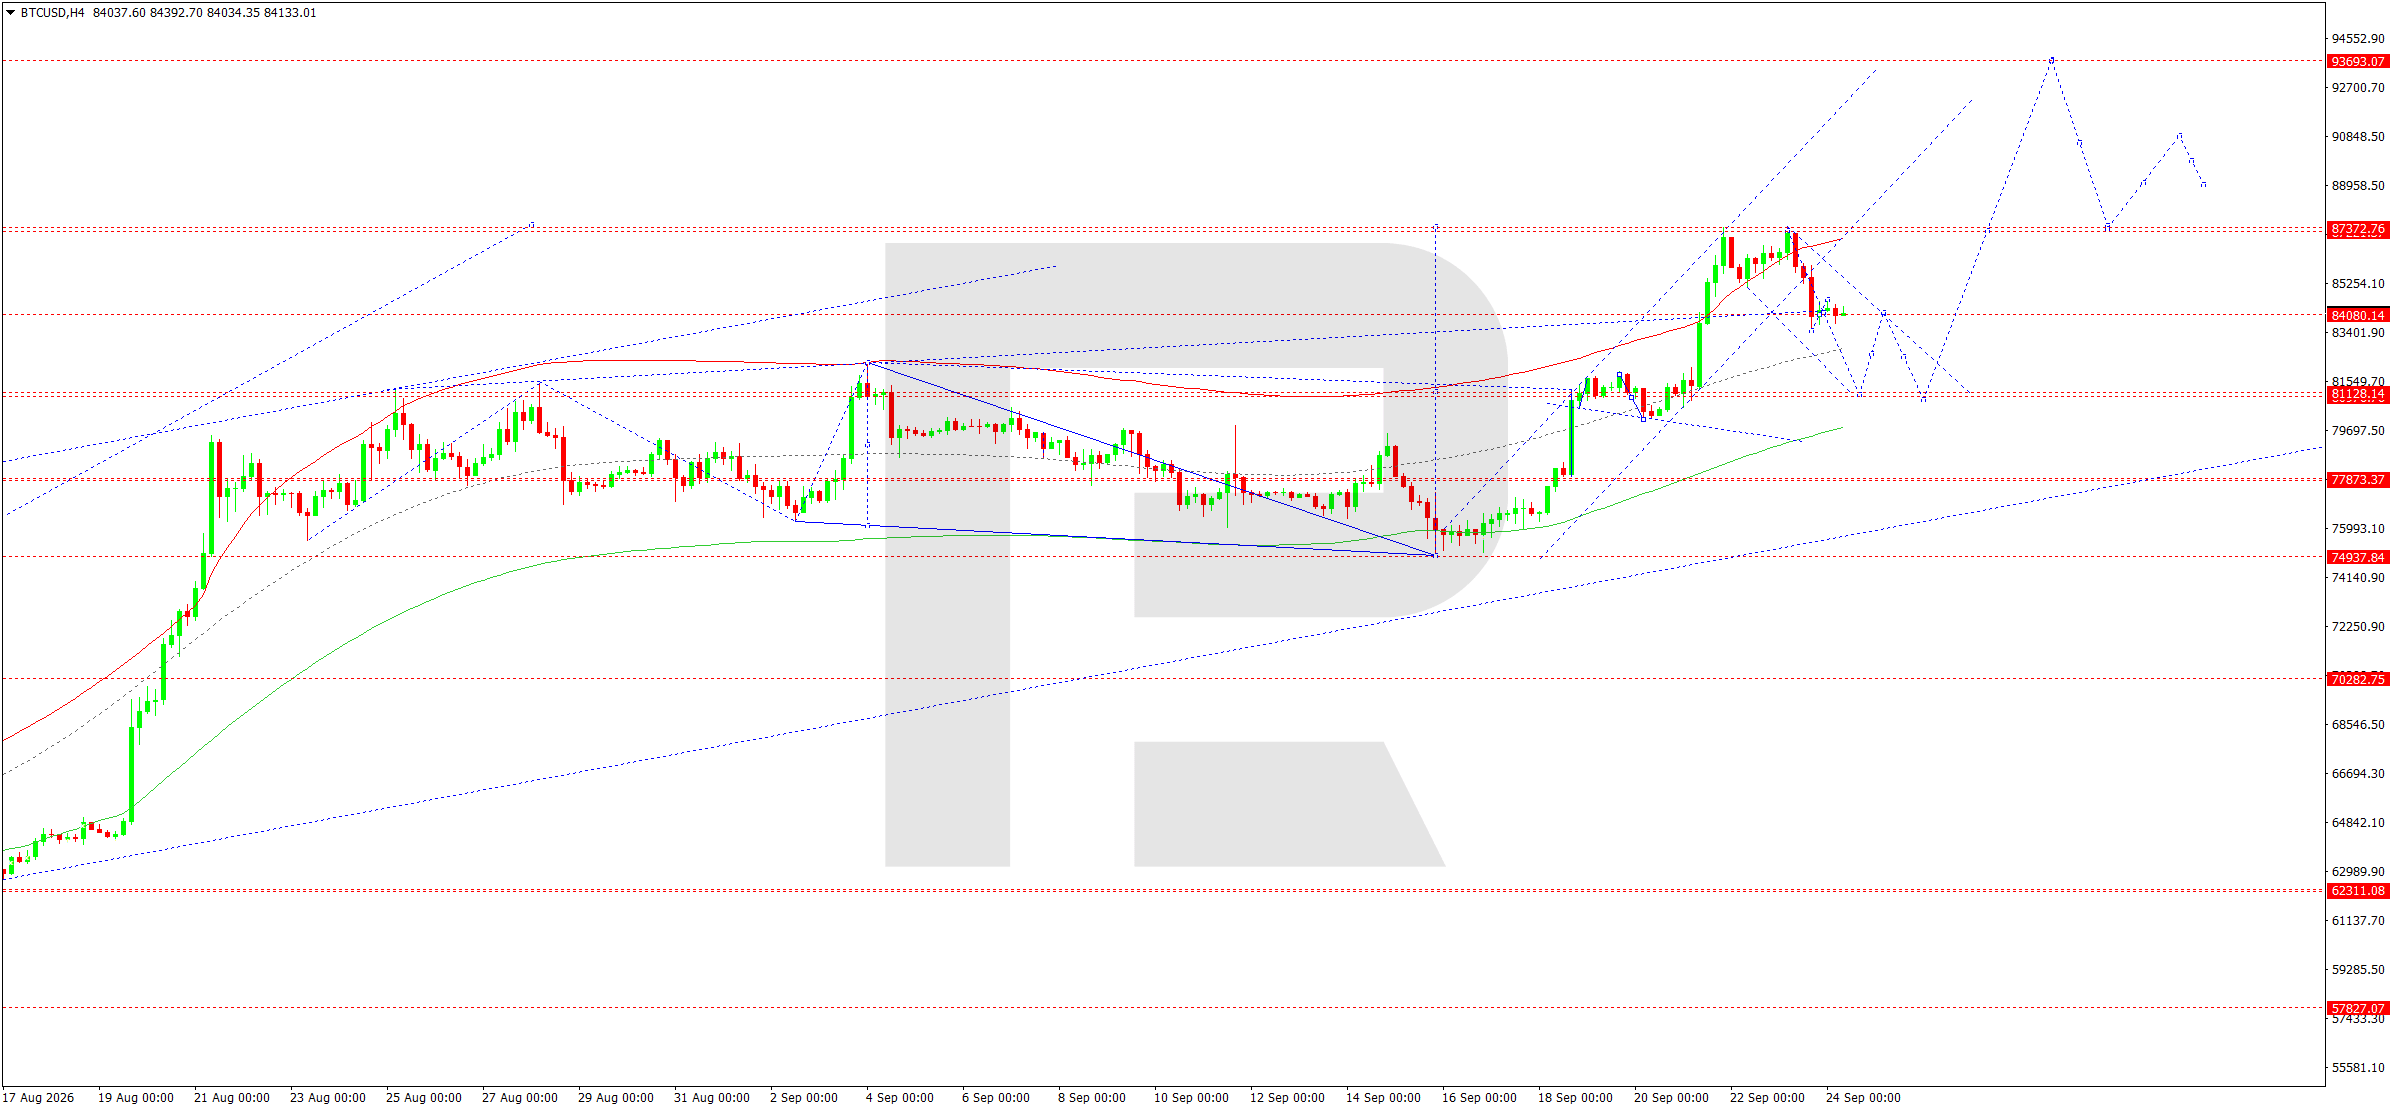
On the H4 chart, BTCUSD completed an upward impulse towards 87,337 and formed a reversal structure below this resistance. Today, 24 September, the correction is expected to continue towards 84,000, after which the main target is the 81,128 area. A firm breakout below this zone would open the potential for a further decline towards 77,873.
The scenario is confirmed by the Elliott Wave structure and the rising-wave Matrix with a pivot at 81,128. The upper boundary of the Price Envelope around 87,337 halted the upward impulse, after which the price began forming a sequence of lower local highs. The 84,000 area is the central line of the current structure and is already being tested by the market. If sellers keep the price below 85,000, the probability of a move towards 81,128 will remain high. A return above 87,337 would invalidate the immediate corrective scenario and restore the upside potential towards 93,693. The medium-term structure remains constructive, but the short-term H4 impulse is directed lower, so selling within the correction remains preferred.
BTCUSD forecast scenario
Trading scenario: SELL
- Price at the time of writing: 84,080
- Entry price: 84,075
- Stop Loss: 85,300
- Take Profit: 81,128
- Risk-to-reward ratio: 1:2.41
The trade idea is valid until 8:00 AM on 25 September 2026 (server time, UTC+3).
Editors’ picks
 EURUSD forecast 2026–2027: technical analysis, price levels & predictions
The EURUSD outlook for 2026 and 2027: key levels on the daily chart, three trading scenarios and the policy gap between the Fed and the ECB that drives the pair.
 Gold (XAUUSD) forecast 2026: technical analysis, price levels & predictions
Where gold could trade in 2026: key levels, three trading scenarios with entry triggers and the forecasts from J.P. Morgan, Deutsche Bank and Goldman Sachs.
Forecasts presented in this section only reflect the author’s private opinion and should not be considered as guidance for trading. RoboForex bears no responsibility for trading results based on trading recommendations described in these analytical reviews.