
Daily technical analysis and forecast for 25 September 2026
Daily technical analysis and forecast for EURUSD, USDJPY, GBPUSD, AUDUSD, USDCAD, XAUUSD, US 500, and BTCUSD for 25 September 2026.
Each scenario on this page reflects the market structure on the H4 chart as of 10:00 UTC+3 on 25 September 2026. The assessment considers the current H4 chart structure, key support and resistance levels, the direction of the medium-term movement, and the prevailing fundamental backdrop.
EURUSD forecast
On 25 September 2026, EURUSD remains under pressure from a more hawkish reassessment of monetary policy in the US and the eurozone, but the dollar retains the short-term advantage. The US Federal Reserve raised the target rate range to 3.75–4.00% on 16 September and indicated the possibility of further tightening, as rising energy prices continue to support inflation risks. Against this backdrop, US Treasury yields continue to rise, while the dollar index is heading towards a second consecutive weekly gain.
The European Central Bank also raised rates by 25 basis points on 10 September, but this proved insufficient to support the euro: the market is reacting more strongly to rising US yields and demand for the dollar. The ECB's September forecasts imply eurozone inflation of around 3.0% in 2026 with GDP growth of only around 0.9%, increasing the risk of a combination of weak activity and persistent price pressure. Expensive oil amid tensions in the Middle East remains an additional factor. For EURUSD, the fundamental balance at the start of the European session remains moderately negative. Rising global bond yields are creating additional pressure on the euro: investors are demanding a higher premium for inflation and fiscal risks, supporting the US currency.
At the same time, ECB policy itself has already become noticeably tighter: the regulator raised all three key rates by 25 basis points, while its forecast assumes an acceleration in headline inflation later in 2026 due to the energy component. Therefore, the fundamental scenario is not simply one of one-sided euro weakness. The main question for the market is the relative pace of further tightening by the Fed and the ECB. While the US yield curve reacts more strongly, the dollar retains a relative advantage. On an intraday horizon, this increases the probability that EURUSD recovery attempts will meet selling near the nearest technical resistance levels.
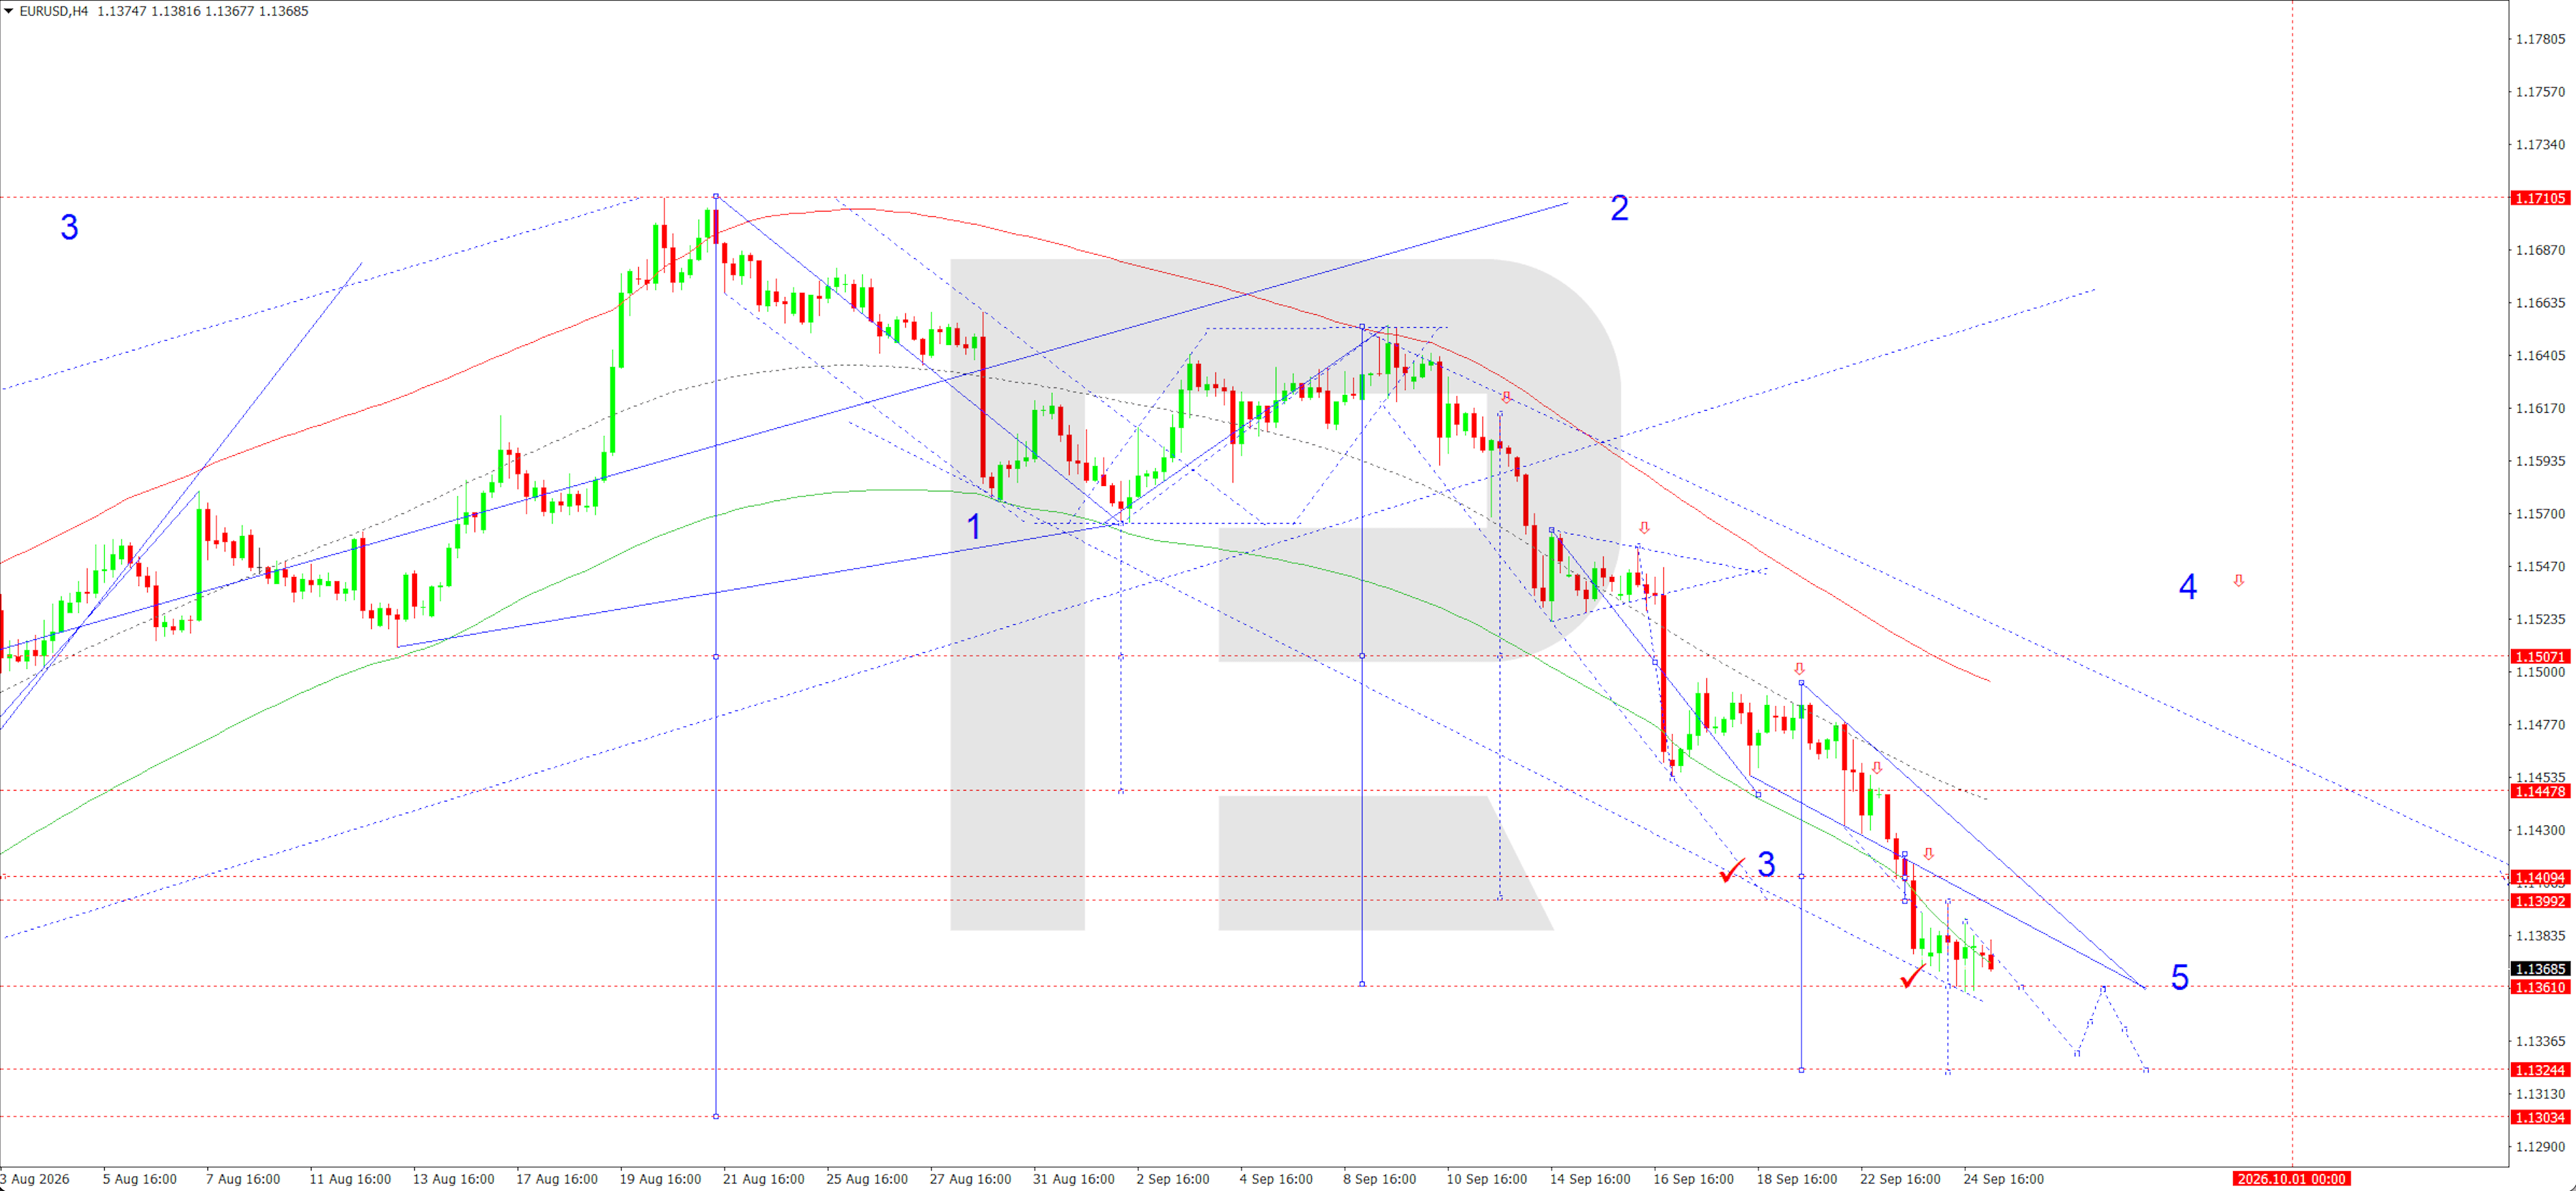
On the H4 chart, a pronounced downward structure remains in place. After breaking 1.1409, the market formed an impulse towards the lower boundary of the Price Envelope around 1.1360 and remains below the moving averages, which are pointing lower. The Elliott Wave count indicates the development of a fifth downward wave, while the declining-wave Matrix with a pivot around 1.1535 keeps selling as the priority. In the near-term structure, a corrective leg towards 1.1388–1.1399 is possible and would be viewed as a test from below of the previously broken area.
While the price remains below 1.1409, the main scenario assumes a continuation of the decline first towards 1.1331–1.1325 and, if momentum strengthens, towards 1.1303. A return above 1.1409 would weaken the current bearish setup and increase the probability of a deeper correction towards 1.1448, but the base H4 trend remains downward. For the current day, selling after local pullbacks is preferred because the structure of highs and lows continues to move lower consistently. The key control area for assessing seller strength today remains 1.1388–1.1409 on the four-hour chart.
EURUSD forecast scenario
Trading scenario: SELL
- Price at the time of writing: 1.1373
- Entry price: 1.1368
- Stop Loss: 1.1399
- Take Profit: 1.1325
- Risk-to-reward ratio: 1:1.39
The trade idea is valid until 8:00 AM on 26 September 2026 (server time, UTC+3).
USDJPY forecast
On 25 September 2026, USDJPY is trading amid simultaneous monetary tightening by two central banks, but the dollar retains an advantage due to the faster rise in US yields. The US Federal Reserve raised the rate to a range of 3.75–4.00% on 16 September and made it clear that another increase this year remains possible. Rising oil prices and inflation expectations support US Treasury yields and demand for the dollar. The Bank of Japan also raised its rate to 1.25% on 18 September, the highest in 31 years, but the decision was taken with two dissenting votes, reducing market confidence in the pace of further tightening. At the same time, Japanese government bond yields climbed towards multi-year highs, reflecting persistent inflation risk.
The yen is receiving some support from expectations of possible action by the authorities in the foreign exchange market, so the 159–160 area remains sensitive to verbal intervention. As a result, the fundamental backdrop allows for high intraday volatility: a strong dollar supports USDJPY, but intervention risk and BoJ rate increases limit the upside. A sharp rise in JGB yields is an important counterweight to the dollar: on 24 September, Japanese government bond yields rose amid renewed inflation concerns. This raises the cost of yen funding and gradually reduces the appeal of traditional carry-trade positions. Nevertheless, the foreign exchange market's reaction to the BoJ's September rate increase was restrained because disagreements within the board led market participants to doubt the pace of the next steps.
Therefore, the 157.77–156.48 area has a dual significance: technically it forms support, while fundamentally yen demand may strengthen there if Japanese yields continue to rise. On the other hand, a sustained breakout above 159.00 would increase the risk of a move towards the psychological 160.00 area, where the market's sensitivity to statements from Japanese authorities would become especially high.
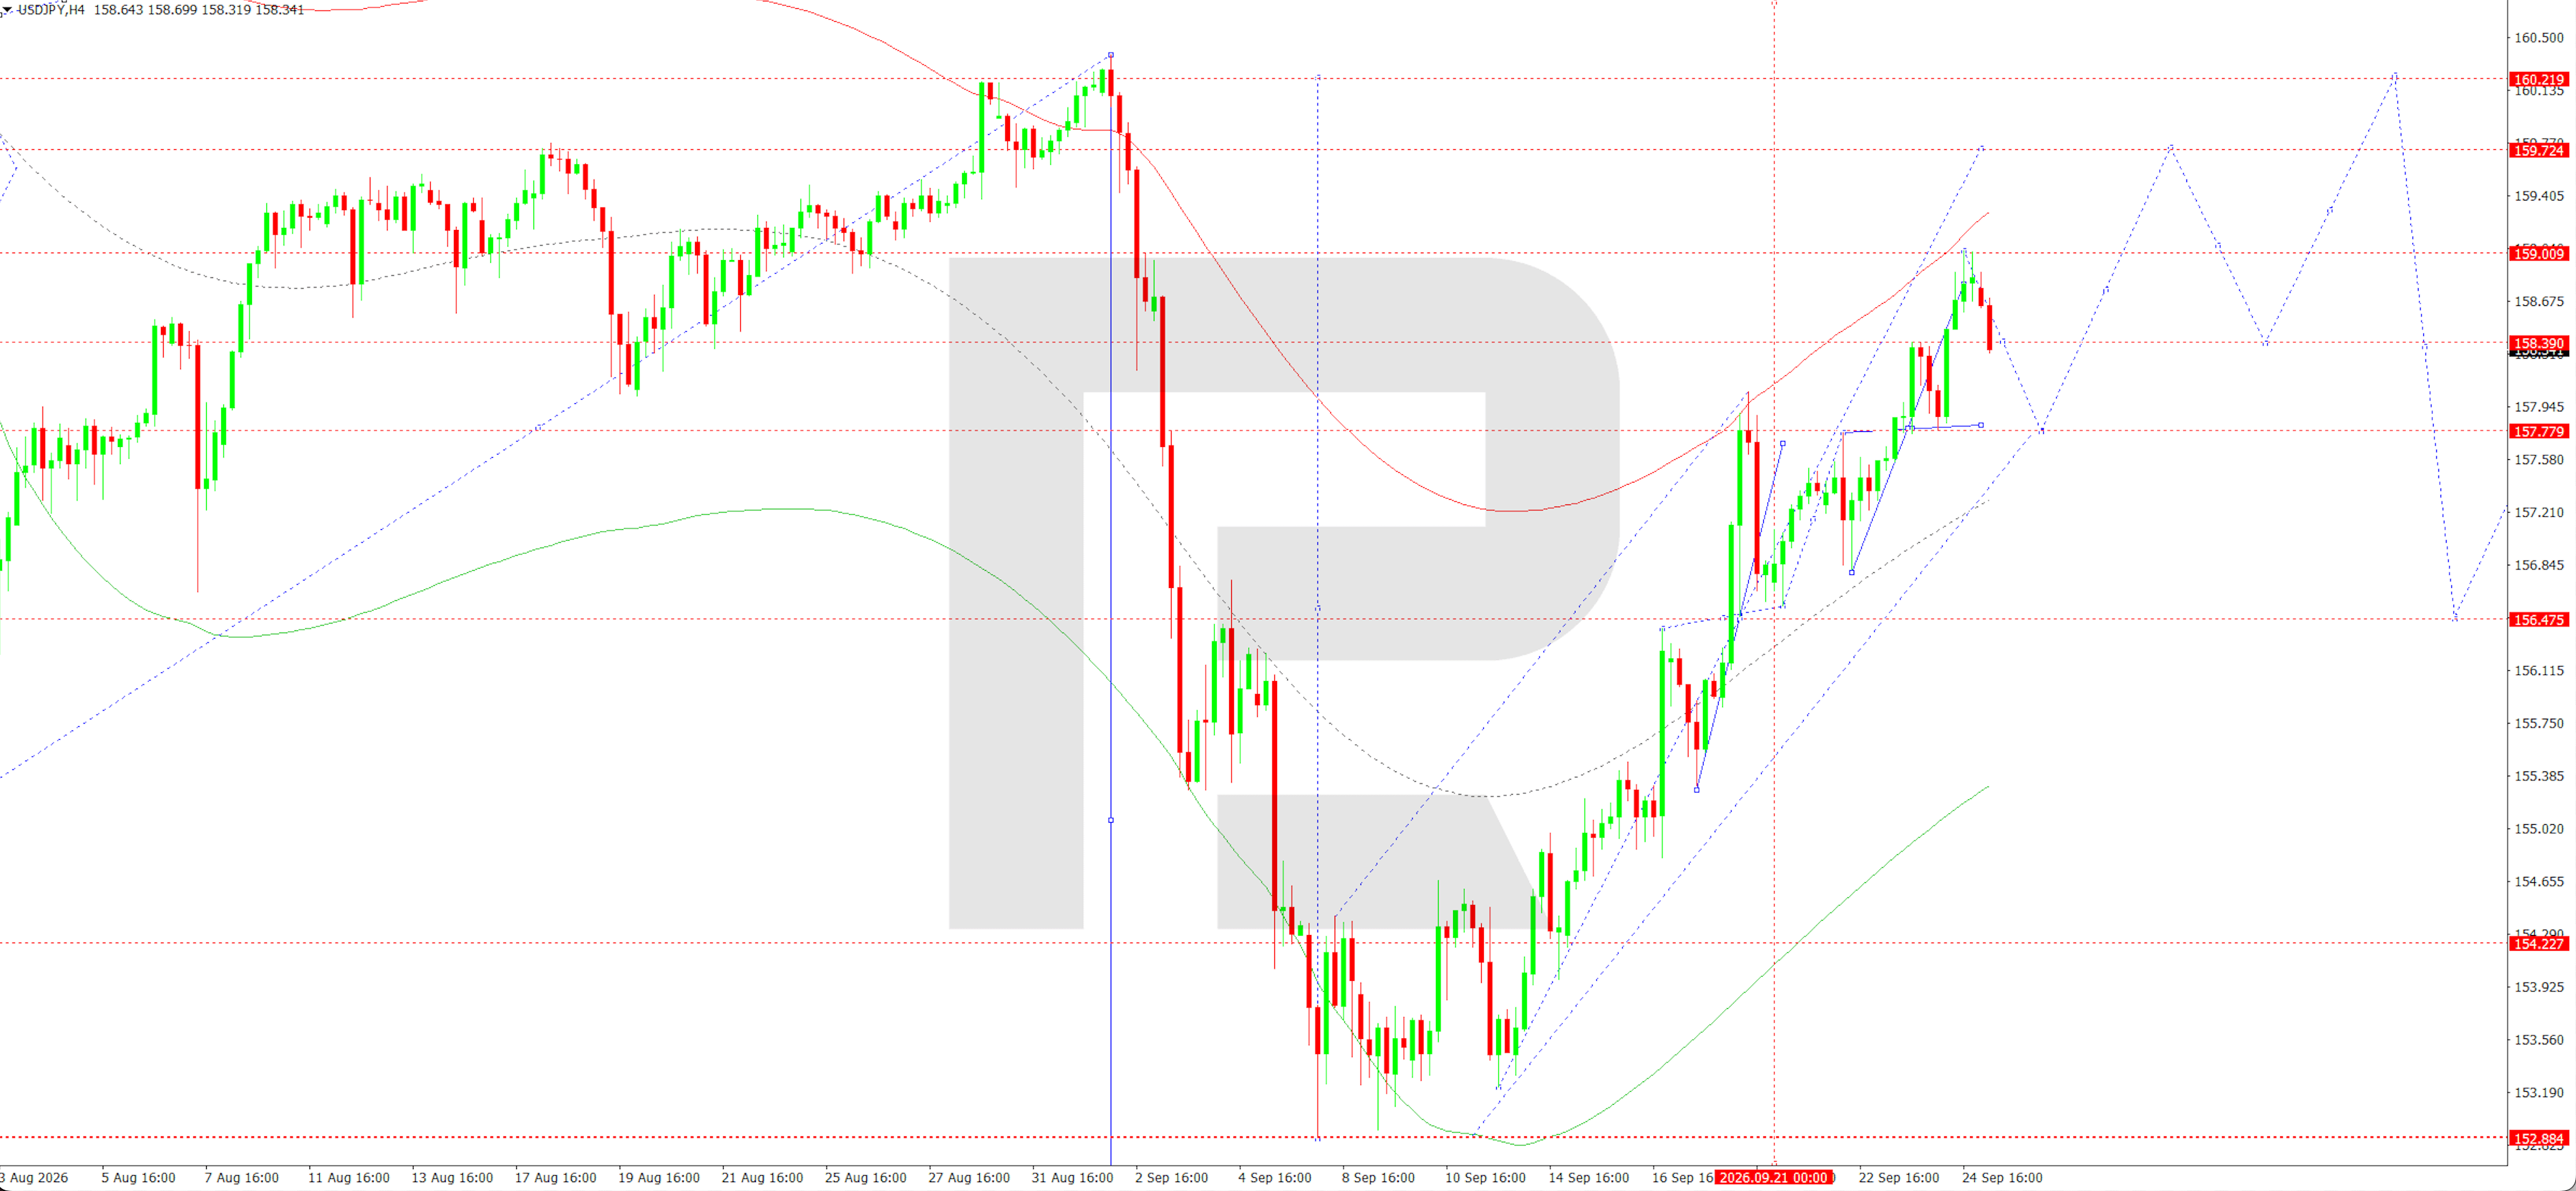
On the H4 chart, after an impulse towards the upper boundary of the Price Envelope around 159.00, the market reversed and found support near 158.26. A local downward correction is now developing, with 157.77 as the nearest target. The Elliott Wave structure and the rising-wave Matrix with a pivot around 156.45 show that the current decline may still remain corrective within a broader upward pattern.
After a test of 157.77, another recovery attempt towards 158.39–158.40 is possible, and if the price consolidates above this area, towards 159.00 and 159.72. However, until the current downward leg is complete, sellers retain the advantage. A breakout below 157.77 would extend the correction towards 156.48, where an important support zone and the lower part of the current wave structure are located. A return above 159.00 would invalidate the short-term downside scenario and once again make 159.72–160.22 the main target. For the current session, the base case remains a move lower towards 157.77 followed by an assessment of buyer reaction. The key control area for the intraday structure remains 157.77–158.40, where the main market reaction is expected during the current session.
USDJPY forecast scenario
Trading scenario: SELL
- Price at the time of writing: 158.18
- Entry price: 158.13
- Stop Loss: 158.41
- Take Profit: 157.77
- Risk-to-reward ratio: 1:1.29
The trade idea is valid until 8:00 AM on 26 September 2026 (server time, UTC+3).
GBPUSD forecast
On 25 September 2026, sterling remains under pressure from a strong dollar despite the continued hawkish tone of the UK regulator. The US Federal Reserve raised the rate to 3.75–4.00% at its September meeting and left open the possibility of further tightening, supporting higher US bond yields and a stronger dollar. The Bank of England kept the rate unchanged on 17 September but warned that another increase could become necessary if inflation pressure remains persistent. Annual UK inflation accelerated to 3.1% in August, although some core components appeared calmer.
For sterling, this creates a contradictory backdrop: potentially tighter BoE policy limits the downside, but high energy prices worsen the outlook for an import-dependent economy and increase growth concerns. At the same time, the dollar is supported by elevated US yields and more cautious investor risk appetite. Therefore, the fundamental balance for GBPUSD at the start of the day remains moderately negative, while recovery moves are still seen mainly as corrections. The energy channel plays an important role. Rising oil and gas prices increase the UK's import costs, so they both support inflation and worsen the outlook for real consumption.
This combination complicates the BoE's task: higher rates can restrain prices but at the same time intensify pressure on weak domestic demand. For the currency, this is less unequivocal support than in a normal tightening cycle. Another factor is the movement in global bond markets: rising US yields support the dollar more quickly, while UK assets face their own slowdown risks.
Under these conditions, sterling needs either a noticeable decline in US yields or a stronger signal from the BoE to reverse the current downward trend. Until such conditions emerge, local GBPUSD rebounds remain technically vulnerable.
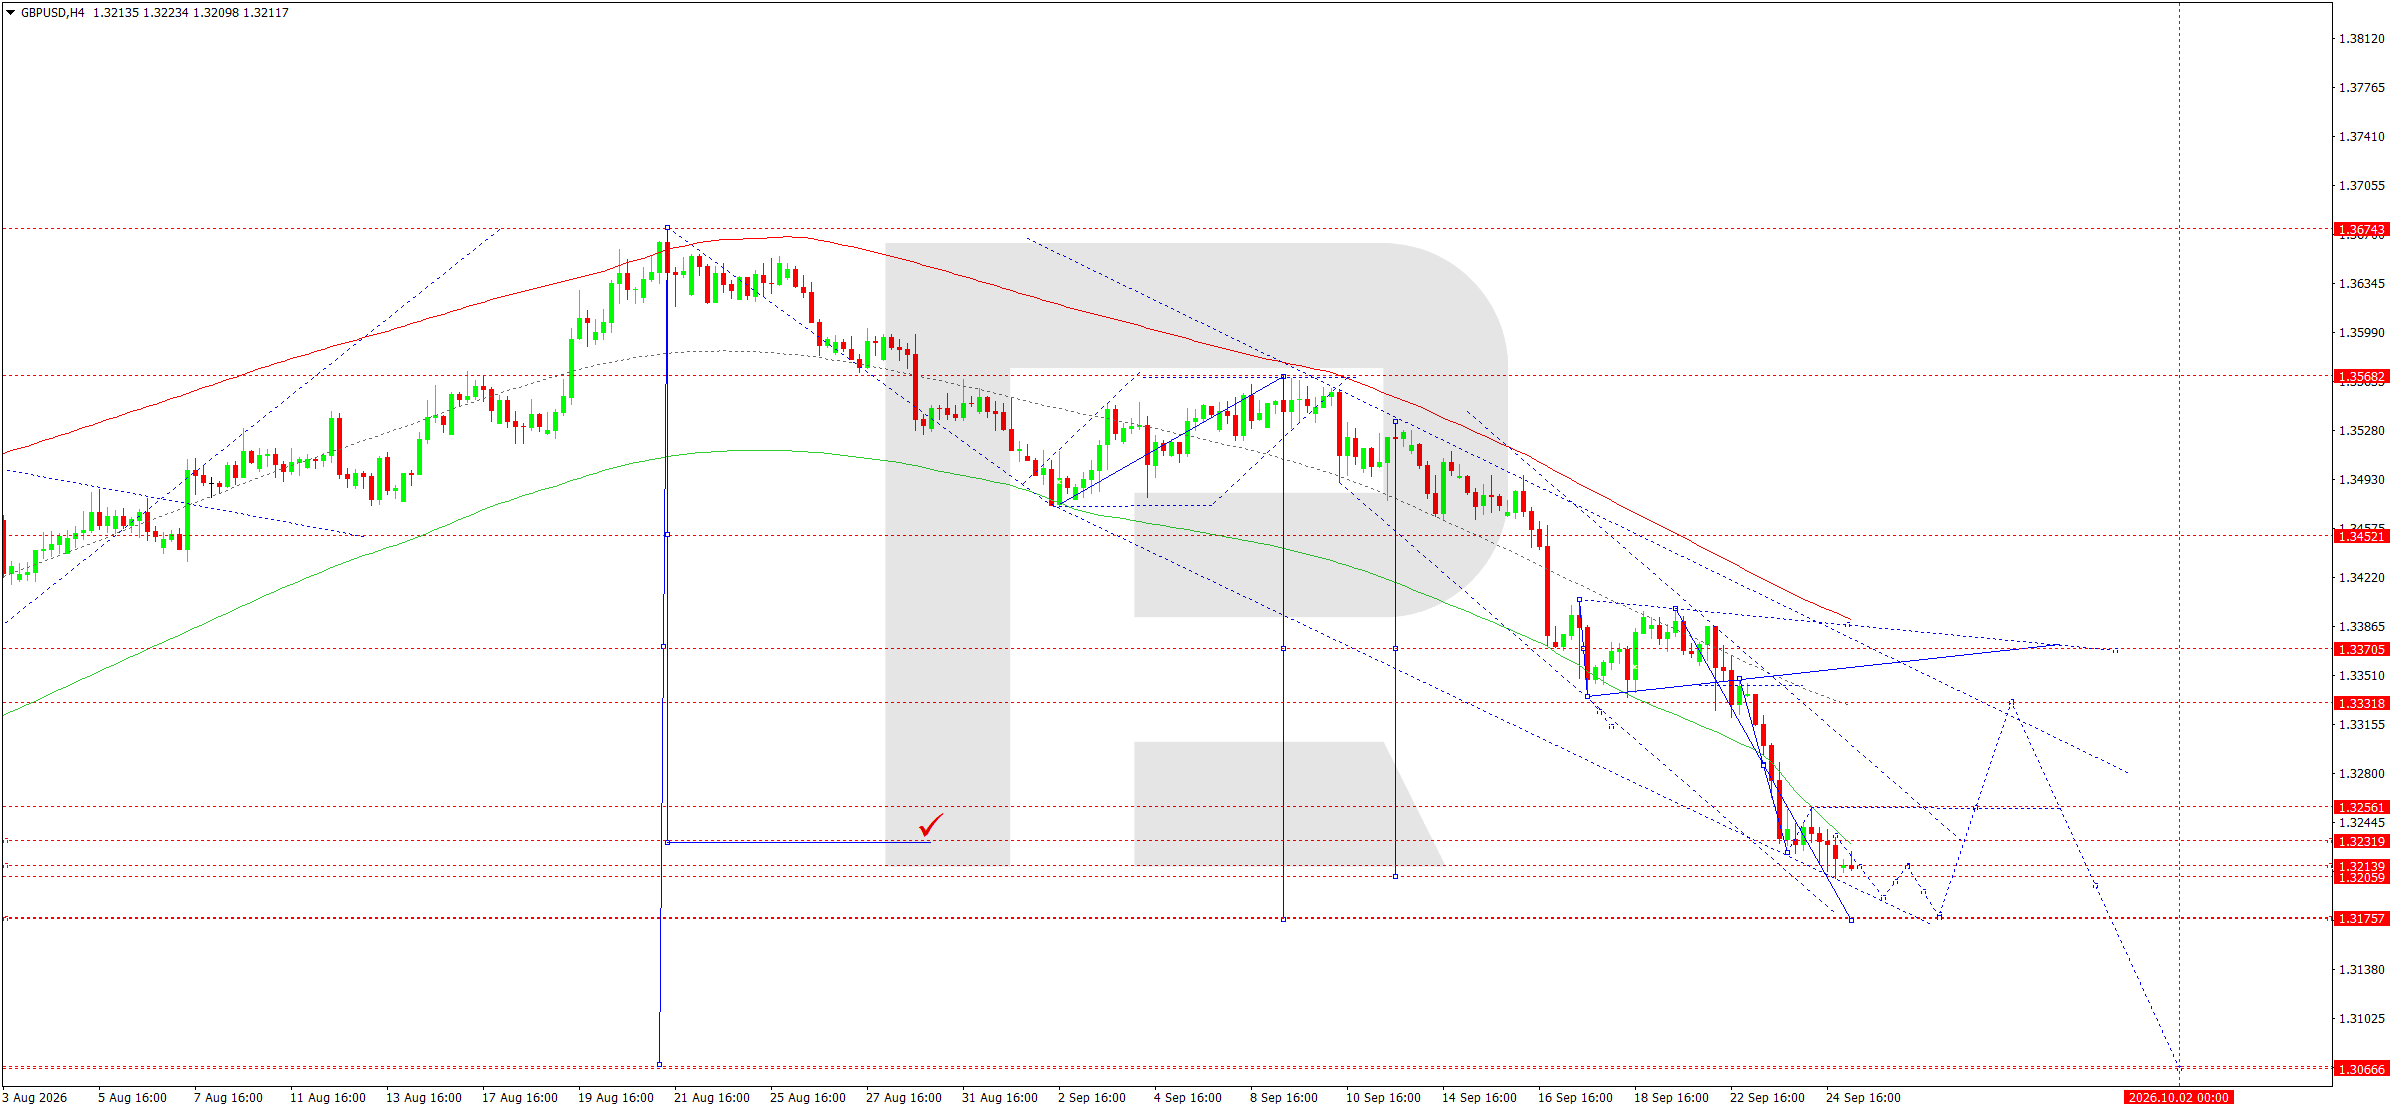
On the H4 chart, a consistent downward structure remains in place. The market completed a decline towards 1.3204 and remains below the main moving averages, which are directed lower. The declining-wave Matrix with a pivot around 1.3275 and the Elliott Wave structure confirm continued seller pressure. The price is currently near the lower boundary of the Price Envelope, so a correction towards 1.3222–1.3232 cannot be ruled out before the decline continues.
While the market remains below 1.3256, the main scenario assumes another test of 1.3204, followed by a decline towards 1.3190 and 1.3175. A breakout below 1.3175 could extend the move towards 1.3140 and then 1.3066, corresponding to the lower part of the broader downward structure. An alternative scenario would emerge only if the price returns above 1.3256 and consolidates above 1.3275; this would increase the probability of a correction towards 1.3332. For the current day, priority remains with selling on pullbacks, as the structure of local highs continues to decline and the price remains below dynamic resistance. The key seller-control zone today remains 1.3222–1.3256, limiting the pair's corrective recovery potential.
GBPUSD forecast scenario
Trading scenario: SELL
- Price at the time of writing: 1.3216
- Entry price: 1.3211
- Stop Loss: 1.3232
- Take Profit: 1.3175
- Risk-to-reward ratio: 1:1.71
The trade idea is valid until 8:00 AM on 26 September 2026 (server time, UTC+3).
AUDUSD forecast
On 25 September 2026, AUDUSD is being influenced by opposing factors. The US Federal Reserve remains hawkish after the September rate increase to 3.75–4.00%, while rising Treasury yields support the dollar. The Reserve Bank of Australia is also strengthening its anti-inflation rhetoric. RBA Governor Michele Bullock said on 22 September that inflation risks could materialise amid high energy prices and persistent domestic demand. The cash rate has already been raised to 4.35%, and the market is actively assessing the probability of another increase at the 29 September meeting. This factor may limit the Australian dollar's decline. However, a stronger US dollar, tension in commodity markets, and weaker global risk appetite are currently outweighing support from the RBA.
For Australia, expensive oil and the rise in global funding costs remain additional risks. As a result, the fundamental backdrop ahead of the European session remains mixed but retains a moderate short-term bias towards lower AUDUSD. The nearest fundamental event for the pair is the RBA meeting on 29 September. Expectations of another increase are already largely priced in, so for the Australian dollar, not only the rate itself but also the regulator's assessment of the persistence of underlying inflation will matter. An overly hawkish tone could trigger a short AUDUSD recovery, especially if US yields stabilise.
However, the Australian currency remains highly sensitive to global risk: rising oil prices, more expensive dollar funding, and tension in bond markets reduce demand for cyclical currencies. In addition, even a hawkish RBA does not eliminate the current advantage of US yields. Fundamentally, the probability of a corrective rebound exists, but a sustainable reversal would require an improvement in global risk appetite and a weaker dollar.
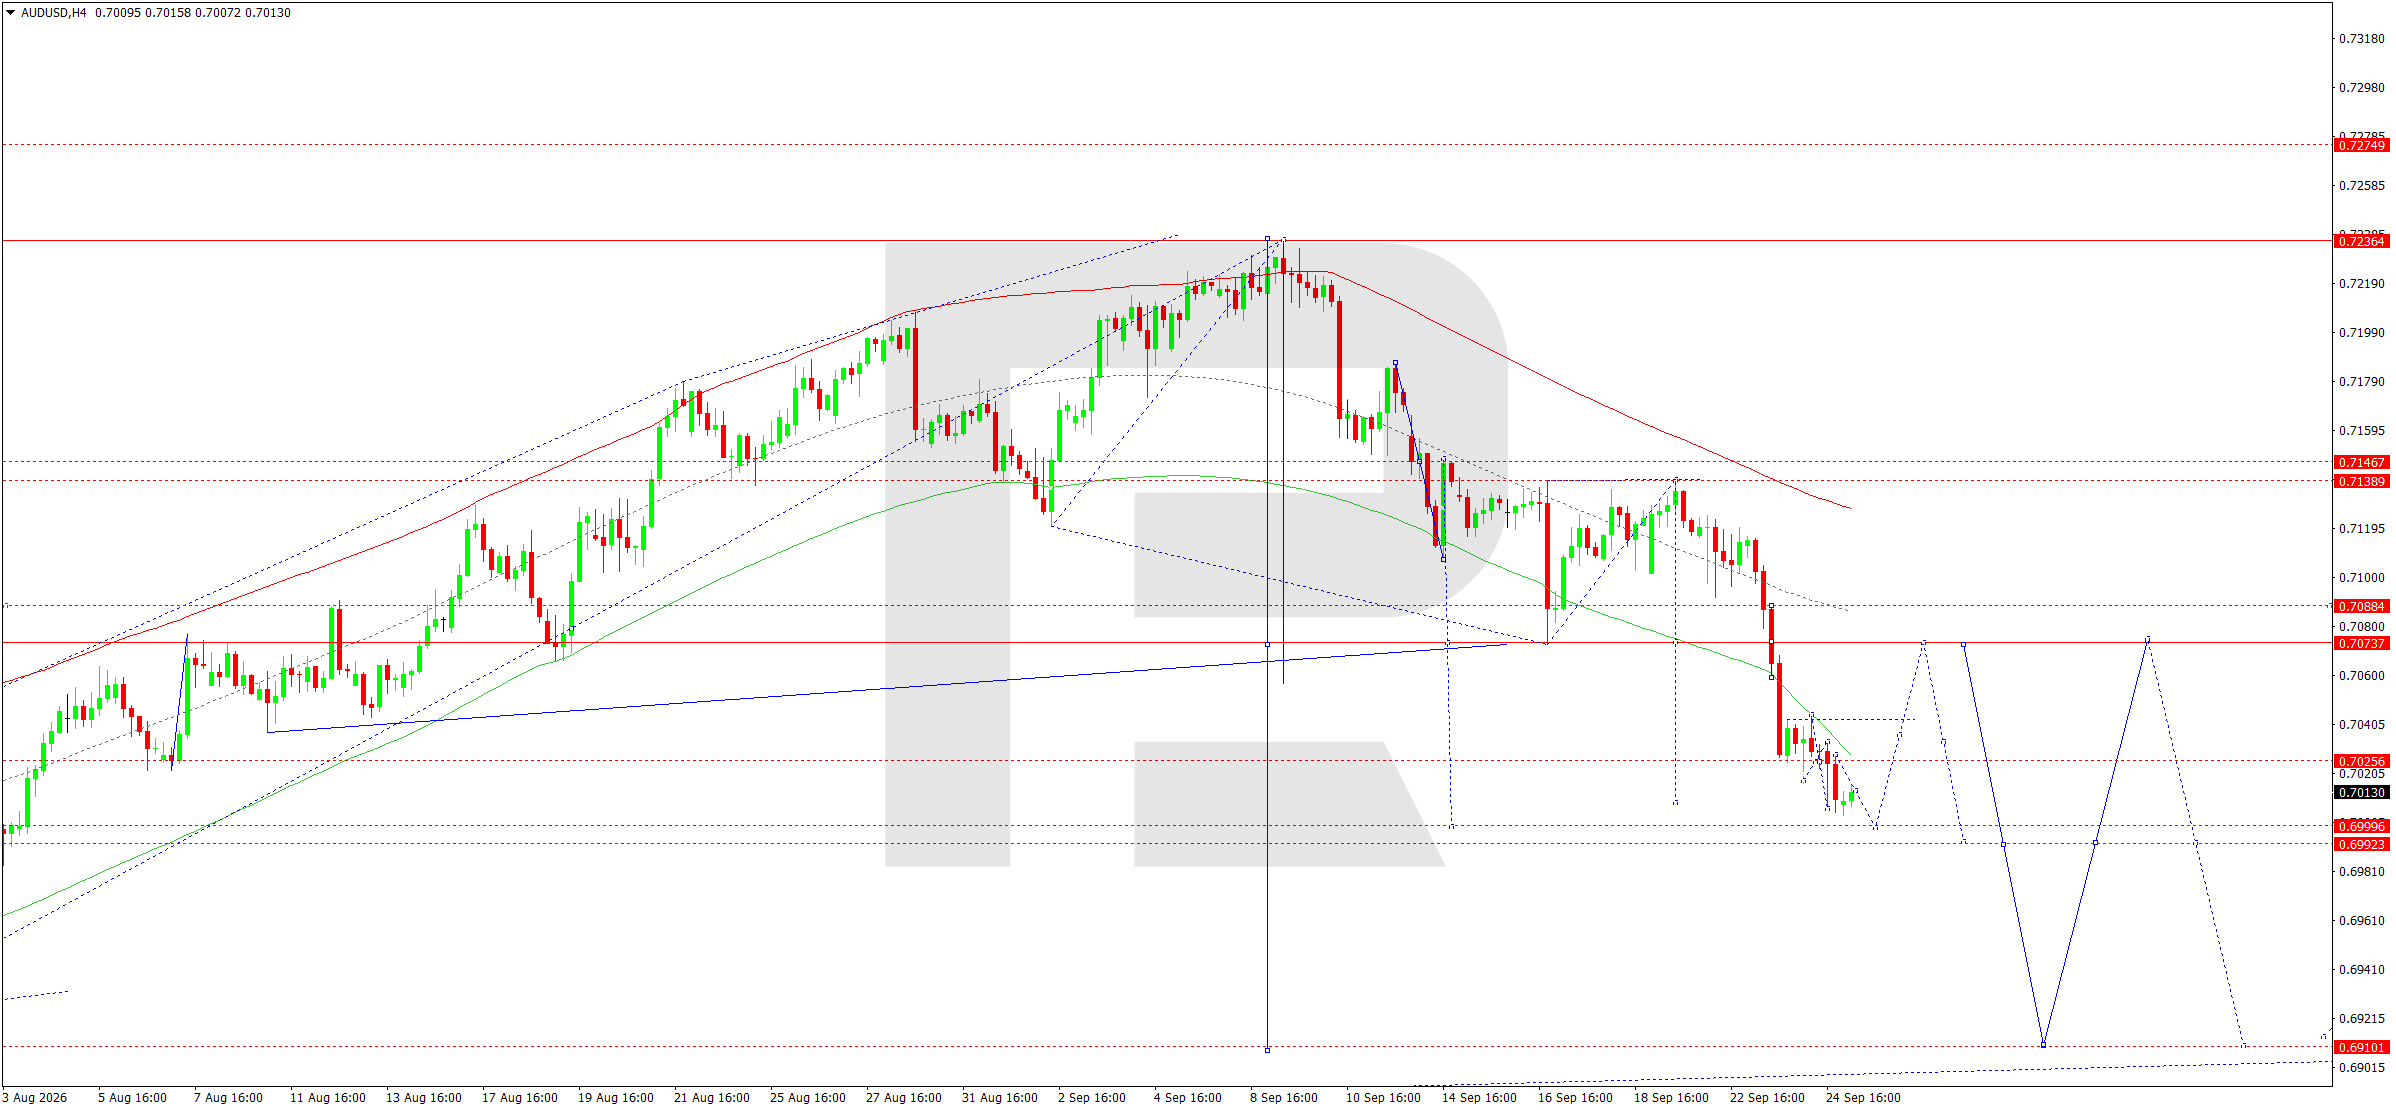
On the H4 chart, the market is continuing a downward wave after breaking the key 0.7073 area. The price reached 0.7003 and remains below the main moving averages, confirming seller dominance. The declining-wave Matrix with a pivot at 0.7073 and the current Elliott Wave structure indicate that downside potential remains. In the coming hours, a correction towards 0.7025 is possible, after which a retest of the 0.7000 area remains relevant.
A firm breakout below 0.6992 would create conditions for the decline to extend towards 0.6960 and then 0.6901. To invalidate the current bearish scenario, the market needs to return above 0.7073 and consolidate above 0.7088; in that case, room would open for a recovery towards 0.7139. Until then, corrective rises remain potential points for renewed selling. The main H4 trend is defined as downward. The key control zone for sellers remains 0.7025–0.7073, which may limit any intraday recovery in the Australian dollar during the current trading session.
AUDUSD forecast scenario
Trading scenario: SELL
- Price at the time of writing: 0.7017
- Entry price: 0.7012
- Stop Loss: 0.7026
- Take Profit: 0.6992
- Risk-to-reward ratio: 1:1.43
The trade idea is valid until 8:00 AM on 26 September 2026 (server time, UTC+3).
USDCAD forecast
On 25 September 2026, USDCAD retains an upward fundamental bias due to a widening yield differential in favour of the US and deteriorating expectations for the Canadian economy. The US Federal Reserve raised the rate to 3.75–4.00% on 16 September and allowed for further tightening, supporting the dollar and US bond yields. The Bank of Canada is taking a more cautious stance. BoC Governor Tiff Macklem warned this week that new US tariffs could materially slow Canadian economic growth in the fourth quarter, while inflation remains around 3%, above the bank's target. The Canadian dollar has already fallen to almost seven-week lows as the yield spread between US and Canadian bonds widened.
High oil prices traditionally support the Canadian currency, but the effect is now partly offset by a stronger dollar and concerns about domestic growth. The fundamental balance therefore remains favourable for further USDCAD gains, although proximity to important technical resistance increases the risk of local profit-taking. The oil factor is particularly contradictory for the pair at present. A rise in Brent towards triple-digit levels usually improves Canada's terms of trade and supports the CAD, but high energy prices also fuel US inflation and prompt the market to expect further Fed tightening. As a result, the positive effect of oil on the Canadian currency is partly outweighed by the US interest-rate advantage.
Additional pressure comes from uncertainty surrounding US-Canada trade relations: it limits investment activity and increases the risk of weaker growth towards the end of the year. Therefore, even if USDCAD corrects from resistance at 1.4157, the overall fundamental backdrop does not yet provide a reliable basis for sustained CAD strengthening. A shift in the balance would require either a noticeable decline in US yields or a more hawkish signal from the BoC alongside stabilisation in the Canadian economy.
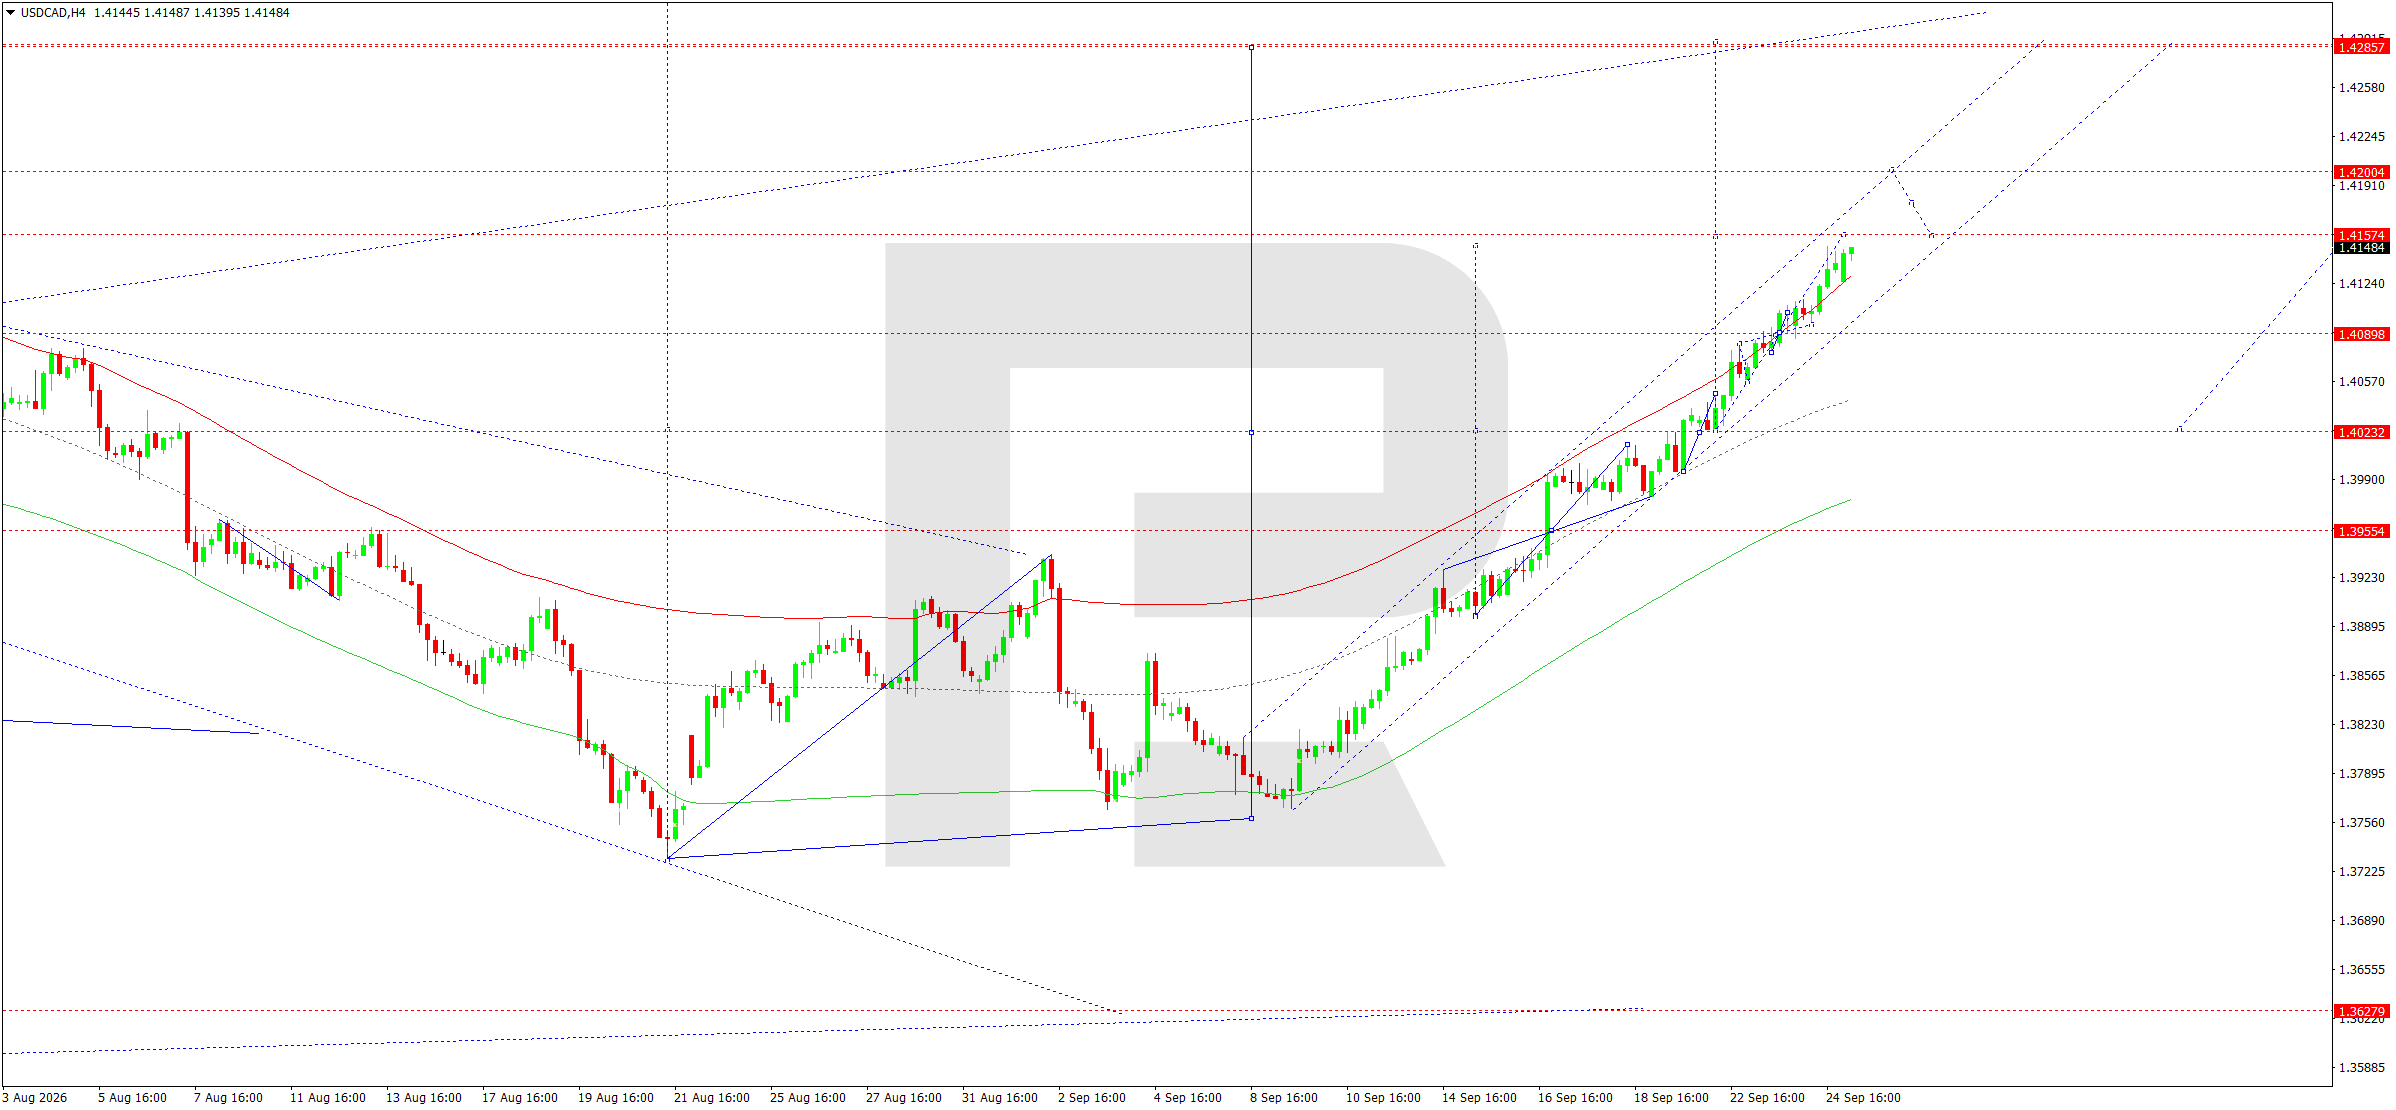
On the H4 chart, a steady upward trend remains intact. From the 1.3760 area, the market formed a sequence of higher lows and higher highs, broke through 1.4023 and 1.4090, and reached the 1.4150 area. The rising-wave Matrix with a pivot at 1.4023 confirms that the main impulse remains intact. The price is moving within an ascending channel and remains above the main moving averages. At the current stage, a compact consolidation below resistance at 1.4157 is likely.
Consolidation above 1.4157 would open the way towards 1.4200 and then 1.4286. At the same time, a break below 1.4140 could trigger a technical correction towards 1.4090, where the nearest support zone and the central area of the current wave are located. A deeper decline below 1.4090 would weaken the bullish scenario and bring 1.4023 into consideration. While the price remains above 1.4090, priority stays with buying after a confirmed upward breakout from the local consolidation. The main H4 trend remains upward, and the nearest working target is 1.4200. The key zone confirming buying today is 1.4157, above which the impulse may accelerate.
USDCAD forecast scenario
Trading scenario: BUY
- Price at the time of writing: 1.4147
- Entry price: 1.4152
- Stop Loss: 1.4138
- Take Profit: 1.4200
- Risk-to-reward ratio: 1:3.43
The trade idea is valid until 8:00 AM on 26 September 2026 (server time, UTC+3).
XAUUSD forecast
On 25 September 2026, gold remains caught between demand for safe-haven assets and pressure from rising interest rates. The US Federal Reserve raised the rate to 3.75–4.00% last week and signalled readiness for further tightening. US bond yields have continued to rise since then, while the dollar is heading towards a second consecutive weekly gain. For XAUUSD, this is a negative combination because higher risk-free yields increase the opportunity cost of holding a metal that does not pay coupon income.
Gold has already declined this week amid expectations of a longer period of high rates. At the same time, tensions in the Middle East and oil near triple-digit levels are preserving safe-haven demand for the metal and an inflation premium. However, rising oil prices also strengthen expectations of further Fed tightening, partly offsetting gold's geopolitical support. The fundamental balance at the start of the day therefore remains neutral-to-negative: safe-haven demand limits the downside, but a strong dollar and high real yields continue to weigh on the price. The market's response to changes in oil prices is also important.
Lower oil prices previously supported gold by weakening expectations of further rate increases, while the renewed rise in Brent pushed yields higher again and restored pressure on the metal. This explains why geopolitical risk in the current phase does not automatically lead to higher XAUUSD: investors are simultaneously buying defensive assets and revising the expected interest-rate path upwards. Based on recent sessions, the interest-rate factor remains the stronger driver.
If yields continue to rise, gold will struggle to develop a sustained rebound even if tensions in the Middle East persist. Conversely, signs of de-escalation and lower oil prices could reduce inflation expectations and support the metal through falling yields. Therefore, the direction of US yields remains the main external indicator for the current scenario.
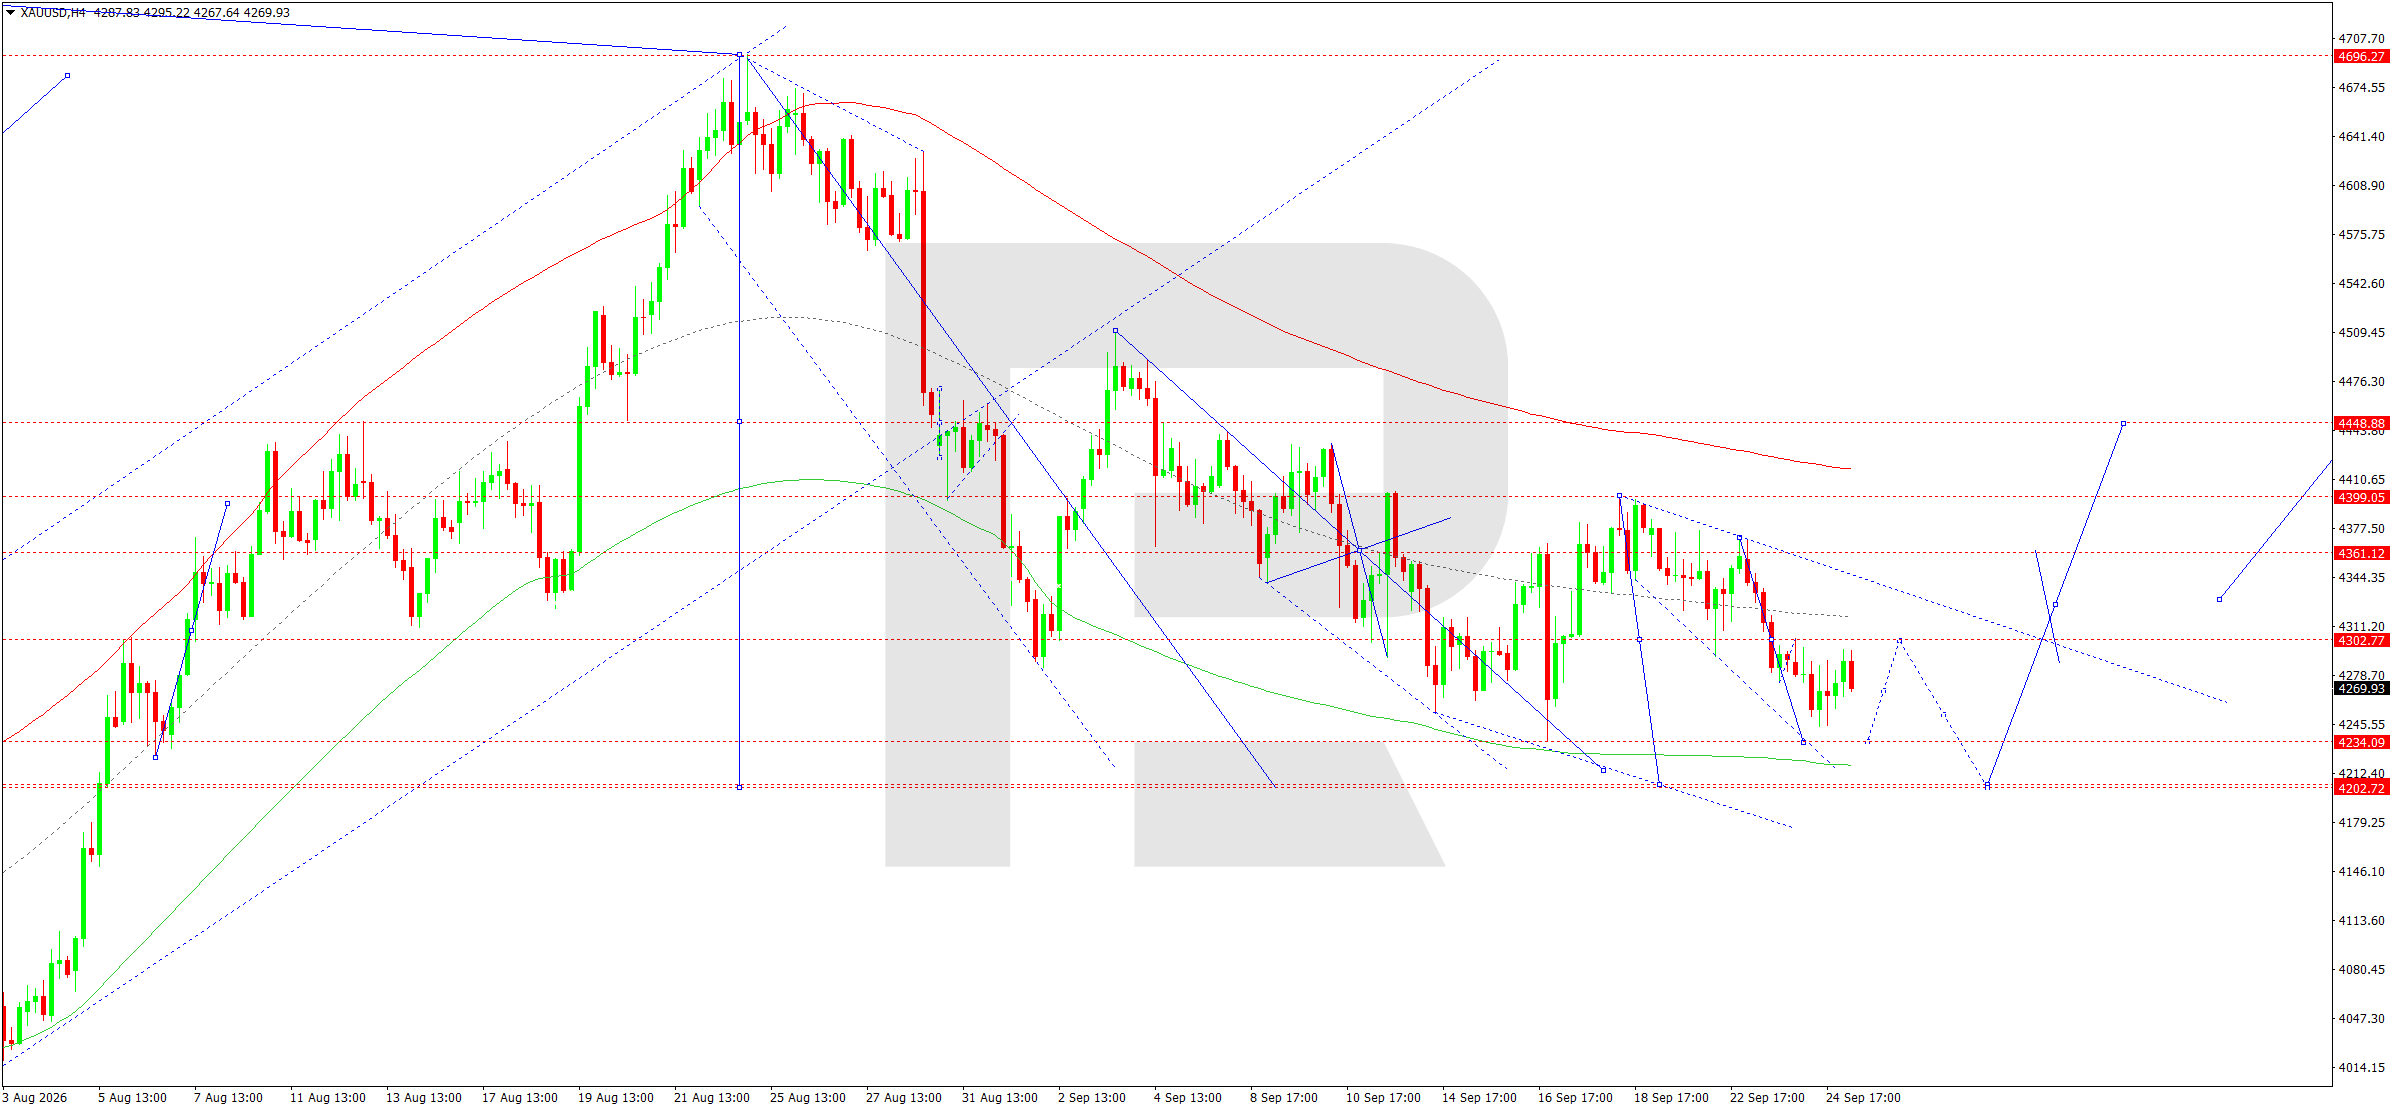
On the H4 chart, XAUUSD is developing a downward structure within an expanding channel. After rebounding from 4,360–4,390, the market turned lower again and is forming a consolidation around 4,302. The declining-wave Matrix with a pivot around 4,360 confirms that selling pressure remains intact. The price is below the midline of the short-term structure and beneath descending dynamic resistance. The nearest target is 4,234, where important support and the lower area of the current Price Envelope are located.
A firm breakout below 4,234 would create potential for a move towards 4,218–4,203, which is viewed as the first extended target of the current wave. Before the decline continues, pullbacks towards 4,290–4,303 are possible, while a stronger recovery could test 4,361. A return above 4,361 would weaken the bearish scenario and open the way towards 4,399 and 4,449. While the price remains below 4,303 and especially below 4,361, the main scenario assumes continuation of the downward wave. The priority for the day is to sell after local corrections, targeting 4,234 and 4,203. The key control area for sellers remains 4,290–4,303, where supply may become active again.
XAUUSD forecast scenario
Trading scenario: SELL
- Price at the time of writing: 4,274
- Entry price: 4,269
- Stop Loss: 4,303
- Take Profit: 4,203
- Risk-to-reward ratio: 1:1.94
The trade idea is valid until 8:00 AM on 26 September 2026 (server time, UTC+3).
US 500 forecast
On 25 September 2026, the US equity market remains sensitive to a combination of high interest rates, expensive oil, and sustained demand for technology stocks. The US Federal Reserve raised the policy rate to 3.75–4.00% on 16 September and signalled that another increase this year remains possible. Against this backdrop, Treasury yields are rising again, increasing the discount rate for equities and particularly for expensive growth companies. Oil climbed to nearly 107 USD per barrel the previous day due to risks to Middle East supplies, intensifying inflation concerns. On 24 September, the S&P 500 ended the session almost unchanged after an intraday decline: pressure from yields and oil was partly offset by a recovery in major technology shares.
The artificial intelligence sector continues to support the index, but the high cost of capital and the risk of further Fed tightening make the market more vulnerable to profit-taking. The fundamental backdrop at the start of the day remains mixed, with a moderate bias towards correction. The balance within the index also remains uneven. Large technology companies and the AI theme continue to attract capital and can quickly offset weakness in cyclical sectors.
However, when long-term Treasury yields rise, valuation pressure on growth companies increases, while expensive oil worsens margin expectations for transport, industrials, and consumer sectors. Therefore, the index's resilience does not mean that risks have disappeared: the market remains dependent on several large stocks and sensitive to any new jump in yields. Another Fed rate increase in the coming months would amplify this risk. On the other hand, stabilisation in oil and bond markets could quickly bring buyers back. On a daily horizon, the combination of technical resistance and a tight macroeconomic backdrop makes a corrective scenario a logical base case.
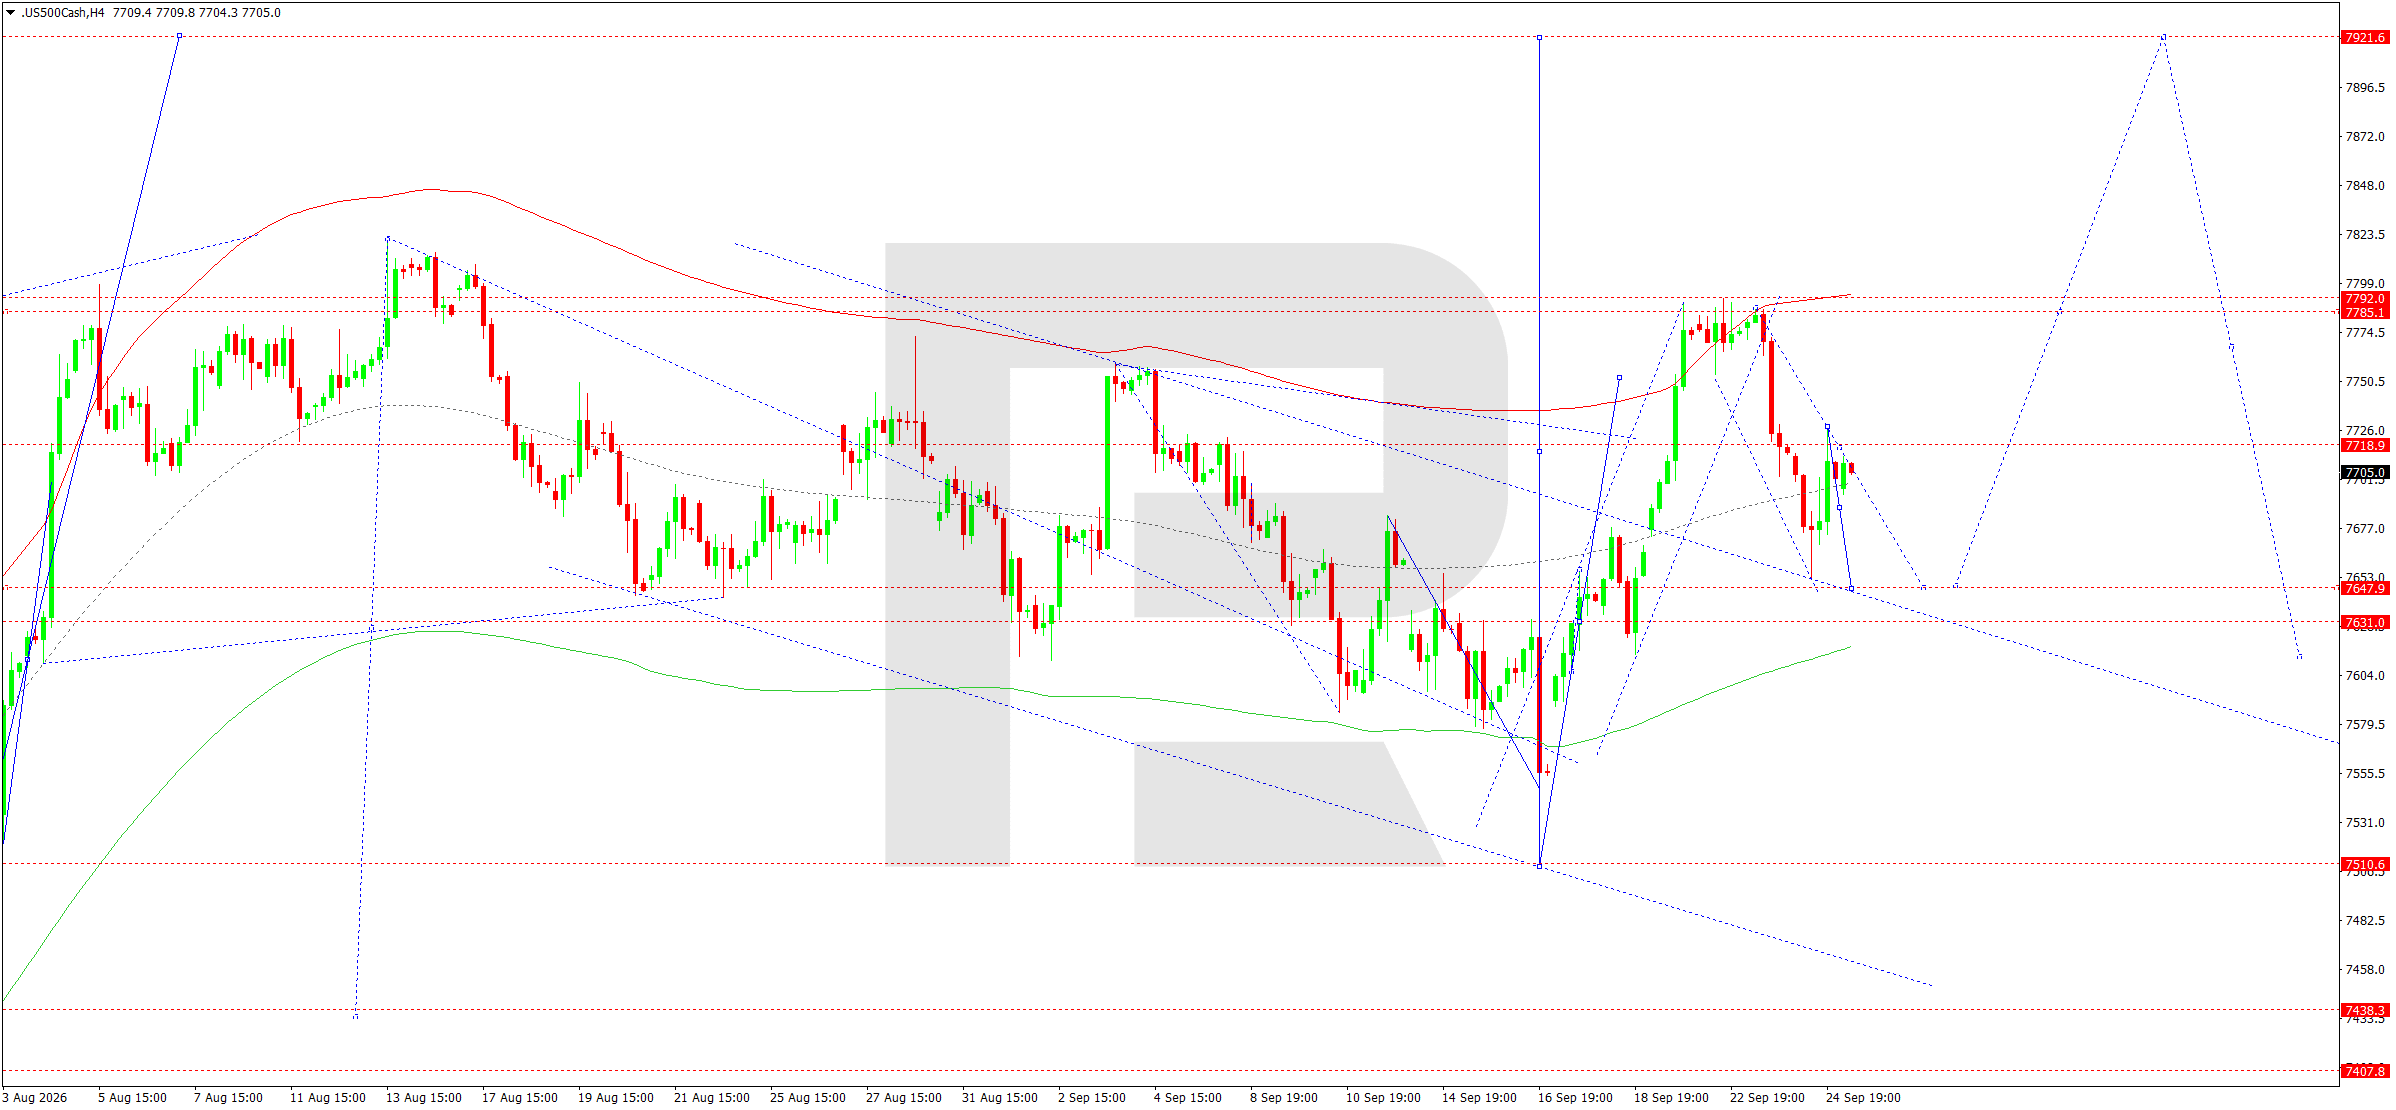
On the H4 chart, after an upward impulse, the US 500 formed a top in the 7,790 area and moved into a correction. The market declined towards 7,647, then recovered towards 7,719, where it again encountered supply. The rising-wave Matrix with a pivot around 7,650 indicates that the medium-term structure has not yet broken down, but in the short term the price is correcting from the upper boundary of the Price Envelope. While the index remains below 7,719–7,790, the main intraday scenario assumes a move towards 7,647. A breakout below 7,647 would extend the decline towards 7,631 and then 7,511.
For a recovery, buyers need to return the price above 7,719, after which a retest of 7,790 would become possible. Consolidation above 7,790 would reopen the way towards 7,922. Given the current channel configuration and the pullback from the upper boundary, selling is preferred for the day, although it should be viewed as trading within a correction rather than confirmation of a reversal of the entire medium-term uptrend. The nearest key target for sellers is 7,647. Confirmation would come from a move below 7,680.
US 500 forecast scenario
Trading scenario: SELL
- Price at the time of writing: 7,689
- Entry price: 7,684
- Stop Loss: 7,719
- Take Profit: 7,647
- Risk-to-reward ratio: 1:1.06
The trade idea is valid until 8:00 AM on 26 September 2026 (server time, UTC+3).
BTCUSD forecast
On 25 September 2026, BTCUSD remains sensitive to dollar liquidity and US bond yields. The US Federal Reserve raised the rate to a range of 3.75–4.00% on 16 September and indicated the possibility of further tightening. Rising Treasury yields and a stronger dollar usually worsen conditions for highly volatile risk assets, so after a strong August-September recovery Bitcoin is facing a more restrictive macroeconomic backdrop. Geopolitical tensions and high oil prices are an additional factor, supporting inflation expectations and prompting the market to price in a longer period of elevated rates.
At the same time, interest in digital assets remains intact: in September, Bitcoin showed strong impulses amid expectations of greater regulatory clarity in the US and renewed interest in the cryptocurrency sector. The fundamental picture therefore remains two-sided: structural demand supports the market, but high rates, a strong dollar, and weaker risk appetite increase the probability of a short-term correction. For Bitcoin, the link with real yields and overall risk demand is particularly important. When the cost of risk-free funding rises, investors are more likely to reduce exposure to high-volatility assets, even if the long-term investment story remains positive. Bitcoin's September surge following selected positive industry news showed that demand has not disappeared, but also confirmed the market's sensitivity to Fed decisions.
Another factor is the performance of US technology stocks: Nasdaq resilience can support cryptocurrencies through a broader risk-on environment, while a sell-off amid high yields usually reinforces BTC corrections. Fundamentally, the 85,000–87,500 area now acts not only as technical resistance but also as a zone testing the market's willingness to ignore tighter financial conditions. Without lower yields, consolidation above this area looks more difficult.
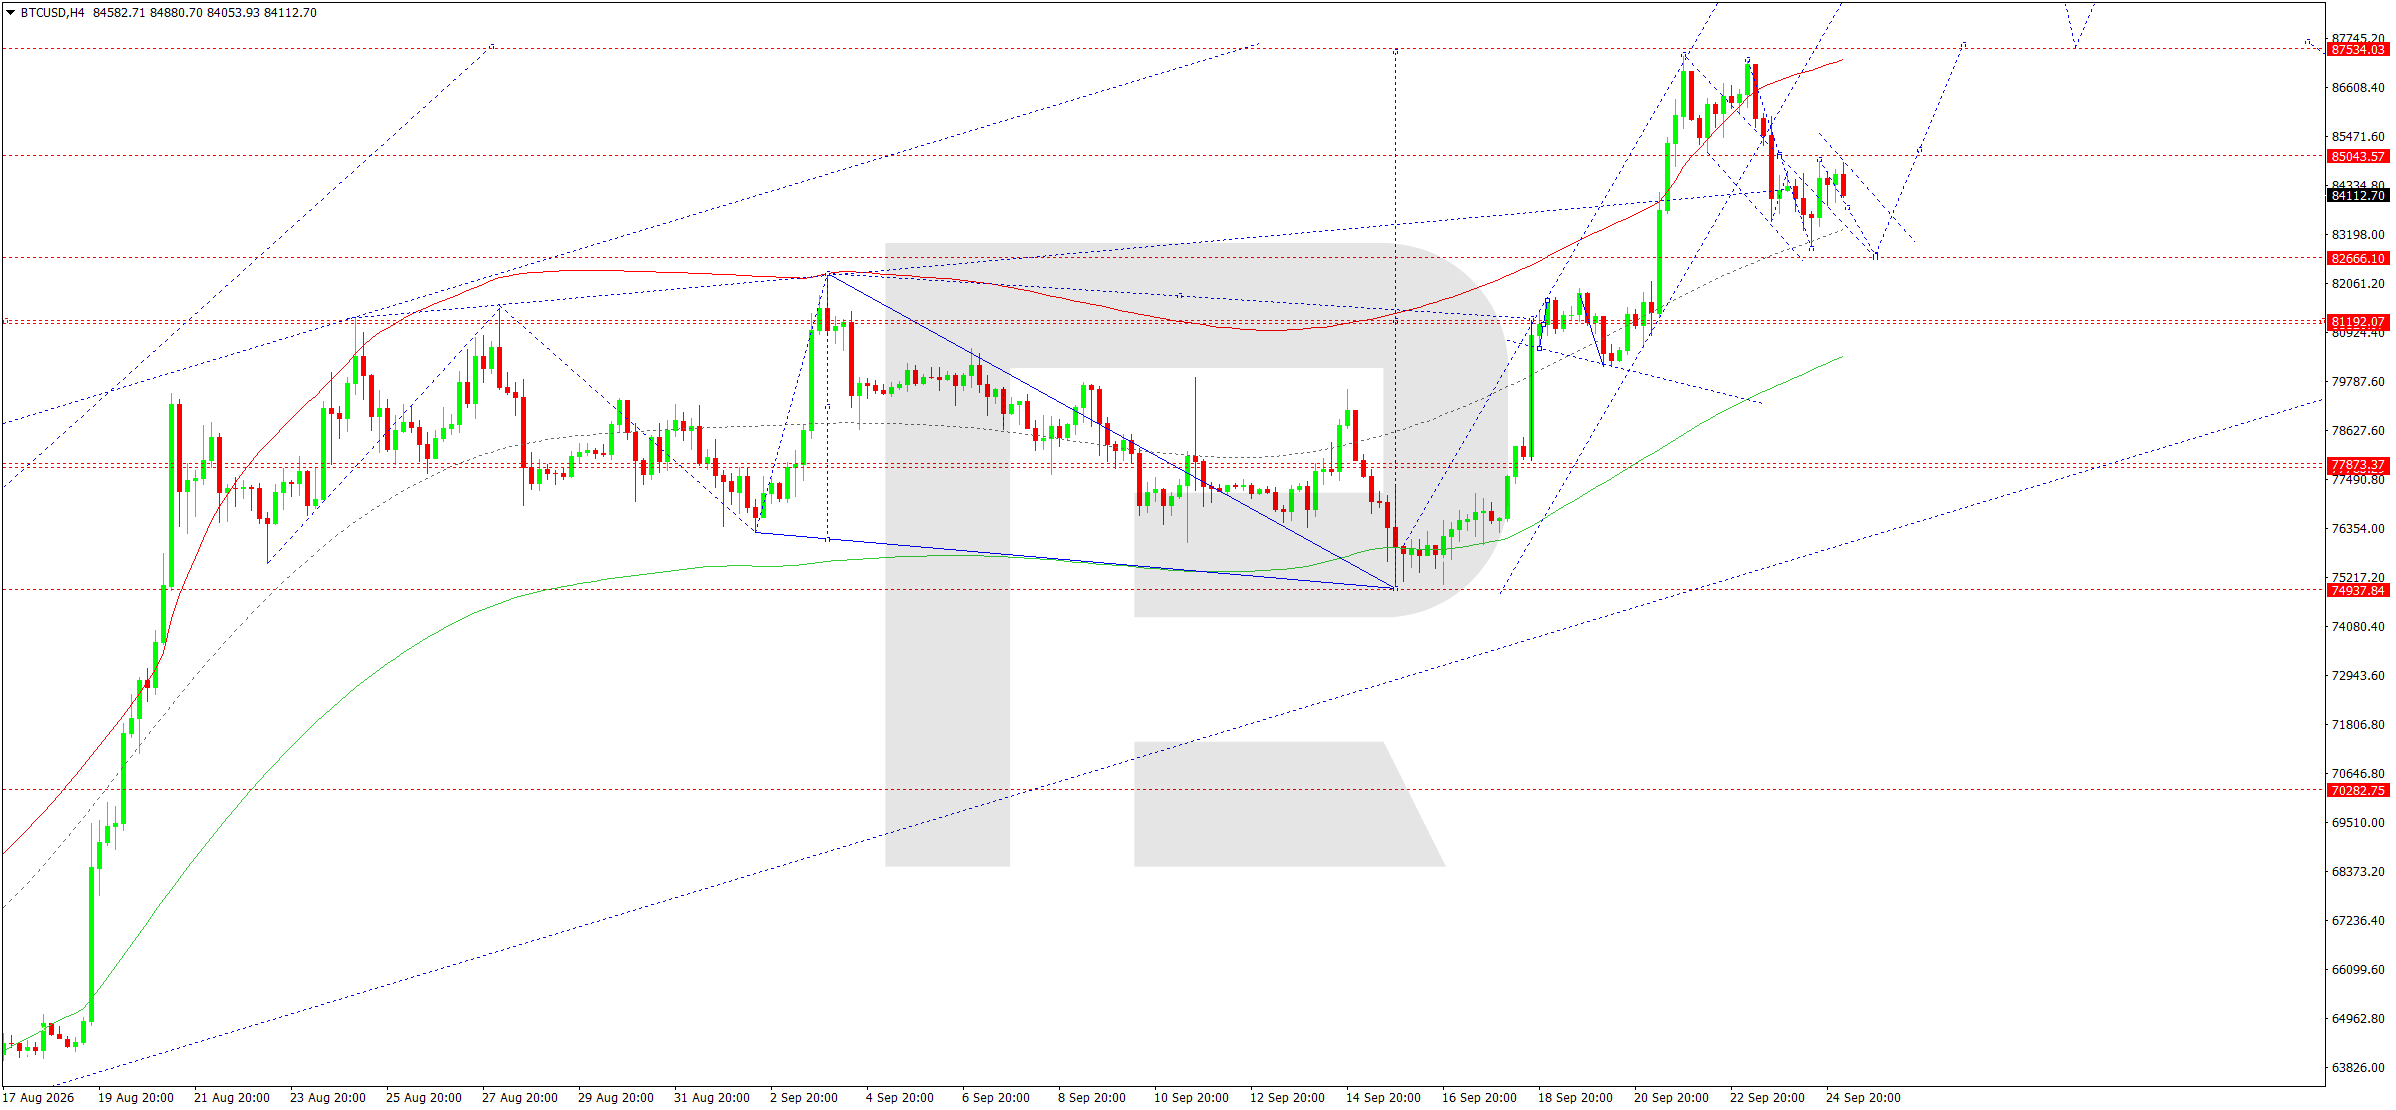
On the H4 chart, after rising towards the upper boundary of the Price Envelope around 87,337, BTCUSD formed a corrective wave towards the 82,920–82,666 area. The market then recovered towards 84,911 but has so far failed to consolidate above 85,044. The rising-wave Matrix with a pivot at 81,192 shows that the broader structure remains bullish, although the current local impulse looks corrective. In the near term, another upward leg towards 85,000–85,044 cannot be ruled out, after which the main scenario becomes a decline towards 82,666.
A breakout below 82,666 would increase corrective pressure and open the way towards 81,192 and then 77,873. To invalidate the bearish scenario, buyers need to consolidate above 85,044; in that case, a retest of 87,534 would become likely. While the price remains below this resistance zone, selling on local rises retains a technical advantage. For the current session, the key reference remains a return to the 82,666 area, which is both the nearest support and an important control level for preserving the broader upward structure. The key control zone for sellers remains 85,000–85,044, where local supply is likely to strengthen.
BTCUSD forecast scenario
Trading scenario: SELL
- Price at the time of writing: 84,222
- Entry price: 84,217
- Stop Loss: 85,044
- Take Profit: 82,666
- Risk-to-reward ratio: 1:1.88
The trade idea is valid until 8:00 AM on 26 September 2026 (server time, UTC+3).
Editors’ picks
 EURUSD forecast 2026–2027: technical analysis, price levels & predictions
The EURUSD outlook for 2026 and 2027: key levels on the daily chart, three trading scenarios and the policy gap between the Fed and the ECB that drives the pair.
 Gold (XAUUSD) forecast 2026: technical analysis, price levels & predictions
Where gold could trade in 2026: key levels, three trading scenarios with entry triggers and the forecasts from J.P. Morgan, Deutsche Bank and Goldman Sachs.
Forecasts presented in this section only reflect the author’s private opinion and should not be considered as guidance for trading. RoboForex bears no responsibility for trading results based on trading recommendations described in these analytical reviews.