
Daily technical analysis and forecast for 28 September 2026
Daily technical analysis and forecast for EURUSD, USDJPY, GBPUSD, AUDUSD, USDCAD, XAUUSD, US 500, and BTCUSD for 28 September 2026.
Each scenario on this page reflects the market structure on the H4 chart as of 10:00 UTC+3 on 28 September 2026. The assessment considers the current H4 chart structure, key support and resistance levels, the direction of the medium-term movement, and the prevailing fundamental backdrop.
EURUSD forecast
EURUSD starts the week with the dollar retaining the advantage following the September tightening of US monetary policy. The US Federal Reserve raised the target rate range by 25 basis points to 3.75–4.00% on 16 September, citing resilient economic activity and persistently elevated inflation. In the Fed's September projections, PCE inflation for 2026 is estimated at 3.7%, while the median rate path points to 4.1% at year-end. This supports US bond yields and limits the scope for an EURUSD recovery.
The European Central Bank also tightened policy: on 10 September, rates were raised by 25 basis points, and the deposit rate was increased to 2.50%. The ECB expects average inflation of 3.0% in 2026 and attributes elevated price pressure primarily to the energy shock. A sharp increase in natural gas prices in Europe remains an additional risk factor, as it may pass through into consumer prices more quickly. ECB policy therefore provides some support to the euro, but the rate differential and the dollar's current strength are still preventing a sustainable upward move in EURUSD.
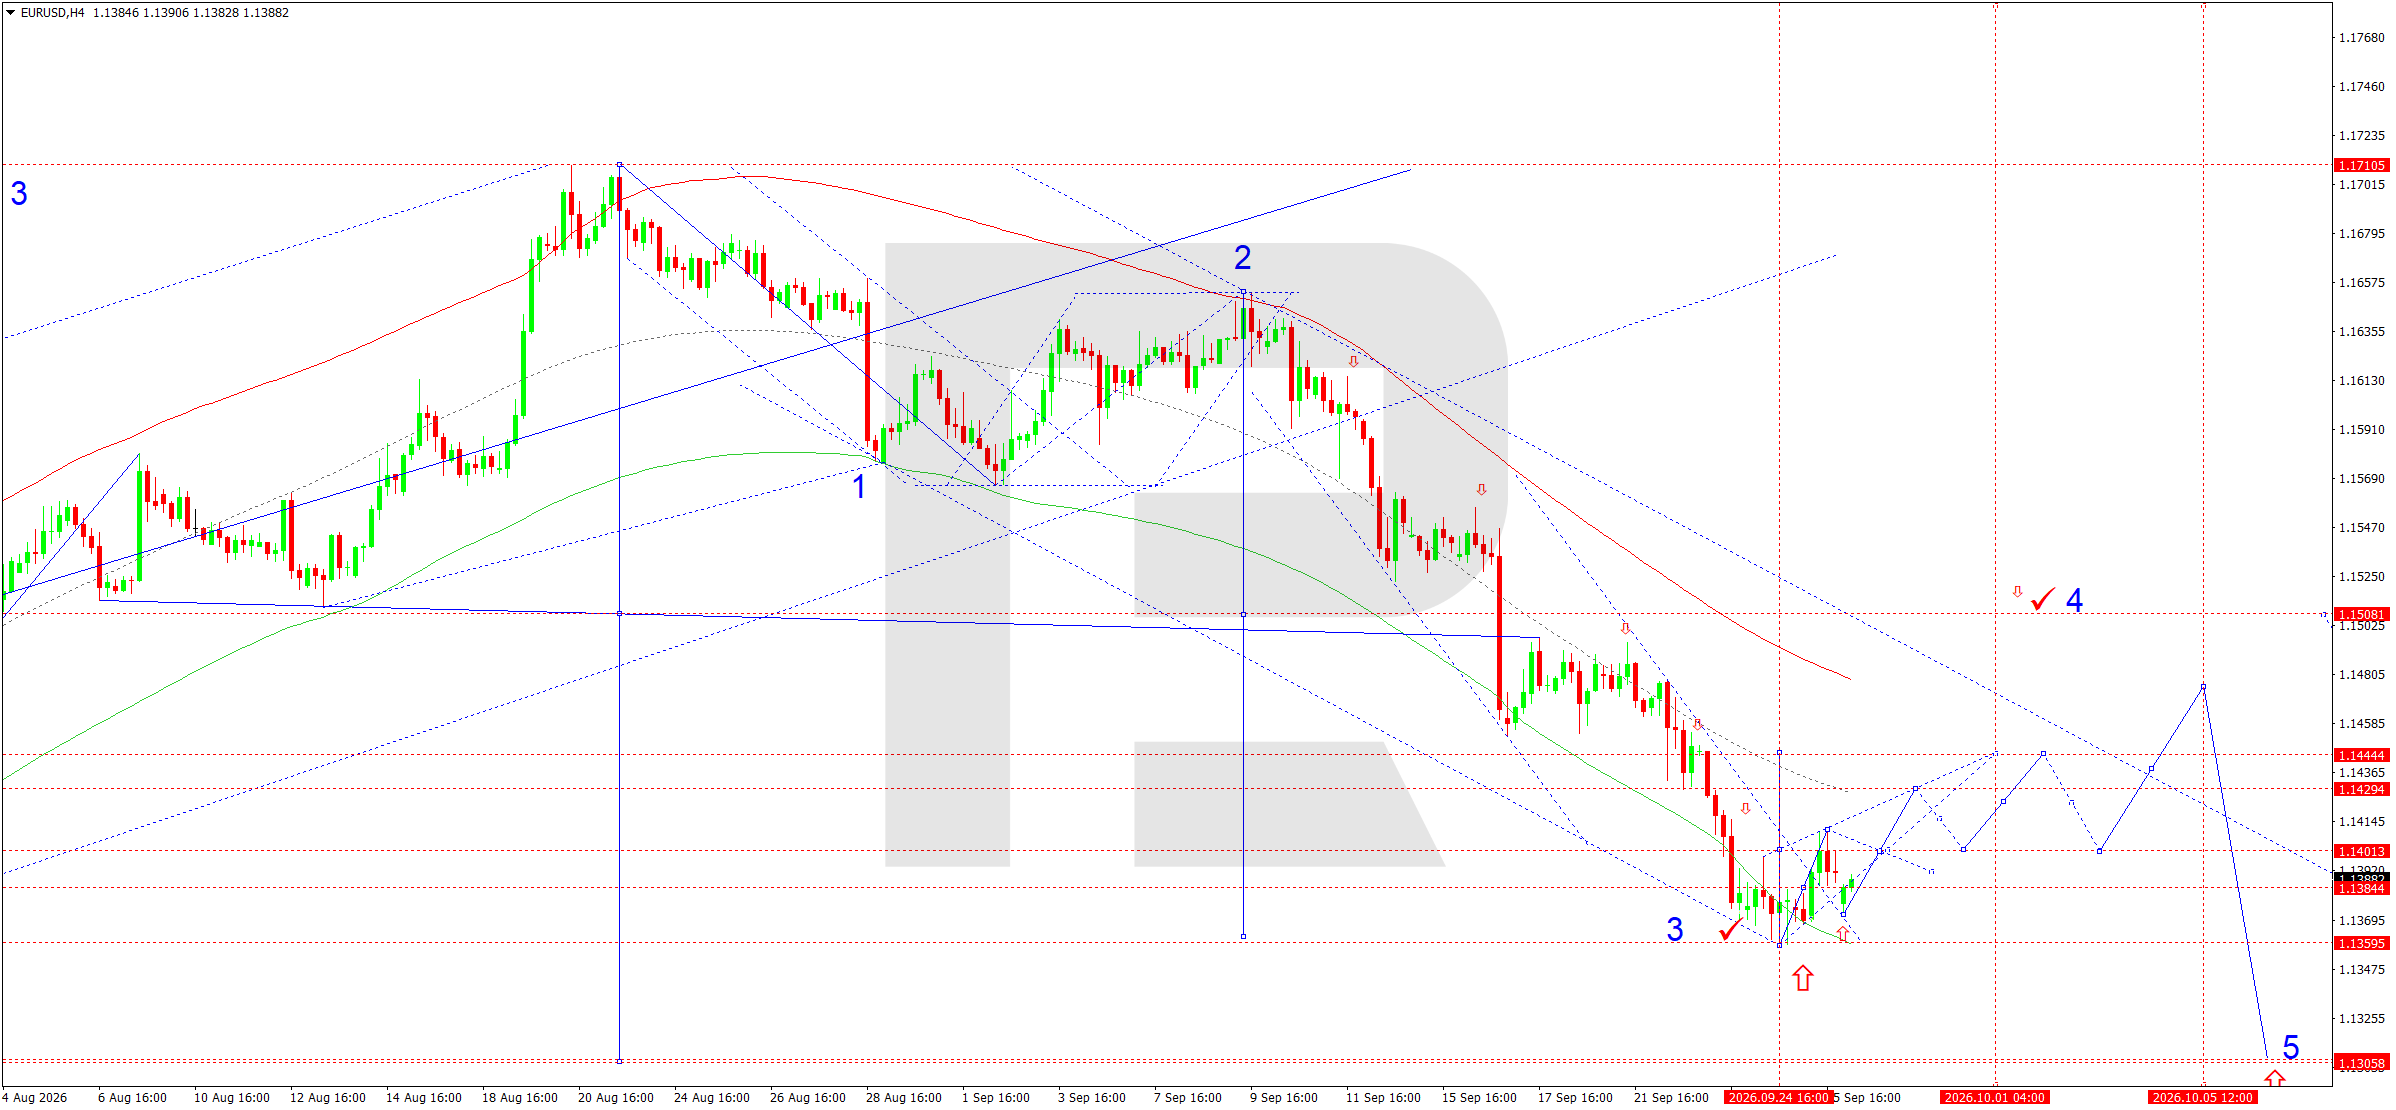
On the H4 chart, EURUSD completed a downward wave around 1.1360 and formed the first recovery impulse towards 1.1410. The structure remains downward: the price is trading below the main moving averages, and the previous descending channel is still exerting influence. Today, a correction towards 1.1373, followed by renewed growth, is the relevant scenario.
The Elliott Wave structure indicates completion of the local third wave and development of a corrective fourth wave. The downward wave matrix has a pivot around 1.1535. The nearest recovery target is 1.1428, followed by resistance at 1.1444. Consolidation above this area would allow the correction to extend towards 1.1508. While the price remains below 1.1508, the rise should be viewed as corrective within the broader downward structure. For today, the priority scenario is a move higher from the 1.1373–1.1360 area towards 1.1428.
EURUSD forecast scenario
Trading scenario: BUY
- Price at the time of writing: 1.1395
- Entry price: 1.1400
- Stop loss: 1.1365
- Take profit: 1.1444
- Risk-to-reward ratio: 1:1.26
The trade idea is valid until 8:00 AM on 29 September 2026 (server time, UTC+3).
USDJPY forecast
For USDJPY, the combination of tight policy at two central banks remains the defining factor. The Fed raised the rate by 25 basis points in September to a range of 3.75–4.00%, citing the resilience of the economy and elevated inflation. US monetary policy supports the dollar through high yields on dollar assets.
At the same time, the Bank of Japan continued policy normalisation. Following its September decision, the short-term policy rate target is around 1.25%. This fundamentally strengthens support for the yen, although the market is also pricing in a substantial yield differential between the US and Japan.
Energy costs remain an additional factor for the Japanese currency: Japan is a major energy importer, so high oil prices worsen the terms of trade. As a result, the fundamental backdrop for USDJPY remains two-sided. High Fed rates support the dollar, while BoJ tightening and the risk of an official response to excessive volatility limit the potential for a prolonged rise in the pair. After a strong USDJPY recovery, the market is entering an area where a correction is more likely.
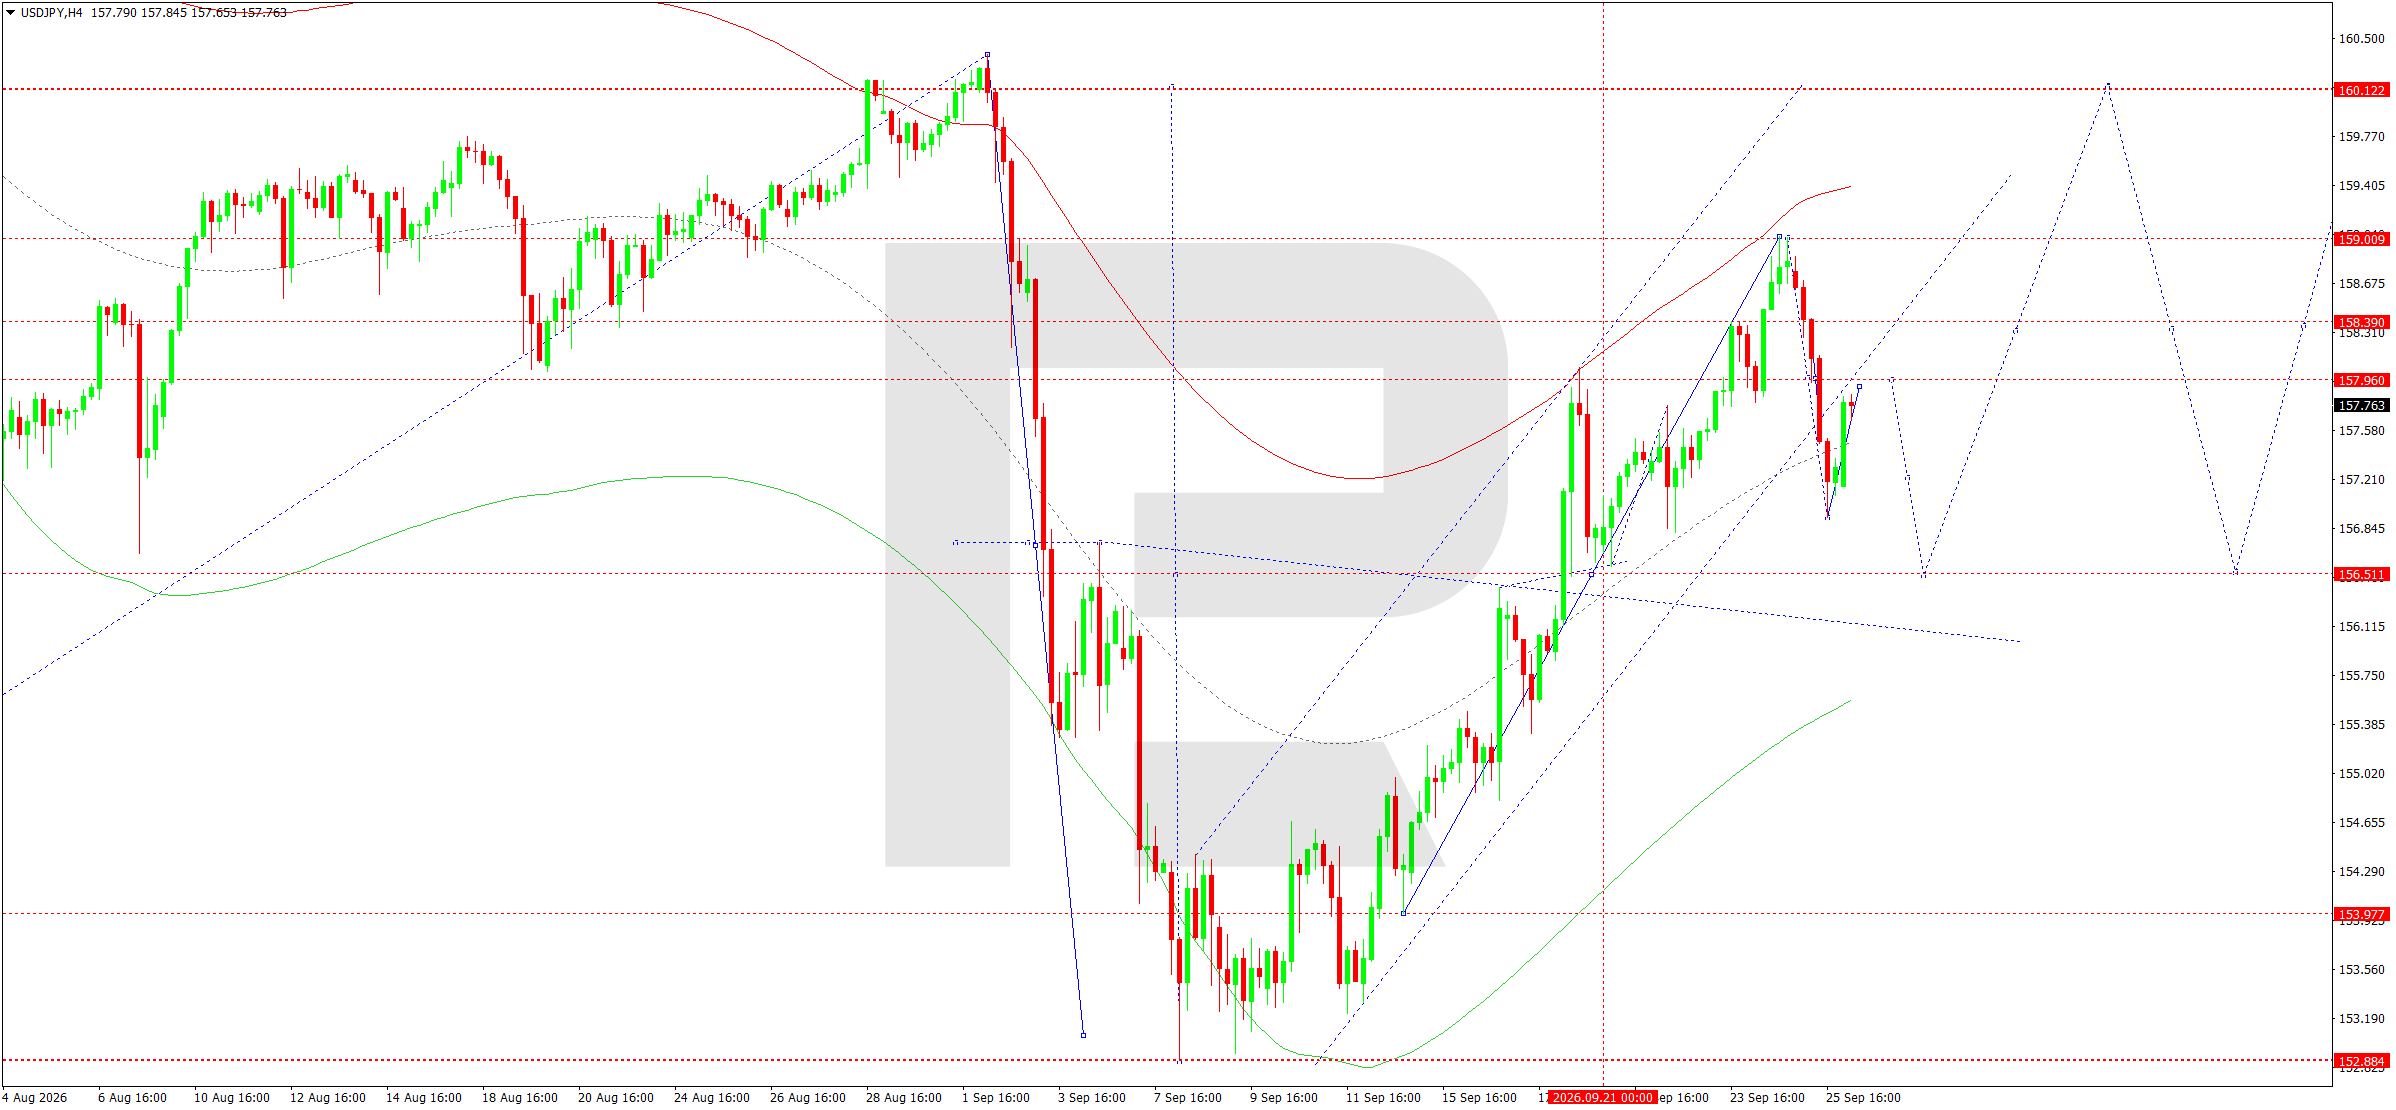
On the H4 chart, after rising towards 159.00, the market formed a sharp downward impulse towards 156.93, followed by a recovery. The price is currently trading around 157.60. The structure of the latest candlesticks indicates that a local corrective range is forming between 156.93 and 157.96.
The matrix of the current wave has a pivot at 156.51. This level remains the main target if the decline resumes. Resistance levels are located at 157.96 and 158.39, with a stronger boundary at 159.00. While the market remains below 157.96–158.39, the downward move remains the preferred scenario. A test of 156.51 from above would be a significant technical event: holding this level could provide the basis for a new upward wave. For today, the main scenario is completion of the current correction, followed by a decline from the 157.60–157.96 area towards 156.51.
USDJPY forecast scenario
Trading scenario: SELL
- Price at the time of writing: 157.60
- Entry price: 157.55
- Stop loss: 158.40
- Take profit: 156.51
- Risk-to-reward ratio: 1:1.22
The trade idea is valid until 8:00 AM on 29 September 2026 (server time, UTC+3).
GBPUSD forecast
The fundamental backdrop for GBPUSD remains challenging due to a simultaneous tightening of expectations around US and UK monetary policy. The Fed raised the rate to a range of 3.75–4.00%, while stressing persistently elevated inflation and resilient domestic demand. This supports the dollar and keeps pressure on GBPUSD.
The Bank of England kept the rate unchanged at 3.75% at its September meeting, although the decision was taken by a 6–3 vote: three members of the Committee favoured raising the rate to 4.00%. UK inflation stood at 3.1% in August, above the 2% target, while the energy shock creates a risk of further acceleration. The BoE notes that the second-round effects of higher energy prices remain limited so far, but the longer the energy shock persists, the greater the inflation risks.
For sterling, this provides some support through expectations of tighter policy, but at the same time high energy prices worsen the outlook for the UK economy. Therefore, the fundamental picture does not yet provide sufficient grounds for a sustained upward reversal in GBPUSD, especially against the backdrop of a strong dollar.
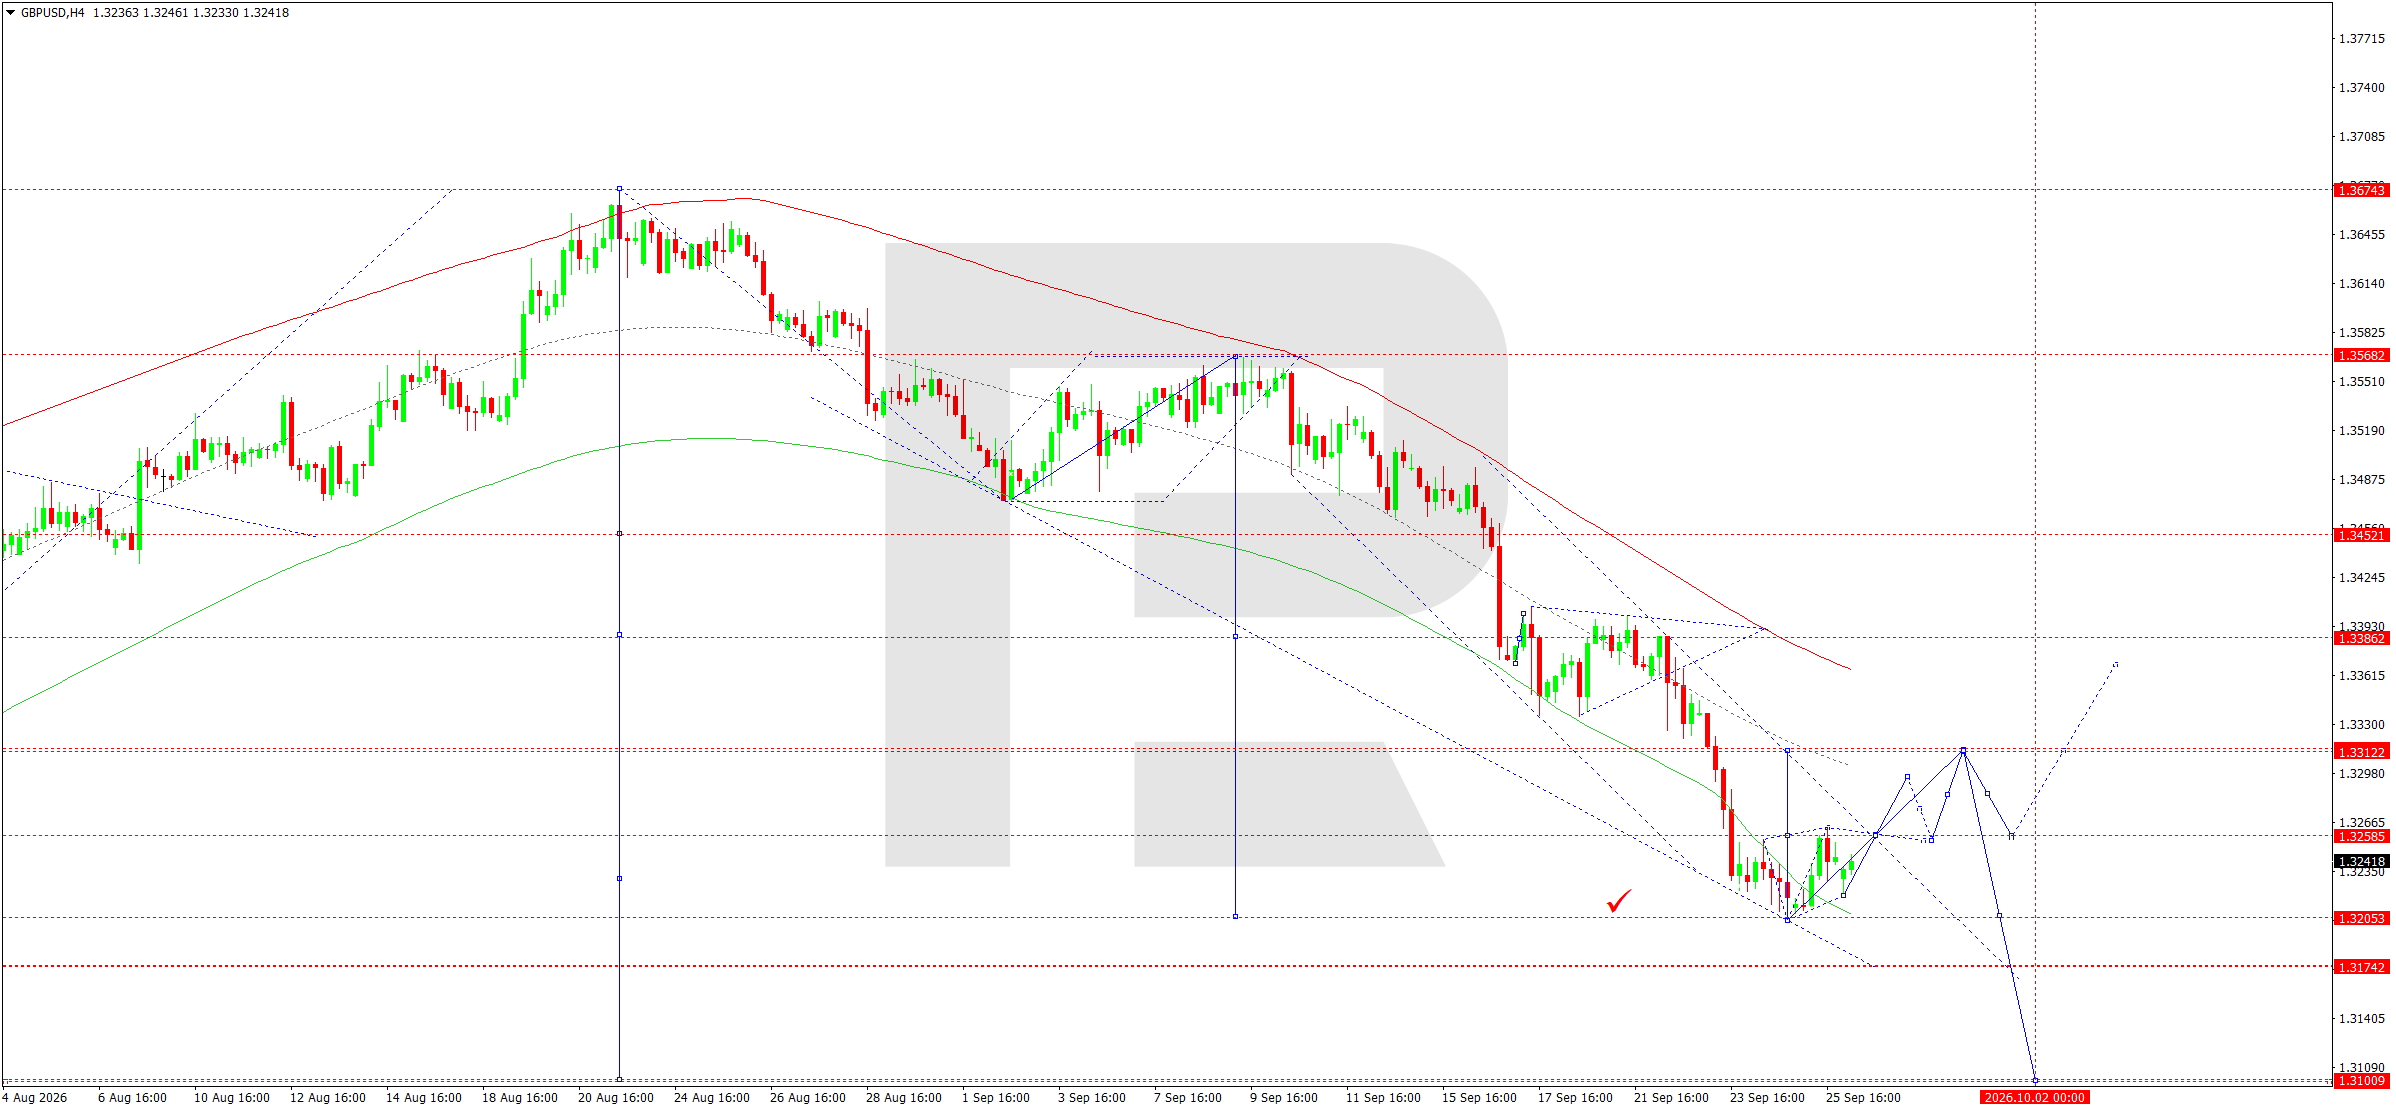
On the H4 chart, GBPUSD continued its medium-term downward structure and reached the 1.3205 area. From this level, the first recovery impulse formed, taking the price towards the 1.3240–1.3260 area.
The downward wave matrix has a pivot around 1.3382. The lower boundary of the Price Envelope was tested around 1.3204, so the potential for an upward technical correction has increased noticeably. The nearest target is 1.3266, followed by 1.3312. The 1.3312 level is the main local correction target. A breakout below 1.3205 would invalidate this scenario and open the way towards 1.3174. While the support level holds, the correction is expected to develop higher towards 1.3266–1.3312.
GBPUSD forecast scenario
Trading scenario: BUY
- Price at the time of writing: 1.3234
- Entry price: 1.3239
- Stop loss: 1.3204
- Take profit: 1.3312
- Risk-to-reward ratio: 1:2.09
The trade idea is valid until 8:00 AM on 29 September 2026 (server time, UTC+3).
AUDUSD forecast
AUDUSD starts the week amid a tug-of-war between a strong US dollar and rising expectations of further monetary tightening in Australia. Following the September hike, the Fed is keeping the rate range at 3.75–4.00%, while its updated projections show persistently elevated inflation. This increases the appeal of dollar assets and remains the main external constraint on an AUDUSD recovery.
At the same time, the Reserve Bank of Australia is approaching its 29 September meeting amid rising inflation risks. RBA Governor Michele Bullock indicated that persistently high energy prices and excess domestic demand could support inflation. The rate has already reached 4.35%, while core inflation remains around 3.6%, above the 2–3% target range. The market is therefore paying increased attention to the possibility of further policy tightening.
This supports the AUD, although the Australian currency remains highly sensitive to global risk appetite and the outlook for the Chinese economy. As a result, volatility may increase ahead of the RBA decision: a hawkish signal from the regulator could strengthen the AUDUSD recovery, while a deterioration in global risk sentiment would support the US dollar.
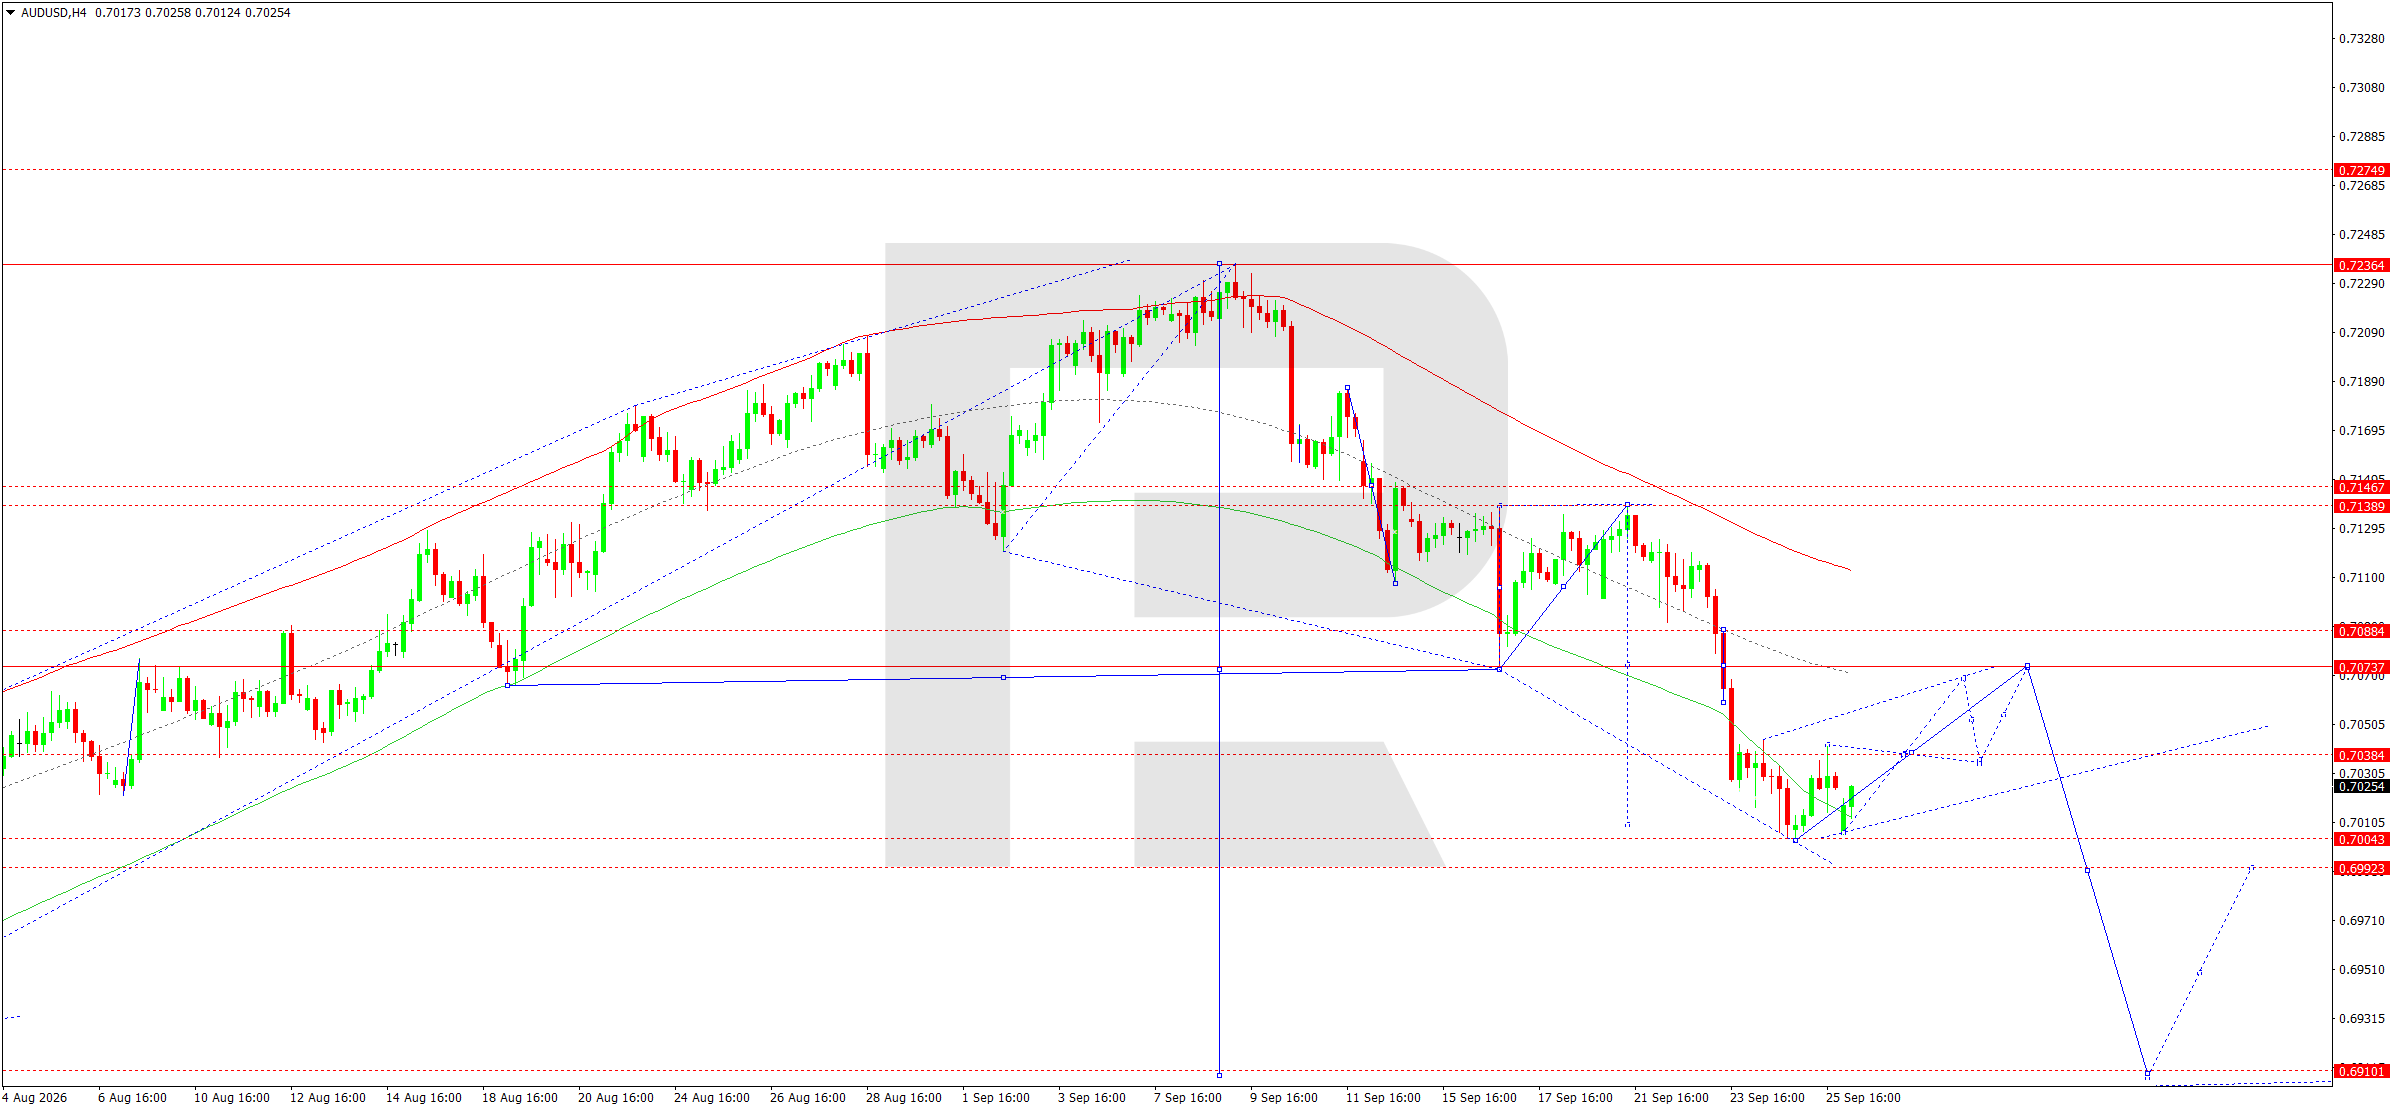
On the H4 chart, AUDUSD completed an extended downward wave from the 0.7236 area and reached support at 0.7003. From this level, the first upward impulse formed towards 0.7042. The price remains below the main moving averages, so the medium-term structure is still downward.
The matrix of the current wave has a pivot around 0.7075. After the first recovery impulse, a retest of the 0.7009–0.7004 area is possible. If this support level holds, the correction will continue towards 0.7038 and then towards the key 0.7070–0.7075 area. A breakout below 0.7003 would open the way towards 0.6992. The main scenario remains the formation of a local base above 0.7003 and corrective growth towards the matrix centre.
AUDUSD forecast scenario
Trading scenario: BUY
- Price at the time of writing: 0.7017
- Entry price: 0.7022
- Stop loss: 0.6992
- Take profit: 0.7075
- Risk-to-reward ratio: 1:1.77
The trade idea is valid until 8:00 AM on 29 September 2026 (server time, UTC+3).
USDCAD forecast
For USDCAD, the fundamental balance points to elevated volatility. The Fed raised the rate to 3.75–4.00% in September, confirming the need to combat persistent inflation. Tighter US policy supports the dollar and helps preserve the upward structure in USDCAD.
The Bank of Canada kept the rate unchanged at 2.25% at its latest meeting. Canadian inflation is holding around 3%, but excluding gasoline it is around 2.2%, while core inflation measures remain close to the 2% target. At the same time, the BoC notes rising inflation risks due to high energy prices.
US-Canada trade relations create additional uncertainty. BoC Governor Tiff Macklem warned that new US tariffs could materially slow Canadian growth in the fourth quarter. High oil prices traditionally support the Canadian dollar, but their positive effect is currently being partly offset by inflation risks and deteriorating trade prospects.
The fundamental picture therefore points to USDCAD remaining high, although the likelihood of a technical correction is increasing following the strong rise.
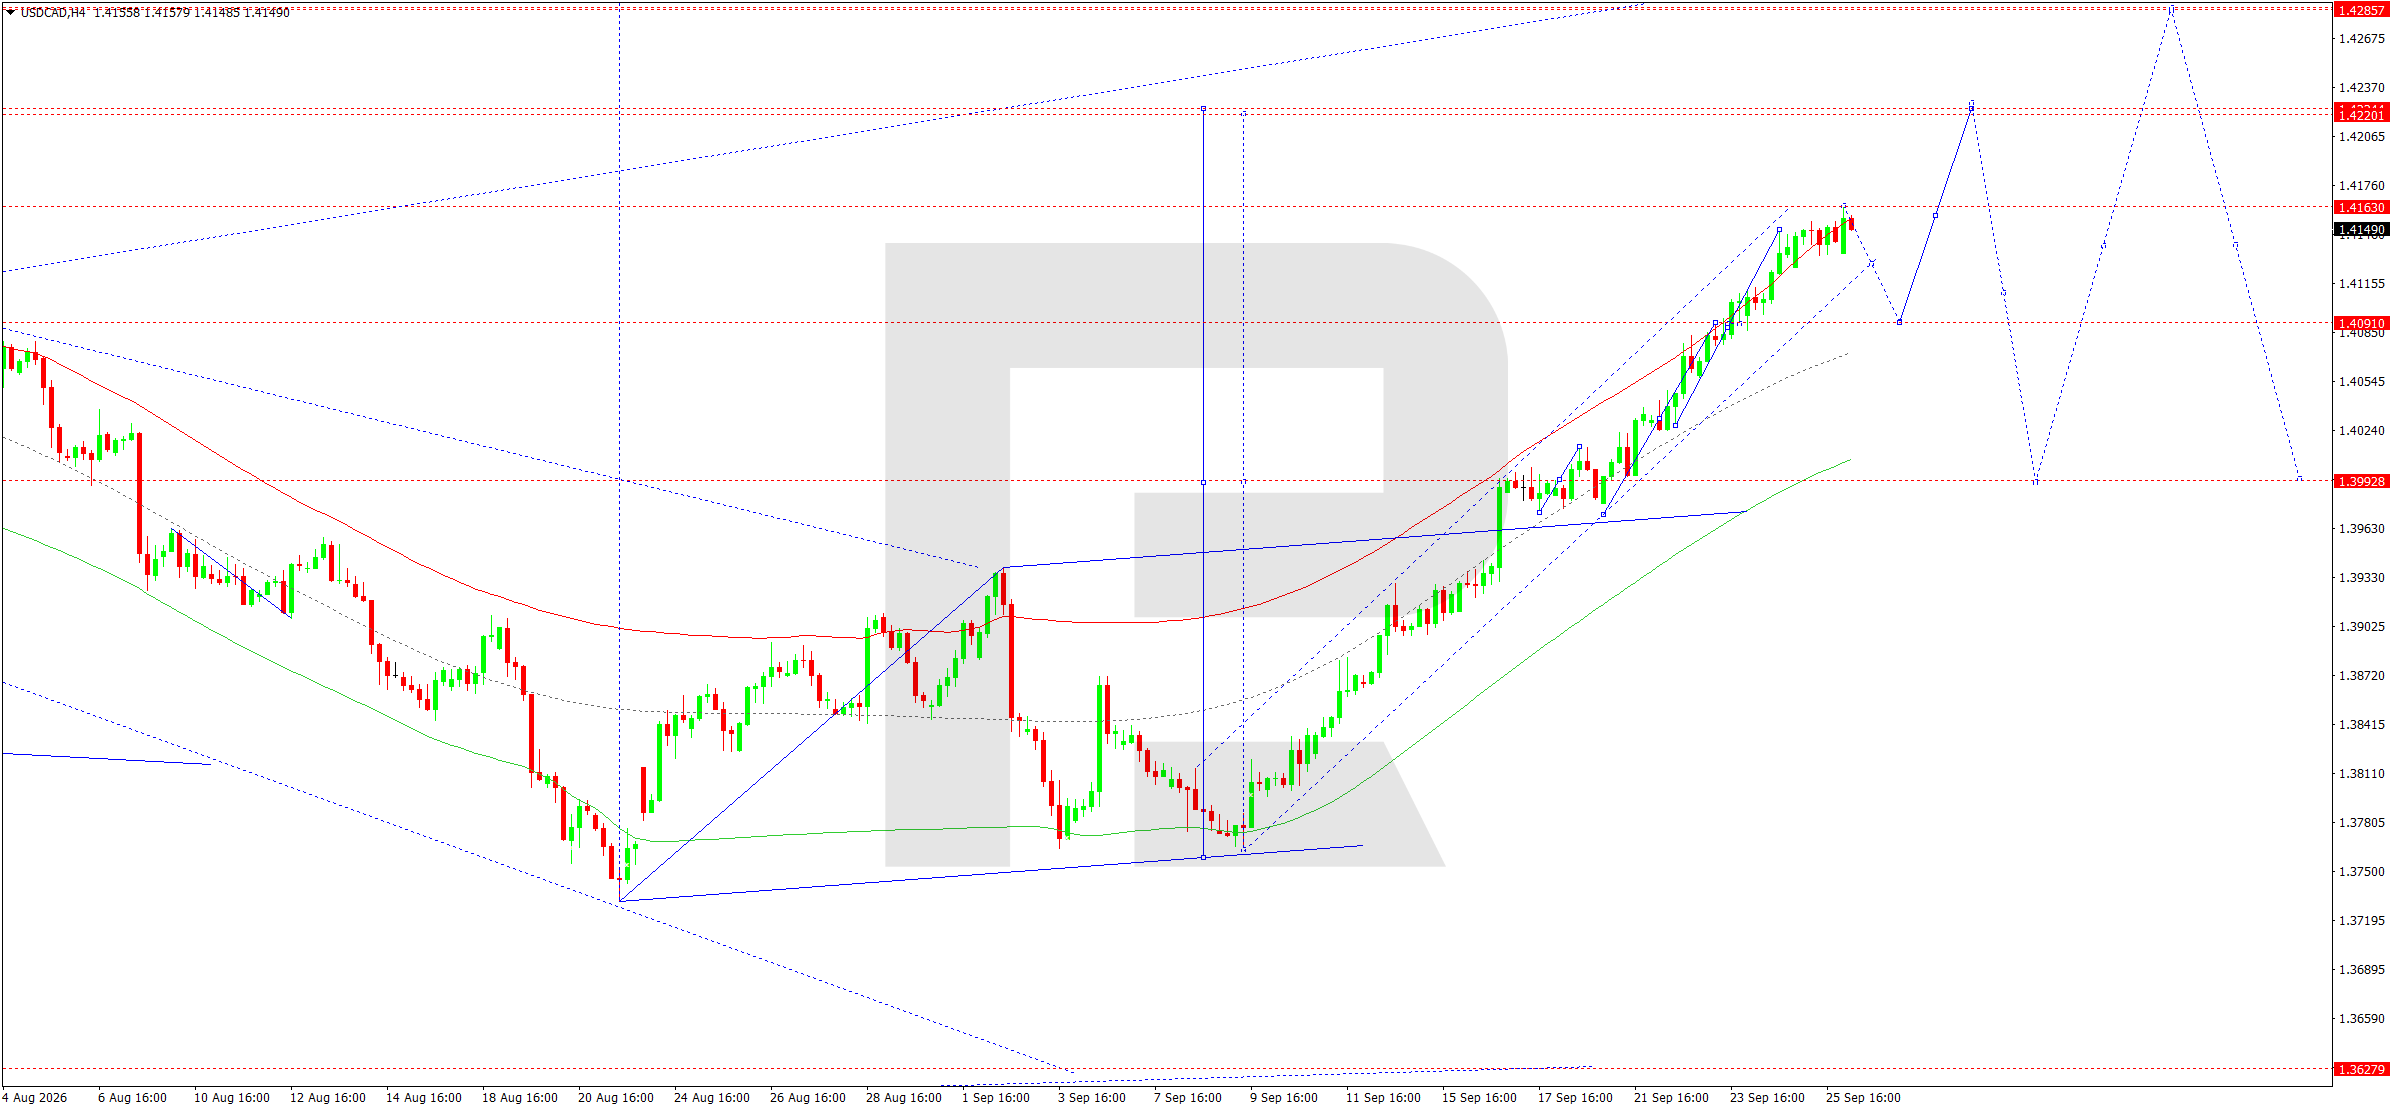
On the H4 chart, the market formed a stable upward structure from 1.3770 and reached the 1.4163 resistance level. The price remains above the main moving averages, confirming a continued medium-term uptrend. The market is currently forming a compact consolidation directly below 1.4163.
The upward wave matrix has a pivot around 1.4023. The upper boundary of the Price Envelope and the next projected target are around 1.4220. However, after an almost uninterrupted rise, the probability of a correction is increasing. If the 1.4163 resistance level holds, a decline is expected first towards 1.4091. A breakout below 1.4091 would allow the correction to develop towards the 1.4023–1.3993 area. An alternative scenario suggests consolidation above 1.4163, followed by continued growth towards 1.4220. For today, a correction after testing the upper part of the range is the preferred scenario.
USDCAD forecast scenario
Trading scenario: SELL
- Price at the time of writing: 1.4152
- Entry price: 1.4147
- Stop loss: 1.4220
- Take profit: 1.4091
- Risk-to-reward ratio: 1:0.77
The trade idea is valid until 8:00 AM on 29 September 2026 (server time, UTC+3).
XAUUSD forecast
The fundamental backdrop for gold at the start of the week remains predominantly unfavourable. The Fed raised the rate by 25 basis points to 3.75–4.00%, while the regulator's September projections point to persistently elevated inflation and a tighter rate path. Rising real and nominal US bond yields increase the opportunity cost of holding gold, which does not generate interest income.
On 28 September, gold came under additional pressure from a strong dollar, higher bond yields, and rising oil prices. Higher oil prices fuel inflation concerns and, accordingly, expectations of a prolonged period of tight Fed policy. Gold prices fell noticeably in international trading during the morning.
Geopolitical uncertainty continues to sustain structural demand for safe-haven assets; however, at the current stage, the impact of high rates and yields is stronger. Earlier, the market also reacted to expectations that US rates would remain high for an extended period.
The fundamental backdrop therefore suggests a technical recovery following the sharp decline but does not yet confirm a full medium-term reversal in gold.
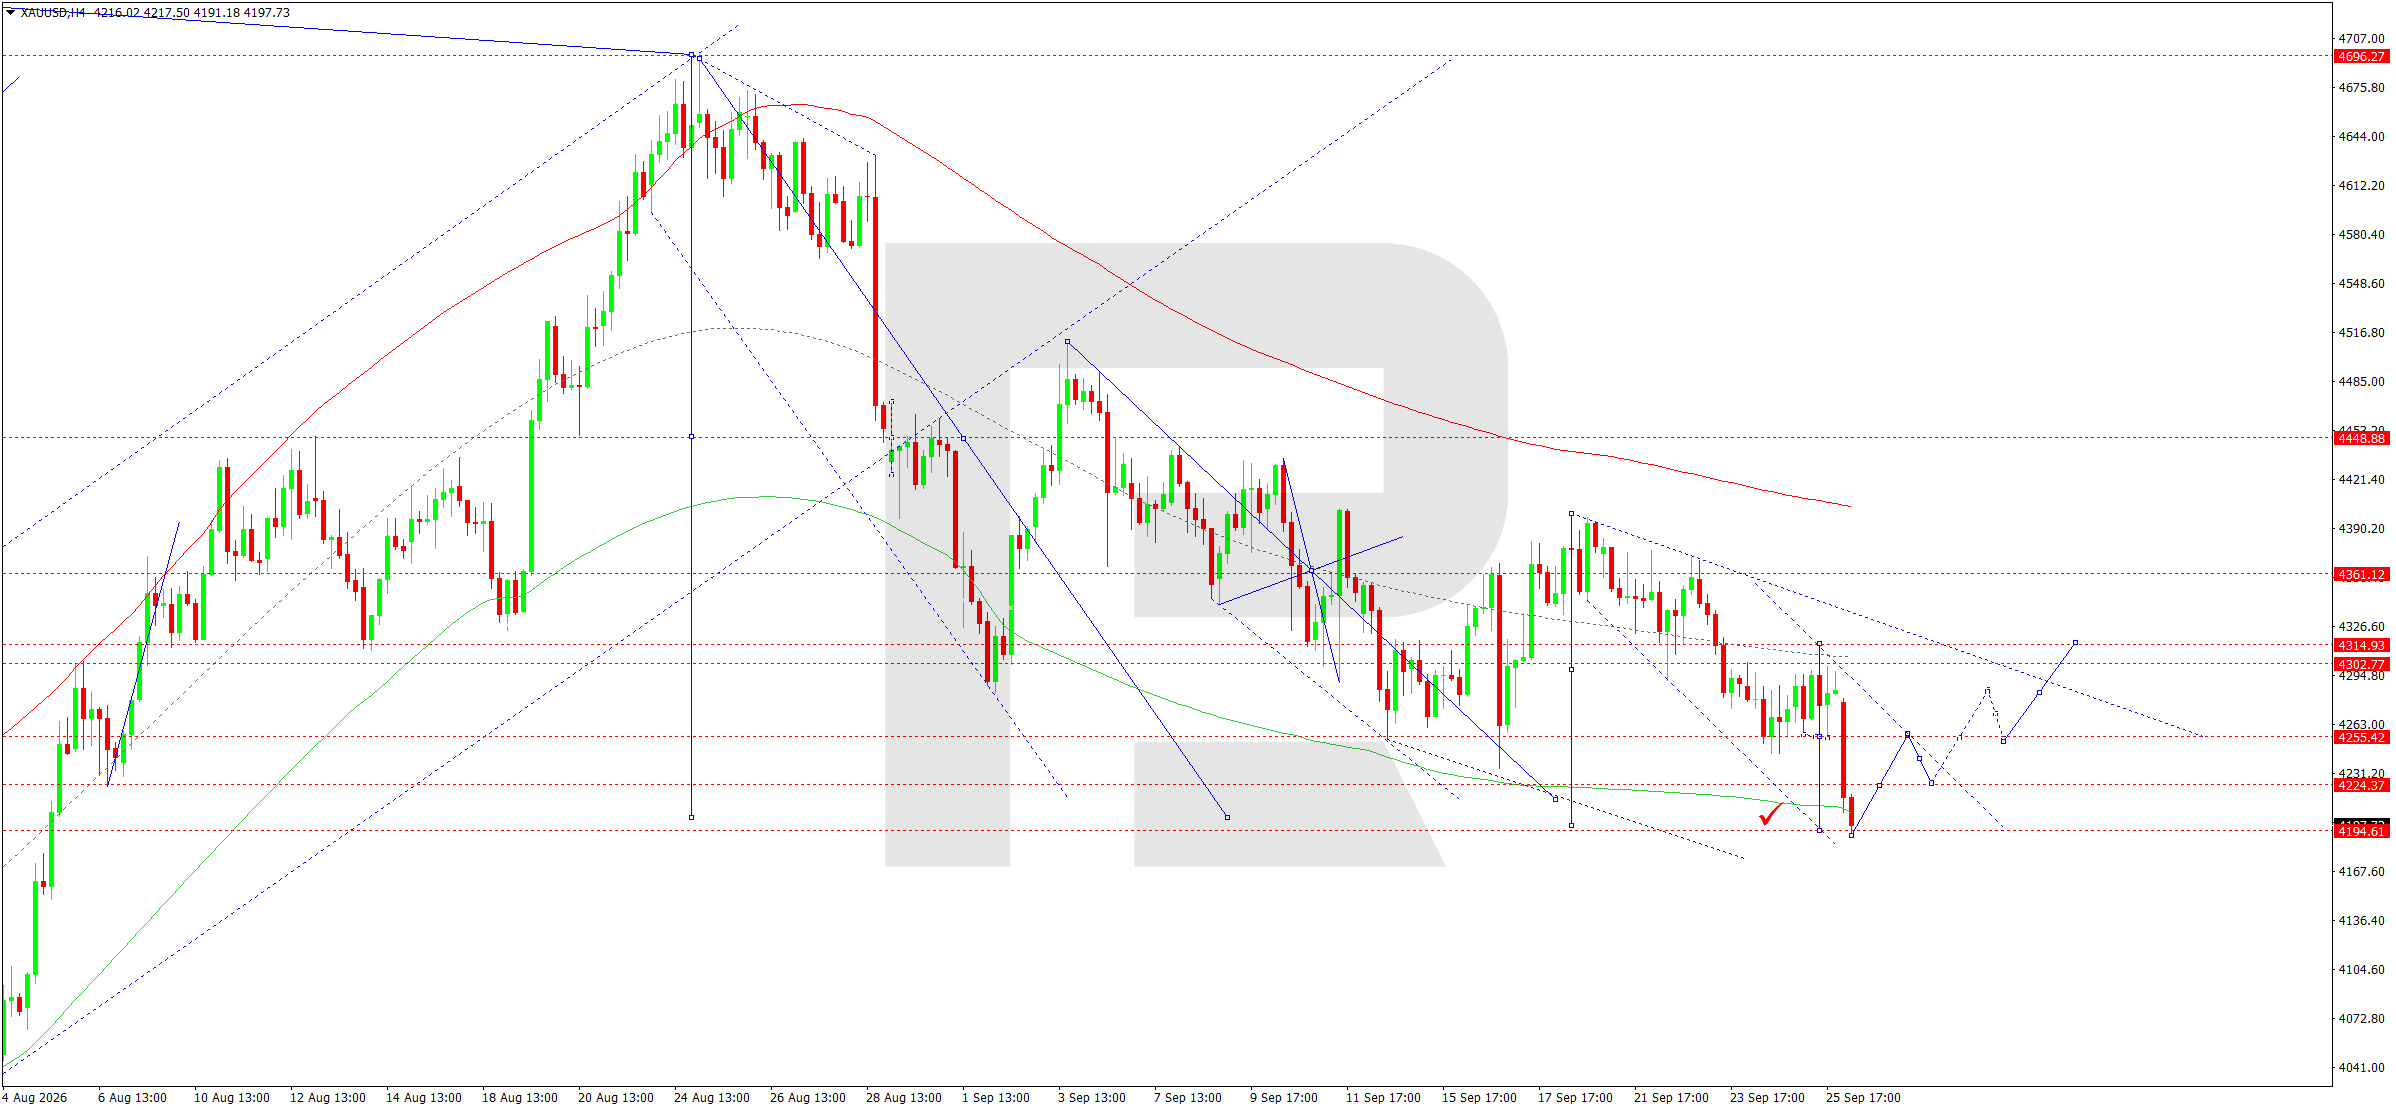
On the H4 chart, XAUUSD extended its downward wave and reached the 4,172–4,195 area. The target at the lower boundary of the current structure has therefore been almost fully reached. After the sharp downward momentum, the probability of a local consolidation and correction is increasing.
The downward wave matrix has a pivot at 4,448. Prices are hovering significantly below it, confirming that the main trend remains downward. At the same time, the 4,172–4,195 area acts as local support. Holding this zone suggests a potential recovery first towards 4,255 and then towards 4,303 and 4,315. The central projected correction area is around 4,300. Only consolidation above 4,361 would materially change the current downward structure. For today, after the lower boundary of the Envelope has been reached, priority is given to a corrective recovery.
XAUUSD forecast scenario
Trading scenario: BUY
- Price at the time of writing: 4,176
- Entry price: 4,181
- Stop loss: 4,149
- Take profit: 4,300
- Risk-to-reward ratio: 1:3.72
The trade idea is valid until 8:00 AM on 29 September 2026 (server time, UTC+3).
US 500 forecast
The US stock market enters the new week against a contradictory combination of resilient corporate activity and tighter financial conditions. In September, the Fed raised the target rate range by 25 basis points to 3.75–4.00% for the first time in an extended period. The regulator noted resilient domestic spending, strong capital investment, and persistently elevated inflation.
For the US 500, this means a higher discount rate for future corporate earnings and potential pressure primarily on companies with high valuation multiples.
Oil price movements remain an additional factor. Lower oil prices had previously helped reduce bond yields and support a recovery in US stocks, while renewed energy price growth could once again strengthen inflation expectations. Towards the end of last week, signs of a short-term correction intensified despite continued investor interest in the technology sector. The current short-term outlook for the S&P 500 also points to rising macroeconomic risks and pressure on the index.
The fundamental environment therefore remains mixed: strong corporate performance supports the market, while rising rates, yields, and energy costs limit the potential for further multiple expansion.
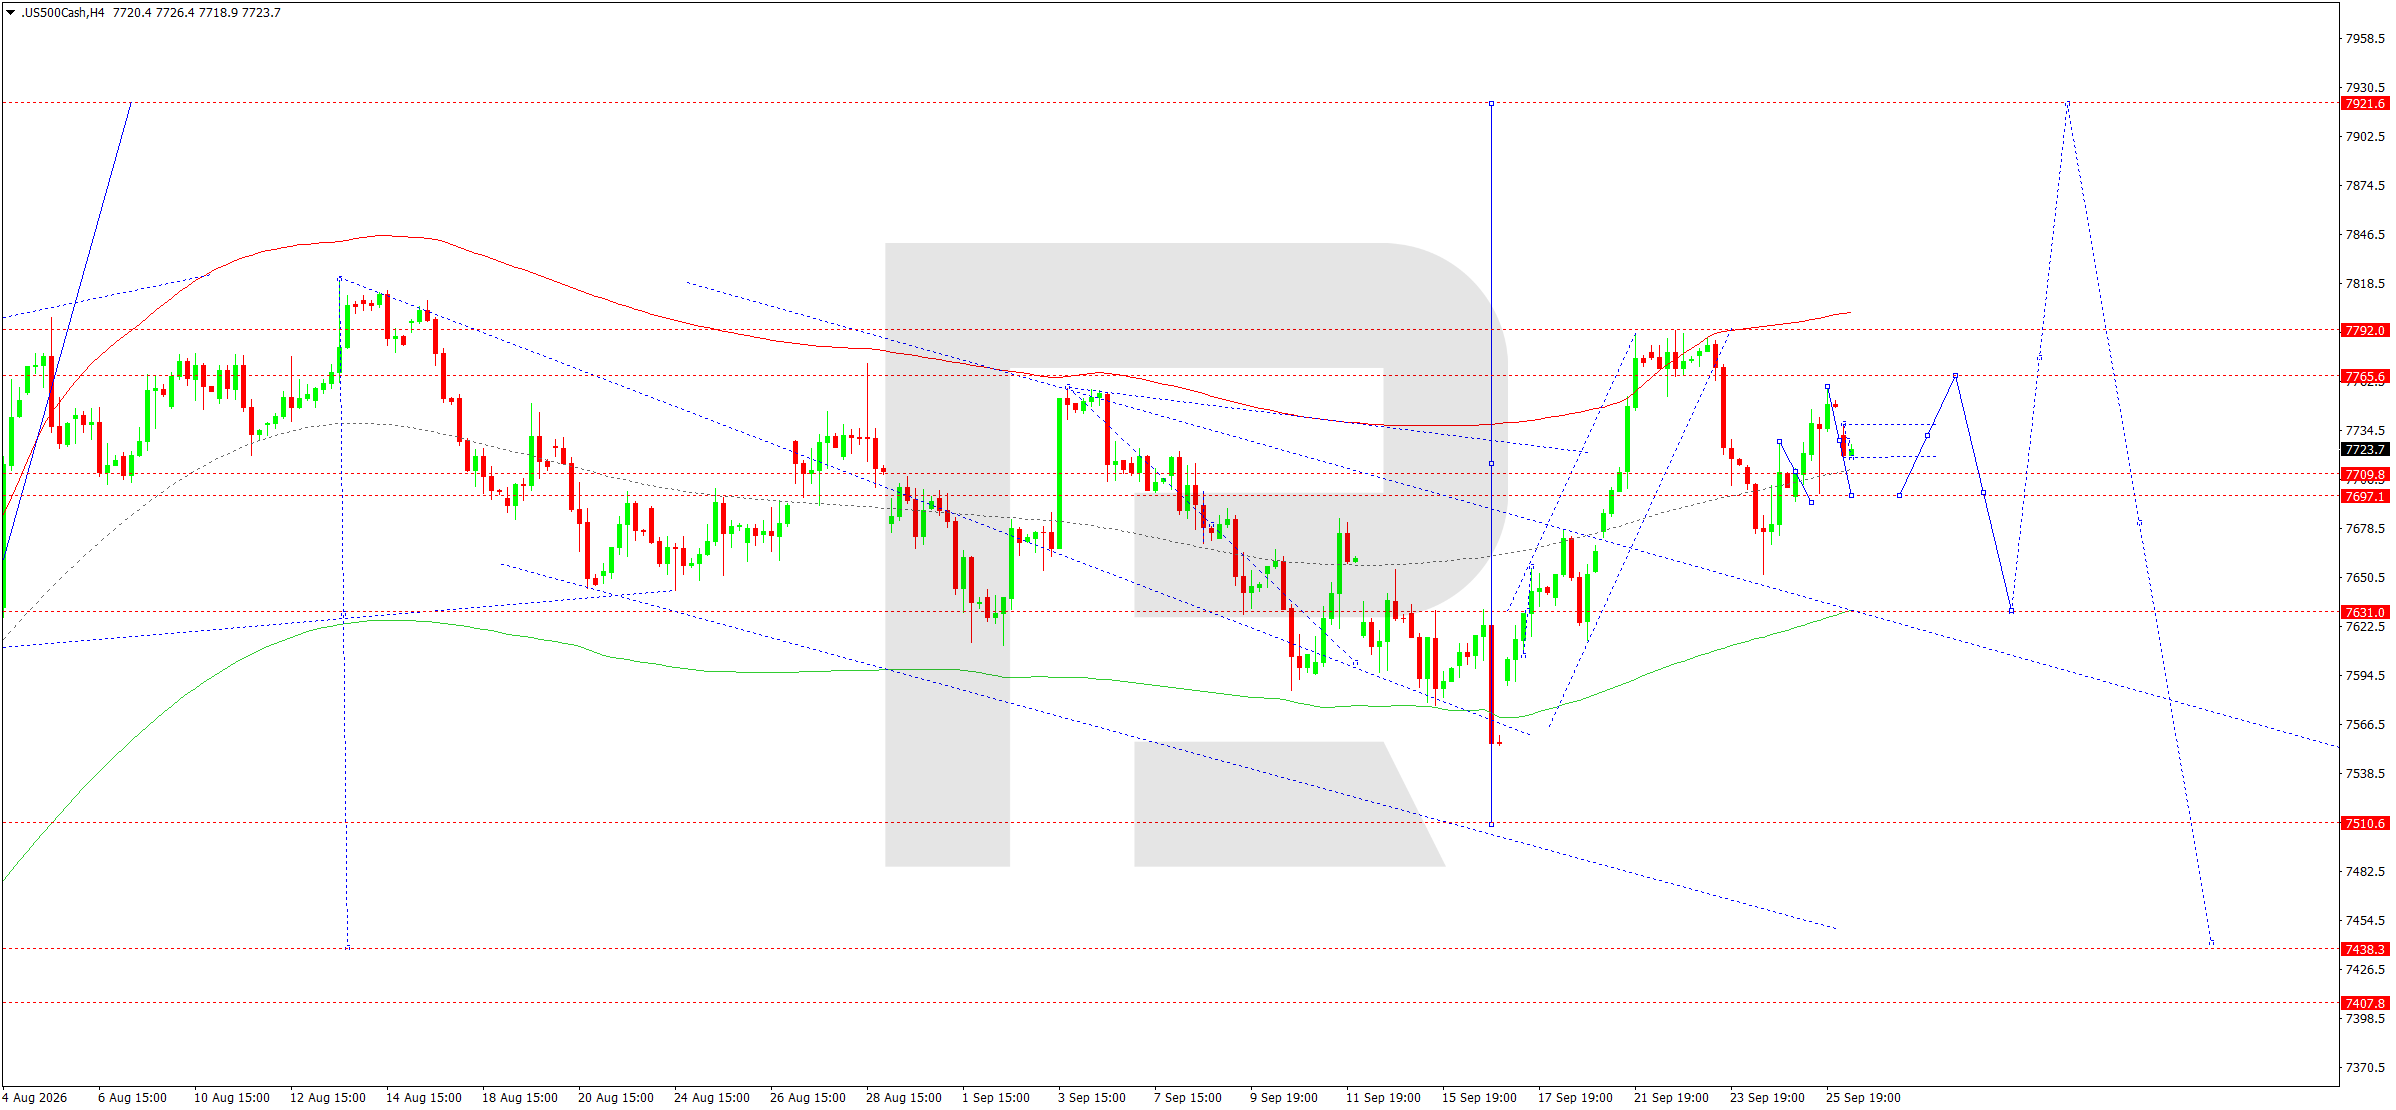
On the H4 chart, after rising towards the 7,792 area, the US 500 formed a correction and entered a consolidation phase. The price is currently trading around 7,724, between resistance at 7,766 and support at 7,697.
The matrix of the current structure has a pivot around 7,650. The local 7,697–7,766 range is becoming key to determining the next impulse. While the price remains below 7,766–7,792, the risk of another downward move remains. The first target is 7,697, followed by 7,631. The 7,631 level also coincides with a key support area and the lower part of the current structure. Only sustained consolidation above 7,792 would shift the priority back to a bullish scenario. For today, the main scenario is a decline from the upper half of the consolidation towards 7,697, with the potential to extend the move towards 7,631.
US 500 forecast scenario
Trading scenario: SELL
- Price at the time of writing: 7,720
- Entry price: 7,715
- Stop loss: 7,766
- Take profit: 7,631
- Risk-to-reward ratio: 1:1.65
The trade idea is valid until 8:00 AM on 29 September 2026 (server time, UTC+3).
BTCUSD forecast
BTCUSD starts the week after a notable recovery in September, although the macroeconomic backdrop has become less favourable for risk assets. The Fed raised the rate to 3.75–4.00%, while its September projections imply that monetary policy will remain fairly tight. High US bond yields increase the cost of capital and generally limit demand for the most volatile assets.
At the same time, Bitcoin climbed above 86,000 last week, reaching its highest levels in around eight months. The rise was accompanied by improved risk appetite, interest in the technology sector, and institutional demand. However, momentum had waned by 28 September. Bitcoin fell towards the 83,000–84,000 area amid a stronger dollar, rising oil prices, and cooling inflows into exchange-traded funds. Profit-taking after the recent move above 87,000 also added pressure.
The fundamental picture therefore remains mixed: medium-term institutional interest persists, but tight Fed policy and weaker inflows of new capital increase the probability that the correction will continue before another attempt to rise.
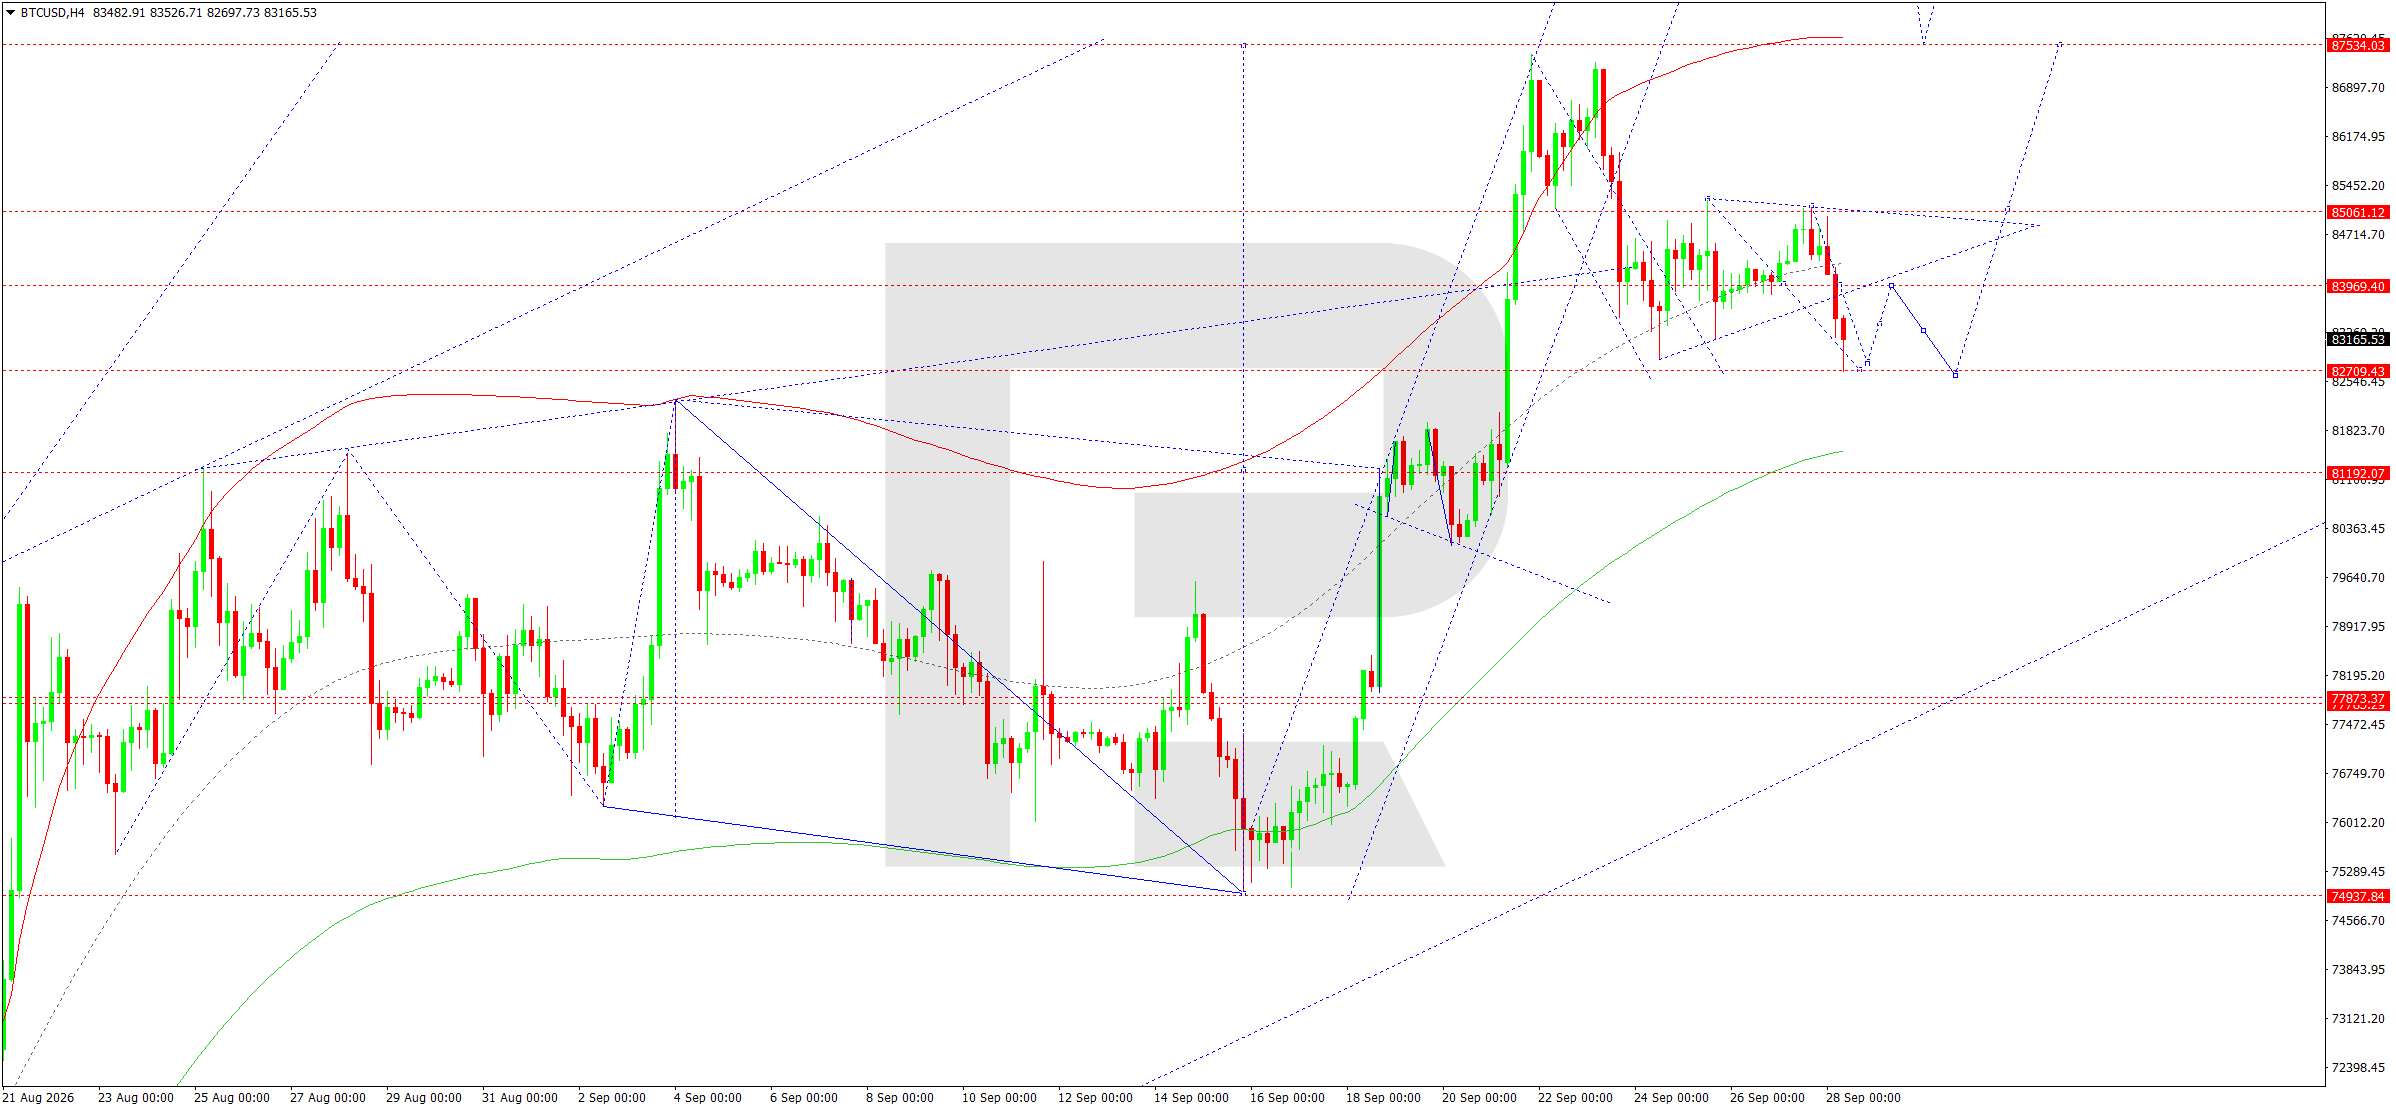
On the H4 chart, after a strong impulse towards 87,534, BTCUSD moved into a corrective phase. The price fell towards 82,700, after which a recovery formed, but the 85,061 level remained key resistance.
The upward wave matrix has a pivot around 81,190. While the price remains above this level, the medium-term upward structure has not been fully broken. Locally, however, the market is below 83,969 and is forming a downward move. The 82,709 support level is the nearest target for sellers. A breakout below it would open the way towards 81,190. A recovery above 83,969 would open the door for a retest of the 85,061 level, but only consolidation above this mark would restore the potential for a move towards 87,534. For today, given the incomplete correction, priority remains with a decline towards 82,700.
BTCUSD forecast scenario
Trading scenario: SELL
- Price at the time of writing: 83,120
- Entry price: 83,115
- Stop loss: 84,000
- Take profit: 82,700
- Risk-to-reward ratio: 1:0.47
The trade idea is valid until 8:00 AM on 29 September 2026 (server time, UTC+3).
Editors’ picks
 EURUSD forecast 2026–2027: technical analysis, price levels & predictions
The EURUSD outlook for 2026 and 2027: key levels on the daily chart, three trading scenarios and the policy gap between the Fed and the ECB that drives the pair.
 Gold (XAUUSD) forecast 2026: technical analysis, price levels & predictions
Where gold could trade in 2026: key levels, three trading scenarios with entry triggers and the forecasts from J.P. Morgan, Deutsche Bank and Goldman Sachs.
Forecasts presented in this section only reflect the author’s private opinion and should not be considered as guidance for trading. RoboForex bears no responsibility for trading results based on trading recommendations described in these analytical reviews.