
Daily technical analysis and forecast for 29 September 2026
Daily technical analysis and forecast for EURUSD, USDJPY, GBPUSD, AUDUSD, USDCAD, XAUUSD, US 500, and BTCUSD for 29 September 2026.
Each scenario on this page reflects the market structure on the H4 chart as of 10:00 UTC+3 on 29 September 2026. The assessment considers the current H4 chart structure, key support and resistance levels, the direction of the medium-term movement, and the prevailing fundamental backdrop.
EURUSD forecast
The fundamental backdrop for EURUSD remains primarily linked to diverging expectations for monetary policy in the US and the eurozone. The US Federal Reserve raised the target rate range by 25 basis points to 3.75–4.00% on 16 September, citing resilient economic growth and persistently elevated inflationary pressure. The European Central Bank had also previously raised key rates by 25 basis points, taking the deposit rate to 2.50%. The ECB expects average eurozone inflation of 3.0% in 2026.
However, current market dynamics favour the dollar. Rising oil prices are increasing concerns about US inflation while supporting expectations that Fed rates will remain high. The yield on 10-year US Treasuries has risen above 5%, while the 2-year yield has approached 5%.
In the foreign exchange market, the dollar is holding near two-month highs, while the euro remains under pressure. The conflict in the Middle East is an additional risk factor, with Brent trading around 107 USD per barrel. The market is awaiting US employment and inflation data, which could materially change expectations for the Fed's October decision.
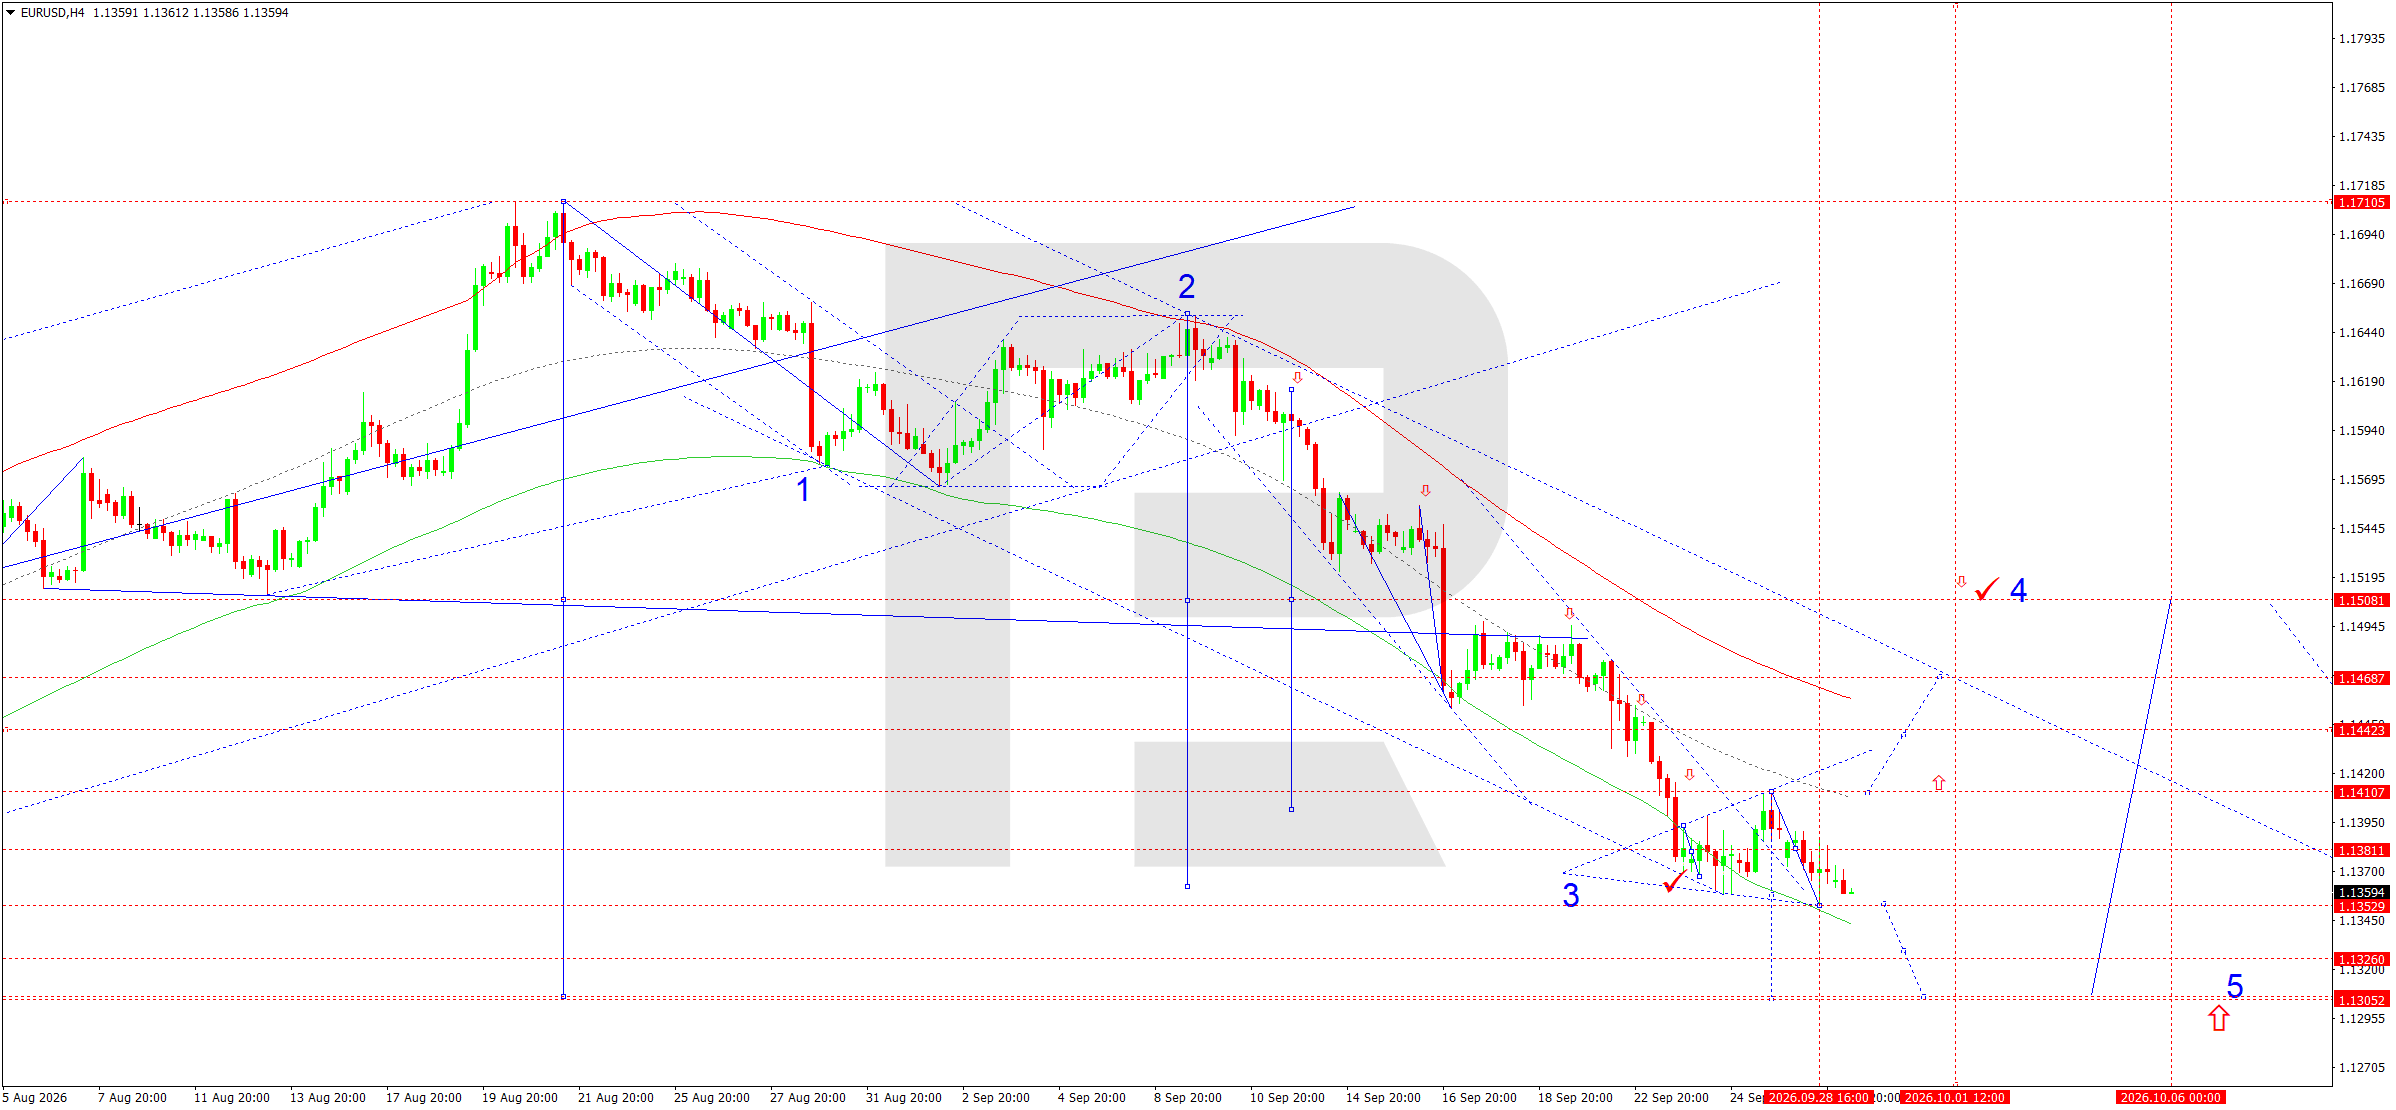
On the H4 chart, EURUSD remains in a stable downtrend. After forming a downward wave towards 1.1353, the market made a local correction towards 1.1381 but failed to consolidate above this resistance level. The 1.1381 mark effectively acted as a retest zone from below, keeping sellers in control.
The Elliott Wave structure and the downward wave matrix with a pivot around 1.1535 confirm the priority of the bearish scenario. The price remains well below the matrix pivot and is moving within a descending channel. The nearest target is 1.1326–1.1320. A breakout below this area would open the way towards 1.1305–1.1306, where the next significant support area is located.
While the price remains below 1.1381, any recovery should be regarded as corrective. A return above 1.1410 would weaken the current bearish momentum, but the main H4 structure does not yet confirm an upward reversal. For 29 September, the base case remains a continued decline after the local retest is complete.
EURUSD forecast scenario
Trading scenario: SELL
- Price at the time of writing: 1.1355
- Entry price: 1.1350
- Stop loss: 1.1381
- Take profit: 1.1306
- Risk-to-reward ratio: 1:1.42
The trade idea is valid until 8:00 AM on 30 September 2026 (server time, UTC+3).
USDJPY forecast
The fundamental backdrop for USDJPY is being shaped simultaneously by tight US policy and the continued normalisation of Japanese policy. The Fed raised the rate to a range of 3.75–4.00% in September, as inflation remains elevated and economic activity is described as resilient. Rising US yields have become one of the main factors supporting the dollar: the 10-year yield rose above 5.2%, while the market continues to price in the possibility of further tightening.
The Bank of Japan also raised the rate on 18 September, from 1.00% to 1.25%, the highest level in around 31 years. The decision was taken by seven votes to two and reflects the BoJ's intention to contain the risk of inflation remaining sustainably above its 2% target. However, the gap between Japanese and US rates remains significant, so the BoJ hike alone was not enough to produce sustained yen appreciation.
Oil is an additional factor. The continuing Middle East conflict is keeping Brent near 107 USD, which is unfavourable for Japan as a major energy importer. At the same time, high oil prices increase global inflationary pressure and support high US bond yields. The fundamental balance therefore still allows USDJPY to remain at elevated levels, although the risk of currency-related comments from Japanese authorities increases as the yen weakens.
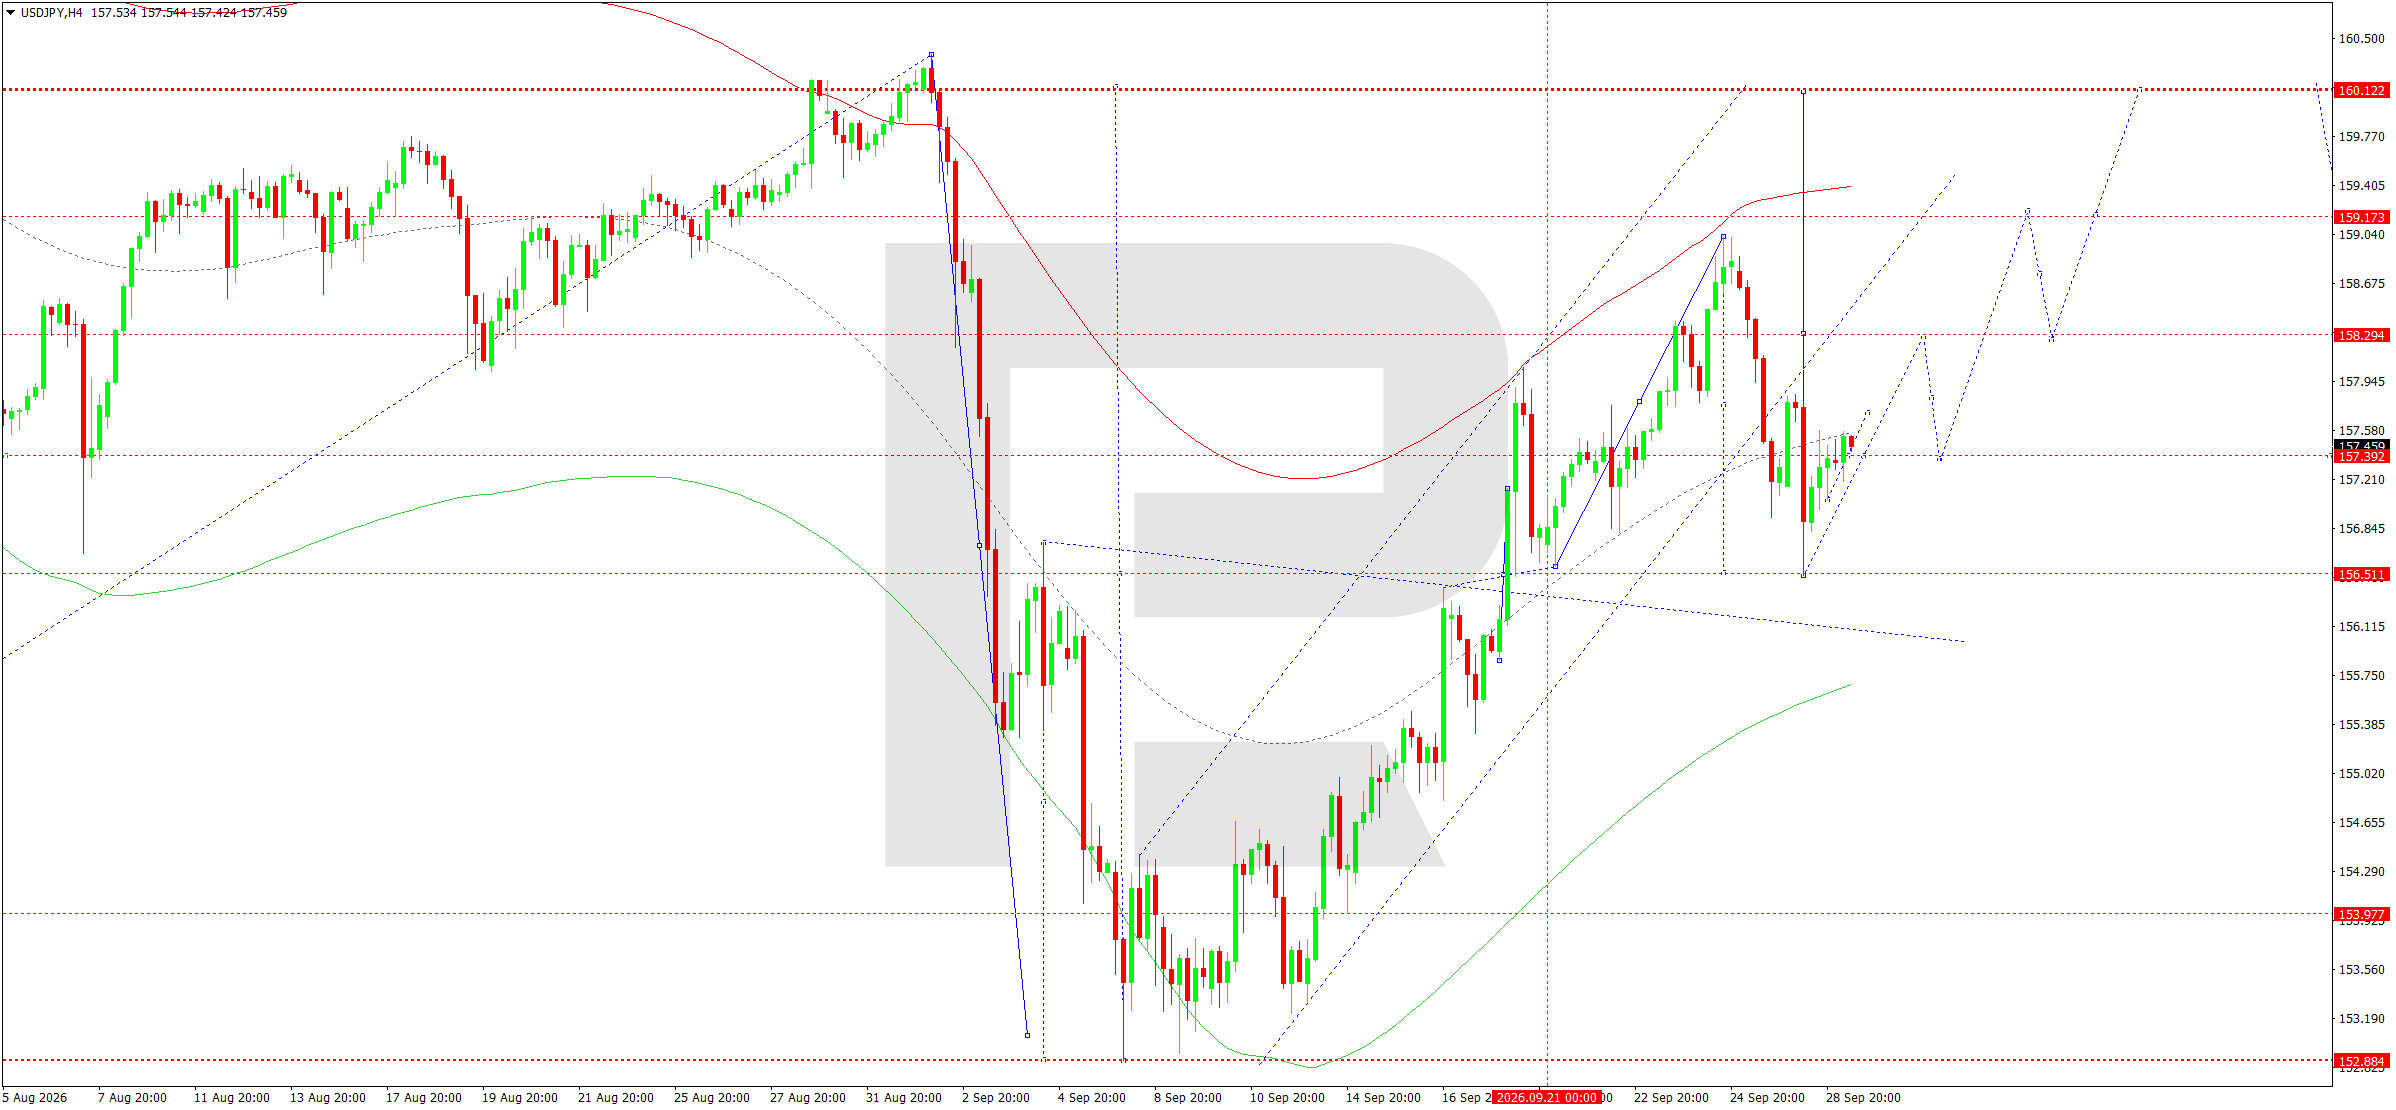
On the H4 chart, after breaking support at 157.96, the pair formed a downward wave towards 156.51. This area became a pivot point: the subsequent rebound and retest from above confirm demand.
The matrix structure with a pivot at 156.51 suggests a continued recovery wave. The buyers' nearest task is to consolidate above 157.50–157.70, with the next target standing at 158.29. This is where a significant resistance level and an intermediate target of the current momentum are located.
Above 158.29, there is potential for a move towards 159.17 and then 160.12, although such a scenario remains extended for the current trading day. The key condition for maintaining the rise is for the price to hold above 156.51. Therefore, after the pivot test has formed, the technical priority for 29 September shifts towards a continued recovery.
USDJPY forecast scenario
Trading scenario: BUY
- Price at the time of writing: 157.37
- Entry price: 157.42
- Stop loss: 157.00
- Take profit: 158.29
- Risk-to-reward ratio: 1:2.07
The trade idea is valid until 8:00 AM on 30 September 2026 (server time, UTC+3).
GBPUSD forecast
GBPUSD remains under the influence of a strong dollar and elevated expectations for US interest rates. Following the Fed's September rate hike to 3.75–4.00%, the market has focused on the resilience of the US economy and inflation risks associated with high oil prices. US Treasury yields above 5% are creating additional demand for dollar assets and limiting the pound's recovery potential.
The Bank of England kept the rate unchanged at 3.75% at its September meeting. The decision was taken by a 6–3 vote, with three Monetary Policy Committee members favouring an increase to 4.00%. UK inflation reached 3.1% in August, while the BoE warned that it could rise further, driven by the energy shock. UK policy therefore also remains tight, but this has not yet been sufficient to offset the dollar's advantage created by higher US yields.
UK economic activity is somewhat more resilient than previously expected, although the labour market remains relatively soft. At the same time, higher energy costs are worsening the outlook for consumer spending and increasing production costs. The current fundamental balance for GBPUSD therefore remains mixed, but in the short term, a strong dollar and the global rise in yields are creating predominantly downward pressure.
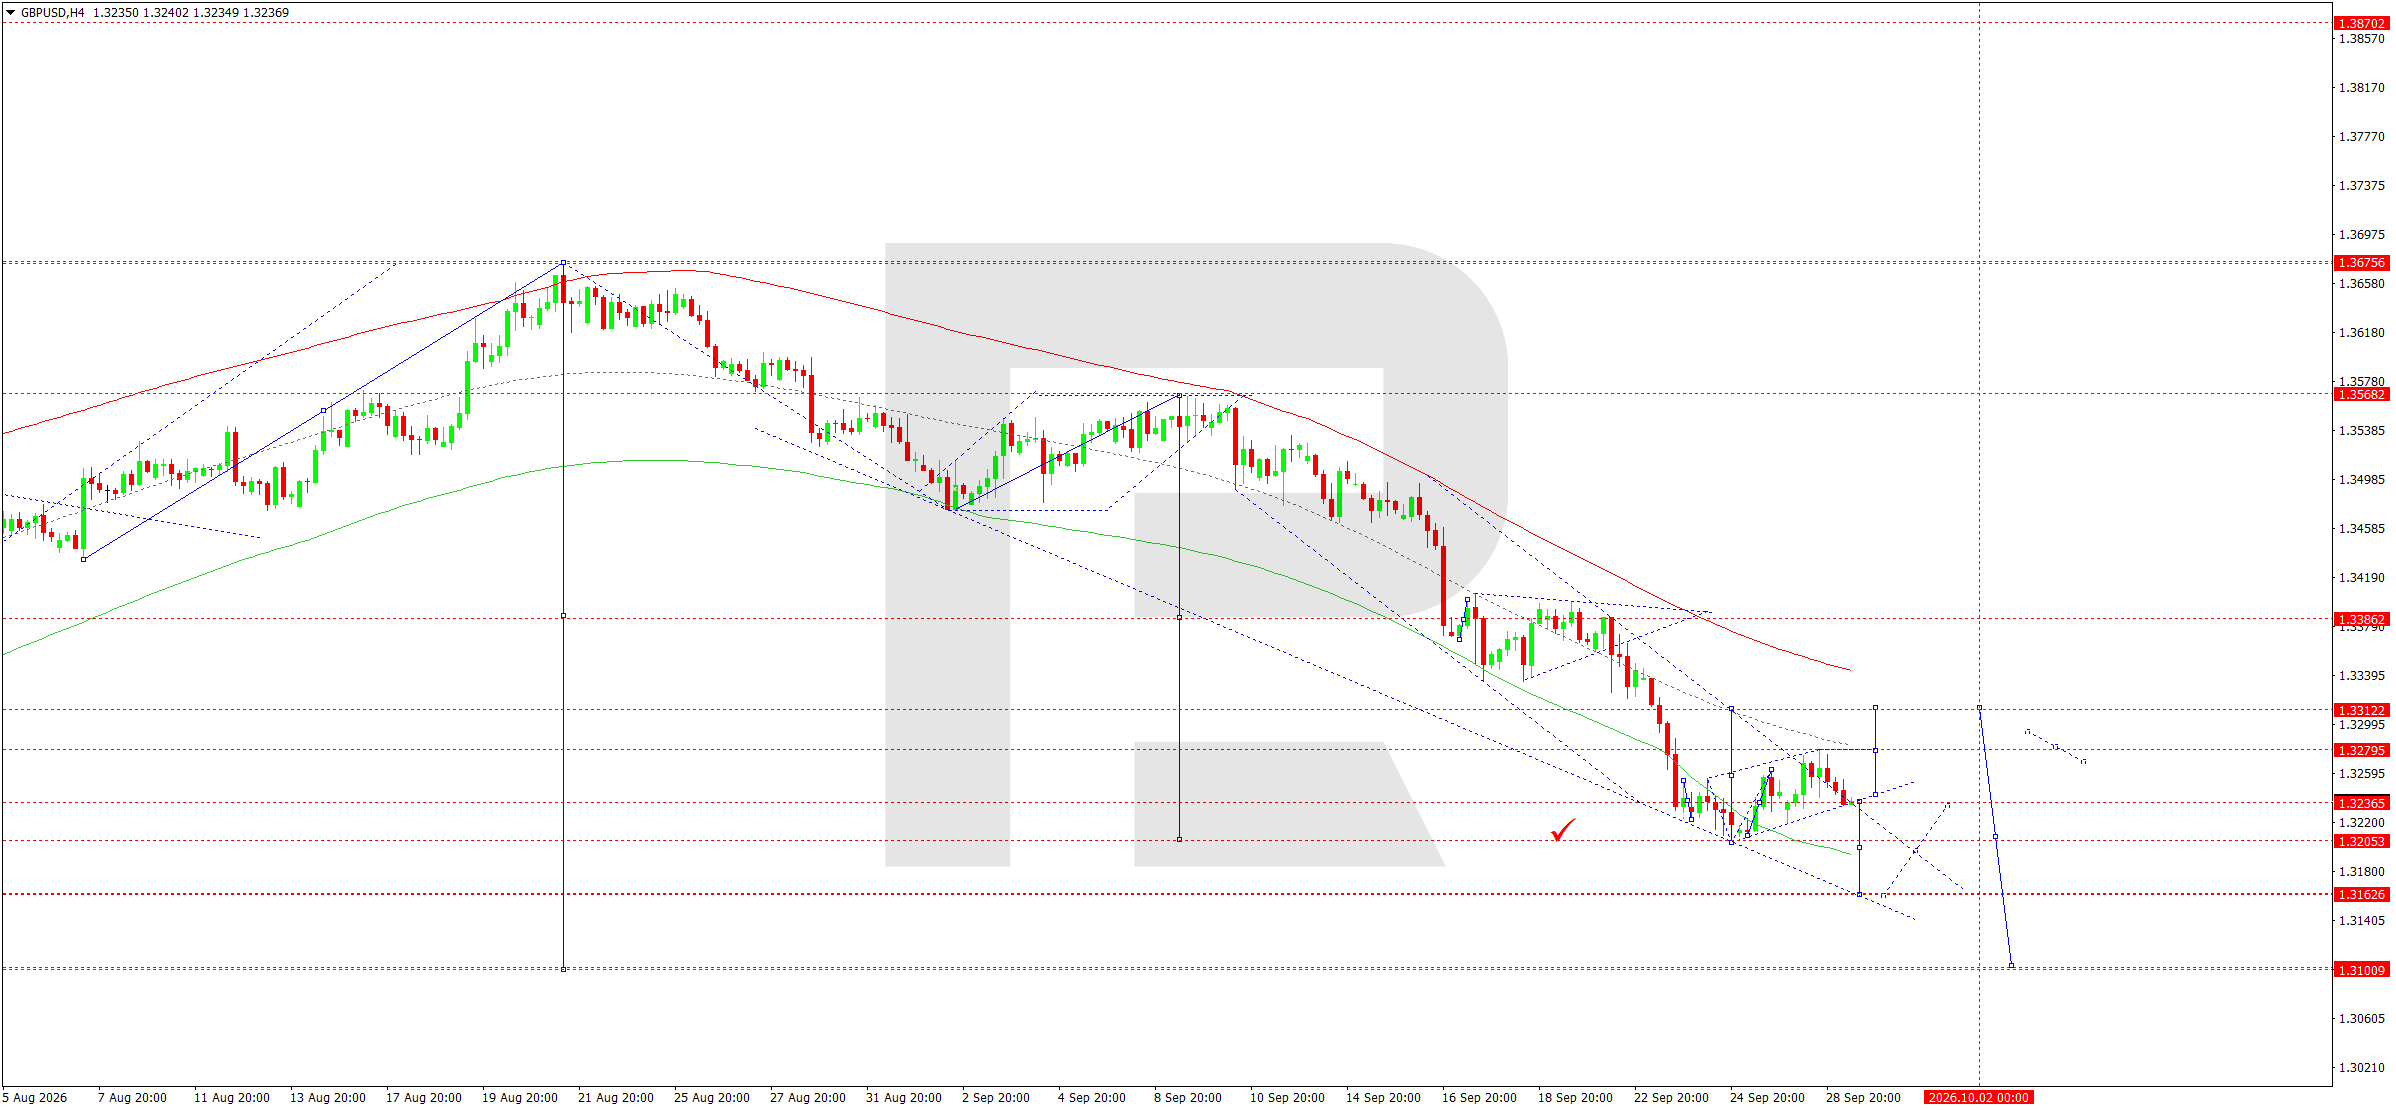
On the H4 chart, GBPUSD continues to trade within a stable downward structure. After forming a local correction towards 1.3279, buyers failed to change the direction of the main trend. The price remains below the declining moving averages and below the key matrix pivot at 1.3382.
The nearest technical objective is a retest of the 1.3205 mark. A breakout below this support level would confirm continued momentum towards 1.3162, with the next extended target at around 1.3100–1.3101.
The Elliott Wave structure also corresponds to the development of another downward move. The lower boundary of the Price Envelope is around 1.3162, making this level the main intraday target. While the market remains below 1.3279, corrective recovery attempts do not disrupt the bearish structure. A return above 1.3312 would be the first warning that selling pressure is easing, but for now the main scenario suggests a continued decline.
GBPUSD forecast scenario
Trading scenario: SELL
- Price at the time of writing: 1.3232
- Entry price: 1.3227
- Stop loss: 1.3279
- Take profit: 1.3162
- Risk-to-reward ratio: 1:1.25
The trade idea is valid until 8:00 AM on 30 September 2026 (server time, UTC+3).
AUDUSD forecast
For AUDUSD, the key event on 29 September was the Reserve Bank of Australia decision. The central bank raised the rate by 25 basis points to 4.60%, the highest level in around 15 years. This was already the fourth hike in 2026. Elevated inflation remains the reason: the core measure is around 3.6%, above the RBA's 2–3% target range. The Bank also kept open the possibility of further policy tightening.
Nevertheless, the Australian dollar's reaction was restrained, as the increase had been largely priced in. At the same time, the US dollar is being supported by a sharp rise in Treasury yields and expectations of further Fed tightening. The yield on 10-year US Treasuries rose above 5.27%, while higher oil prices are increasing global inflation risks.
For the Australian currency, the combination of factors is mixed. A higher RBA rate fundamentally improves the yield on Australian assets, but rising energy costs, weaker global risk appetite, and a strong dollar limit this effect. China remains an additional factor, as the performance of Chinese industry and commodity demand directly affects Australian exports. As a result, the RBA decision provides fundamental support for the AUD, but the technical structure still shows that sellers retain the initiative.
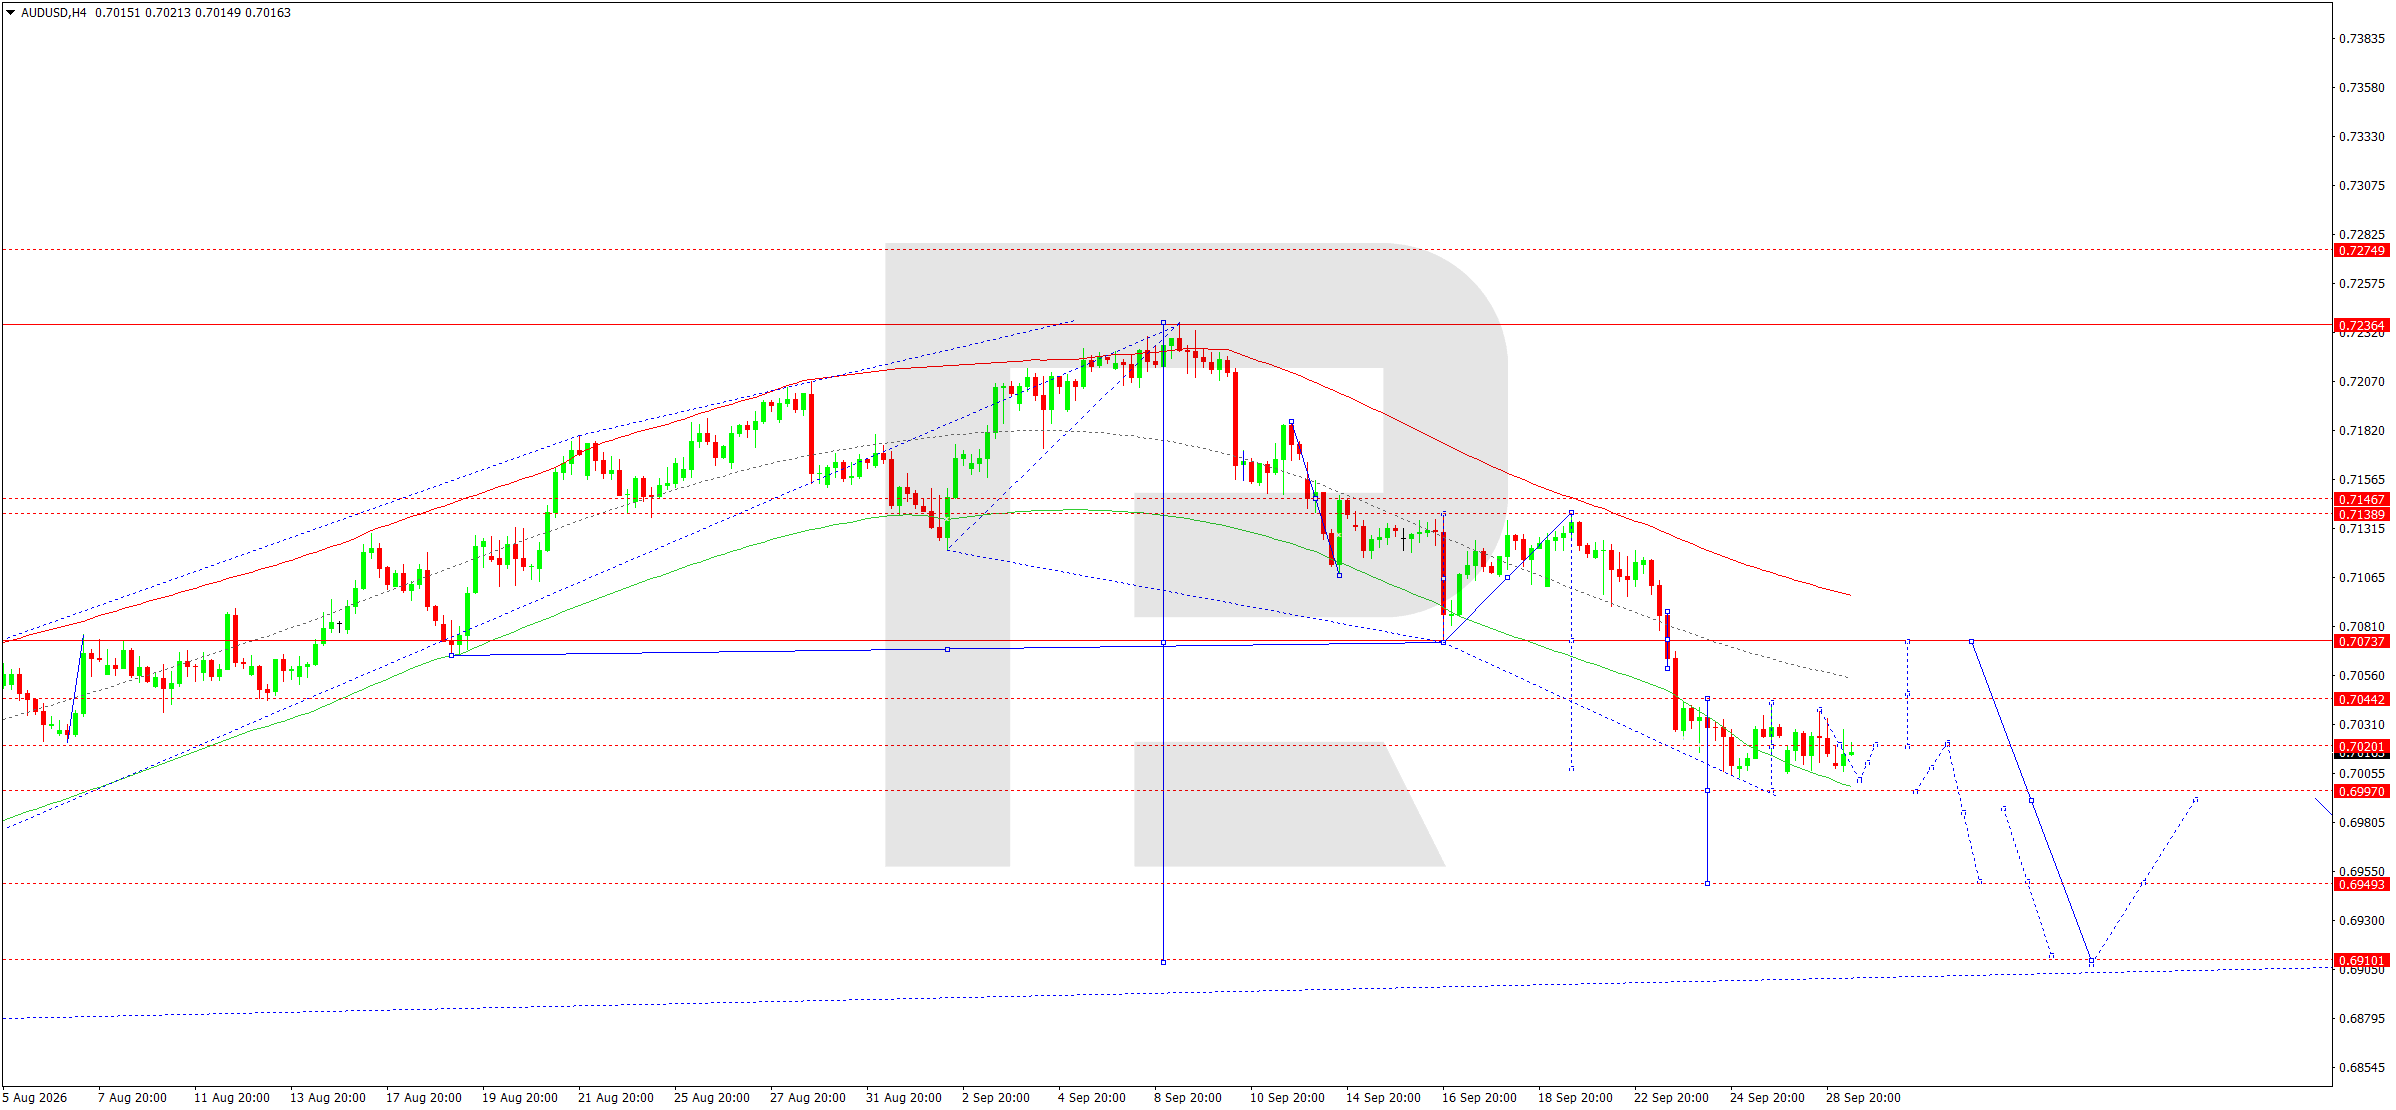
On the H4 chart, AUDUSD remains in a downtrend after reversing from the 0.7236 area. The price continues to form lower highs and lower lows and remains below the matrix pivot at 0.7075.
After declining towards 0.6997–0.6996, the market formed a compact consolidation. In the short term, a correction towards 0.7020–0.7044 is possible, but for now it is still viewed as part of the downward structure. A breakout below 0.6997 would signal continuation towards 0.6949–0.6946, while the next target is around 0.6910.
AUDUSD forecast scenario
Trading scenario: SELL
- Price at the time of writing: 0.6992
- Entry price: 0.6987
- Stop loss: 0.7020
- Take profit: 0.6910
- Risk-to-reward ratio: 1:2.33
The trade idea is valid until 8:00 AM on 30 September 2026 (server time, UTC+3).
USDCAD forecast
For USDCAD, the fundamental picture is shaped by a combination of a strong US dollar, high oil prices, and differences in central bank policy. The Fed raised the rate by 25 basis points in September to 3.75–4.00%, while the Bank of Canada kept the rate unchanged at 2.25% on 2 September. The interest-rate differential therefore continues to favour the US currency.
The BoC noted that the Canadian economy grew by 3.3% year-on-year in Q2, although new US tariffs create risks for a further recovery. Inflation is around 3%, with expensive petrol playing a significant role. At the same time, BoC officials stressed their readiness to raise the rate if inflationary pressure proves persistent.
Oil traditionally supports the Canadian dollar, and the current rise in Brent to around 107 USD should partly restrain USDCAD. However, unusually high US yields and sustained demand for the dollar are currently stronger factors. The US-Canada trade conflict creates additional uncertainty. As a result, the fundamental backdrop allows USDCAD to remain at elevated levels, although the probability of a correction increases once the current momentum is complete.
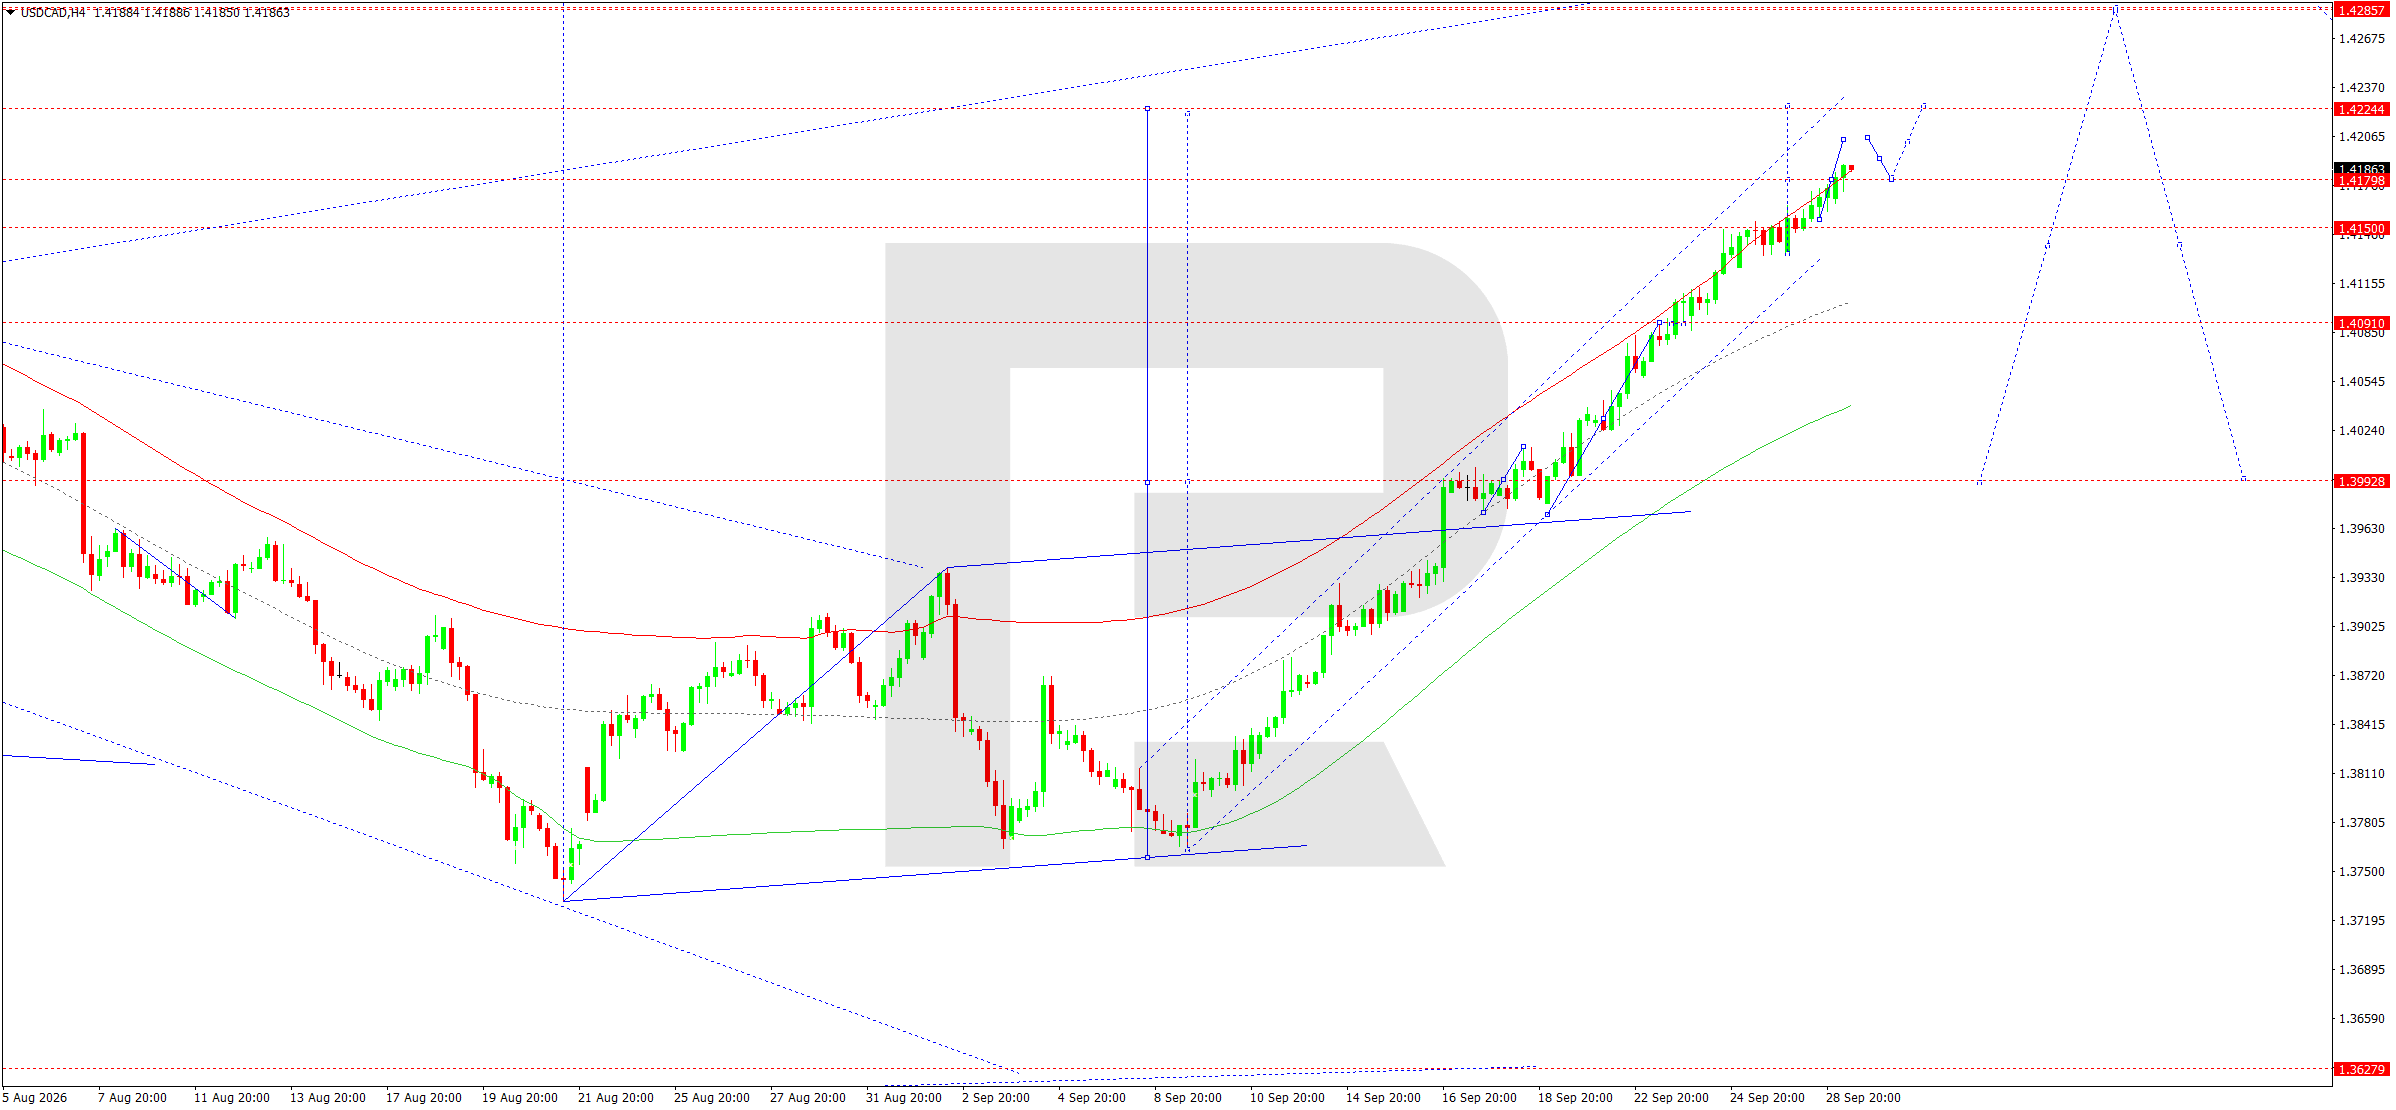
On the H4 chart, a pronounced uptrend remains in place. After forming a base around 1.3780, the market successively moved through 1.3993, 1.4091, and 1.4150, reaching the 1.4190 area.
The upward wave matrix with a pivot at 1.3929 continues to confirm the buyers' advantage. The nearest target is 1.4224–1.4222. Before it is reached, a compact range may form around 1.4180–1.4200. While 1.4150 holds as support, the upward bias remains the priority.
After 1.4222 is reached, the probability of a deeper correction increases noticeably. The first target for such a move would be 1.4150, followed by the central Envelope area around 1.4091. Therefore, at the current stage, the focus is on completing the final upward move rather than opening a medium-term position against an already established impulse.
USDCAD forecast scenario
Trading scenario: BUY
- Price at the time of writing: 1.4181
- Entry price: 1.4186
- Stop loss: 1.4150
- Take profit: 1.4222
- Risk-to-reward ratio: 1:1.00
The trade idea is valid until 8:00 AM on 30 September 2026 (server time, UTC+3).
XAUUSD forecast
Gold remains heavily influenced by US interest rate policy. The Fed raised the rate to a range of 3.75–4.00% in September, while a sharp rise in US bond yields increases the opportunity cost of holding gold, which does not generate interest income. On 29 September, the yield on 10-year US Treasuries is above 5%, while the 2-year yield is around 5%, creating a serious fundamental obstacle to a sustained XAUUSD recovery.
On the morning of 29 September, gold was trading near a seven-week low. The spot price showed only a limited recovery after the sharp decline. The market is awaiting US data on consumer confidence, job openings, ADP, PCE, and employment, as these releases will shape expectations for the Fed's next rate decisions.
At the same time, the fundamental picture is not entirely negative for the metal. The conflict between the US and Iran keeps geopolitical risk elevated, while Brent has risen to around 107 USD.
Under normal conditions, this increases safe-haven demand for gold. However, the oil shock is also increasing inflation expectations and the likelihood of tighter Fed policy, making the impact of geopolitics contradictory. For the current session, this creates conditions for a technical corrective rebound after the large decline but does not yet confirm a full-fledged medium-term reversal.
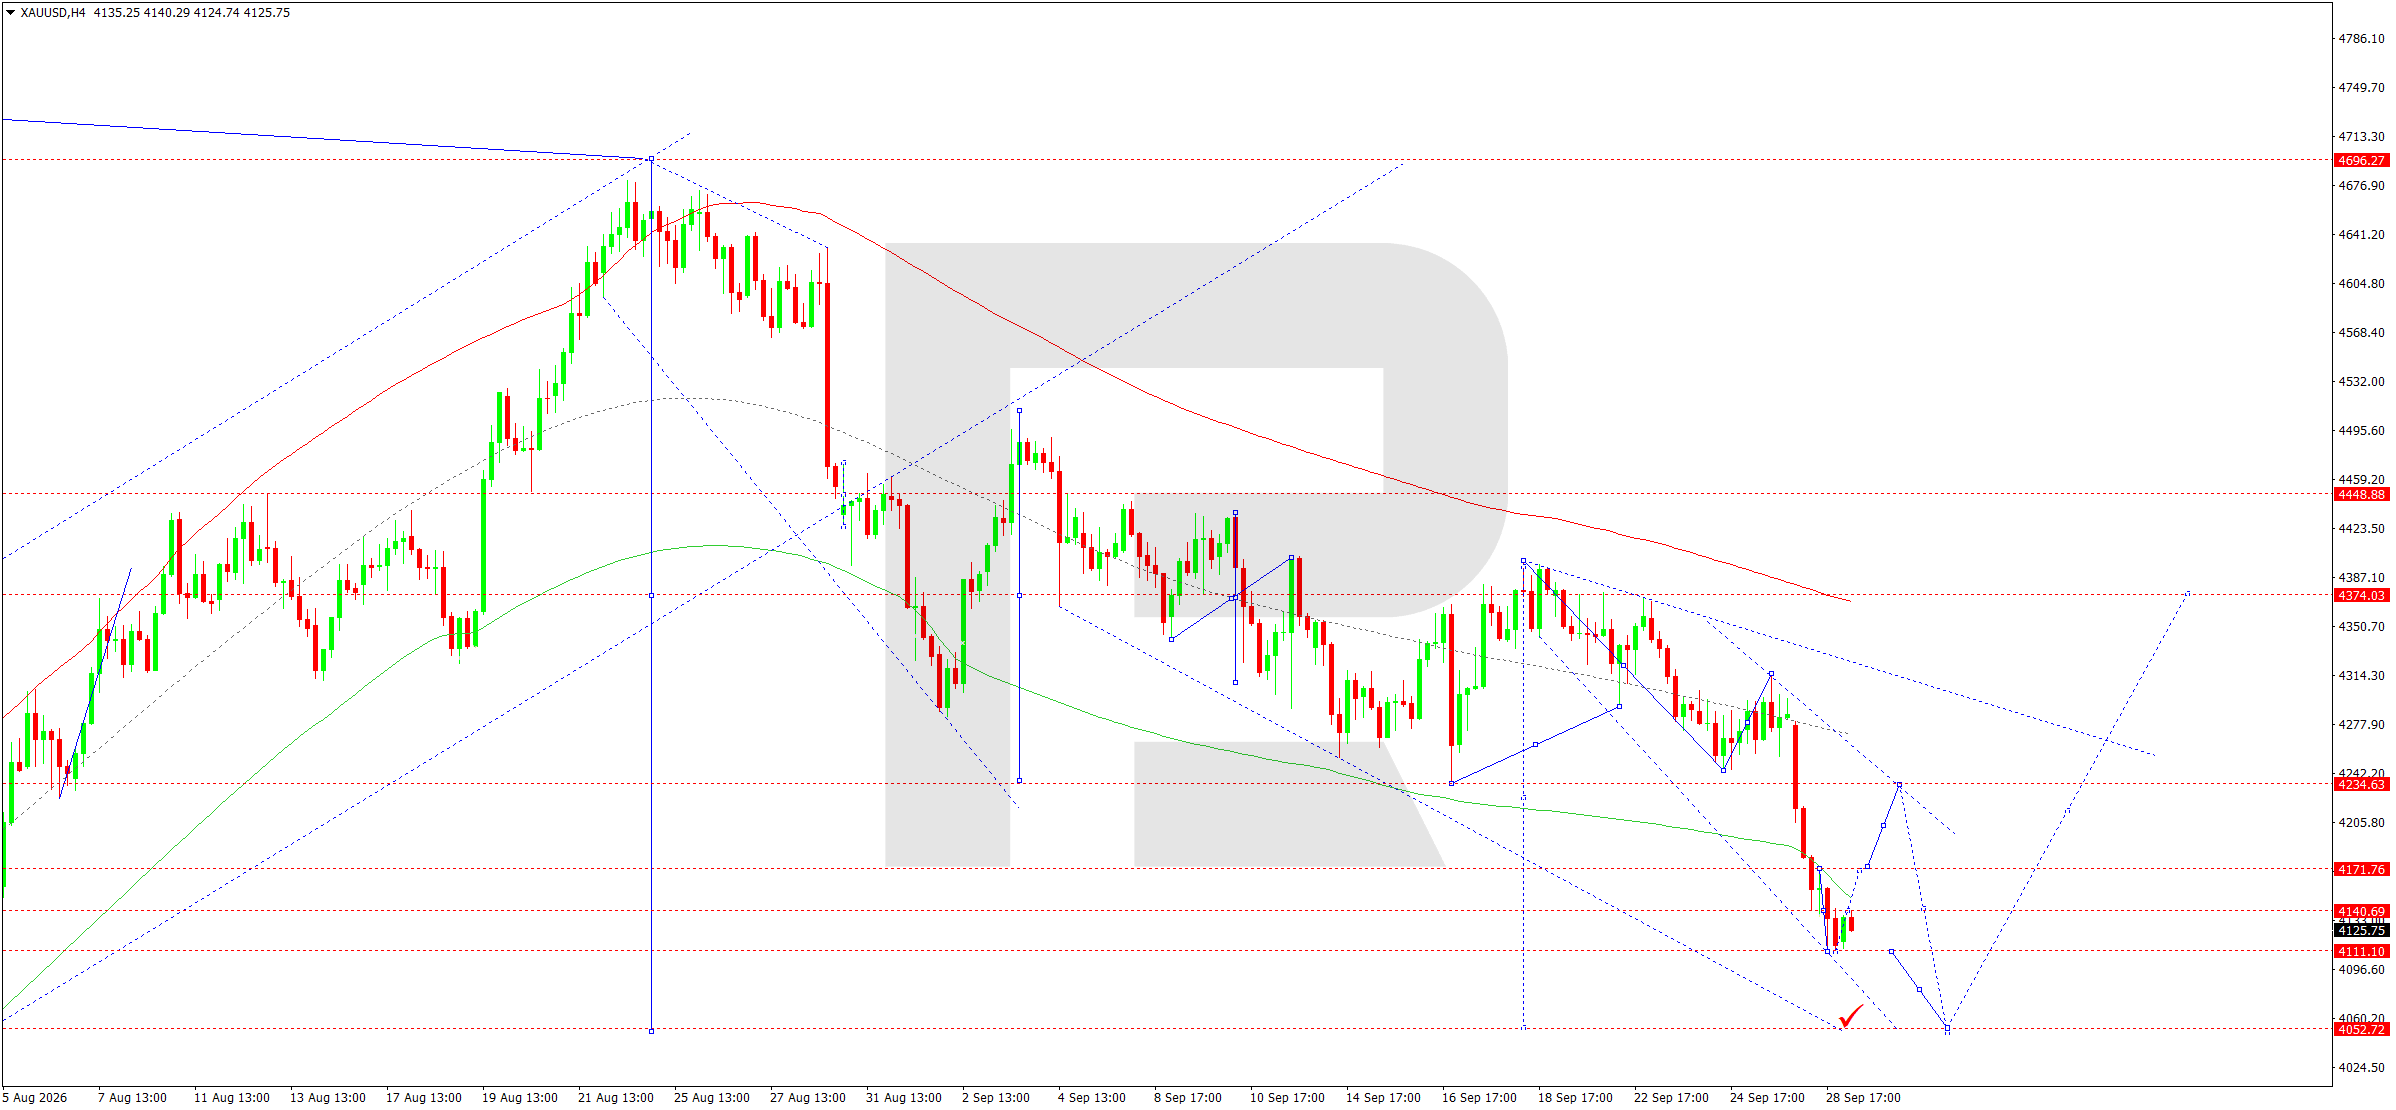
On the H4 chart, XAUUSD formed a strong downward wave from the 4,374 area, successively breaking 4,234 and 4,172. A low formed near 4,111, after which the first recovery impulse emerged.
The downward wave matrix with a pivot at 4,374 continues to indicate an overall bearish trend. However, directly from 4,111, the market gained a technical basis for a correction, with the first recovery target at 4,172. Consolidation above this level could extend the correction towards 4,234.
For now, such a move should be regarded as a retest of broken levels within a broader downward structure. Once the correction is complete, the prospect of another wave towards 4,053–4,052 remains. For today, the priority scenario is a corrective recovery from the low that has formed.
XAUUSD forecast scenario
Trading scenario: BUY
- Price at the time of writing: 4,145
- Entry price: 4,150
- Stop loss: 4,111
- Take profit: 4,232
- Risk-to-reward ratio: 1:2.10
The trade idea is valid until 8:00 AM on 30 September 2026 (server time, UTC+3).
US 500 forecast
For the US 500, the external backdrop at the start of trading on 29 September remains challenging. US equities ended the previous session lower amid a simultaneous rise in oil prices and government bond yields. The S&P 500 lost around 0.8%, while the Nasdaq fell by around 0.9%, as the market reassessed the outlook for interest rates and corporate financing costs.
The bond market is the main source of pressure. The yield on 10-year US Treasuries rose above 5.2%, approaching levels not seen for many years. The increase in yields reflects the resilience of the US economy, major investment in artificial intelligence infrastructure, and the inflationary impact of high energy prices. The Fed already raised the rate to 3.75–4.00% on 16 September, while the market continues to price in additional tightening.
At the same time, corporate fundamentals remain relatively resilient. The investment cycle linked to artificial intelligence supports capital expenditure and earnings growth at the largest technology companies. This limits the depth of the equity market correction but also makes the index sensitive to a further increase in the cost of capital. Geopolitics adds volatility: Brent near 107 USD intensifies inflationary pressure. Therefore, the fundamental balance for the current session looks less favourable for the broad US market, especially if yields continue to rise.
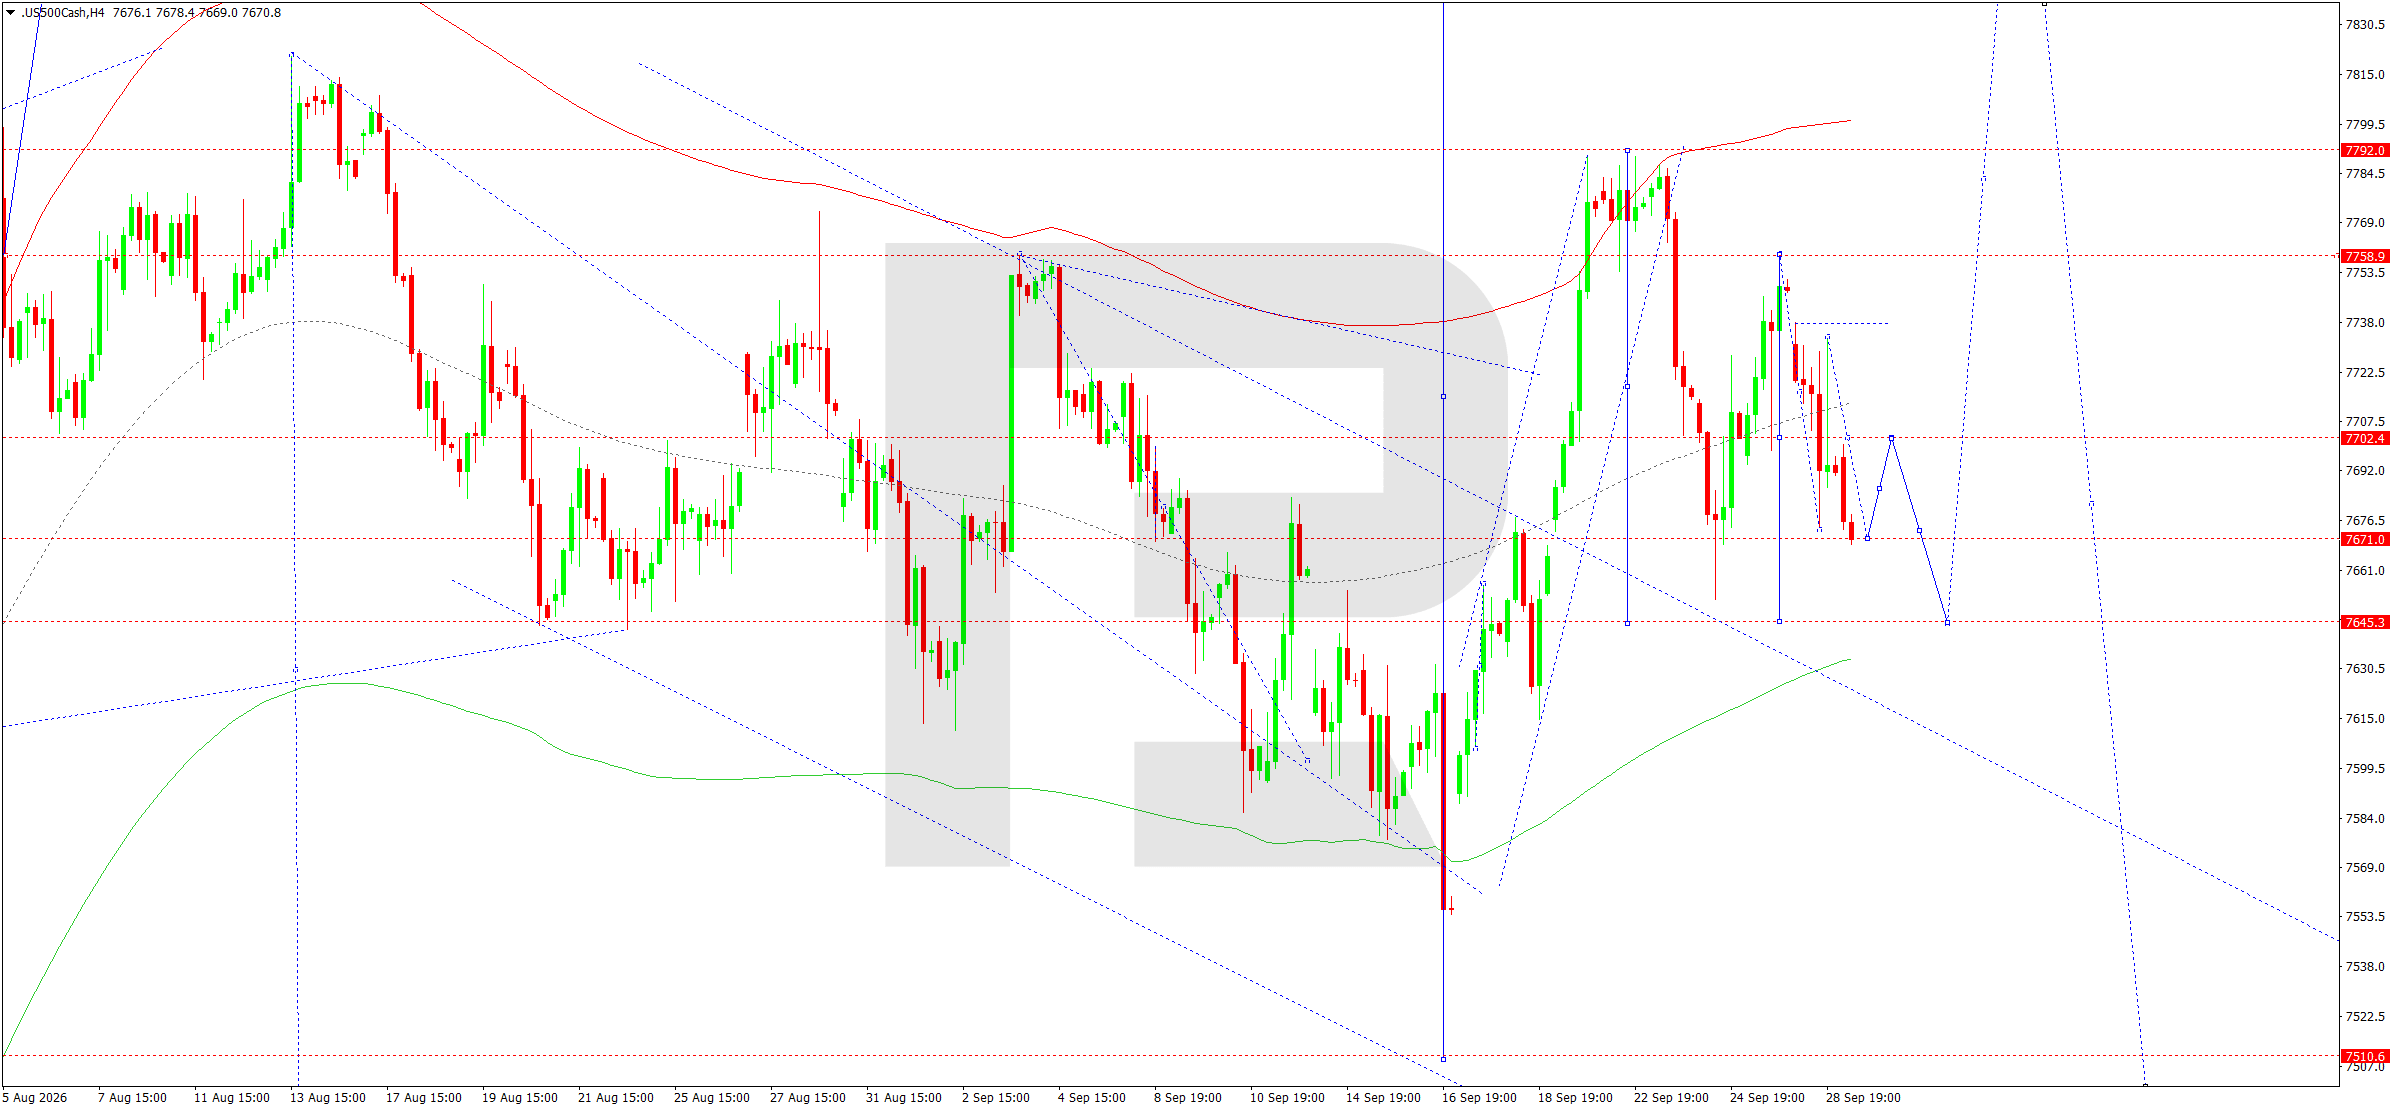
On the H4 chart, after rising towards 7,792, the US 500 reversed and moved into a correction. A subsequent recovery attempt stalled near 7,759, after which sellers pushed the price back towards 7,671.
The 7,702 area remains the key technical level. At the current stage, it is turning into resistance, and a likely retest from below could complete the corrective recovery. Following that, the primary target is 7,645.
The matrix structure and wave count suggest a further extension of the decline. A breakout below 7,645 would materially worsen the short-term structure and open the way towards deeper targets. For now, however, the main intraday scenario suggests a local return towards 7,702, followed by renewed selling pressure.
US 500 forecast scenario
Trading scenario: SELL
- Price at the time of writing: 7,685
- Entry price: 7,680
- Stop loss: 7,702
- Take profit: 7,645
- Risk-to-reward ratio: 1:1.59
The trade idea is valid until 8:00 AM on 30 September 2026 (server time, UTC+3).
BTCUSD forecast
The fundamental backdrop for BTCUSD on 29 September is primarily shaped by deteriorating global financial conditions. US government bond yields above 5% increase the appeal of interest-bearing assets while reducing investors' willingness to take risk. Following its September rate hike, the Federal Reserve maintains a hawkish stance as inflation remains elevated and the US economy continues to show resilience. For Bitcoin, this combination typically means greater sensitivity to movements in the dollar, liquidity, and the US technology sector.
Overall risk appetite has also deteriorated. US stock indices declined on 28 September amid rising oil prices and bond yields, with the Nasdaq coming under additional pressure as the market reassessed the cost of capital for the technology sector. High oil prices increase inflation risks and could prolong the period of tight monetary policy.
The cryptocurrency market's own factors also include the regulatory agenda. On 24 September, the Fed proposed new rules for issuers of US dollar stablecoins. In addition, a recent major security incident at one cryptocurrency platform once again reminded the market of the sector's infrastructure risks.
The fundamental environment therefore remains mixed: long-term interest in digital assets persists, but in the short term, the high cost of money and weaker global risk appetite create conditions for elevated volatility and a retest of support levels.
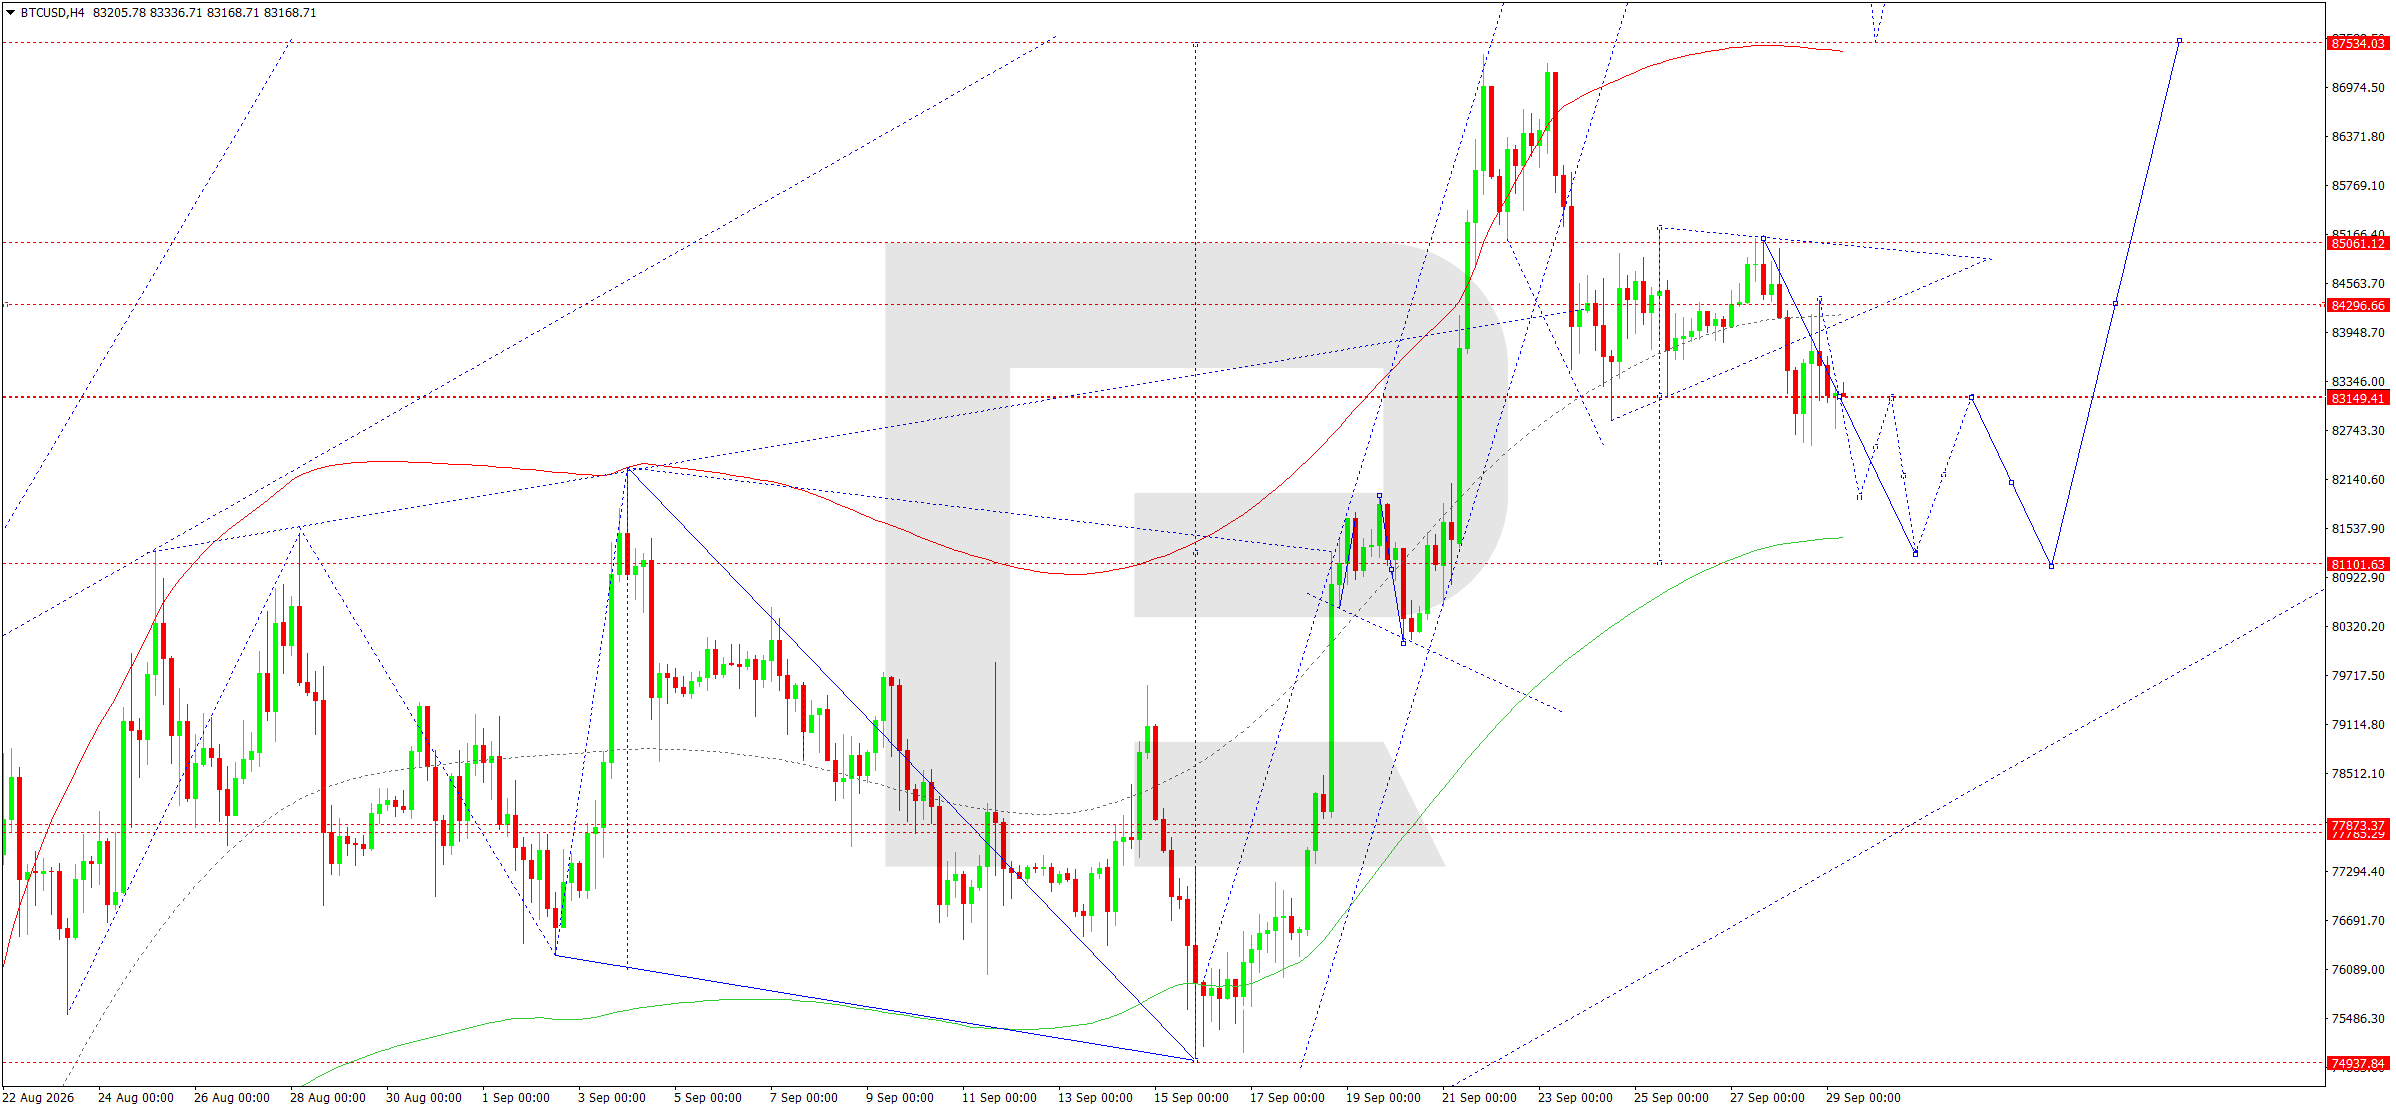
On the H4 chart, BTCUSD moved into a corrective phase after an impulse towards the 87,534 area. The price successively lost 85,061 and 84,297 and approached the 83,149 support area. The wave structure allows for a local recovery towards 84,060–84,297, although this does not yet change the corrective picture.
The key matrix level is around 81,101. The next full downward move may be directed towards this area after the local rebound is complete. This is a crucial technical support area and a potential zone for forming a pivot.
Therefore, for 29 September, the preferred scenario remains selling after a corrective recovery. A breakout below 83,149 would strengthen the move towards 81,101. If the 81,101 level holds and a reversal structure emerges, a new upward wave could form at the next stage, with the prospect of a return towards 85,061 and then 87,534.
BTCUSD forecast scenario
Trading scenario: SELL
- Price at the time of writing: 83,941
- Entry price: 83,936
- Stop loss: 85,061
- Take profit: 81,101
- Risk-to-reward ratio: 1:2.52
The trade idea is valid until 8:00 AM on 30 September 2026 (server time, UTC+3).
Editors’ picks
 EURUSD forecast 2026–2027: technical analysis, price levels & predictions
The EURUSD outlook for 2026 and 2027: key levels on the daily chart, three trading scenarios and the policy gap between the Fed and the ECB that drives the pair.
 Gold (XAUUSD) forecast 2026: technical analysis, price levels & predictions
Where gold could trade in 2026: key levels, three trading scenarios with entry triggers and the forecasts from J.P. Morgan, Deutsche Bank and Goldman Sachs.
Forecasts presented in this section only reflect the author’s private opinion and should not be considered as guidance for trading. RoboForex bears no responsibility for trading results based on trading recommendations described in these analytical reviews.