
Daily technical analysis and forecast for 30 September 2026
Daily technical analysis and forecast for EURUSD, USDJPY, GBPUSD, AUDUSD, USDCAD, XAUUSD, US 500, and BTCUSD for 30 September 2026.
Each scenario on this page reflects the market structure on the H4 chart as of 10:00 UTC+3 on 30 September 2026. The assessment considers the current H4 chart structure, key support and resistance levels, the direction of the medium-term movement, and the prevailing fundamental backdrop.
EURUSD forecast
The key fundamental factor for EURUSD remains the high yield on US government bonds and changing expectations regarding further action by the US Federal Reserve. Following the September rate increase, the market continues to assess the likelihood of additional policy tightening. At the same time, comments from Fed officials have somewhat reduced expectations of an immediate rate increase in October: the yield on 2-year US Treasuries has retreated to around 4.88%, while the 10-year yield has eased to around 5.23%, although these levels remain exceptionally high.
For the euro, this combination of factors remains predominantly unfavourable. High yields in the US debt market support demand for the dollar and keep EURUSD under pressure. Expectations around US inflation data, especially the PCE price index, are also important today.
Stronger figures could revive expectations of further Fed tightening, while an easing in inflationary pressure could trigger a correction in the dollar. Against this backdrop, the European Central Bank remains the second component of the interest rate differential. For EURUSD, the short-term reaction to US yields currently appears more significant than European factors.
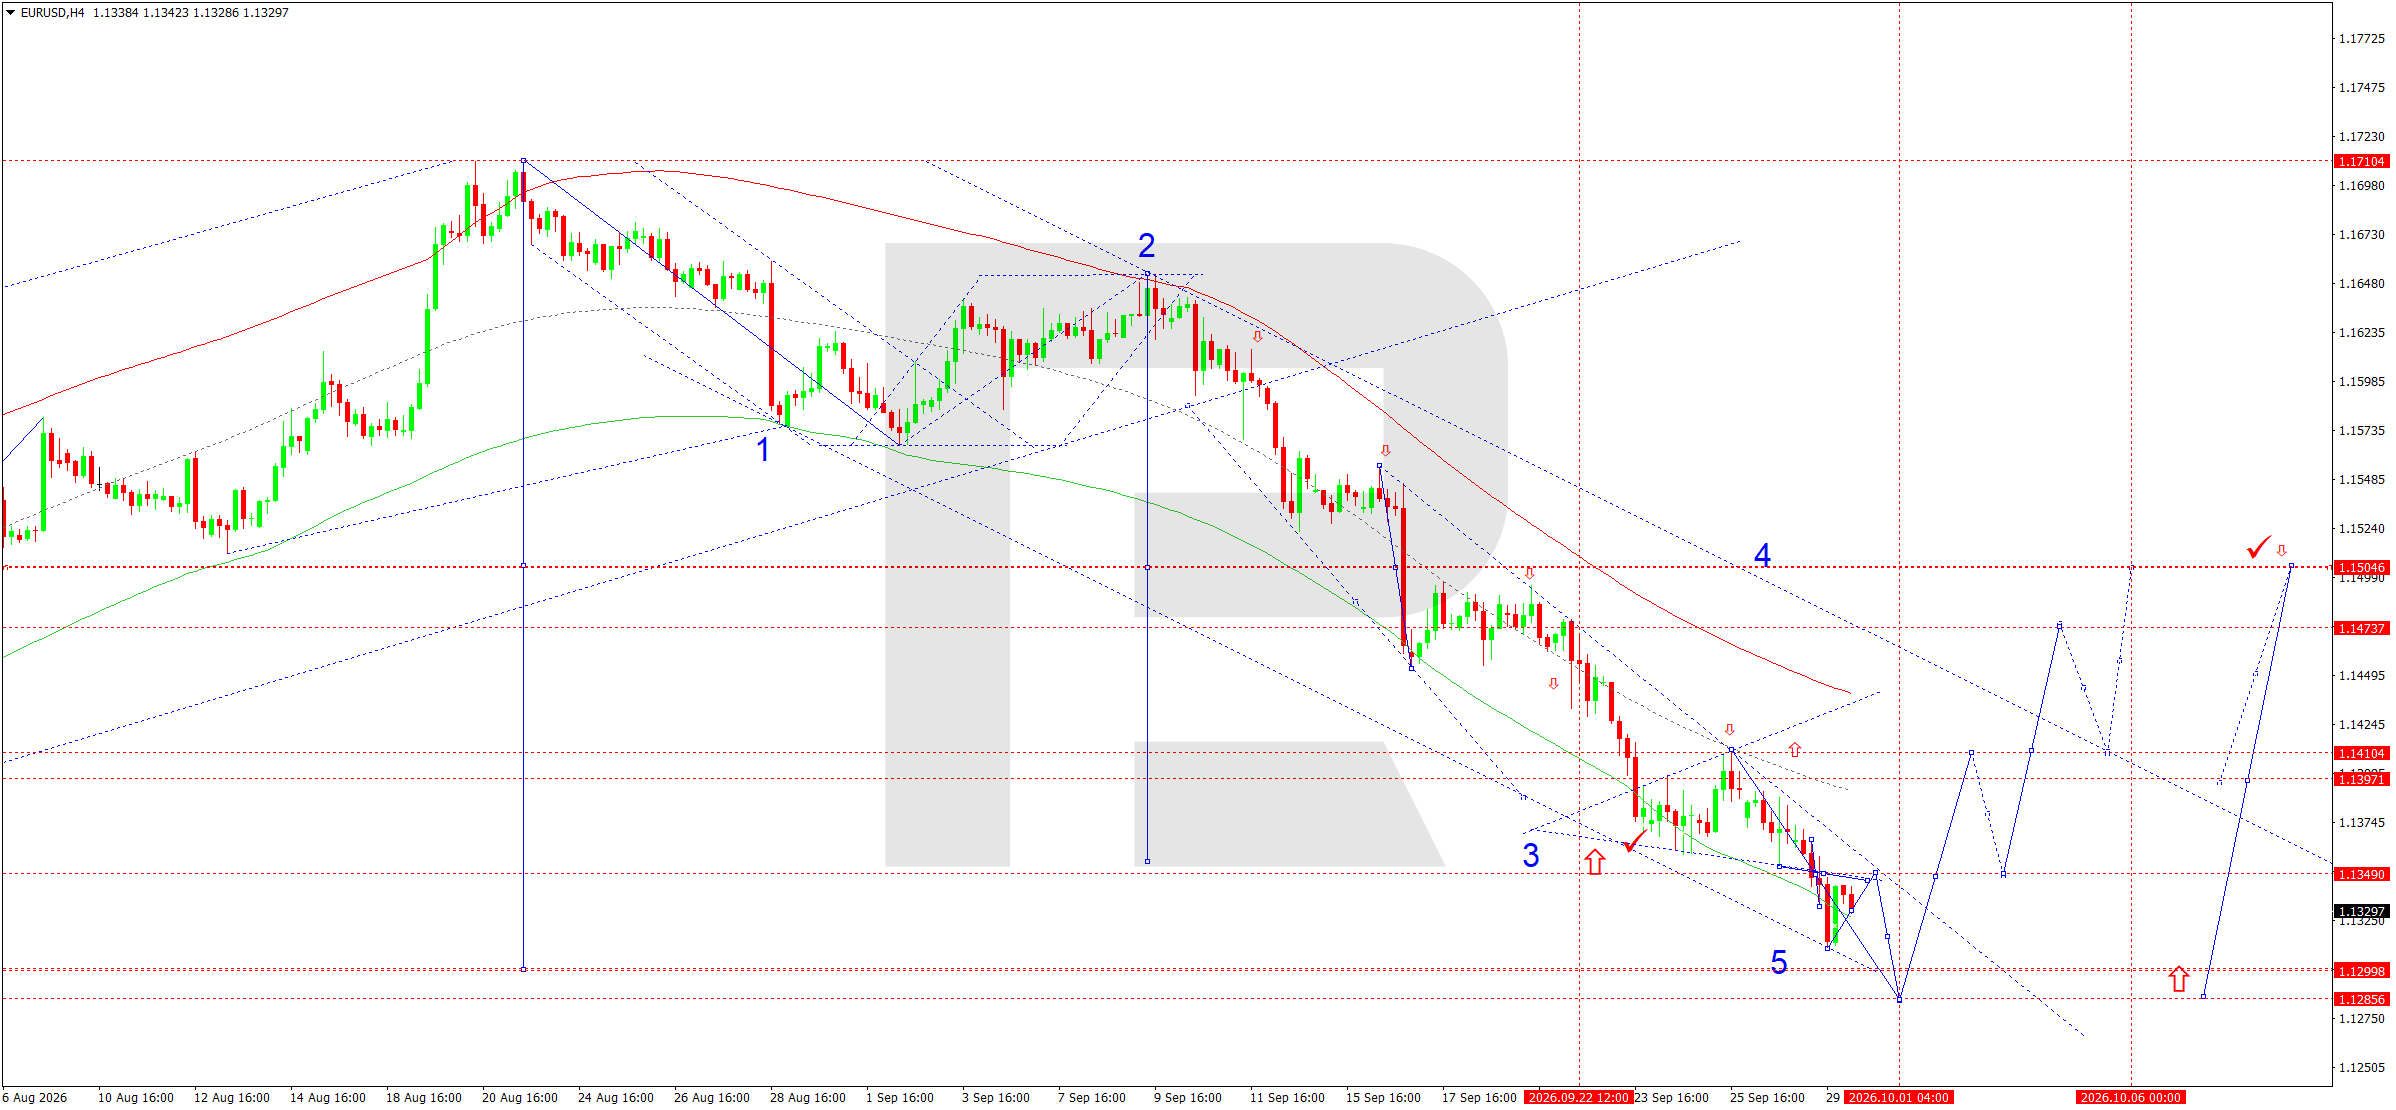
On the H4 chart, EURUSD formed a downward wave towards 1.1311, followed by a correction towards 1.1342. The structure remains bearish: the price is below the main dynamic resistance levels, while the sequence of local highs and lows confirms that sellers remain in control.
Today, a continued decline towards 1.1299 remains relevant. A breakout below this level would open the way towards 1.1285, which is viewed as the main near-term target. The Elliott Wave structure corresponds to the completion of the fifth downward wave. The wave matrix with a pivot at 1.1505 retains a pronounced negative slope. The market previously broke below 1.1349 and reached the lower area of the Price Envelope. The current rise towards 1.1342 is viewed primarily as a retest from below rather than the start of a sustained reversal.
While the price remains below 1.1355–1.1410, the base case remains a continued decline. A return above 1.1410 would weaken this scenario and create conditions for a deeper correction.
EURUSD forecast scenario
Trading scenario: SELL
- Price at the time of writing: 1.1355
- Entry price: 1.1350
- Stop loss: 1.1381
- Take profit: 1.1306
- Risk-to-reward ratio: 1:1.42
The trade idea is valid until 8:00 AM on 1 October 2026 (server time, UTC+3).
USDJPY forecast
For USDJPY, the main fundamental driver remains the combination of high US bond yields, US Federal Reserve policy, and changing expectations around Japanese currency policy. US yields eased somewhat after their sharp rise: the 10-year yield is trading around 5.23%, although the level itself remains high and continues to support the dollar through the interest-rate differential. At the same time, comments from Fed officials reduced the probability of an immediate additional rate increase in October, limiting the potential for further dollar strength.
For the yen, the Bank of Japan and the ongoing normalisation of monetary policy remain important factors. The Japanese currency is also receiving additional support from heightened market attention to the possibility of currency intervention. Against a backdrop of low liquidity, market participants are particularly sensitive to comments from Japanese authorities about excessive currency moves. On 30 September, the yen had already received support from speculation over possible official intervention, while the Japanese 10-year yield held around 3.09%.
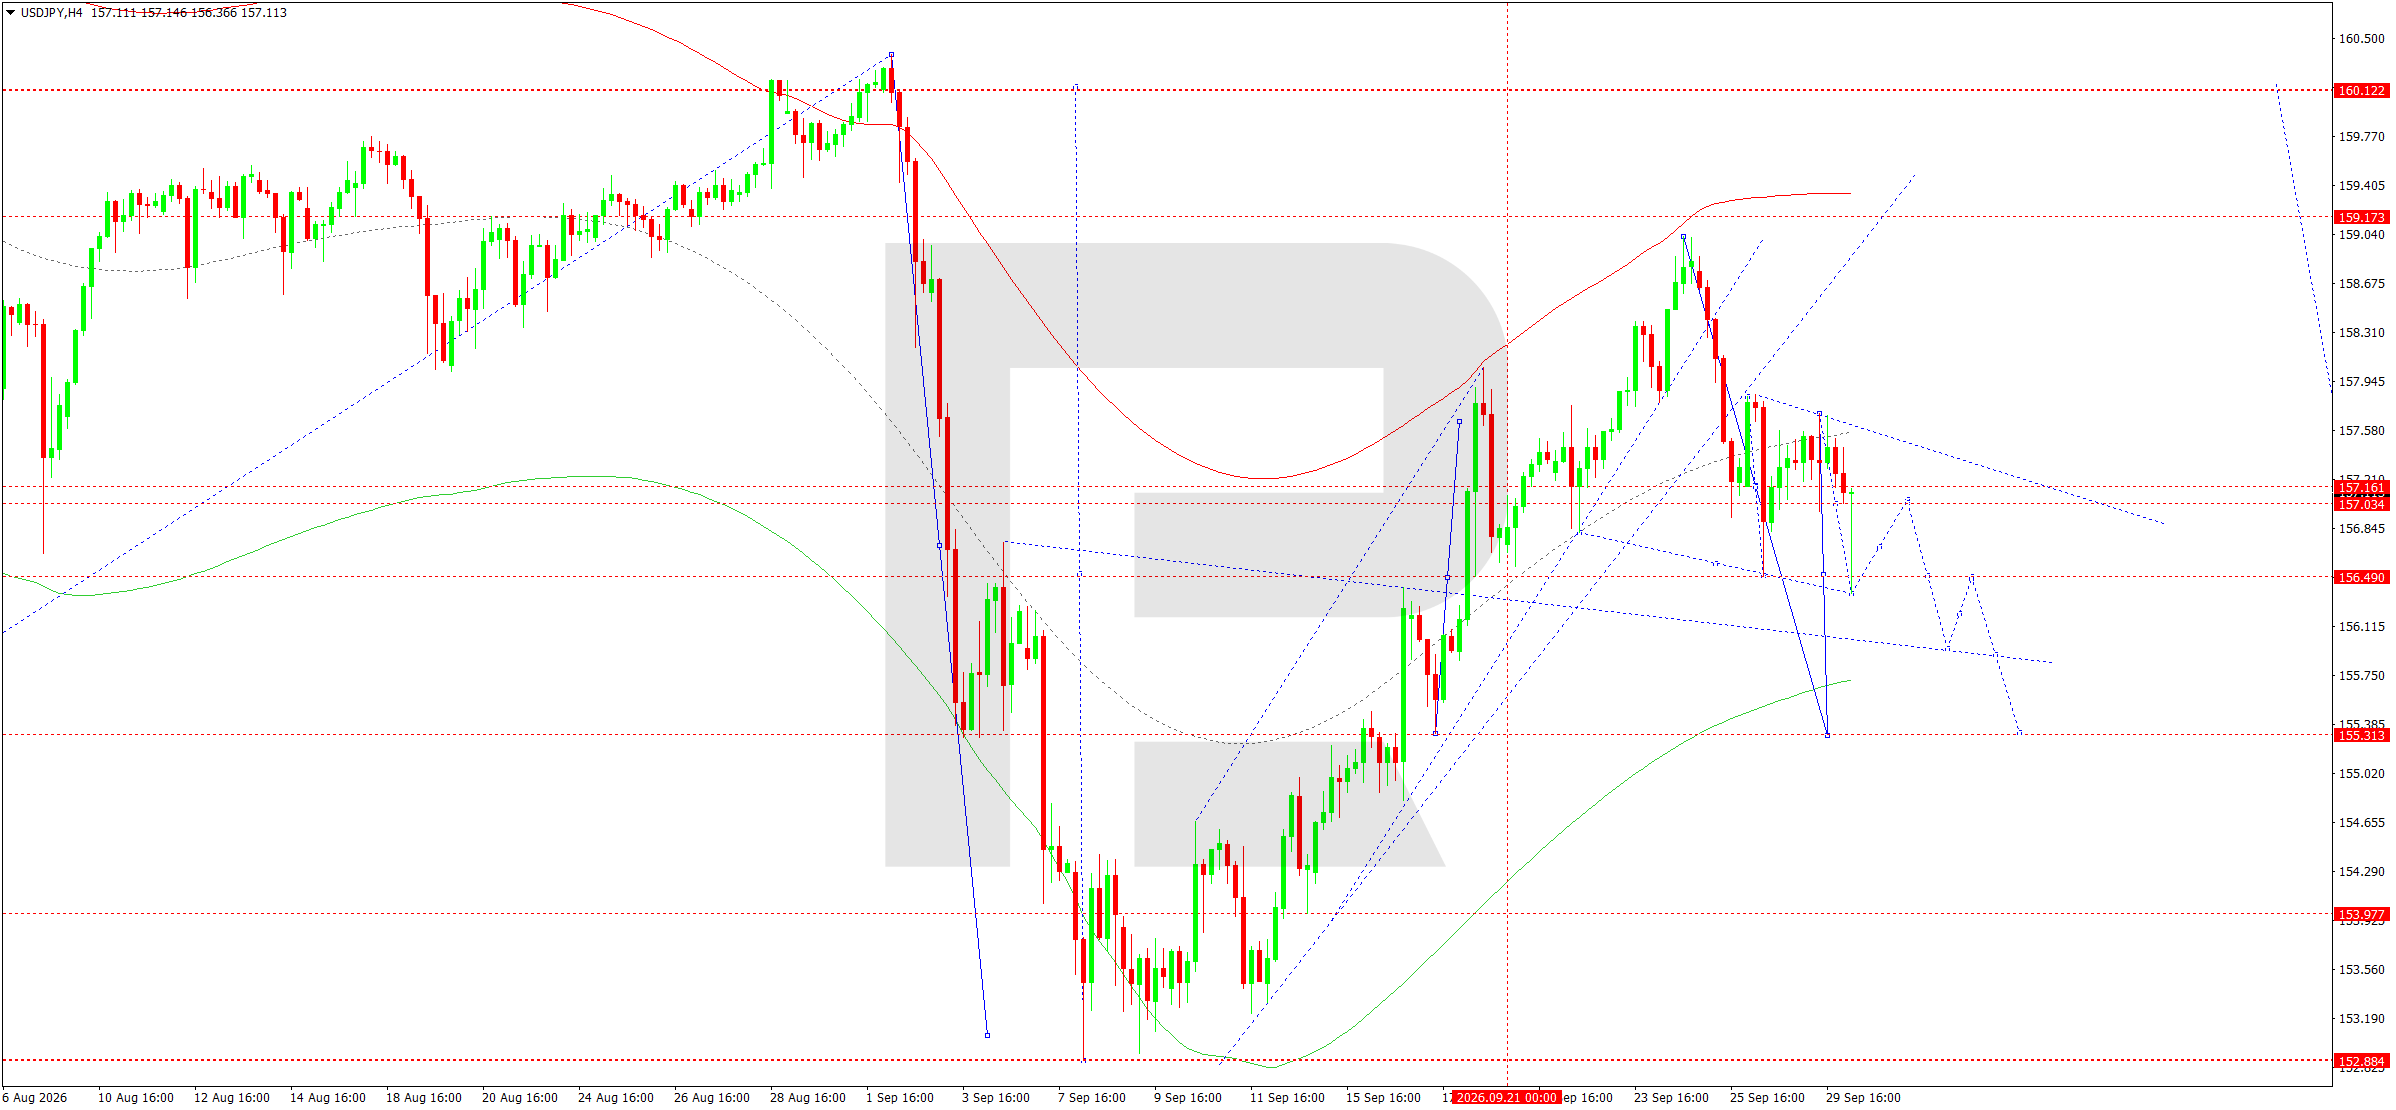
On the H4 chart, USDJPY broke below the 157.16 support level and formed downward momentum towards 156.36. After reaching this level, the market entered a local consolidation phase. A corrective breakout to the upside could return the price towards 157.16–157.22, although this area also acts as important resistance.
The structure of the downward wave matrix with a pivot at 157.16 confirms the priority of the bearish scenario. The central line of the Price Envelope also runs through the 157.16 area, so a return to it is viewed as a technical retest of broken support from below. While the market remains below this zone, downside potential remains intact.
The main target of the next downward wave is 156.49. A breakout below it would open the way towards 155.33.
The 155.33 level corresponds to the lower area of the current Envelope structure and to the key support marked on the chart. A return above 157.22 would temporarily postpone this scenario and create room for a correction towards 157.60–157.95, although the H4 structure remains directed downwards for now.
USDJPY forecast scenario
Trading scenario: SELL
- Price at the time of writing: 156.85
- Entry price: 156.80
- Stop loss: 157.22
- Take profit: 155.33
- Risk-to-reward ratio: 1:3.50
The trade idea is valid until 8:00 AM on 1 October 2026 (server time, UTC+3).
GBPUSD forecast
The fundamental backdrop for GBPUSD is primarily determined by the changing interest rate differential between the UK and the US. High US Treasury yields continue to support the dollar despite some easing in expectations of an immediate rate increase by the US Federal Reserve. Following the sharp rise in US yields, the 10-year yield remains above 5.2%, increasing the appeal of dollar assets and putting pressure on European currencies.
For sterling, the focus remains on Bank of England policy, which must balance inflation risks against the state of the UK economy. Expensive energy is an additional external factor. Higher oil prices increase inflation risks for European economies while at the same time worsening expectations for consumer demand and economic activity.
For GBPUSD, this creates a mixed fundamental combination, although the dollar currently receives more direct support from the US bond market. US inflation data will be important today: stronger price readings could provide the dollar with additional support.
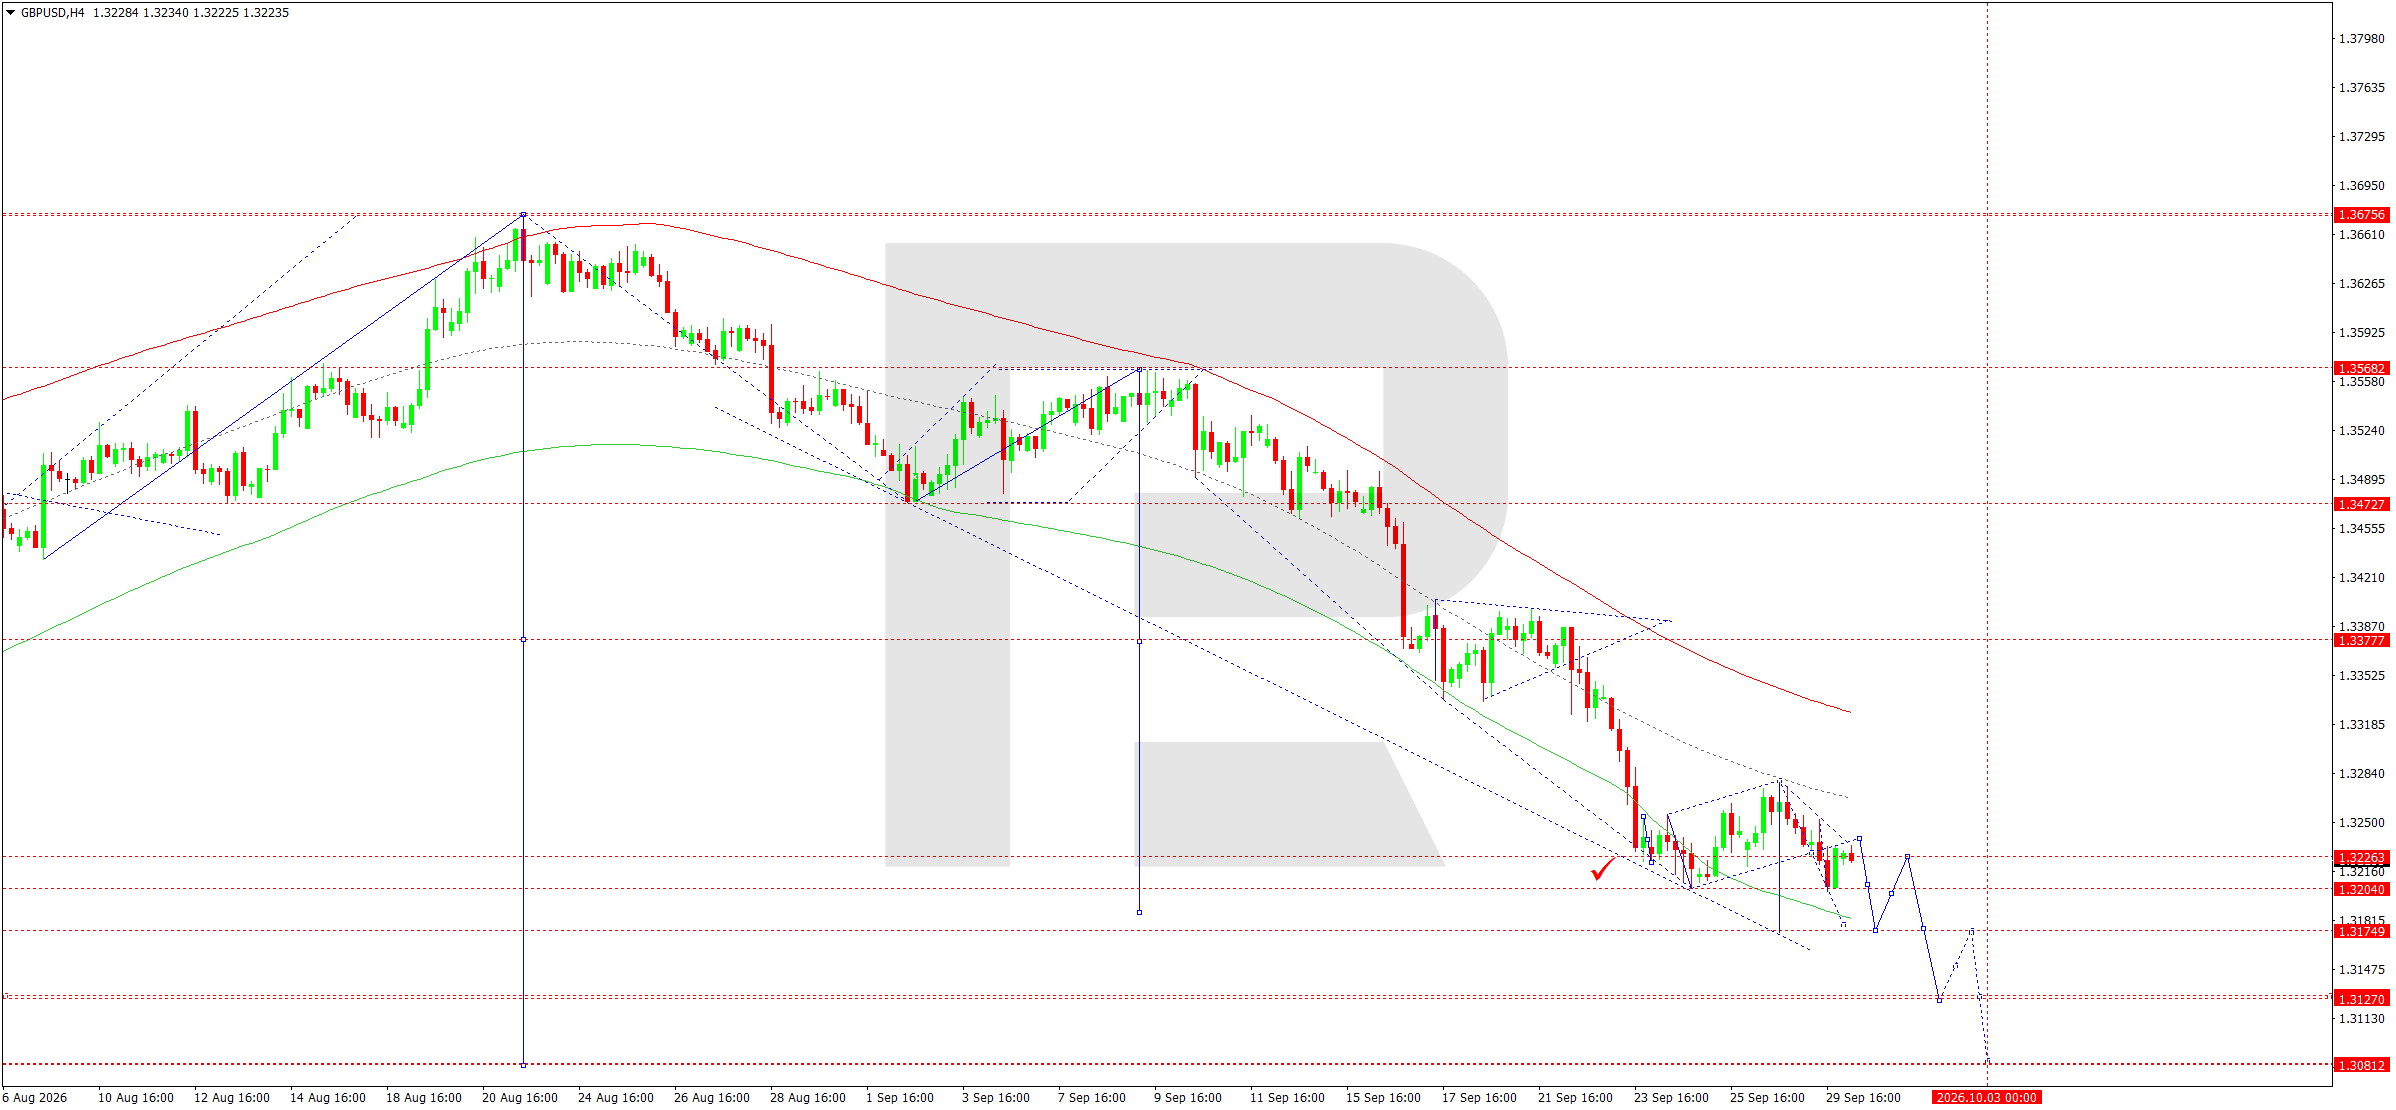
On the H4 chart, GBPUSD remains in a stable downtrend. After forming a local low, the market completed a corrective wave towards 1.3234, although the recovery is developing within the broader downward structure and has not yet shown signs of a full reversal.
The downward wave matrix with a pivot at 1.3377 confirms that sellers retain the advantage. The price is significantly below the pivot, while the dynamic Envelope lines have a negative slope. The current consolidation around 1.3226–1.3234 looks like an intermediate correction before the main move resumes.
For 30 September, a decline towards 1.3205 remains relevant. A breakout below this support could open the way towards 1.3175, corresponding to the lower area of the Price Envelope. The next target is 1.3120. The chart also highlights deeper support at 1.3081, but a test of this level would become relevant only after a firm consolidation below 1.3120.
The nearest resistance is in the 1.3250–1.3280 area. While the price remains below it, selling remains the priority. A return above 1.3280 would be the first signal that the downward momentum is weakening.
GBPUSD forecast scenario
Trading scenario: SELL
- Price at the time of writing: 1.3255
- Entry price: 1.3250
- Stop loss: 1.3285
- Take profit: 1.3175
- Risk-to-reward ratio: 1:2.14
The trade idea is valid until 8:00 AM on 1 October 2026 (server time, UTC+3).
AUDUSD forecast
For AUDUSD, the fundamental picture is shaped by the confrontation between Australia's tight monetary policy and the US dollar's continuing advantage due to high US Treasury yields. The Reserve Bank of Australia remains the key domestic factor for the Australian currency. The market continues to price in elevated interest rates and the need to contain inflationary pressure, which in theory supports the AUD. However, the effect of monetary policy is partly offset by a stronger dollar and broader caution among global market participants.
On the US side of the pair, support comes from Federal Reserve policy. Following the September rate increase, US yields rose sharply, although they eased somewhat on 30 September after softer comments from Fed officials. The 10-year yield remains above 5.2%, so financial conditions remain tight.
Global risk appetite is also important for the Australian dollar. High oil prices, geopolitical uncertainty, and volatility in the bond market limit demand for risk-sensitive currencies. Therefore, even with the RBA maintaining a relatively tight stance, the AUDUSD recovery may remain limited.
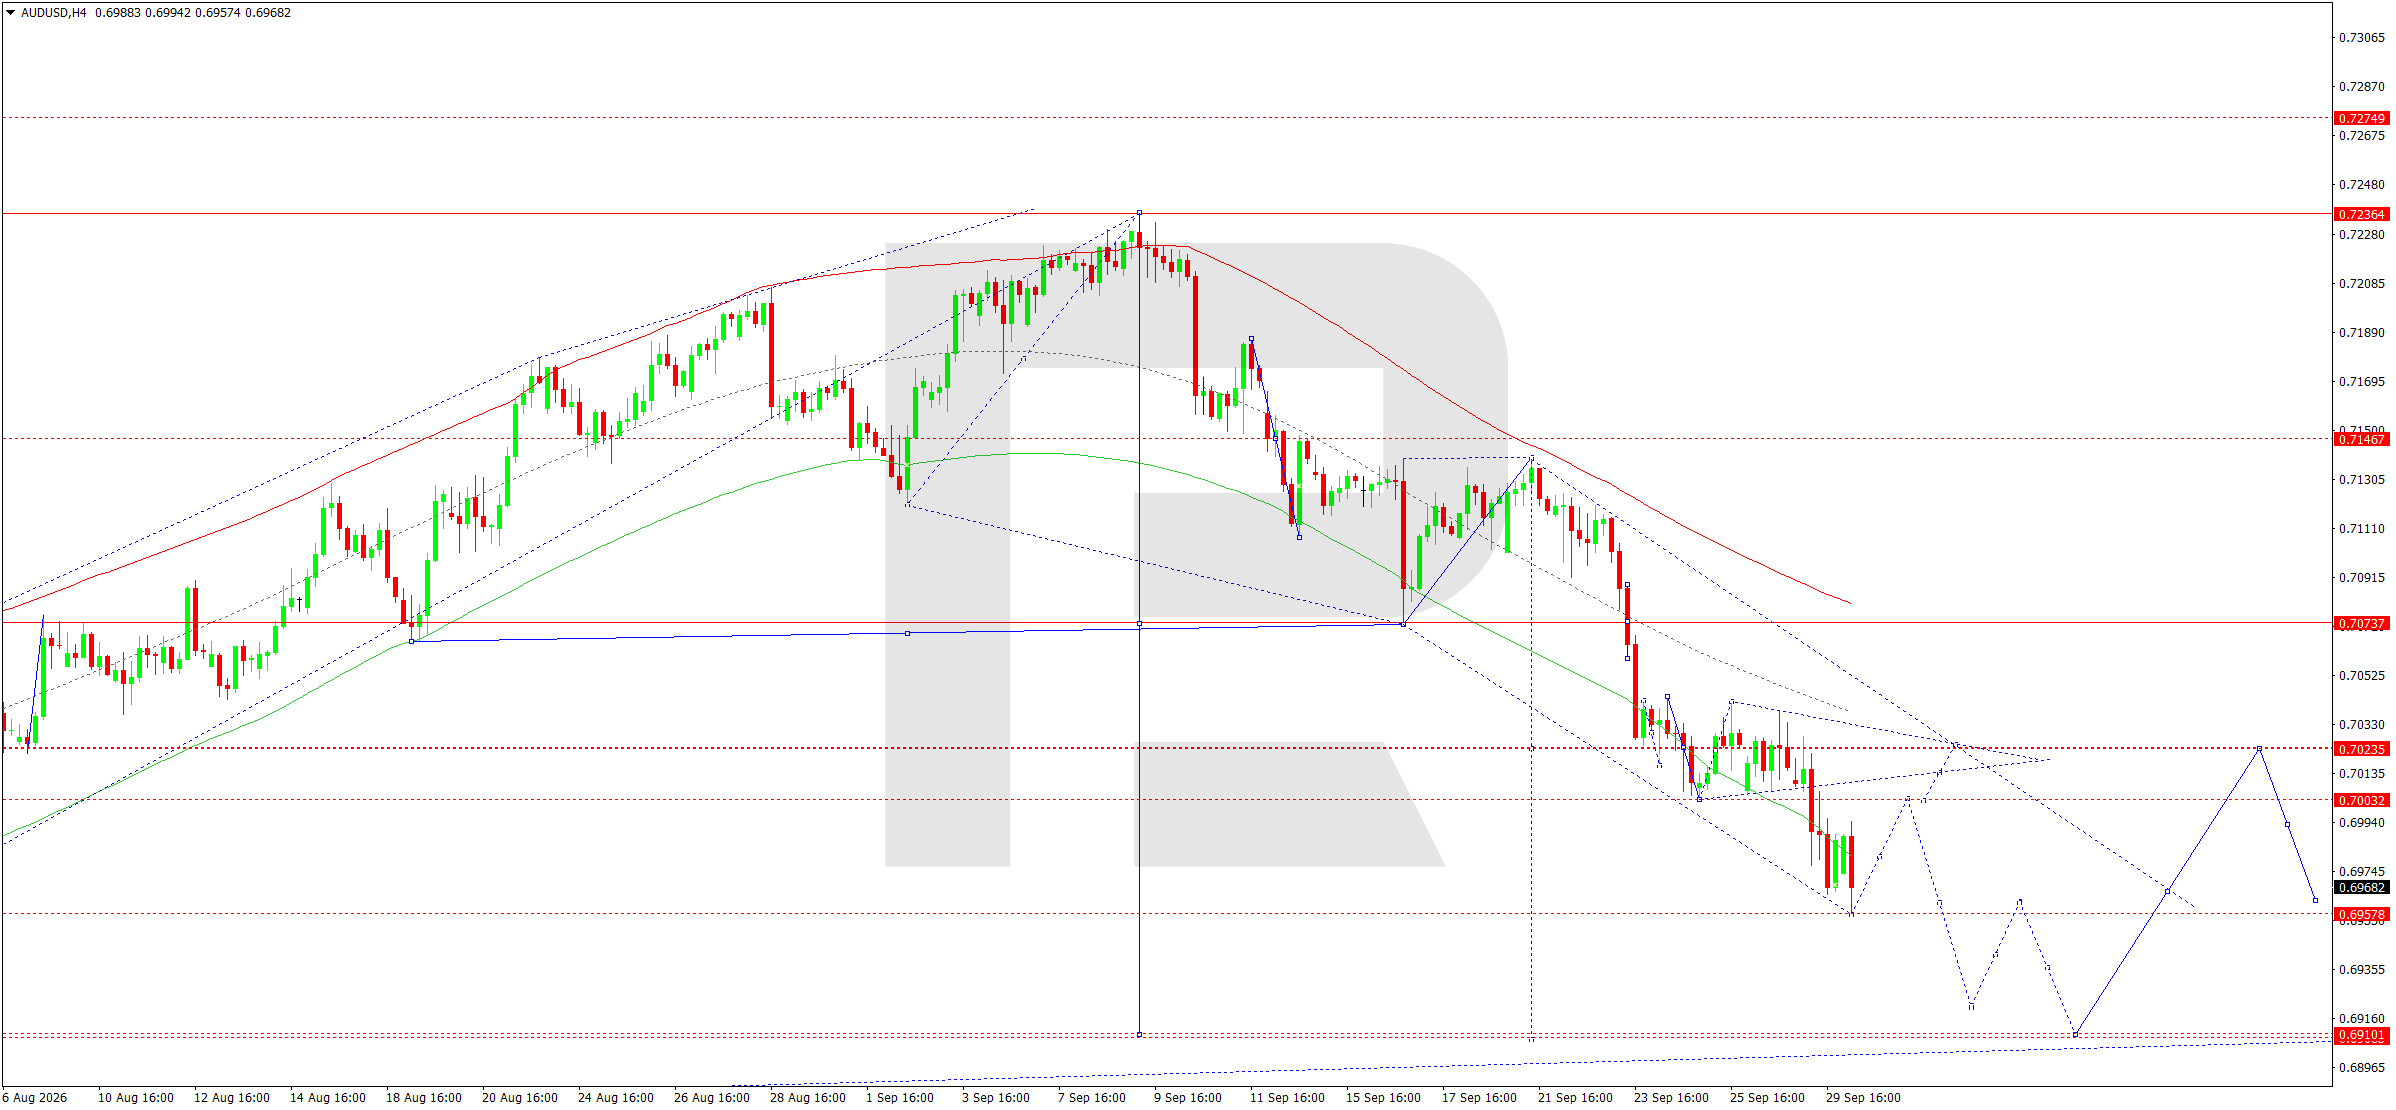
On the H4 chart, AUDUSD continues to develop a stable downward move. After breaking 0.7074, the price successively moved through the 0.7023 and 0.7003 areas and reached 0.6958. The descending channel remains intact, while the price is below the main dynamic lines.
For 30 September, after reaching 0.6958, a corrective move towards 0.7000 is possible. This area is close to the previously broken support at 0.7003 and could therefore act as resistance on a retest from below.
The downward wave matrix with a pivot at 0.7023 confirms the priority of the bearish scenario. Once the correction is complete, a renewed decline towards 0.6958, then 0.6946 and 0.6911, becomes likely. Thus, the 0.6946 target stated in the original version is technically corrected to 0.6910, as this area corresponds to the scale of the chart and the current price structure.
Consolidation above 0.7023 would weaken the bearish scenario, but for now the move is regarded as a continuation of the prevailing downtrend.
AUDUSD forecast scenario
Trading scenario: SELL
- Price at the time of writing: 0.6975
- Entry price: 0.6970
- Stop loss: 0.7003
- Take profit: 0.6911
- Risk-to-reward ratio: 1:1.79
The trade idea is valid until 8:00 AM on 1 October 2026 (server time, UTC+3).
USDCAD forecast
The fundamental picture for USDCAD continues to favour elevated volatility. The US dollar is supported by high Treasury yields and the aftermath of the September decision by the US Federal Reserve. Although comments from Fed officials reduced expectations of an immediate rate increase in October, the 10-year yield remains around 5.2% and the 2-year yield around 4.9%. This continues to provide the dollar with a notable interest-rate advantage.
For the Canadian dollar, the key factors are Bank of Canada policy, the state of the domestic economy, and the oil market. High oil prices usually support the Canadian dollar by improving the terms of trade, although the current rise in oil is also linked to geopolitical risks and inflationary pressure. Oil remains expensive globally: according to some market sources, Brent traded above 100 USD during the Asian part of the session on 30 September.
As a result, the fundamental balance remains mixed: expensive oil supports CAD, while US yields support USD. This makes technical levels particularly important.
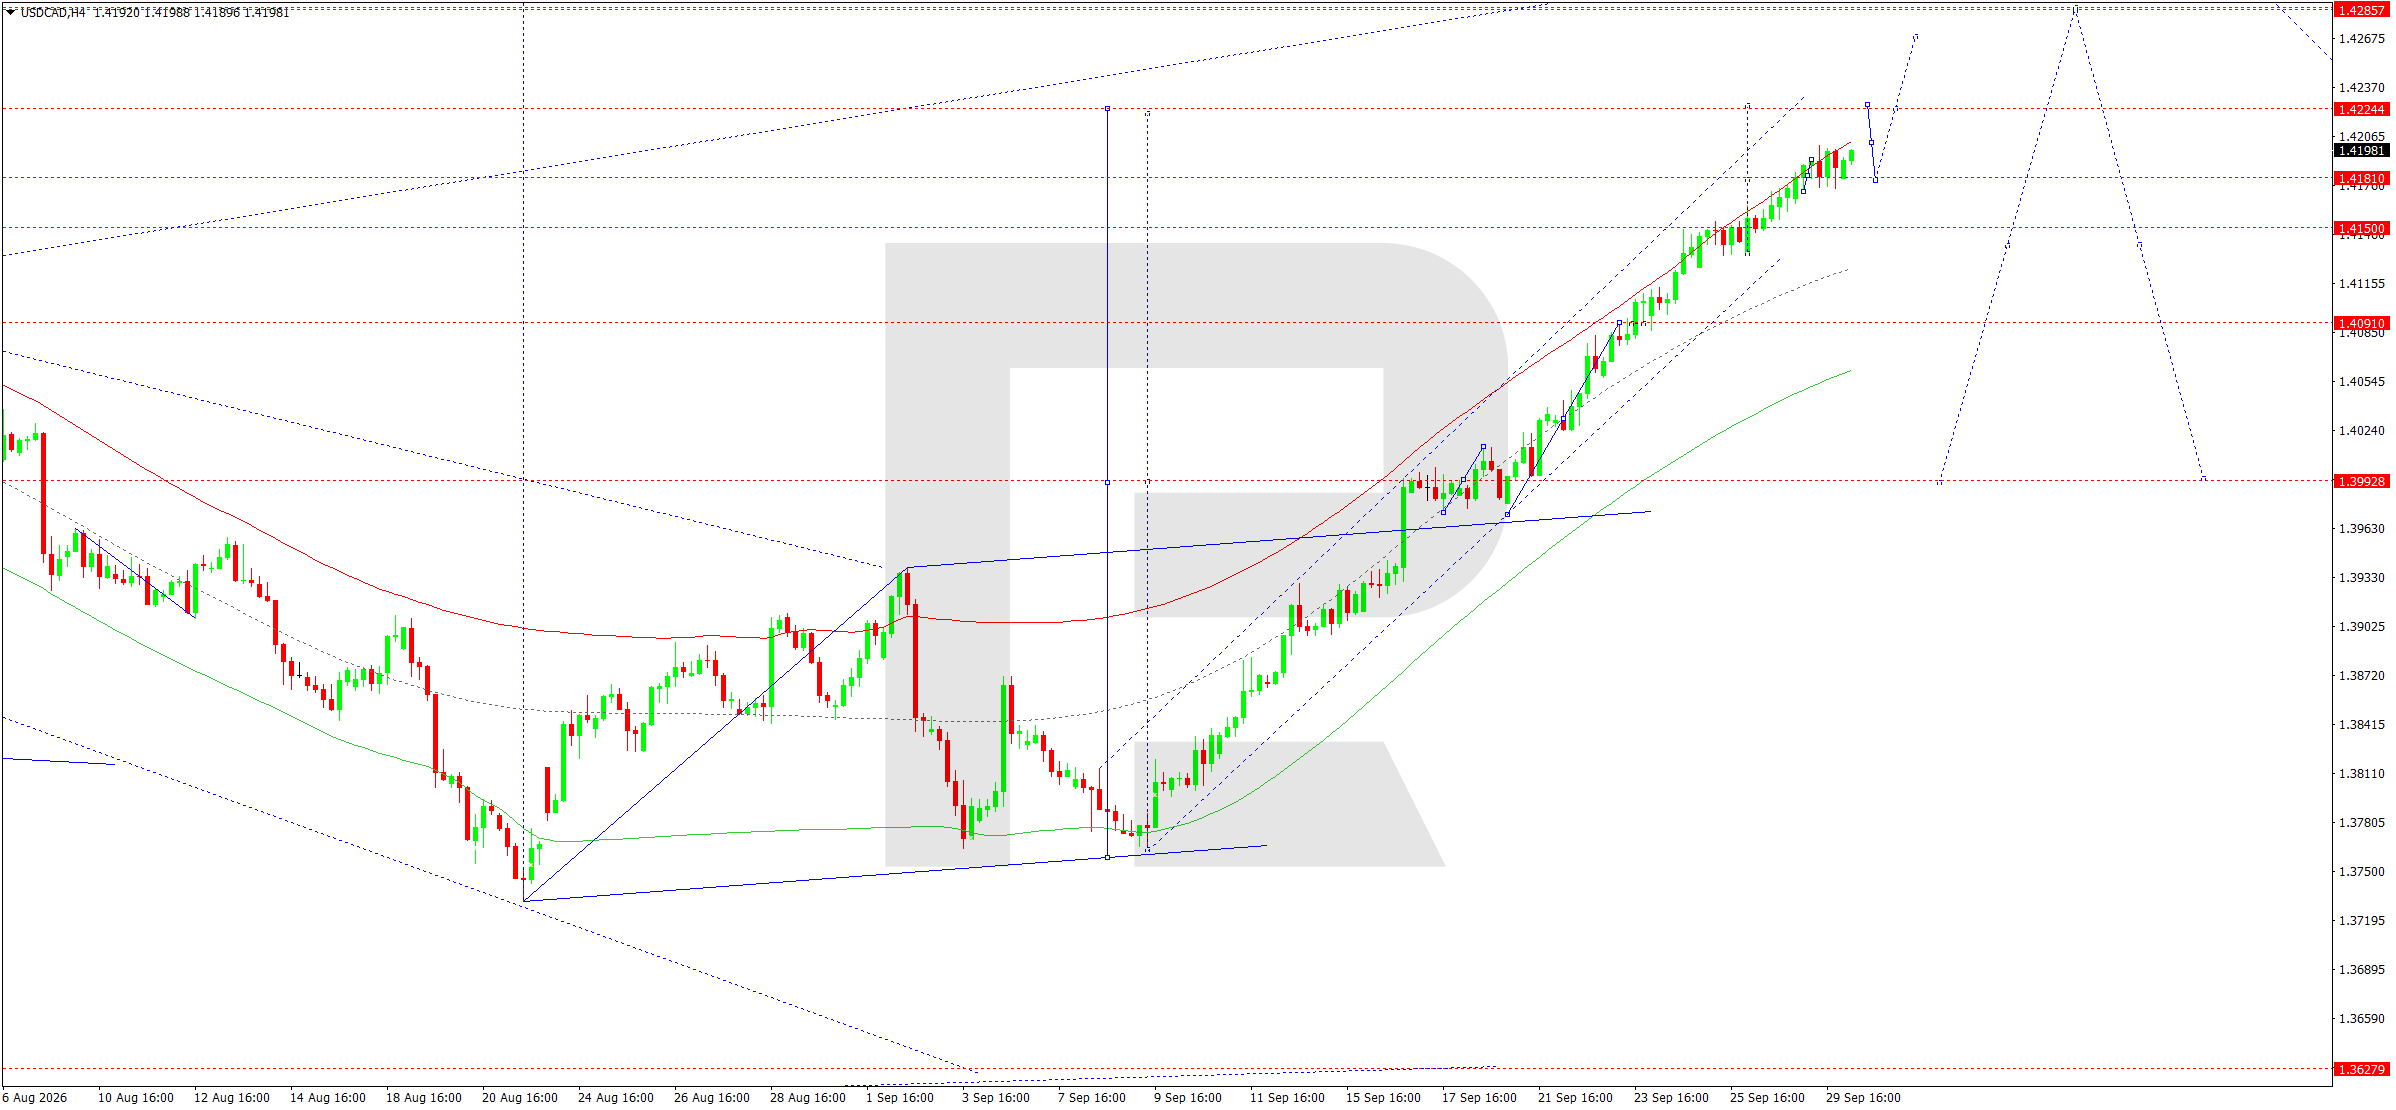
On the H4 chart, USDCAD retains a pronounced upward structure. After reversing from the 1.3780 area, the market successively formed a series of higher lows and higher highs and reached the 1.4200 area. The price remains within an ascending channel, while the dynamic averages point upwards.
A compact consolidation is forming around 1.4200. The upward wave matrix with a pivot at 1.3929 continues to confirm the buyers' advantage in the medium-term structure. If support at 1.4171–1.4181 holds, another impulse towards 1.4222 is possible. A breakout above 1.4222 could extend the wave towards 1.4286.
However, at the current stage, the price is near the upper boundary of the structure, so a correction is likely before growth resumes. A breakout below 1.4171 would signal a move towards 1.4150 and could then open the way towards 1.4091. Since the price is directly below the 1.4222 resistance level, the daily scenario should first account for a corrective move.
USDCAD forecast scenario
Trading scenario: SELL
- Price at the time of writing: 1.4176
- Entry price: 1.4171
- Stop loss: 1.4222
- Take profit: 1.4091
- Risk-to-reward ratio: 1:1.57
The trade idea is valid until 8:00 AM on 1 October 2026 (server time, UTC+3).
XAUUSD forecast
Gold ends September under significant pressure. The main factor remains the combination of a strong dollar, high US government bond yields, and expectations around further US Federal Reserve policy. Following the September rate hike, the market continues to assess the possibility of another tightening step. At the same time, softer comments from some Fed officials reduced the probability of a rate increase as early as October and prompted a modest decline in yields.
On the morning of 30 September, spot gold was trading around 4,180 USD per ounce and was heading for a decline of roughly 6% for September. The pressure is primarily linked to a stronger dollar and the higher real cost of money. At the same time, geopolitical risks and high oil prices are supporting safe-haven demand, preventing the fundamental picture from becoming unequivocally negative.
The key event is the US PCE index. Stronger inflation could support yields and the dollar, increasing pressure on gold. Weaker data, by contrast, could trigger a corrective recovery in the metal.
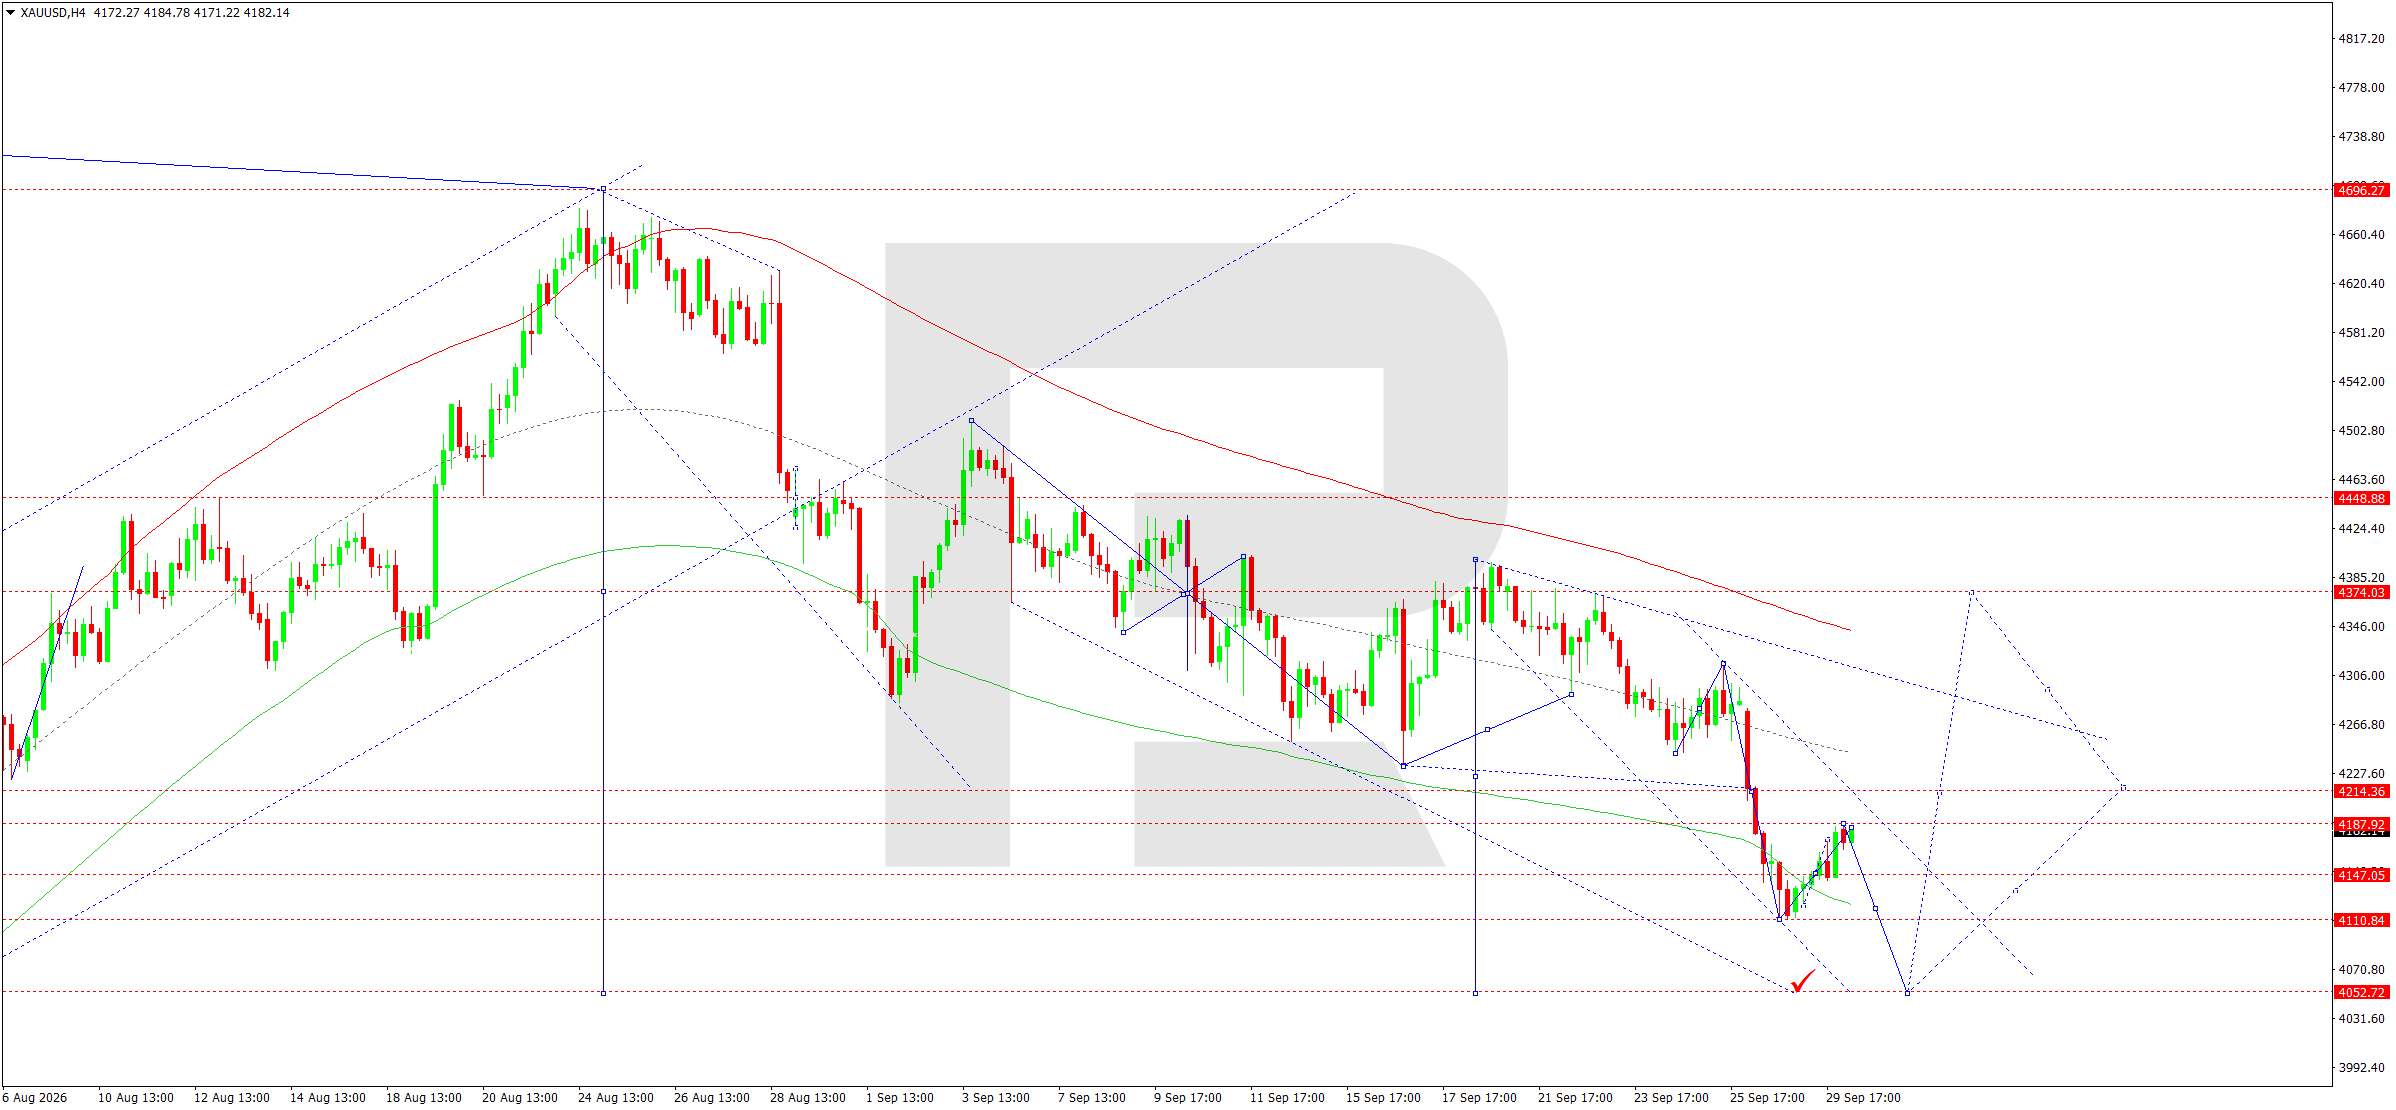
On the H4 chart, XAUUSD remains in a downtrend. After successively breaking 4,374 and 4,214, the market formed an impulse towards 4,111. All the main dynamic lines are pointing downwards, while prices remain in the lower part of the descending channel.
After reaching 4,111, the market began a technical recovery. For 30 September, a local consolidation is likely, with the possibility of a correction towards 4,188. This area acts as the central zone of the nearest structure and as an important resistance level.
The downward wave matrix with a pivot at 4,374 confirms that the main bearish direction remains intact. Therefore, a recovery towards 4,188 is viewed primarily as a correction. Once it is complete, a new downward wave towards 4,111 is expected, and a breakout below this support could open the way towards 4,053.
A return above 4,214 would be the first signal of a change in the short-term structure. Until that happens, selling after corrective rallies remains the base technical scenario.
XAUUSD forecast scenario
Trading scenario: SELL
- Price at the time of writing: 4,181
- Entry price: 4,176
- Stop loss: 4,214
- Take profit: 4,053
- Risk-to-reward ratio: 1:3.24
The trade idea is valid until 8:00 AM on 1 October 2026 (server time, UTC+3).
US 500 forecast
For the US 500, the main source of pressure remains the sharp rise in US government bond yields. At the close on 29 September, the S&P 500 fell by around 0.2%, while the yield on 10-year US Treasuries rose towards 5.25%, reaching multi-year highs. The increase in the cost of capital is particularly important for companies with high valuation multiples and puts pressure on the equity market by raising the discount rate applied to future cash flows.
US Federal Reserve policy remains an additional factor. Following the September rate increase, comments from Fed officials somewhat softened expectations for the October meeting. Yields declined partially on 30 September, although the absolute level of rates remains high.
Investors are also assessing geopolitical risks and the oil market. High energy prices increase the likelihood of persistent inflationary pressure, which may make it more difficult for the Fed to shift towards a softer policy stance. In these conditions, the PCE release takes on greater importance. Strong inflation data could push yields higher again and increase pressure on equities.
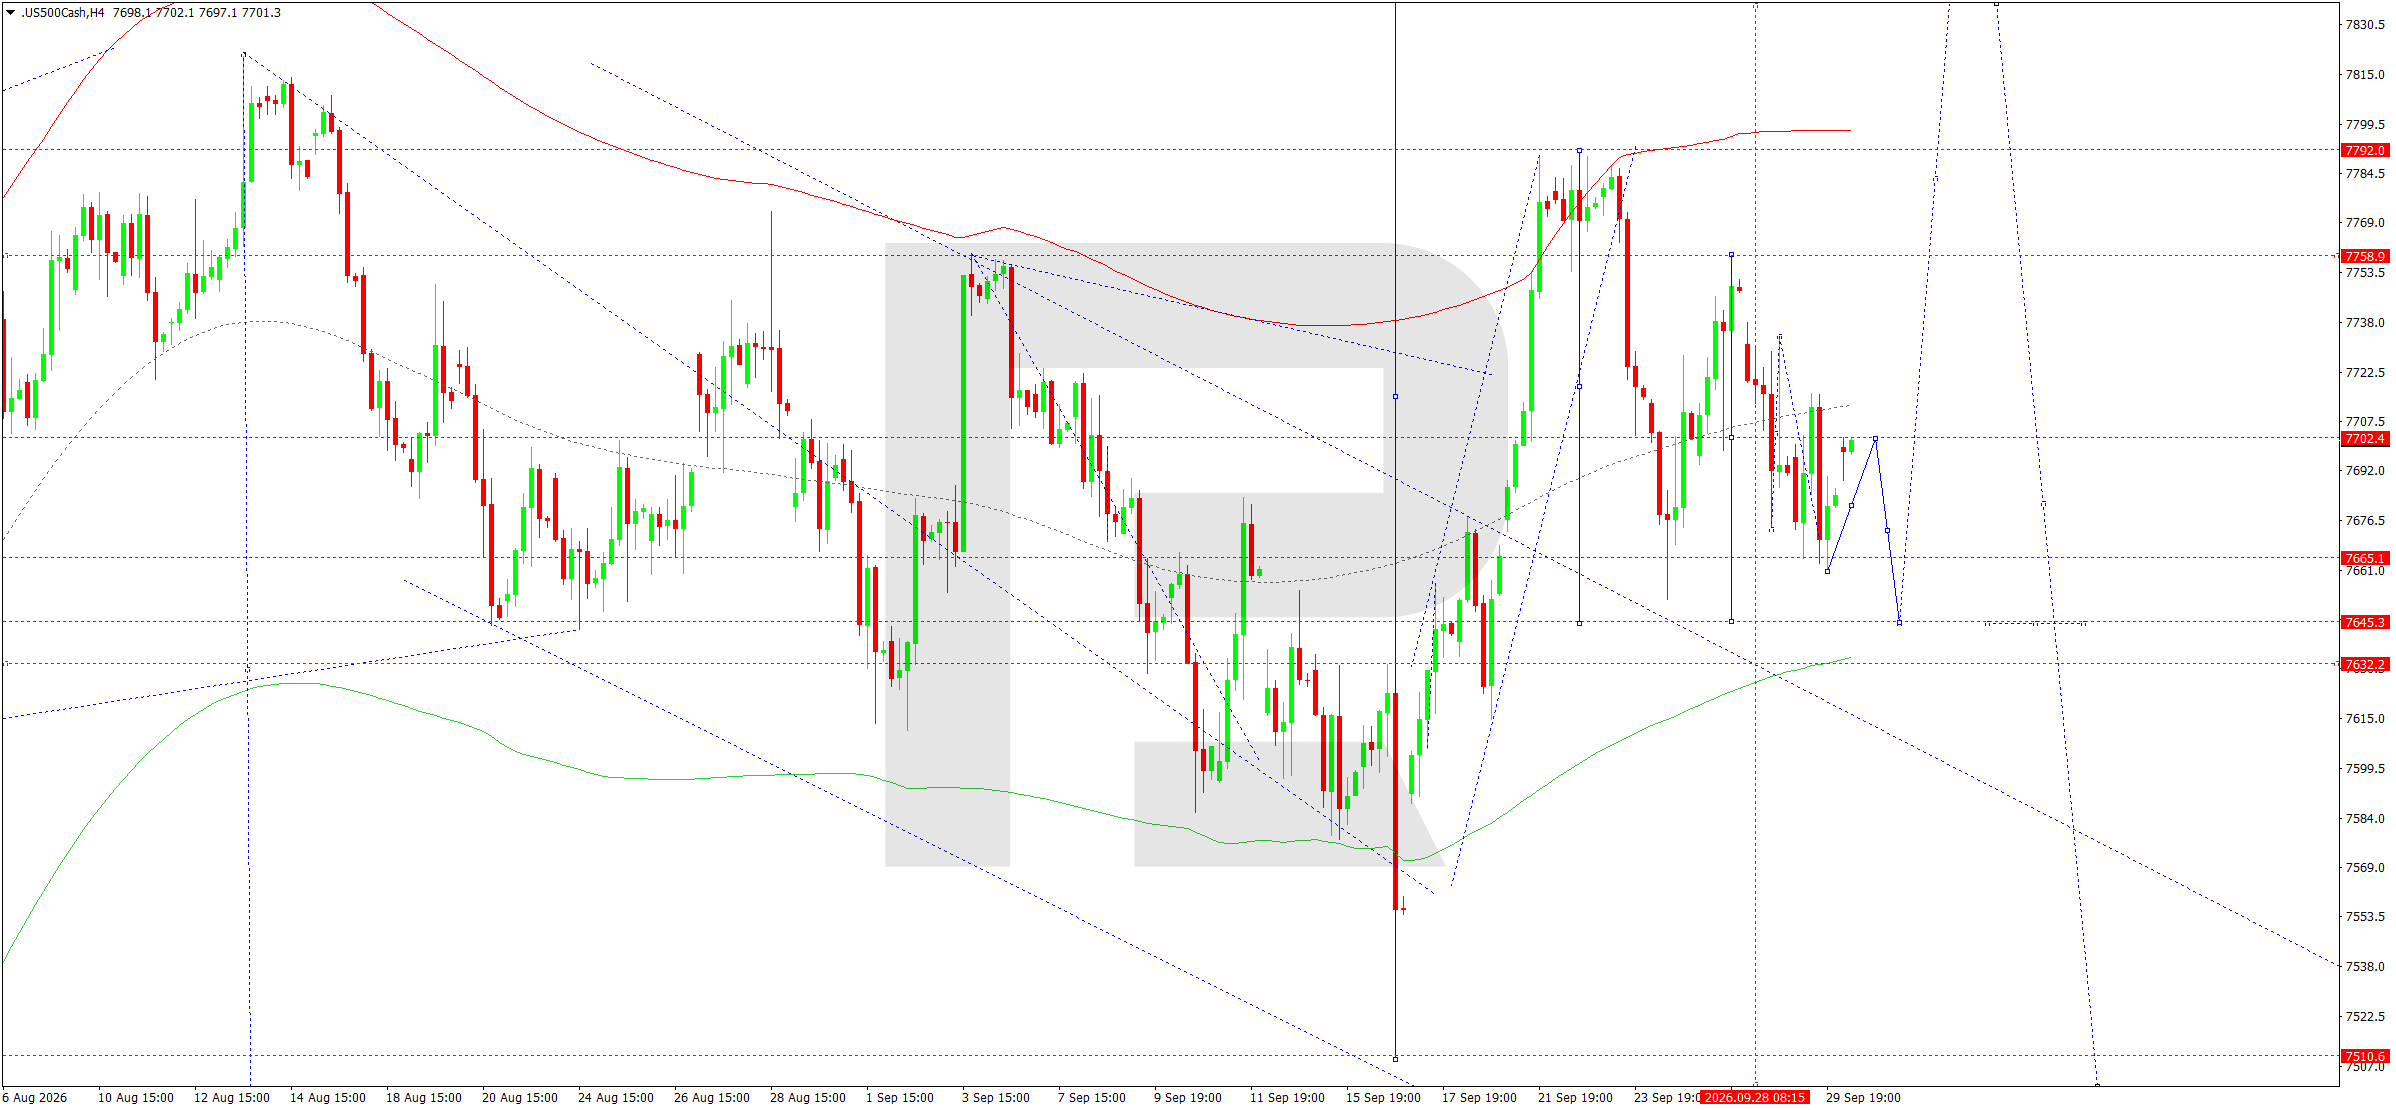
On the H4 chart, the US 500 previously formed an upward wave, but after reaching the upper 7,792 area, the market moved into a correction. In the current structure, the price formed a local recovery wave towards 7,703 and is consolidating around this level.
The matrix with a pivot around 7,702 is key for the short-term move. The market is currently trading directly around the central line of the Price Envelope, so a breakout from the formed range could determine the direction of the next impulse.
If the price breaks the 7,665 level to the downside, the nearest target is 7,645. Support at 7,632 comes next. This structure is consistent with a continuation of the corrective wave after the failed recovery attempt towards 7,759–7,792.
To invalidate this scenario, the market needs to consolidate firmly above 7,703 and then break above 7,759. Until this happens, the priority for the trading day remains on the downside. The main technical target is the 7,645 area.
US 500 forecast scenario
Trading scenario: SELL
- Price at the time of writing: 7,694
- Entry price: 7,689
- Stop loss: 7,725
- Take profit: 7,645
- Risk-to-reward ratio: 1:1.22
The trade idea is valid until 8:00 AM on 1 October 2026 (server time, UTC+3).
BTCUSD forecast
BTCUSD ends the third quarter in a fundamentally stronger medium-term position than many traditional risk assets. By the end of September, Bitcoin had gained more than 40% since the start of July and was heading towards its best quarterly performance in almost two years. One of the factors behind the recovery was capital inflows into exchange-traded products linked to Bitcoin. However, momentum weakened noticeably in the final trading days amid rising US bond yields and a general tightening of financial conditions.
Additional pressure comes from US Federal Reserve policy. High yields on risk-free dollar assets increase the opportunity cost of holding assets that do not generate interest income, including Bitcoin. Following softer comments from Fed officials, the probability of an immediate rate increase in October declined, although the 10-year yield remains above 5.2%.
Institutional demand has not disappeared completely. In late September, new large Bitcoin purchases were recorded alongside renewed inflows into spot funds. This supports the medium-term picture but does not rule out a short-term correction after the strong quarterly rise.
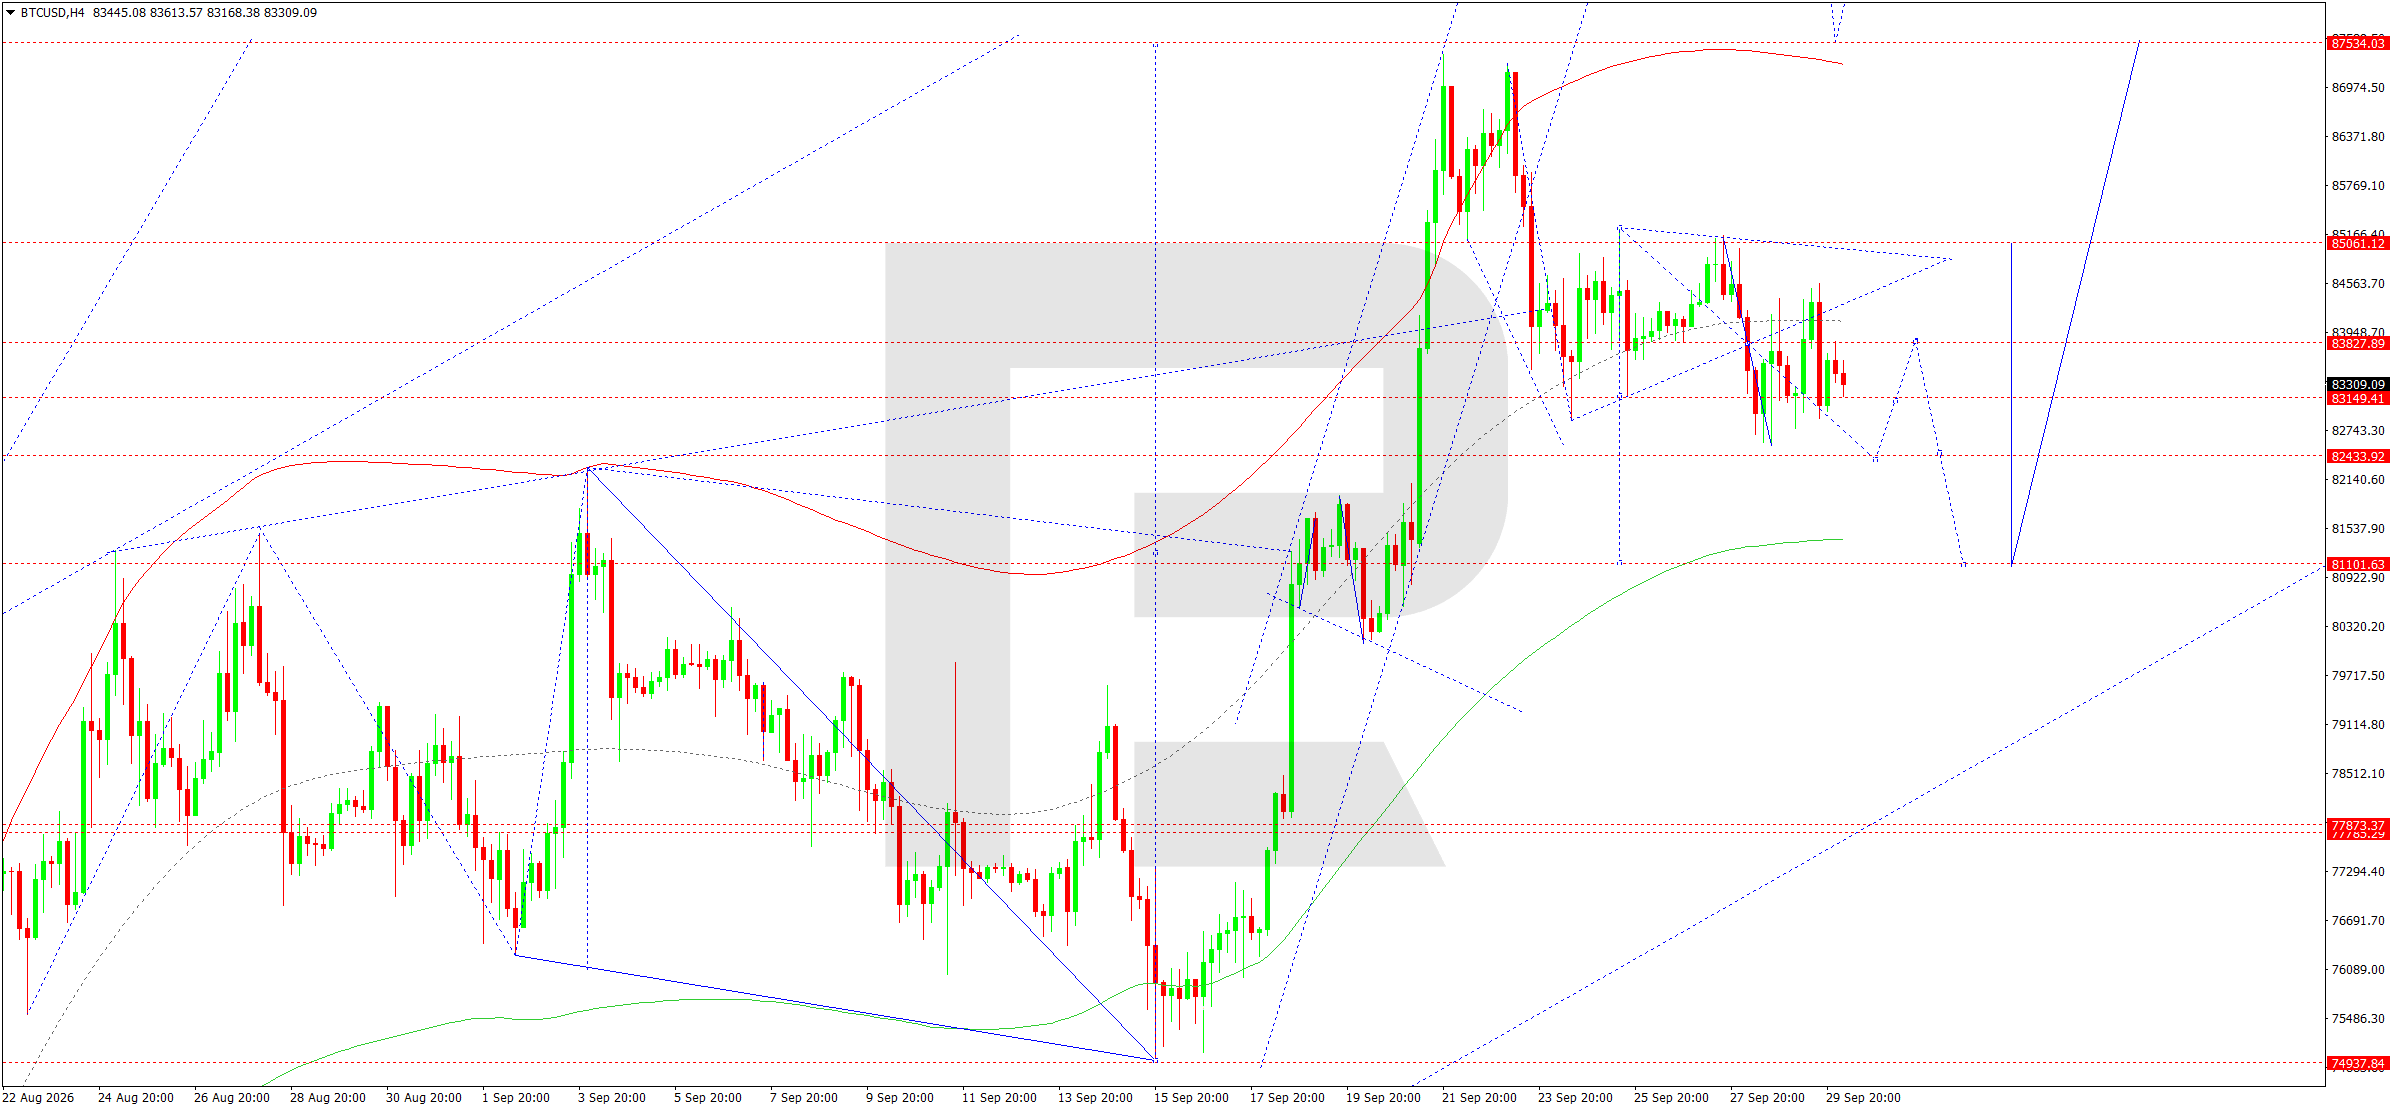
On the H4 chart, BTCUSD moved into a corrective phase after an impulse towards the 87,334 area. The subsequent move formed a range with resistance levels at 85,061 and 83,828 and support levels at 82,434 and 81,102. The current price is hovering around 83,500, placing it in the upper half of this range.
The main wave matrix with a pivot at 81,101 remains the key support for the medium-term structure. However, the local configuration after testing the upper boundary of the Price Envelope points to the possibility of a continued correction.
For 30 September, the base case is a decline first towards 82,433. A breakout below this level could open the way directly towards 81,101. This area is both the lower boundary of the current structure and a potential point for the correction to end.
For a recovery, buyers need consolidation above 83,828 followed by a breakout above 85,061. Until such a signal emerges, the short-term advantage remains with sellers despite Bitcoin retaining a stronger medium-term structure.
BTCUSD forecast scenario
Trading scenario: SELL
- Price at the time of writing: 83,500
- Entry price: 83,495
- Stop loss: 85,061
- Take profit: 81,101
- Risk-to-reward ratio: 1:1.53
The trade idea is valid until 8:00 AM on 1 October 2026 (server time, UTC+3).
Editors’ picks
 EURUSD forecast 2026–2027: technical analysis, price levels & predictions
The EURUSD outlook for 2026 and 2027: key levels on the daily chart, three trading scenarios and the policy gap between the Fed and the ECB that drives the pair.
 Gold (XAUUSD) forecast 2026: technical analysis, price levels & predictions
Where gold could trade in 2026: key levels, three trading scenarios with entry triggers and the forecasts from J.P. Morgan, Deutsche Bank and Goldman Sachs.
Forecasts presented in this section only reflect the author’s private opinion and should not be considered as guidance for trading. RoboForex bears no responsibility for trading results based on trading recommendations described in these analytical reviews.