
Daily technical analysis and forecast for 1 October 2026
Daily technical analysis and forecast for EURUSD, USDJPY, GBPUSD, AUDUSD, USDCAD, XAUUSD, US 500, and BTCUSD for 1 October 2026.
Each scenario on this page reflects the market structure on the H4 chart as of 10:00 UTC+3 on 1 October 2026. The assessment considers the current H4 chart structure, key support and resistance levels, the direction of the medium-term movement, and the prevailing fundamental backdrop.
EURUSD forecast
At the start of October, EURUSD remains under pressure from a stronger US dollar and elevated US government bond yields. The latest US inflation data came in somewhat softer than expected, reducing the likelihood of further tightening by the US Federal Reserve (Fed), although this has not yet been enough to produce a sustained decline in yields.
Tensions remain elevated in the global debt market, while high borrowing costs support demand for the dollar. Uncertainty surrounding the energy market and geopolitics remains an additional factor that may sustain inflation risks.
For the euro, the situation is complicated by accelerating inflation in some of the eurozone's largest economies, limiting the European Central Bank's (ECB) room for manoeuvre. At the same time, weak industrial dynamics preserve the risk of a regional economic slowdown. The market is therefore assessing the outlook for both Fed and ECB policy, although the current yield differential still favours the dollar.
On 1 October, market attention is focused on European PMI data and unemployment figures, while in the US the focus is on upcoming inflation and labour-market data. This increases the likelihood that EURUSD volatility will remain elevated near current lows.
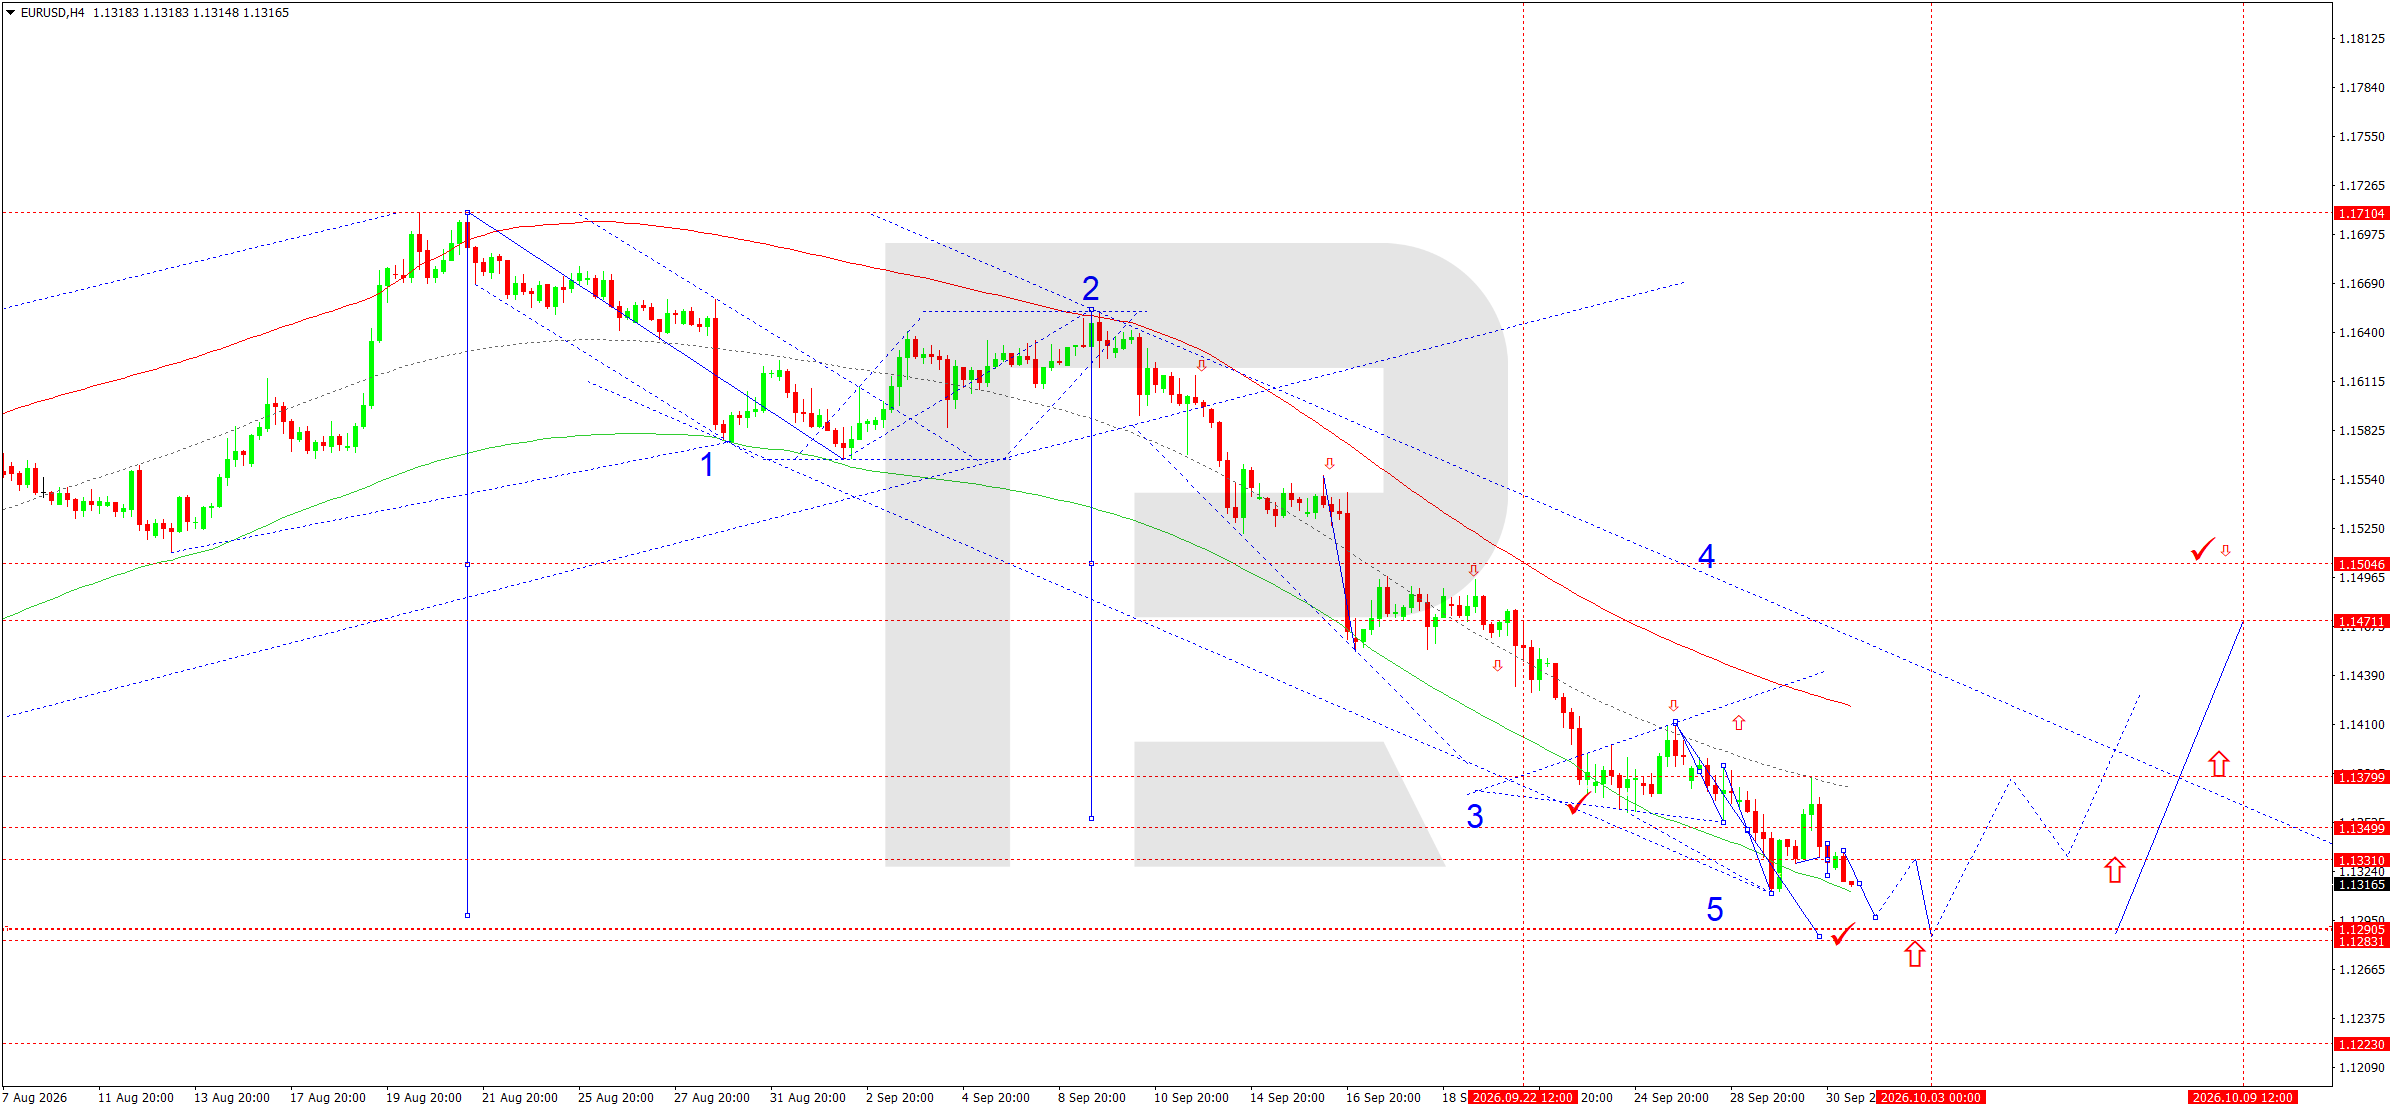
On the H4 chart, EURUSD completed a downward wave towards 1.1330 and retained its downtrend structure. The main scenario for 1 October is a continuation of the decline towards 1.1299. A breakout below this support could open the way towards 1.1285, which is viewed as the main local target.
The structure corresponds to the Elliott Wave count: after the corrective fourth wave was completed, a fifth downward wave is developing.
The Matrix has a pivot around 1.1505, significantly above the current price, confirming the sellers' advantage. The earlier breakout below 1.1380 took the price towards the lower part of the Price Envelope around 1.1311. The subsequent rebound towards 1.1379 formed a retest of the broken area from below, after which pressure resumed.
While EURUSD remains below 1.1349–1.1380, the main direction remains downwards. The sellers' nearest targets are 1.1299 and then 1.1285. Only a return above 1.1380 would weaken the current downward structure.
EURUSD forecast scenario
Trading scenario: SELL
- Price at the time of writing: 1.1318
- Entry price: 1.1313
- Stop Loss: 1.1349
- Take Profit: 1.1285
- Risk-to-reward ratio: 1:0.78
The trade idea is valid until 8:00 AM on 2 October 2026 (server time, UTC+3).
USDJPY forecast
USDJPY starts October amid persistently high US bond yields and a weaker yen. The US dollar remains relatively resilient as high Treasury yields continue to support its appeal despite somewhat softer recent US inflation readings. The market is reassessing expectations regarding the next steps by the US Federal Reserve (Fed), although there has not yet been a sustained shift towards expectations of rapid monetary easing.
At the same time, the fundamental backdrop for the yen is becoming mixed. The latest Tankan showed the strongest confidence among Japanese businesses in eight years, while the published opinions of Bank of Japan (BoJ) meeting participants indicate that some policymakers see a need for faster rate increases. This creates a fundamental constraint on long-term USDJPY growth. However, in the short term, the advantage of US yields and the current dollar impulse allow the pair to remain above 158.00.
Therefore, the fundamental backdrop for 1 October allows for a continuation of the upward impulse, although the 159.00–160.00 area is becoming a higher-risk zone for buyers because expectations of tighter BoJ policy may intensify.
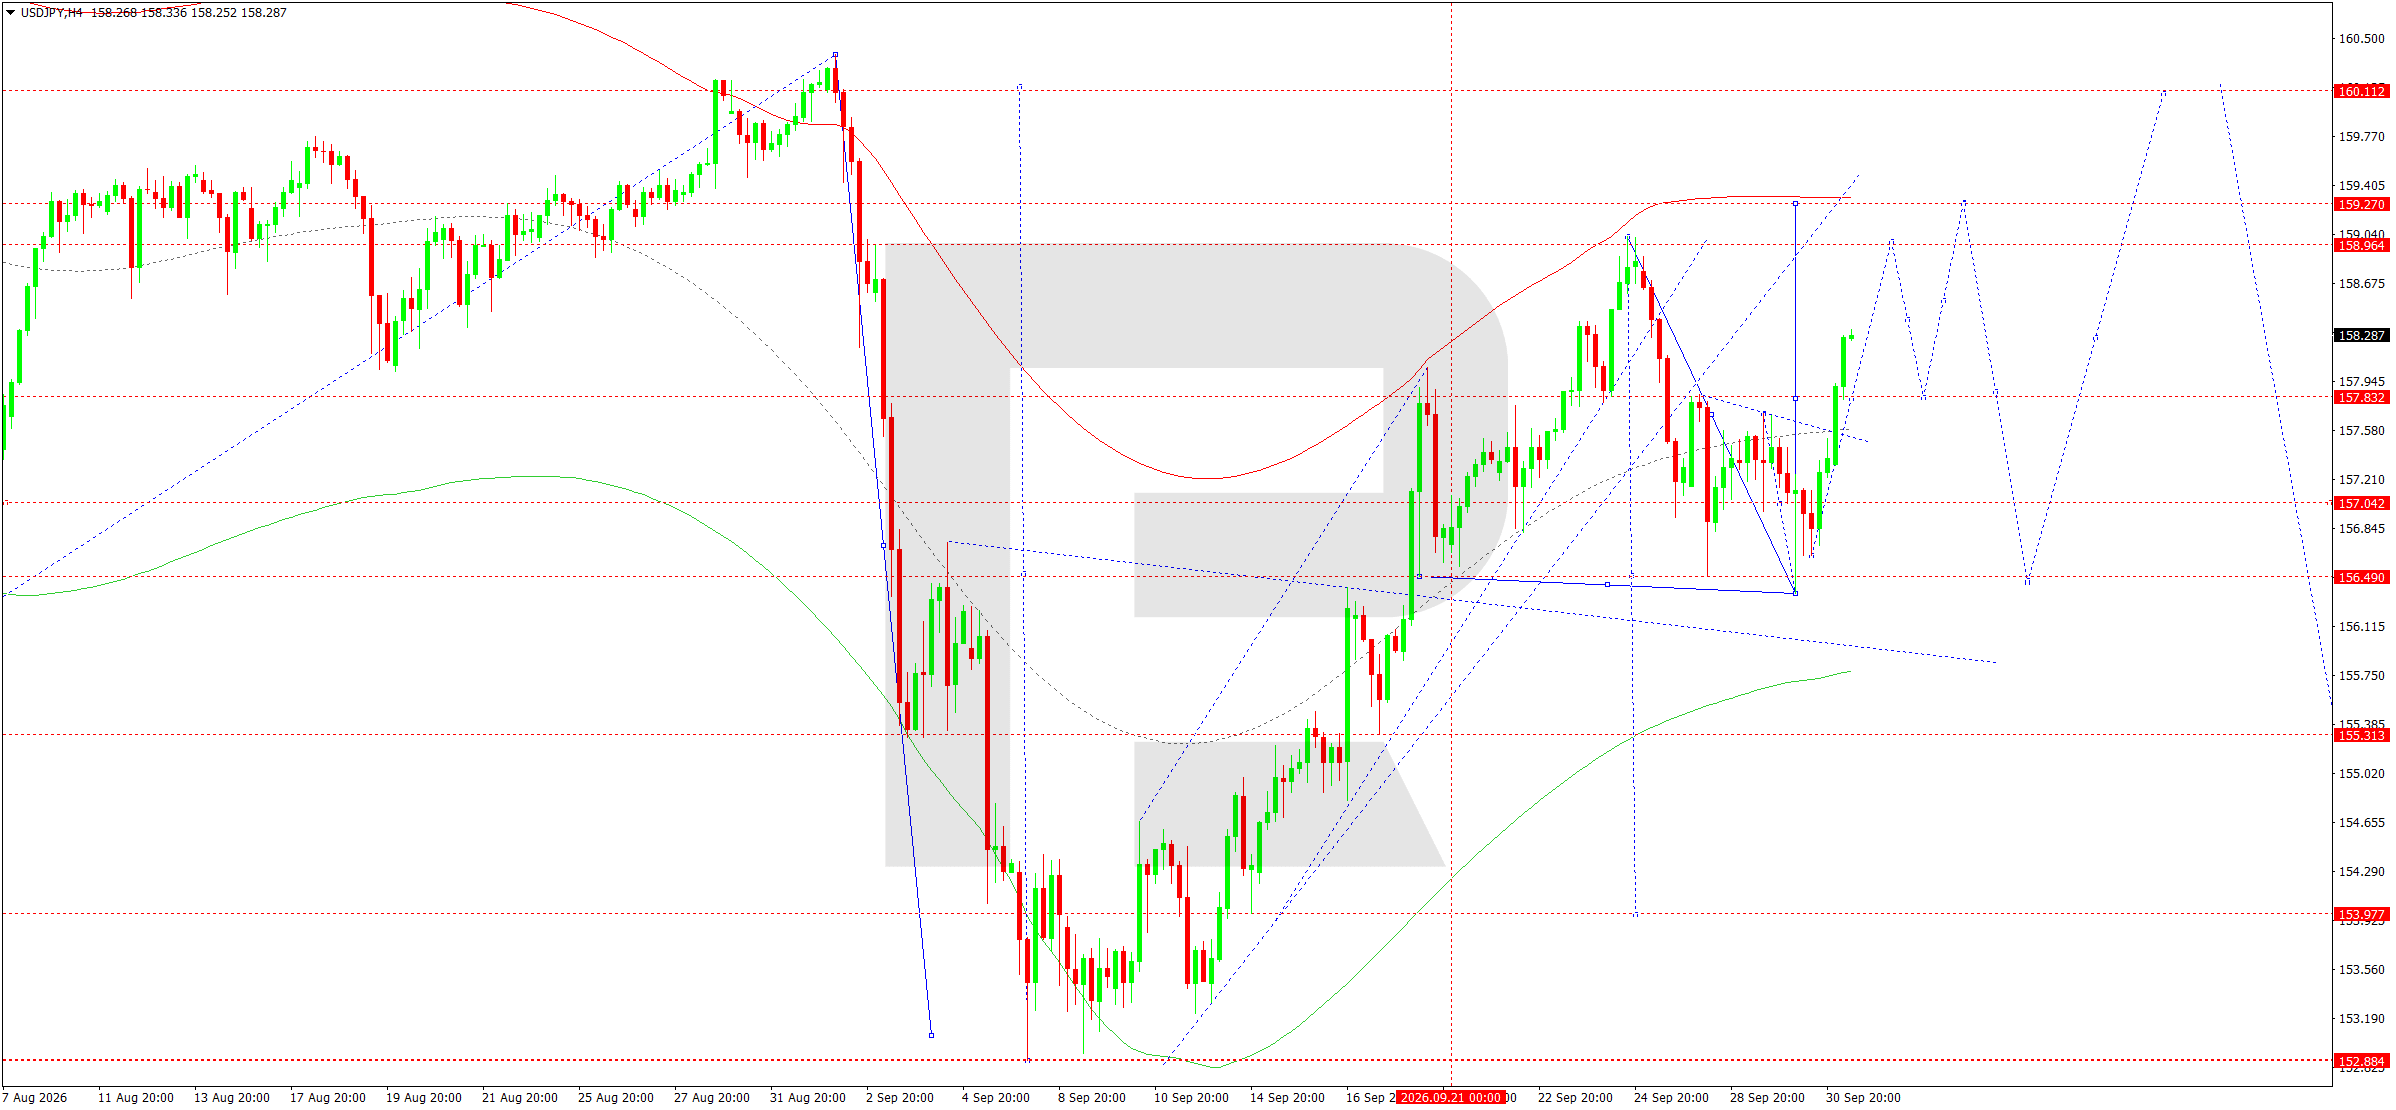
On the H4 chart, USDJPY broke resistance at 157.82 and formed a continuation of the upward wave. After the breakout, the price consolidated above the broken level, allowing 158.95 to be considered the first target of the current impulse. If demand persists, the move may extend further towards 159.20–159.27.
The rising-wave Matrix has a pivot around 156.40. The price is significantly above it, confirming the buyers' advantage. The central line of the Price Envelope around 157.82 has already been overcome, so the technical target becomes its upper boundary around 159.27.
The key condition for this scenario is for 157.82 to hold. While the price remains above this level, any decline is viewed mainly as a local correction within the upward structure. The next resistance area is at 158.95–159.27. A breakout above 159.27 could extend the upside potential towards 160.11.
USDJPY forecast scenario
Trading scenario: BUY
- Price at the time of writing: 158.30
- Entry price: 158.35
- Stop Loss: 157.82
- Take Profit: 159.27
- Risk-to-reward ratio: 1:1.74
The trade idea is valid until 8:00 AM on 2 October 2026 (server time, UTC+3).
GBPUSD forecast
GBPUSD enters October under the influence of a strong dollar and persistent pressure on sterling. High US Treasury yields support the US currency despite signs of more moderate inflationary pressure. The US Federal Reserve (Fed) remains the central factor for the foreign exchange market as investors assess how persistent inflation will prove and whether tight financial conditions will need to remain in place for longer than expected. Recent positioning also showed an increase in long dollar positions and a more cautious attitude towards sterling among futures-market participants.
For sterling, the outlook for Bank of England (BoE) monetary policy remains important. High borrowing costs support returns on UK assets but simultaneously increase risks to domestic demand and economic growth. At the start of October, the market is also monitoring UK macroeconomic indicators, including the state of the housing sector and business activity. Against this backdrop, fundamental conditions do not yet provide sufficient grounds for a sustained GBPUSD recovery.
The market reaction to US data and changes in bond yields may remain the main source of intraday volatility.
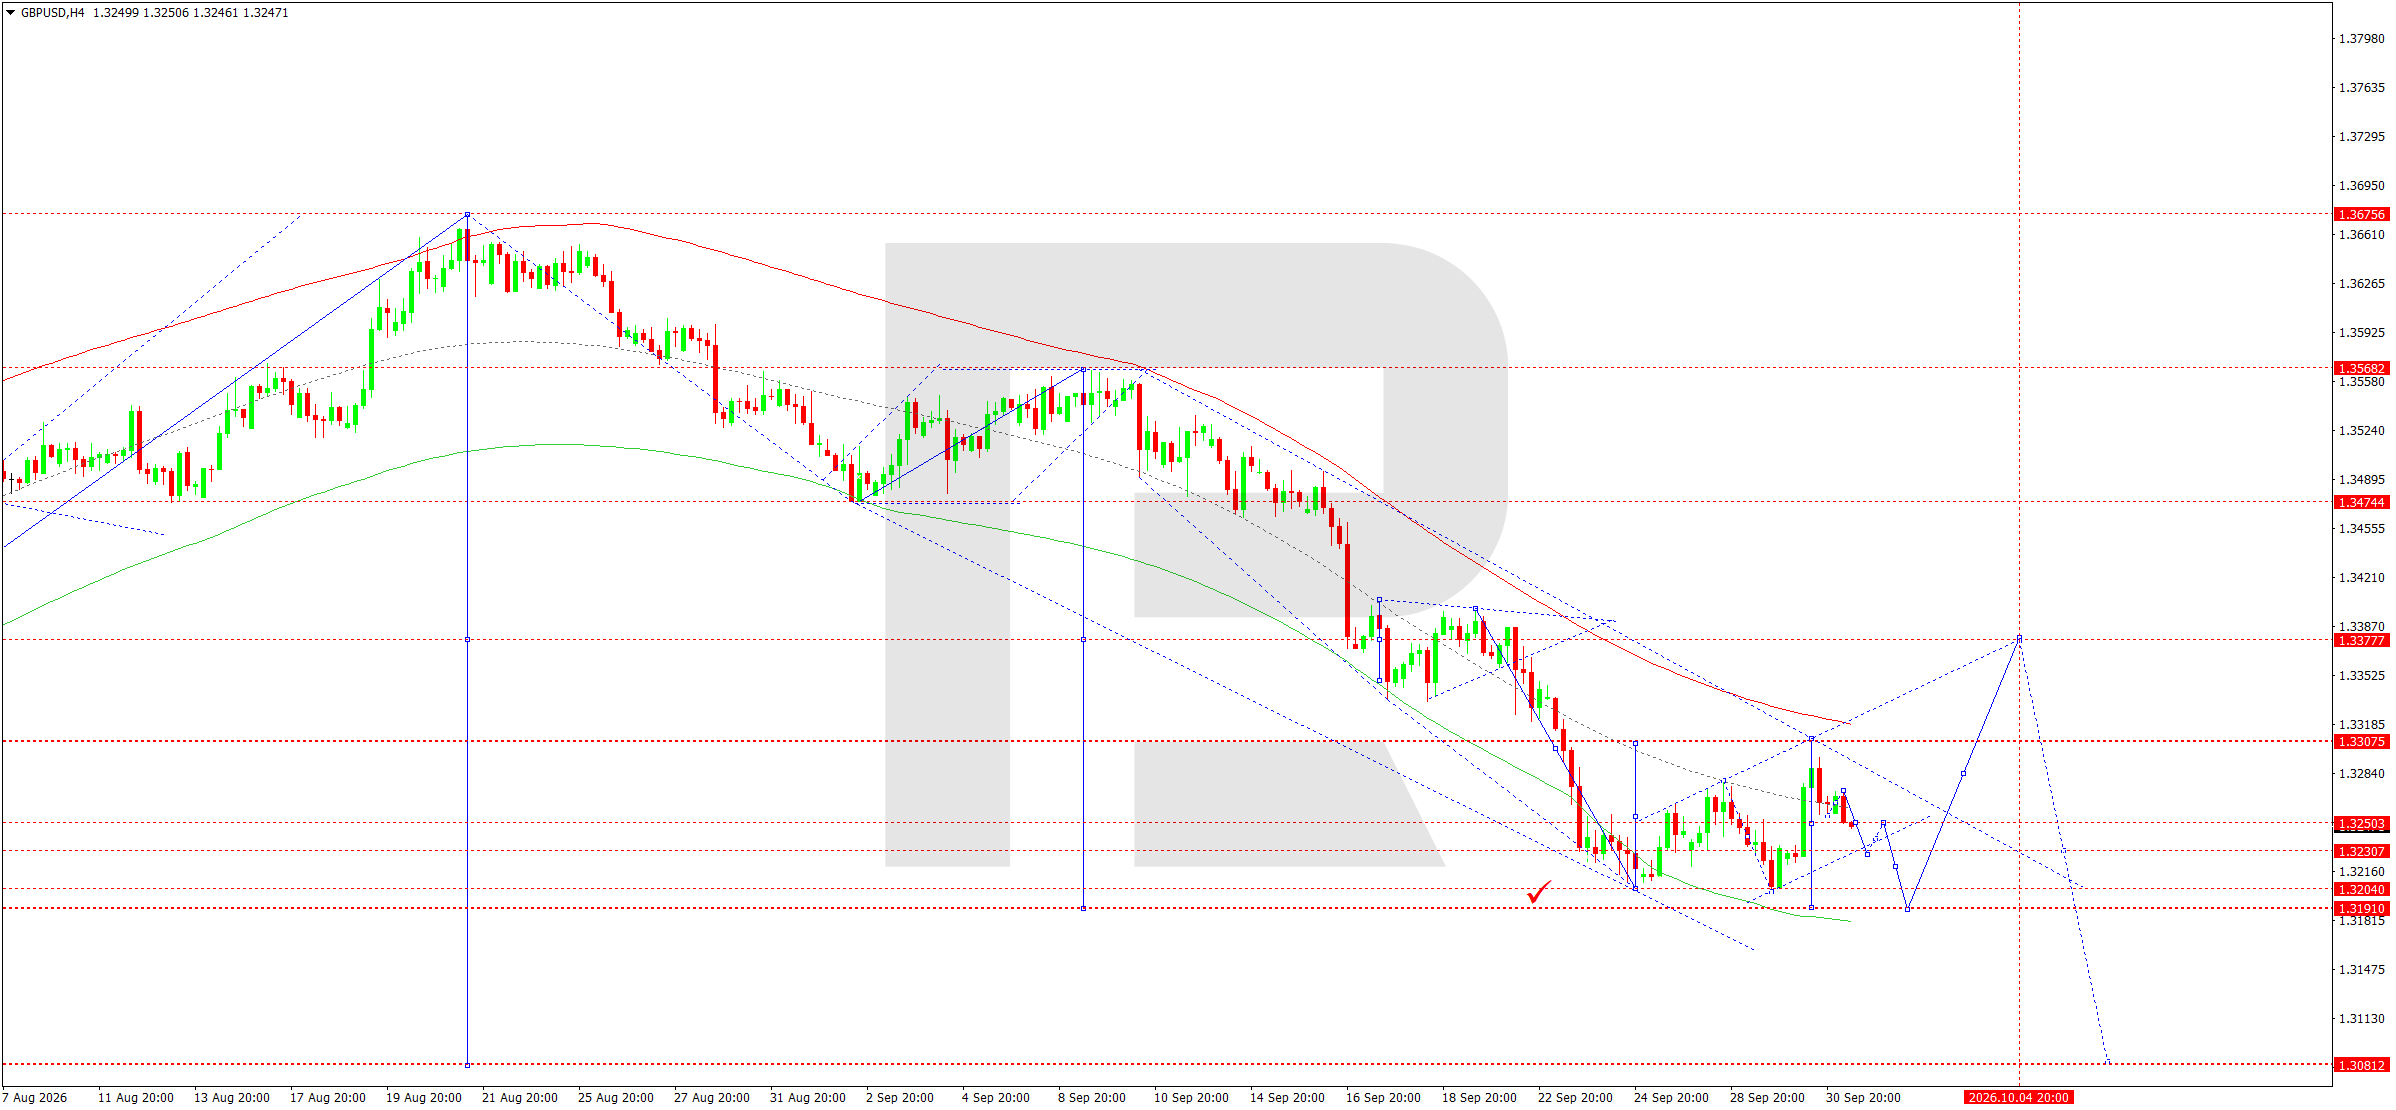
On the H4 chart, GBPUSD remains in a downward structure. The market completed a corrective upward wave towards 1.3307, after which the recovery potential began to weaken. The main scenario for 1 October is the formation of a new downward leg towards 1.3205. A breakout below this support would allow the move to continue towards 1.3191, while the next extended target is the 1.3120 area.
The Elliott Wave structure and the declining-wave Matrix with a pivot at 1.3377 confirm the sellers' advantage. The price remains below the Matrix pivot and the upper boundary of the descending working channel. The Price Envelope is also directed downwards, with its lower area running around 1.3175.
Within the current structure, the 1.3250–1.3307 area is viewed as resistance. While the price remains below 1.3307, priority remains with the development of the downward wave. The nearest targets are at 1.3205 and 1.3191. Once they are passed, the market may open room for a decline towards 1.3120.
GBPUSD forecast scenario
Trading scenario: SELL
- Price at the time of writing: 1.3252
- Entry price: 1.3247
- Stop Loss: 1.3307
- Take Profit: 1.3191
- Risk-to-reward ratio: 1:0.93
The trade idea is valid until 8:00 AM on 2 October 2026 (server time, UTC+3).
AUDUSD forecast
The Australian dollar remains under pronounced pressure from the US currency. Rising US government bond yields and strong demand for the dollar have created an unfavourable external environment for AUDUSD. The US Federal Reserve (Fed) still has scope to maintain tight financial conditions, although the latest inflation data have somewhat reduced expectations of further rate increases. Another factor for the AUD is cautious global risk appetite, as the Australian currency is traditionally sensitive to commodity and Asian market dynamics.
The Reserve Bank of Australia (RBA) recently raised the rate, although the AUD reaction was weak: a significant part of the tightening had already been priced in, while subsequent softer inflation data reduced expectations of further increases. In addition, published data showed a narrowing of Australia's trade surplus due to imports growing faster than exports. Together, these factors prevent the Australian dollar from benefiting from the higher domestic interest rate.
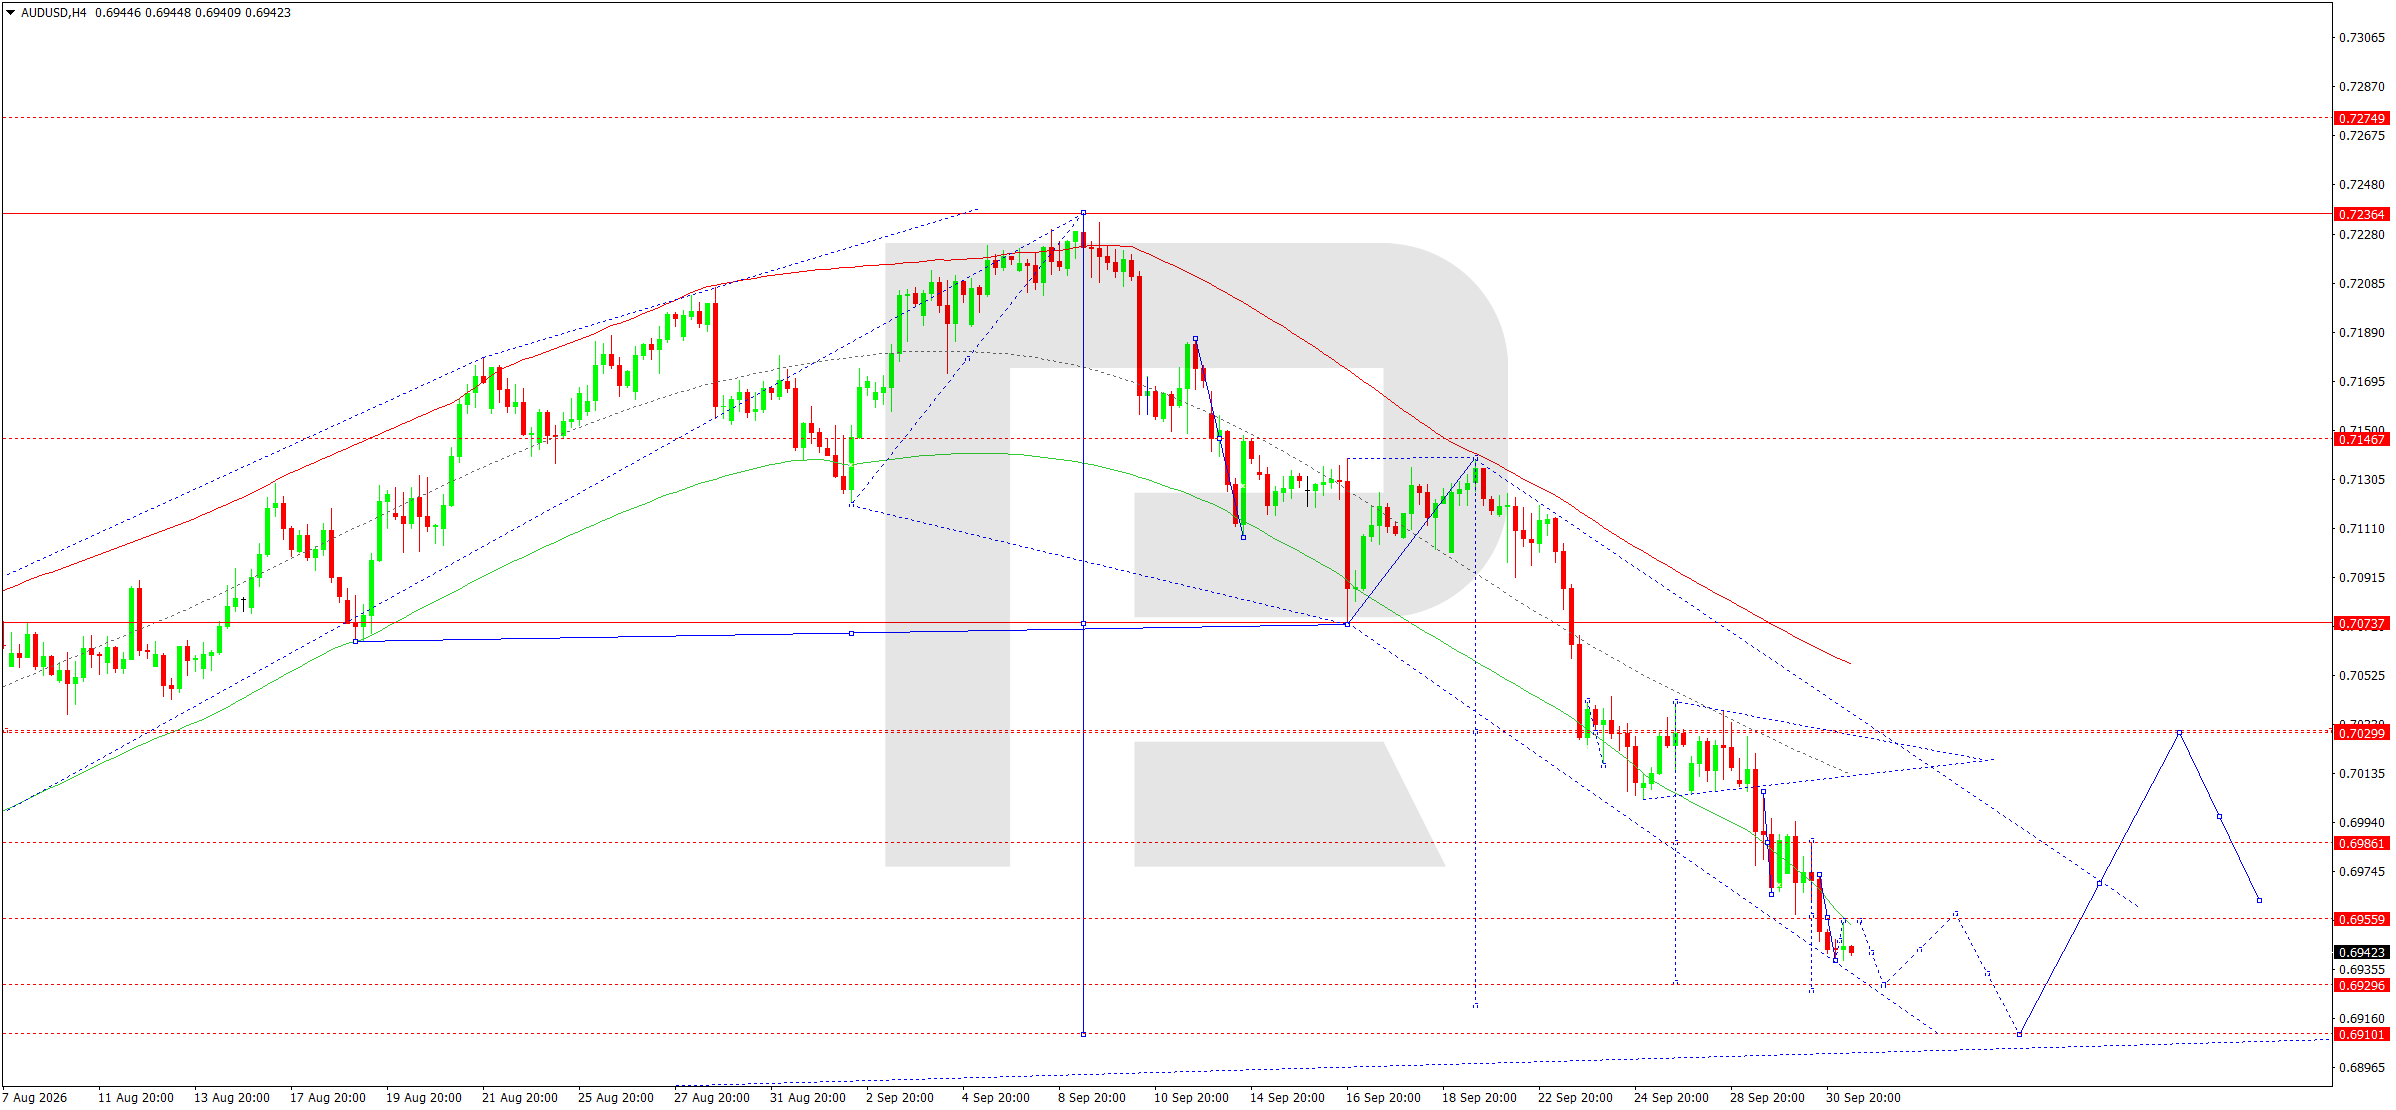
On the H4 chart, AUDUSD is developing a stable downtrend. The price formed a downward wave towards the 0.6939 area and remains within the descending channel. On 1 October, an initial correction towards 0.6955 is possible, after which a resumption of the decline becomes the priority.
The Matrix of the current wave has a pivot around 0.7023. The price being significantly below this level confirms that the downward structure remains intact. After breaking 0.6986, the market formed a new impulse and approached the 0.6930 area. The nearest intermediate support remains at 0.6929, while the main technical target is 0.6911.
A correction towards 0.6955 would not disrupt the bearish scenario and may form a local retest from below. A return towards 0.6929–0.6920 is then expected, followed by a move towards 0.6911. Only consolidation above 0.6986 would be the first signal that selling pressure is weakening.
AUDUSD forecast scenario
Trading scenario: SELL
- Price at the time of writing: 0.6950
- Entry price: 0.6945
- Stop Loss: 0.6986
- Take Profit: 0.6911
- Risk-to-reward ratio: 1:0.83
The trade idea is valid until 8:00 AM on 2 October 2026 (server time, UTC+3).
USDCAD forecast
USDCAD retains an upward bias amid a strong US dollar and a wider yield differential between the US and Canada. High Treasury yields support the dollar, although more moderate US inflation readings have somewhat reduced expectations of additional tightening by the US Federal Reserve (Fed). As a result, fundamental support for the dollar remains significant but is becoming less one-sided ahead of new inflation and employment data.
The Bank of Canada (BoC) kept its rate unchanged at 2.25% in September, while the future policy path remains dependent on inflation and the state of the economy. Rising oil prices may support the Canadian dollar while also increasing inflation risks, limiting the BoC's room for a softer policy stance. On the other hand, signs of a slowdown in the Canadian economy and persistent trade uncertainty reduce the scope for a prolonged tightening cycle.
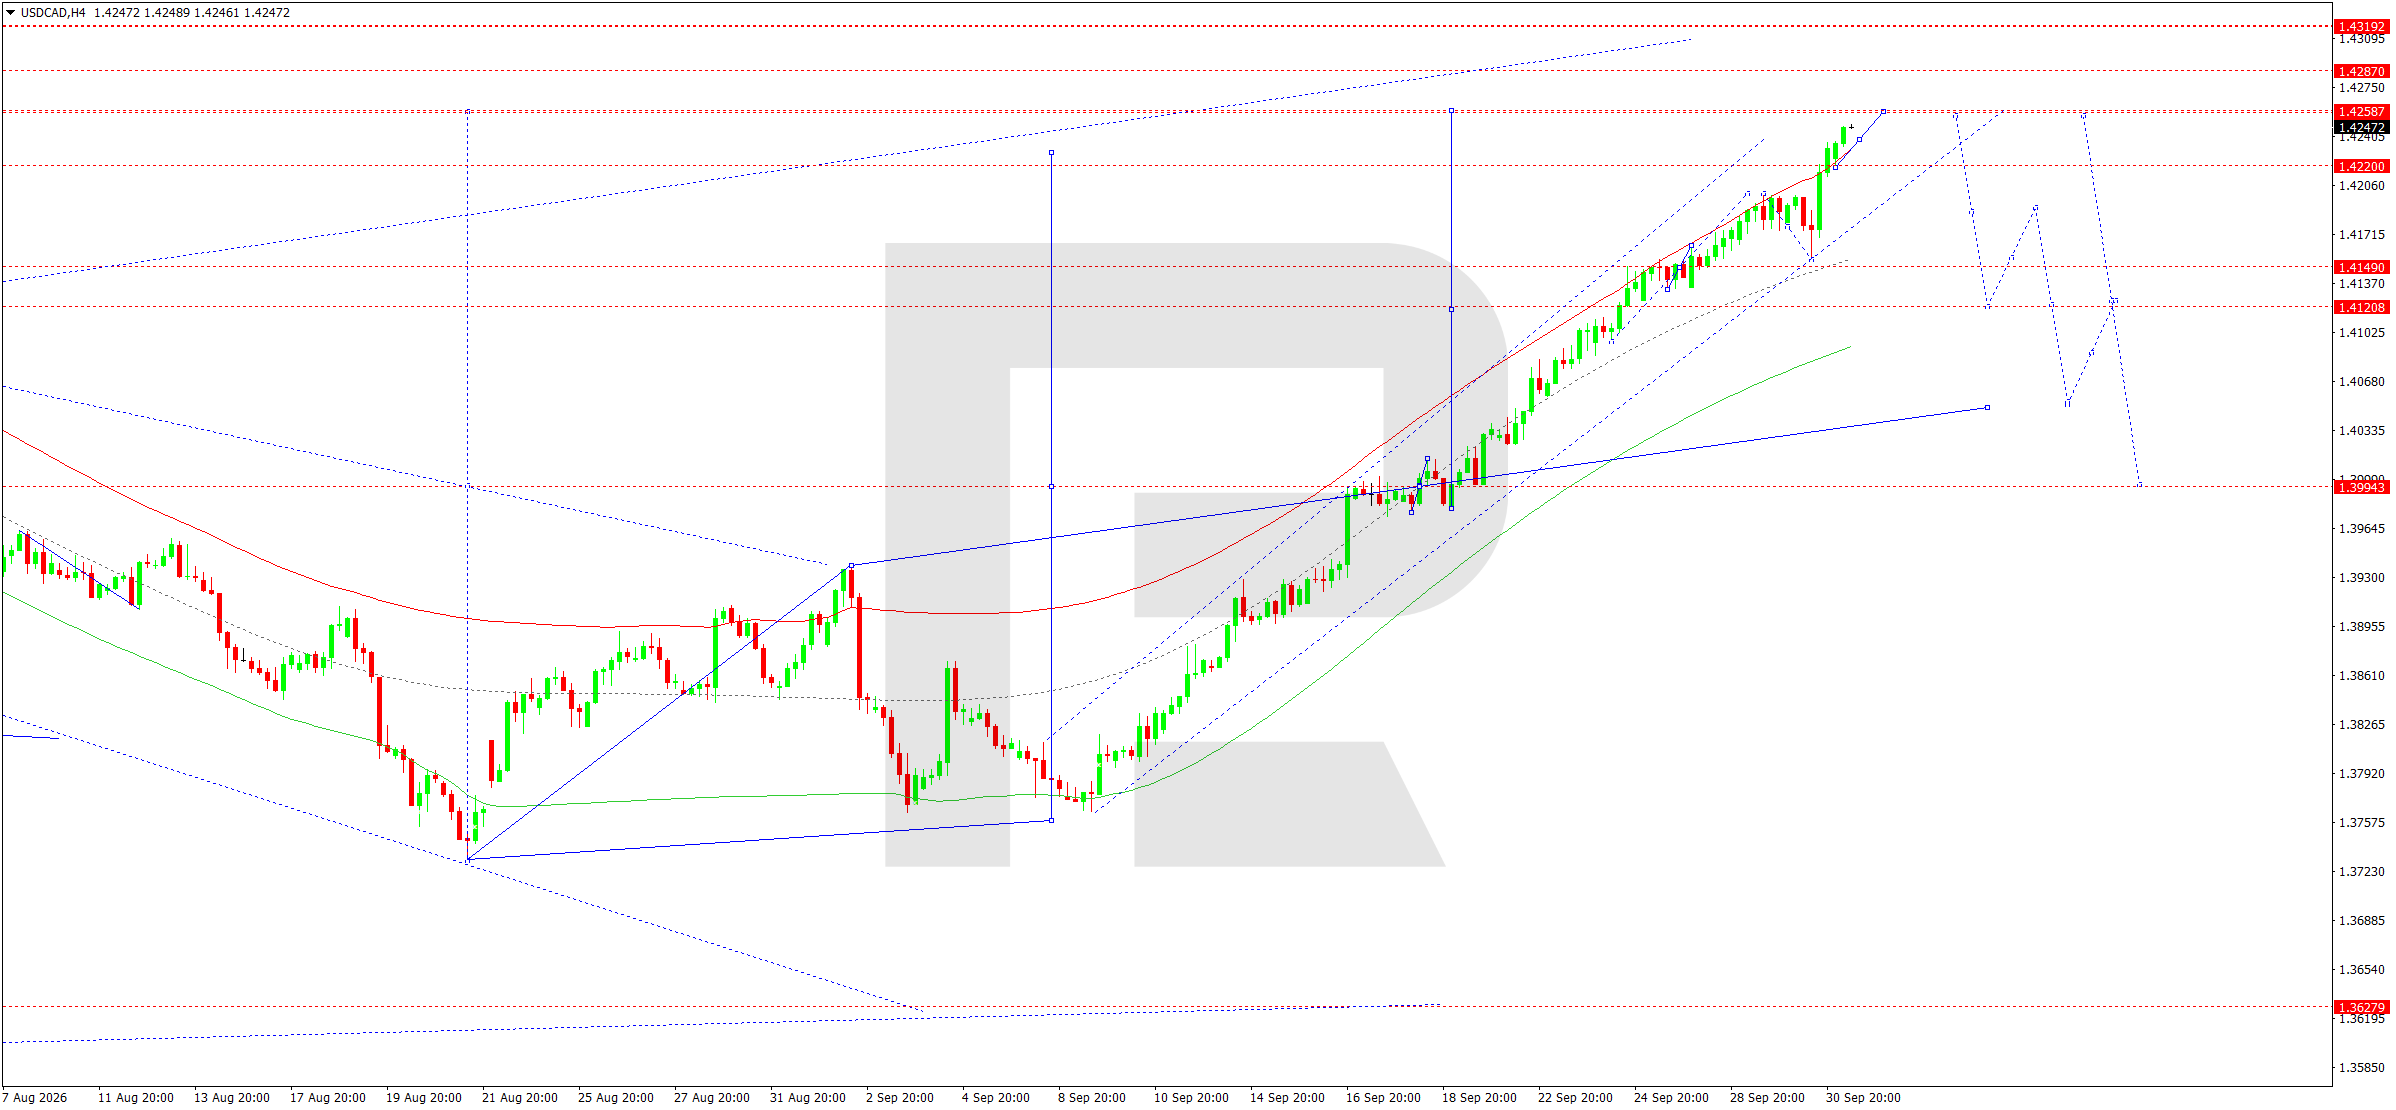
On the H4 chart, USDCAD continues a pronounced upward wave and has reached the 1.4245 area. The price has approached the upper part of the working channel, increasing the probability on 1 October of a compact consolidation forming directly below resistance.
The rising-wave Matrix has a pivot around 1.3999. The significant distance from the pivot confirms the maturity of the current upward impulse while also increasing the probability of a correction. Resistance is located at 1.4258. A confident breakout above it could open a short-term move towards 1.4287 and then 1.4319.
However, once the current impulse is complete, the main scenario is a correction. A breakout below 1.4220 would be the first confirmation that it has begun. In this case, the target is 1.4149, corresponding to the central area of the Price Envelope. The next support lies at 1.4121. Once the correction is complete, the structure allows for another attempt to move towards 1.4258.
USDCAD forecast scenario
Trading scenario: SELL
- Price at the time of writing: 1.4245
- Entry price: 1.4240
- Stop Loss: 1.4290
- Take Profit: 1.4149
- Risk-to-reward ratio: 1:1.94
The trade idea is valid until 8:00 AM on 2 October 2026 (server time, UTC+3).
XAUUSD forecast
XAUUSD starts October after a difficult September for gold. Gold futures retained gains for the third quarter as a whole, although the metal itself posted a significant decline in September. The main source of pressure remains high US government bond yields, which increase the opportunity cost of holding a non-interest-bearing asset. At the same time, a strong dollar further limits the recovery in prices.
The US Federal Reserve (Fed) remains the main macroeconomic reference point. More moderate inflation data somewhat reduced the probability of another rate increase, although bond yields continue to remain at elevated levels. The gold market is therefore caught between two opposing factors: expectations of softer future policy support the metal, while current real and nominal yields create pressure. Geopolitical uncertainty and tensions around energy markets preserve safe-haven demand but have so far failed to change the short-term technical trend.
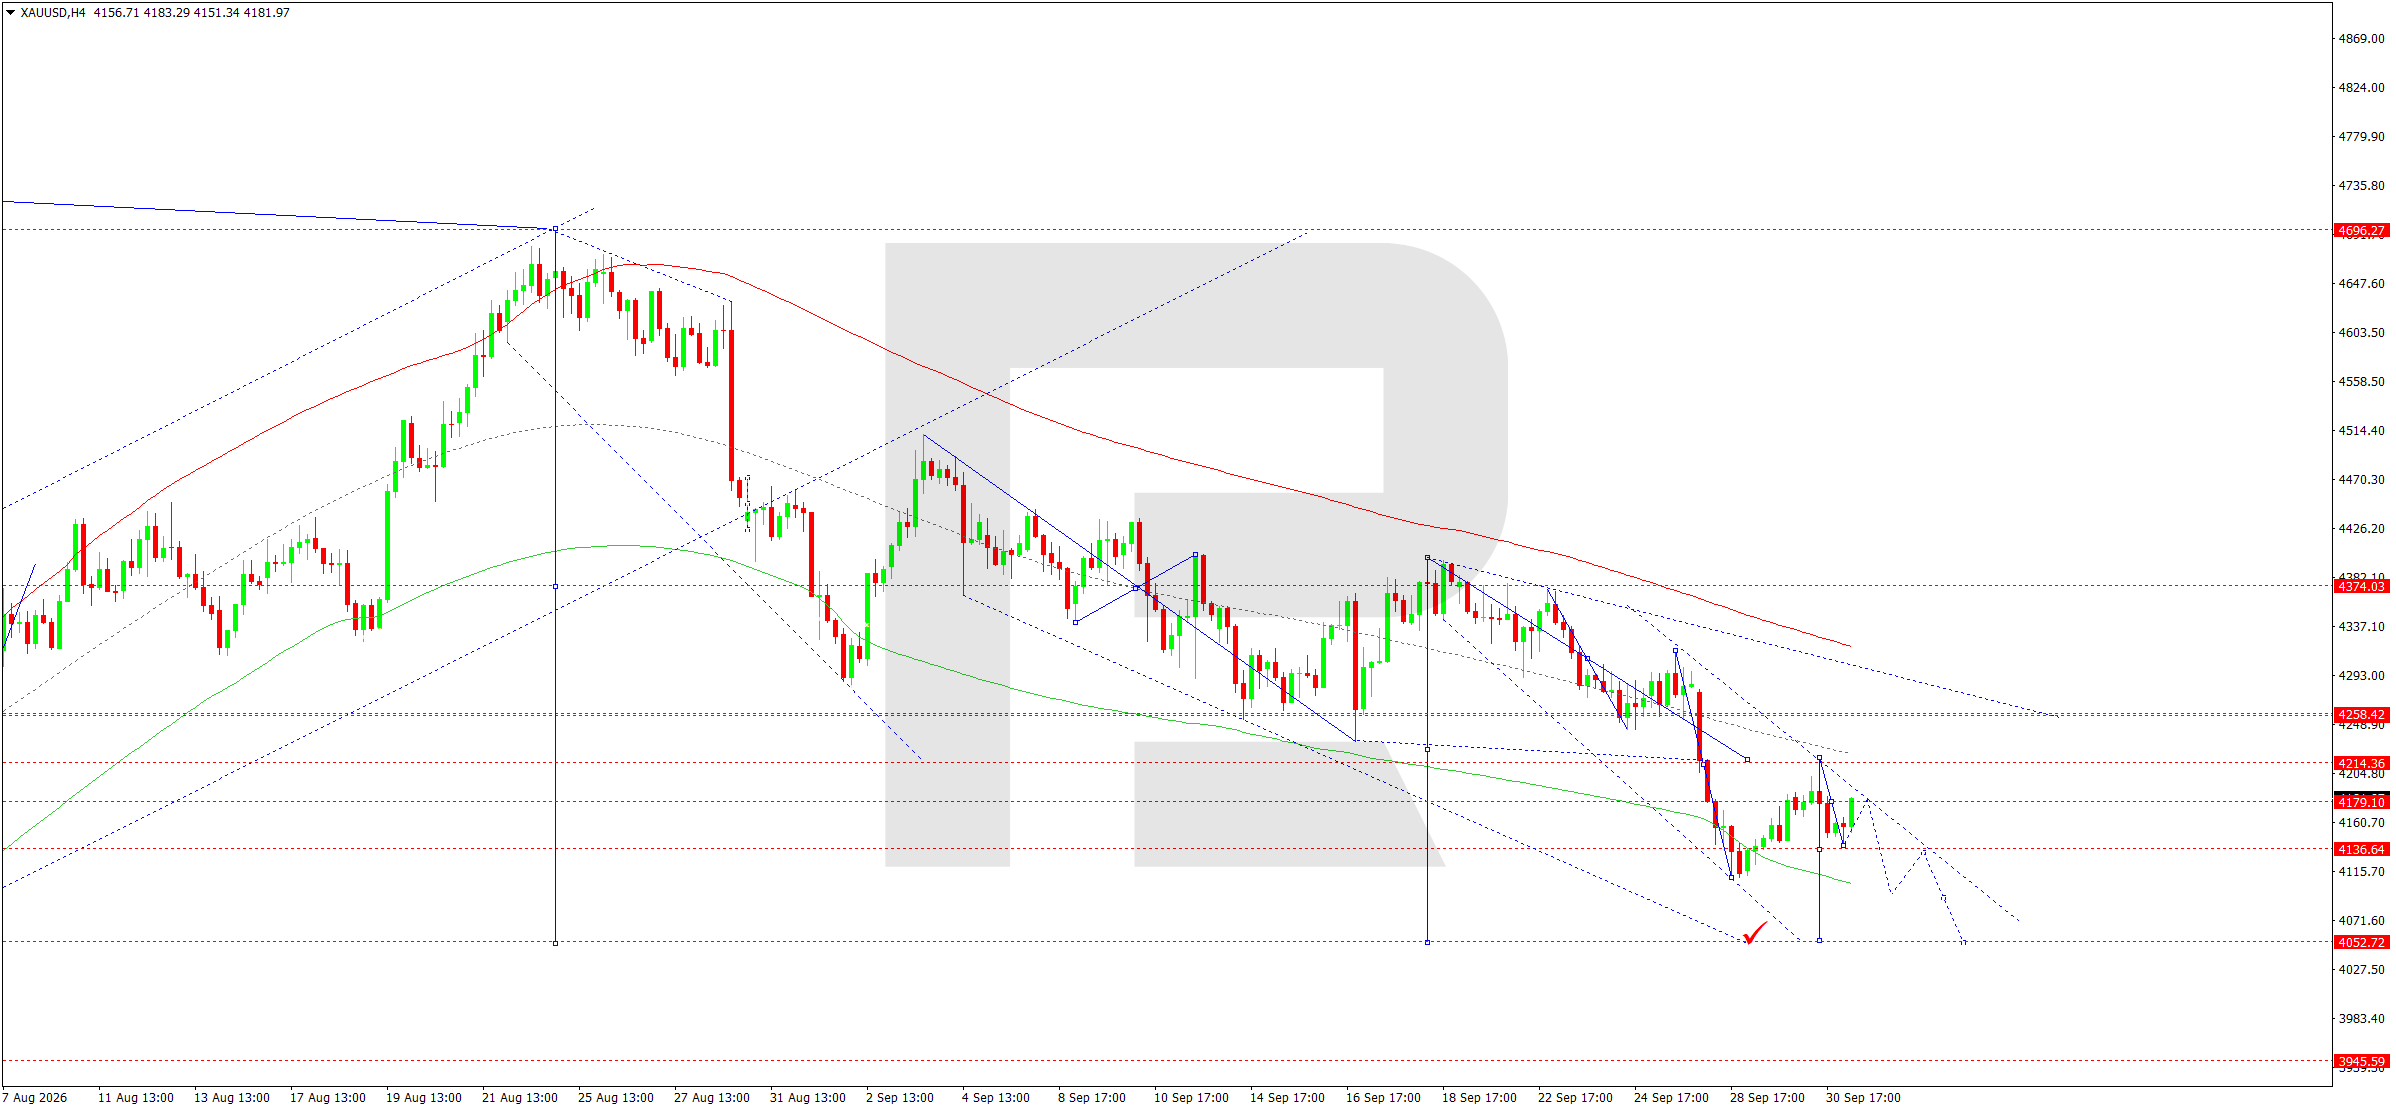
On the H4 chart, XAUUSD continues to develop a downward structure and formed a low around 4,141. On 1 October, a local consolidation with a corrective move towards 4,191–4,214 is likely. Once the correction is complete, priority shifts back to sellers.
The declining-wave Matrix has a pivot at 4,374. The price is significantly below it, while the Price Envelope lines have a negative slope. This confirms that the main downtrend remains intact. The current 4,191–4,214 area is viewed as the nearest resistance, while support levels at 4,137 and 4,053 lie below the market.
If the price fails to consolidate above 4,214, the correction will be viewed as a retest within the downtrend. Once it is complete, another move towards 4,137 and then 4,053 is expected. A breakout below 4,053 could materially extend the downward structure.
XAUUSD forecast scenario
Trading scenario: SELL
- Price at the time of writing: 4,187
- Entry price: 4,182
- Stop Loss: 4,214
- Take Profit: 4,053
- Risk-to-reward ratio: 1:4.03
The trade idea is valid until 8:00 AM on 2 October 2026 (server time, UTC+3).
US 500 forecast
The US equity market starts the fourth quarter amid elevated bond yields and mixed macroeconomic signals. At the close on 30 September, the S&P 500 edged lower, while the Nasdaq ended the day higher. At the same time, the indices closed a second consecutive quarter with gains. The latest US data showed moderate inflationary pressure, somewhat reducing expectations of renewed tightening by the US Federal Reserve (Fed), although Treasury yields remain near multi-year highs.
High market rates remain the main fundamental constraint on equity valuations. Growth companies are particularly sensitive because their valuations depend more heavily on discounting future cash flows. At the same time, the technology sector is supported by sustained demand for artificial intelligence infrastructure. The market picture remains uneven: September was characterised by weakness across a broad range of index components despite the relative resilience of the largest technology companies.
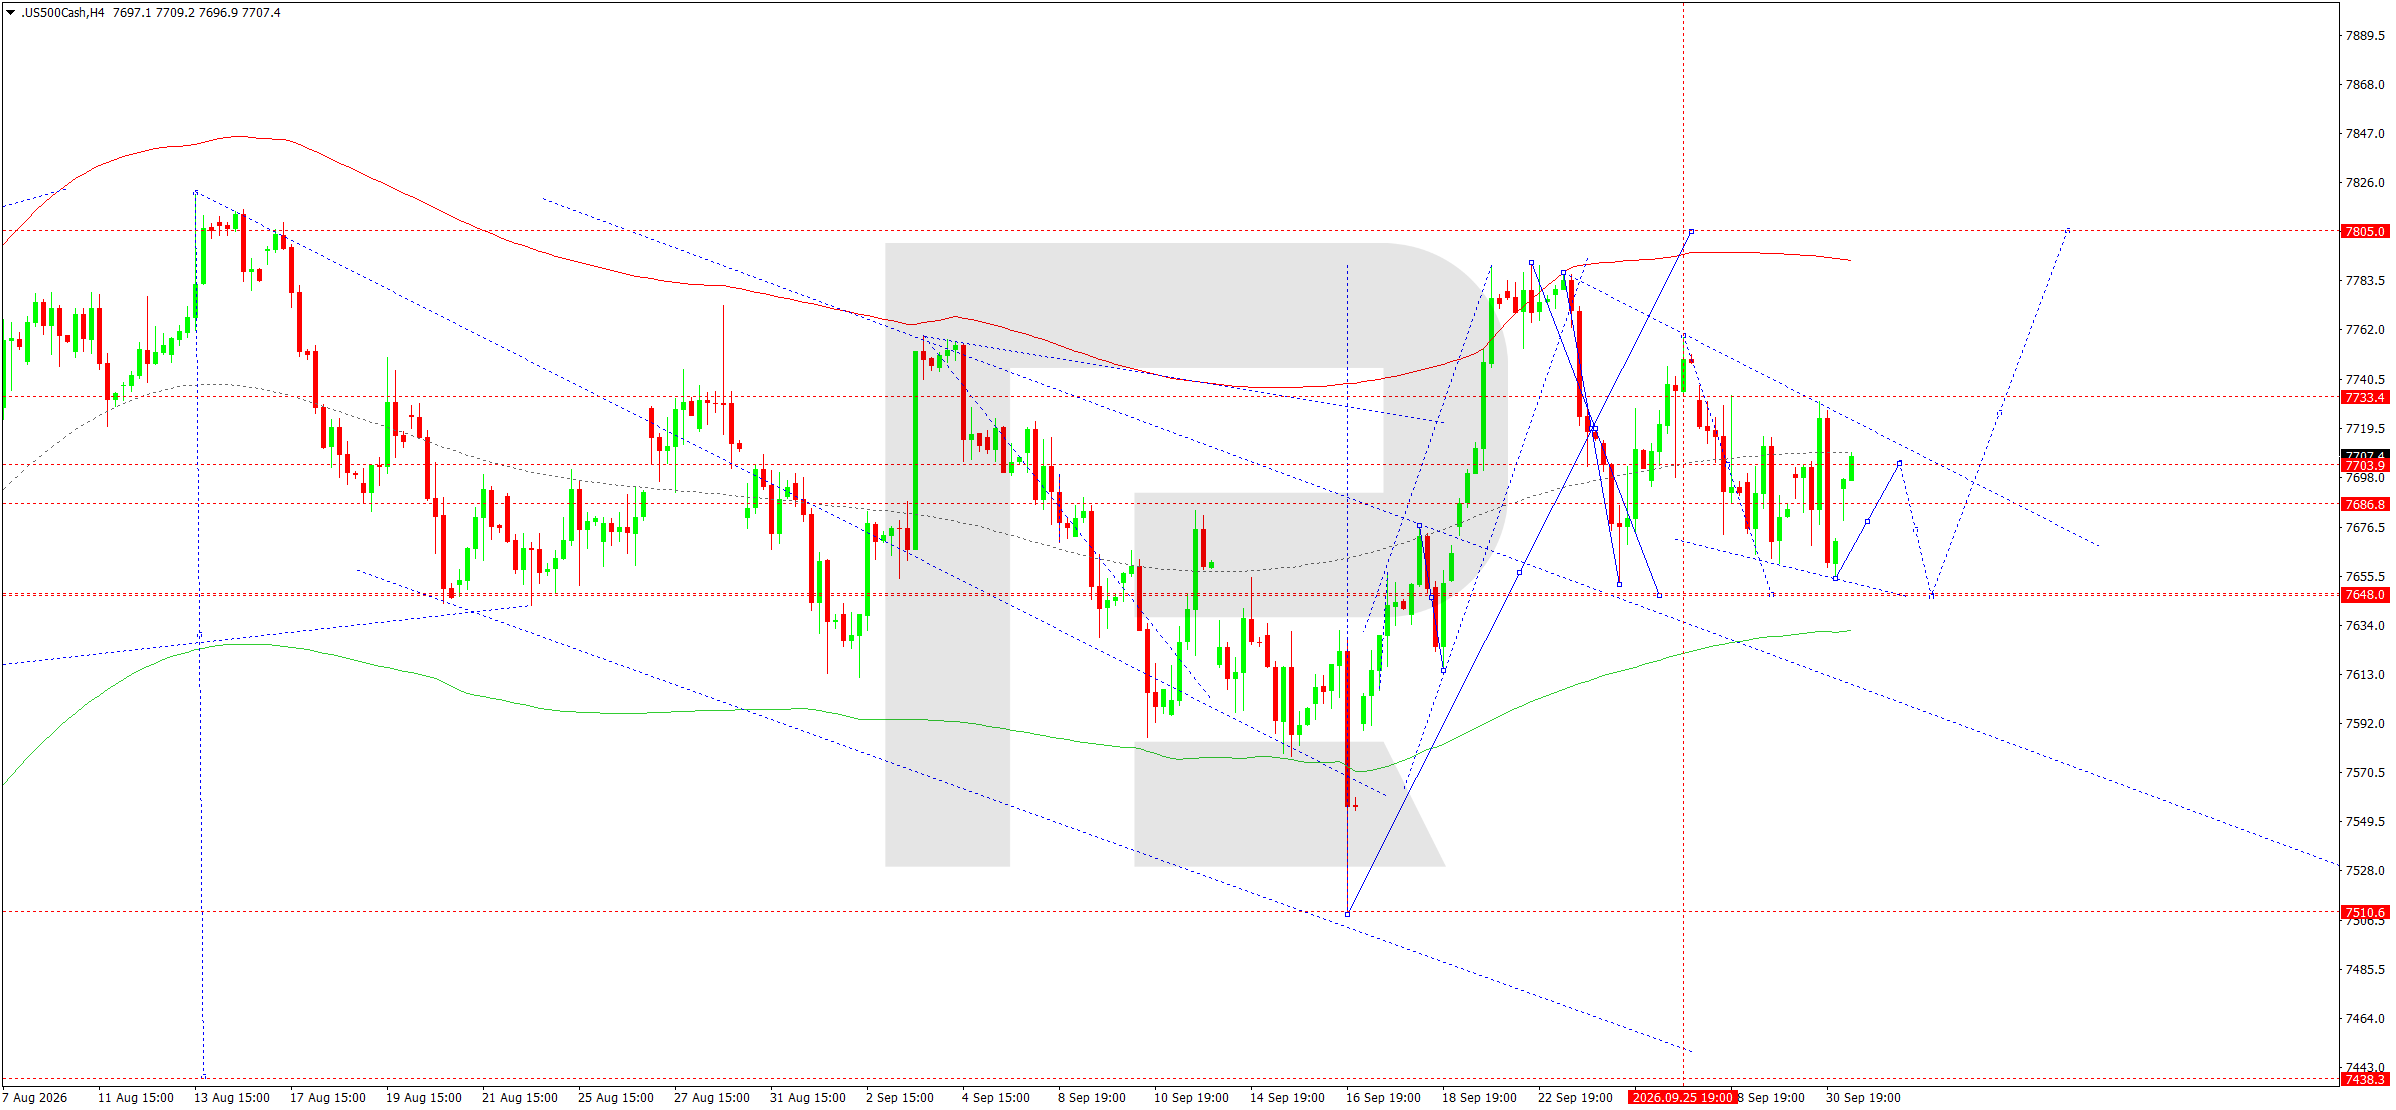
On the H4 chart, the US 500 previously formed an upward wave towards 7,729 before declining to 7,655. The price has now returned to the 7,700 area, where a consolidation structure is forming. The main reference point is the direction of the breakout from this range.
The wave Matrix has a pivot around 7,650. While the index remains above it, the medium-term structure retains recovery potential. However, the descending trendline above the market limits buyers. The nearest resistance is at 7,733. A breakout above it could open the way towards 7,805.
Before growth develops, the chart structure allows for another decline into the 7,648–7,645 area. This zone is both important support and a potential point for the correction to end. Therefore, for 1 October, the base sequence assumes an extension of the consolidation to the downside, after which a new upward wave may form. Consolidation above 7,733 would confirm a move towards 7,805.
US 500 forecast scenario
Trading scenario: SELL
- Price at the time of writing: 7,704
- Entry price: 7,699
- Stop Loss: 7,733
- Take Profit: 7,648
- Risk-to-reward ratio: 1:1.50
The trade idea is valid until 8:00 AM on 2 October 2026 (server time, UTC+3).
BTCUSD forecast
BTCUSD starts October after a period of high volatility, remaining sensitive to global risk appetite, the US dollar, and US bond yields at the same time. At the end of September, Bitcoin traded around 83,000 USD, and the subsequent recovery brought the market back towards the 84,000 area. The high cost of dollar funding and rising US government bond yields remain constraining factors for cryptocurrencies because they increase the appeal of fixed-income instruments.
The US Federal Reserve (Fed) remains the key macroeconomic factor for digital assets. More moderate US inflation has eased some concerns about further rate increases, although the debt market has yet to show a sustained decline in yields. Therefore, liquidity conditions cannot be regarded as unequivocally favourable for Bitcoin. At the same time, the start of a new quarter may lead institutional participants to rebalance portfolios, increasing the likelihood of sharp moves. Against this backdrop, BTCUSD's ability to hold the range formed in September is especially important.
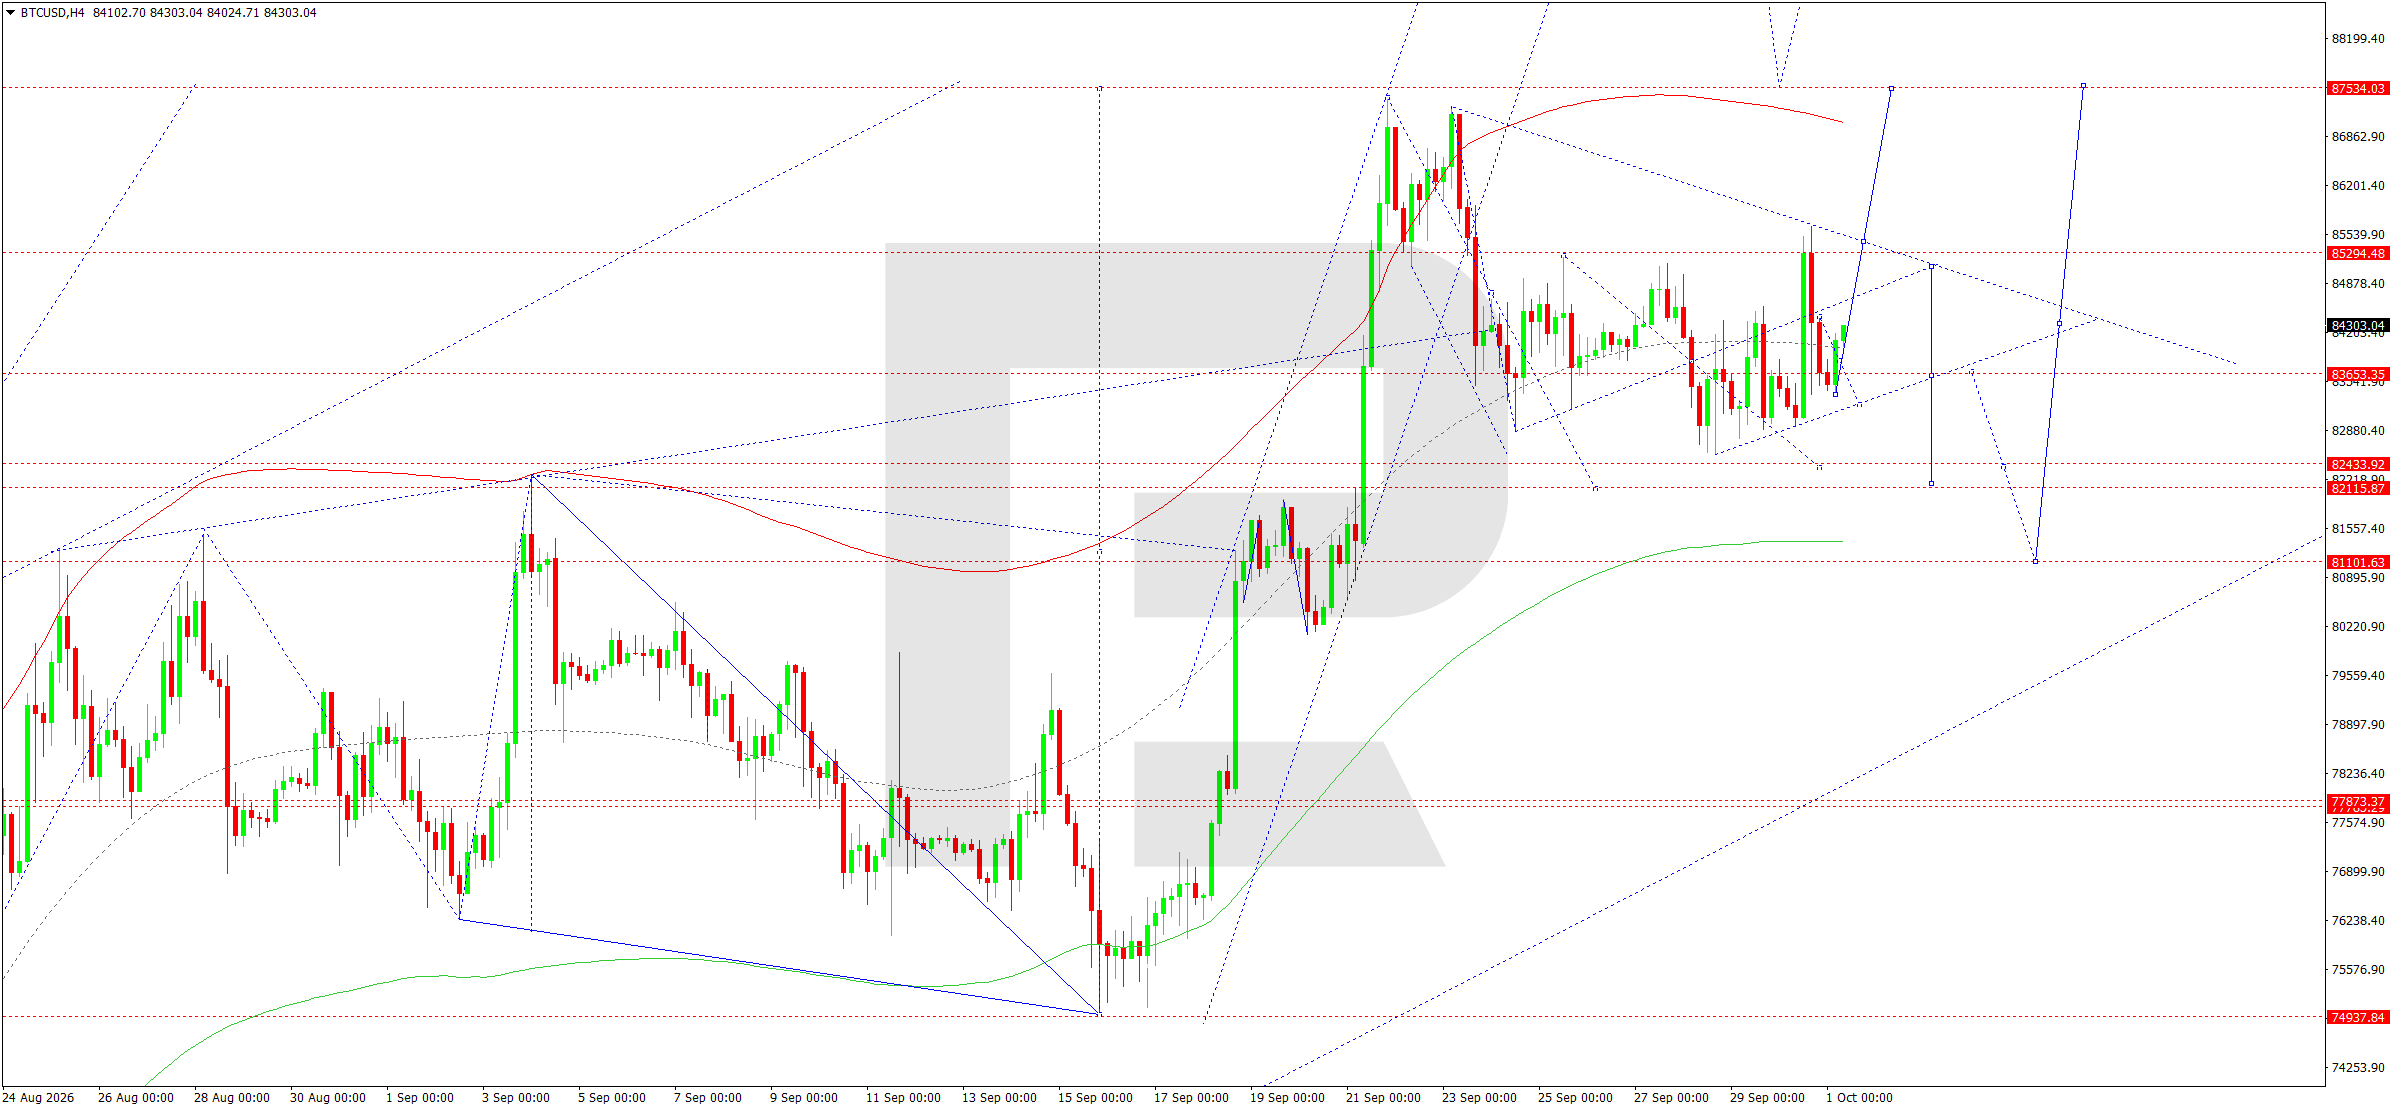
On the H4 chart, BTCUSD formed a broad consolidation after a strong impulse towards 87,534. The price repeatedly held above the 82,111–82,434 area, while resistance is located around 85,295. The current structure initially allows for a recovery towards 84,433–85,295, but does not yet confirm that the correction has fully ended.
The Matrix of the current structure has a pivot around 81,101. The price is above this level but remains below the upper boundary of the Price Envelope and below the September high. Therefore, a rise towards 84,433 may form only another corrective leg.
Key support remains at 83,653. A loss of this level would restore selling pressure and open the way towards 82,434–82,111. In the broader scenario, a test of 81,101 remains possible. For 1 October, the preferred approach is to work from the expected completion of the local rise: after a test of 84,433, a move back down is expected. A breakout above 85,295 would invalidate the nearest bearish scenario and allow the market to retest 87,534.
BTCUSD forecast scenario
Trading scenario: SELL
- Price at the time of writing: 84,160
- Entry price: 84,155
- Stop Loss: 85,295
- Take Profit: 82,111
- Risk-to-reward ratio: 1:1.79
The trade idea is valid until 8:00 AM on 2 October 2026 (server time, UTC+3).
Editors’ picks
 EURUSD forecast 2026–2027: technical analysis, price levels & predictions
The EURUSD outlook for 2026 and 2027: key levels on the daily chart, three trading scenarios and the policy gap between the Fed and the ECB that drives the pair.
 Gold (XAUUSD) forecast 2026: technical analysis, price levels & predictions
Where gold could trade in 2026: key levels, three trading scenarios with entry triggers and the forecasts from J.P. Morgan, Deutsche Bank and Goldman Sachs.
Forecasts presented in this section only reflect the author’s private opinion and should not be considered as guidance for trading. RoboForex bears no responsibility for trading results based on trading recommendations described in these analytical reviews.