
Daily technical analysis and forecast for 2 October 2026
Daily technical analysis and forecast for EURUSD, USDJPY, GBPUSD, AUDUSD, USDCAD, XAUUSD, US 500, and BTCUSD for 2 October 2026.
Each scenario on this page reflects the market structure on the H4 chart as of 10:00 UTC+3 on 2 October 2026. The assessment considers the current H4 chart structure, key support and resistance levels, the direction of the medium-term movement, and the prevailing fundamental backdrop.
EURUSD forecast
EURUSD starts Friday's session under continued pressure from the US currency. The Dollar Index has risen to around a 17-month high, while the euro remains near its lowest levels since May 2025. The main factor remains the rise in long-term US bond yields and the broader move by investors away from European debt assets. A worsening assessment of France's fiscal risks and the widening yield spread between French and German bonds are adding further pressure on the euro.
The focus remains on US Federal Reserve policy. Following more dovish comments from John Williams and Philip Jefferson, the market sharply reduced expectations of an October rate hike. However, long-term yields remain high, so fundamental support for the dollar has not disappeared completely.
Today's key catalyst will be the September US employment report: strong data could revive expectations of tighter Fed policy, while weak figures could trigger a dollar correction. Eurozone inflation data and the further stance of the European Central Bank are also important for the euro. Until the US data is released, the balance of factors remains more favourable to the dollar.
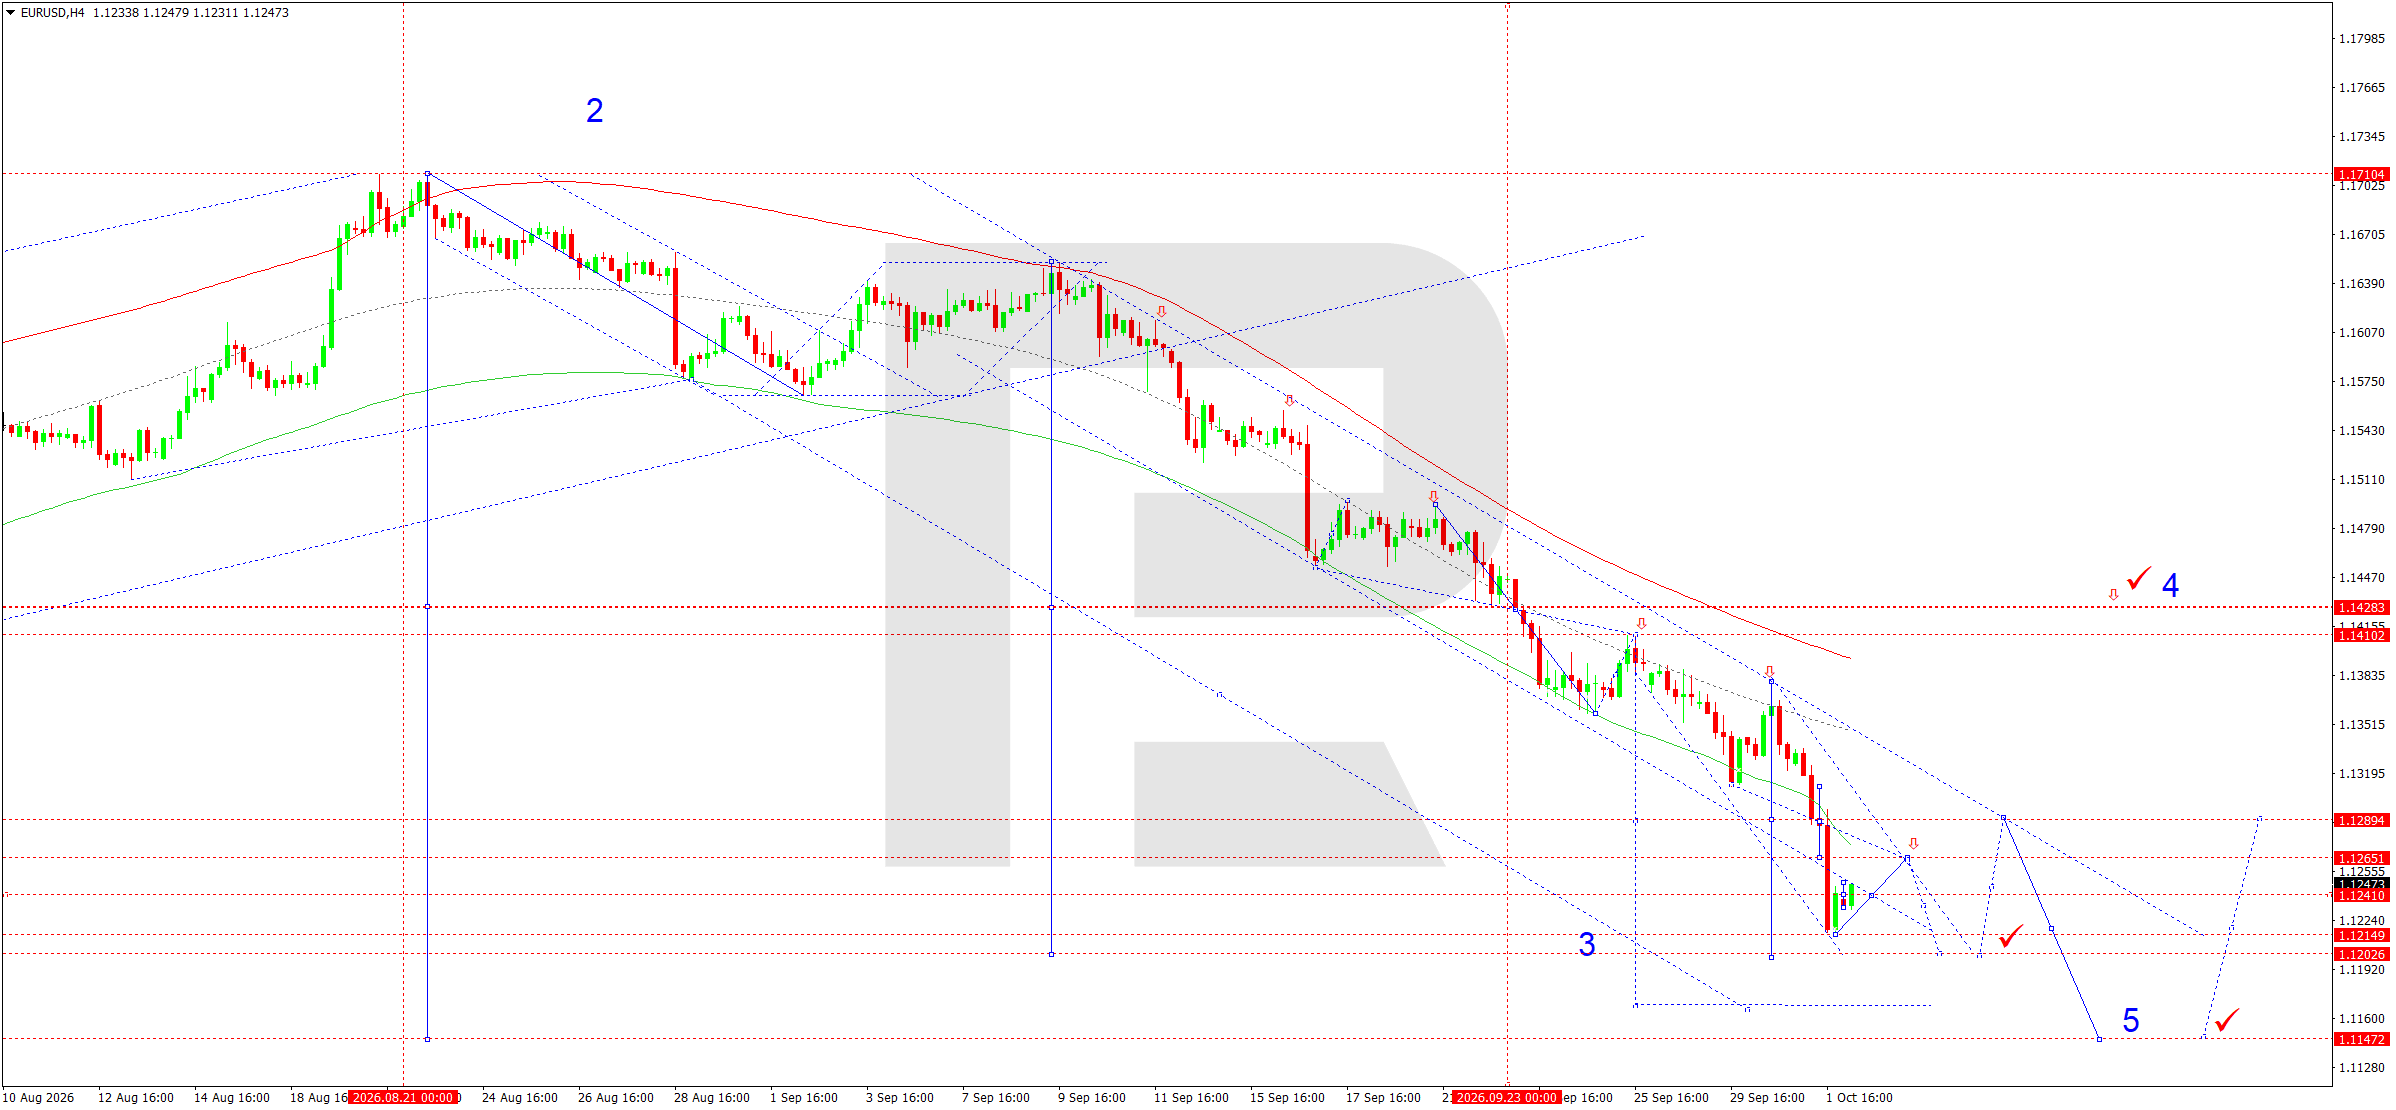
On the H4 chart, EURUSD retains a stable downtrend. The market formed a downward wave towards 1.1215 and moved into a local correction from this support level. A recovery towards 1.1265 remains likely on 2 October. A breakout above this resistance level could temporarily extend the correction towards 1.1290, although while the price remains within the descending channel, such growth is viewed primarily as corrective.
The wave matrix with a pivot at 1.1483 confirms that the bearish structure remains intact. After breaking below 1.1265, the market reached the lower area of the Price Envelope around 1.1215. The immediate objective for buyers is to reclaim the 1.1265 level and retest it from below. Once the correction is complete, the next downward move towards 1.1203 is expected. A breakout below 1.1203 would open the way towards 1.1170, after which the main wave scenario suggests a move towards 1.1147.
Therefore, a recovery towards the resistance level is best viewed as preparation for the next downward wave.
EURUSD forecast scenario
Trading scenario: SELL
- Price at the time of writing: 1.1257
- Entry price: 1.1252
- Stop loss: 1.1290
- Take profit: 1.1203
- Risk-to-reward ratio: 1:1.29
The trade idea is valid until 8:00 AM on 3 October 2026 (server time, UTC+3).
USDJPY forecast
USDJPY remains primarily sensitive to movements in US and Japanese bonds. The dollar retains a strong position in the global currency market thanks to exceptionally high long-term yields in the US. This week, the yield on 10-year US Treasuries reached levels not seen in more than two decades. At the same time, higher oil prices increase inflation risks for energy-importing Japan, creating a mixed fundamental backdrop for the yen.
The gap between US Federal Reserve and Bank of Japan policy is crucial for the exchange rate. At the same time, Fed officials have recently advocated a more cautious approach to further policy tightening. The probability of an October rate hike has fallen noticeably, so the potential for further dollar appreciation is becoming more dependent on data. Today's September US employment report could materially change market expectations: a strong labour market would support yields and USDJPY, while a weak report could intensify profit-taking on the dollar.
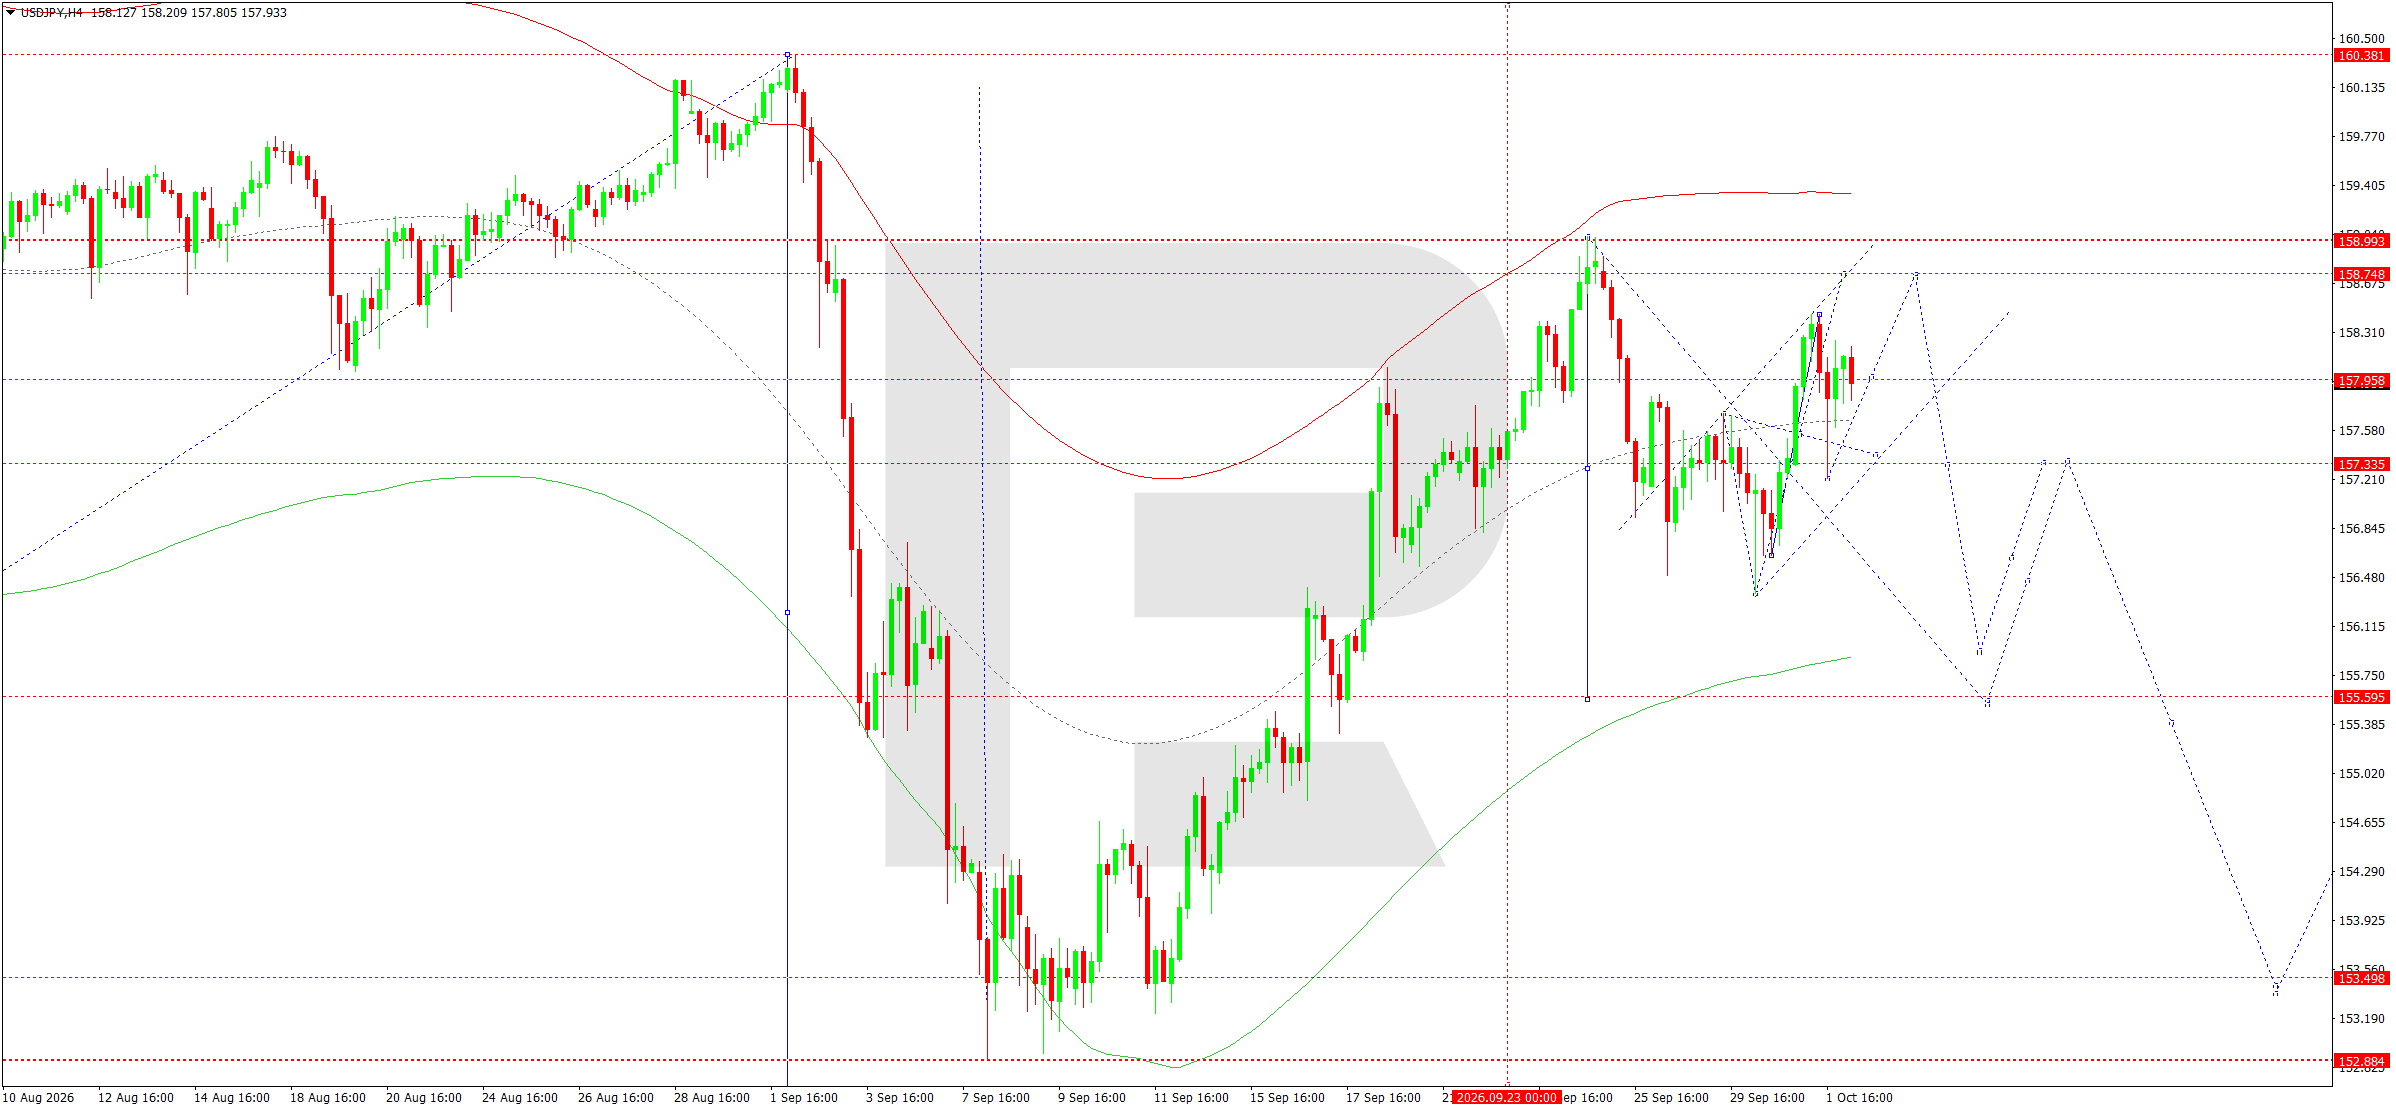
On the H4 chart, USDJPY generated upward momentum after breaking above the 157.58 level and reached 158.24. Consolidation is currently developing below local resistance. If the price moves above 158.24 again, further growth towards 158.70–158.80 remains likely. This area is also close to the upper part of the current structure and could become the zone where the corrective rise ends.
The downward wave matrix has a pivot around 157.30. After rising towards the central line of the Price Envelope around 158.40, the market failed to form a sustained continuation of the momentum. This maintains the likelihood of a return towards 157.57 and then 157.30. A breakout below 157.20 would be a technical signal for the next downward move towards 155.60.
Therefore, a rise towards 158.70–158.80 should still be viewed as a possible completion of the correction. The main medium-term scenario on the presented chart remains directed downwards. A move below 157.30 would increase selling pressure, while consolidation below 157.20 would confirm a move towards the lower boundary of the structure around 155.60.
USDJPY forecast scenario
Trading scenario: SELL
- Price at the time of writing: 157.70
- Entry price: 157.65
- Stop loss: 158.80
- Take profit: 155.60
- Risk-to-reward ratio: 1:1.78
The trade idea is valid until 8:00 AM on 3 October 2026 (server time, UTC+3).
GBPUSD forecast
GBPUSD remains under pressure from a strong US dollar. At the start of Friday, sterling fell to multi-month lows alongside several other major currencies. The US currency, by contrast, remains near a 17-month high. High US Treasury yields and the associated capital flows into dollar assets remain the key factors.
For sterling, an important factor remains the balance of expectations regarding Bank of England and US Federal Reserve policy. The US side has become somewhat less hawkish in recent days, with Fed officials Williams and Jefferson indicating that it would be appropriate to wait for additional data before the next rate hike. The probability of an October hike fell substantially after this. However, high borrowing costs at the long end of the US curve continue to support the dollar.
Today, the September US employment report will be decisive for GBPUSD's short-term dynamics. Strong employment and wage data could renew pressure on sterling, while weak figures could trigger a deeper upward correction in the pair.
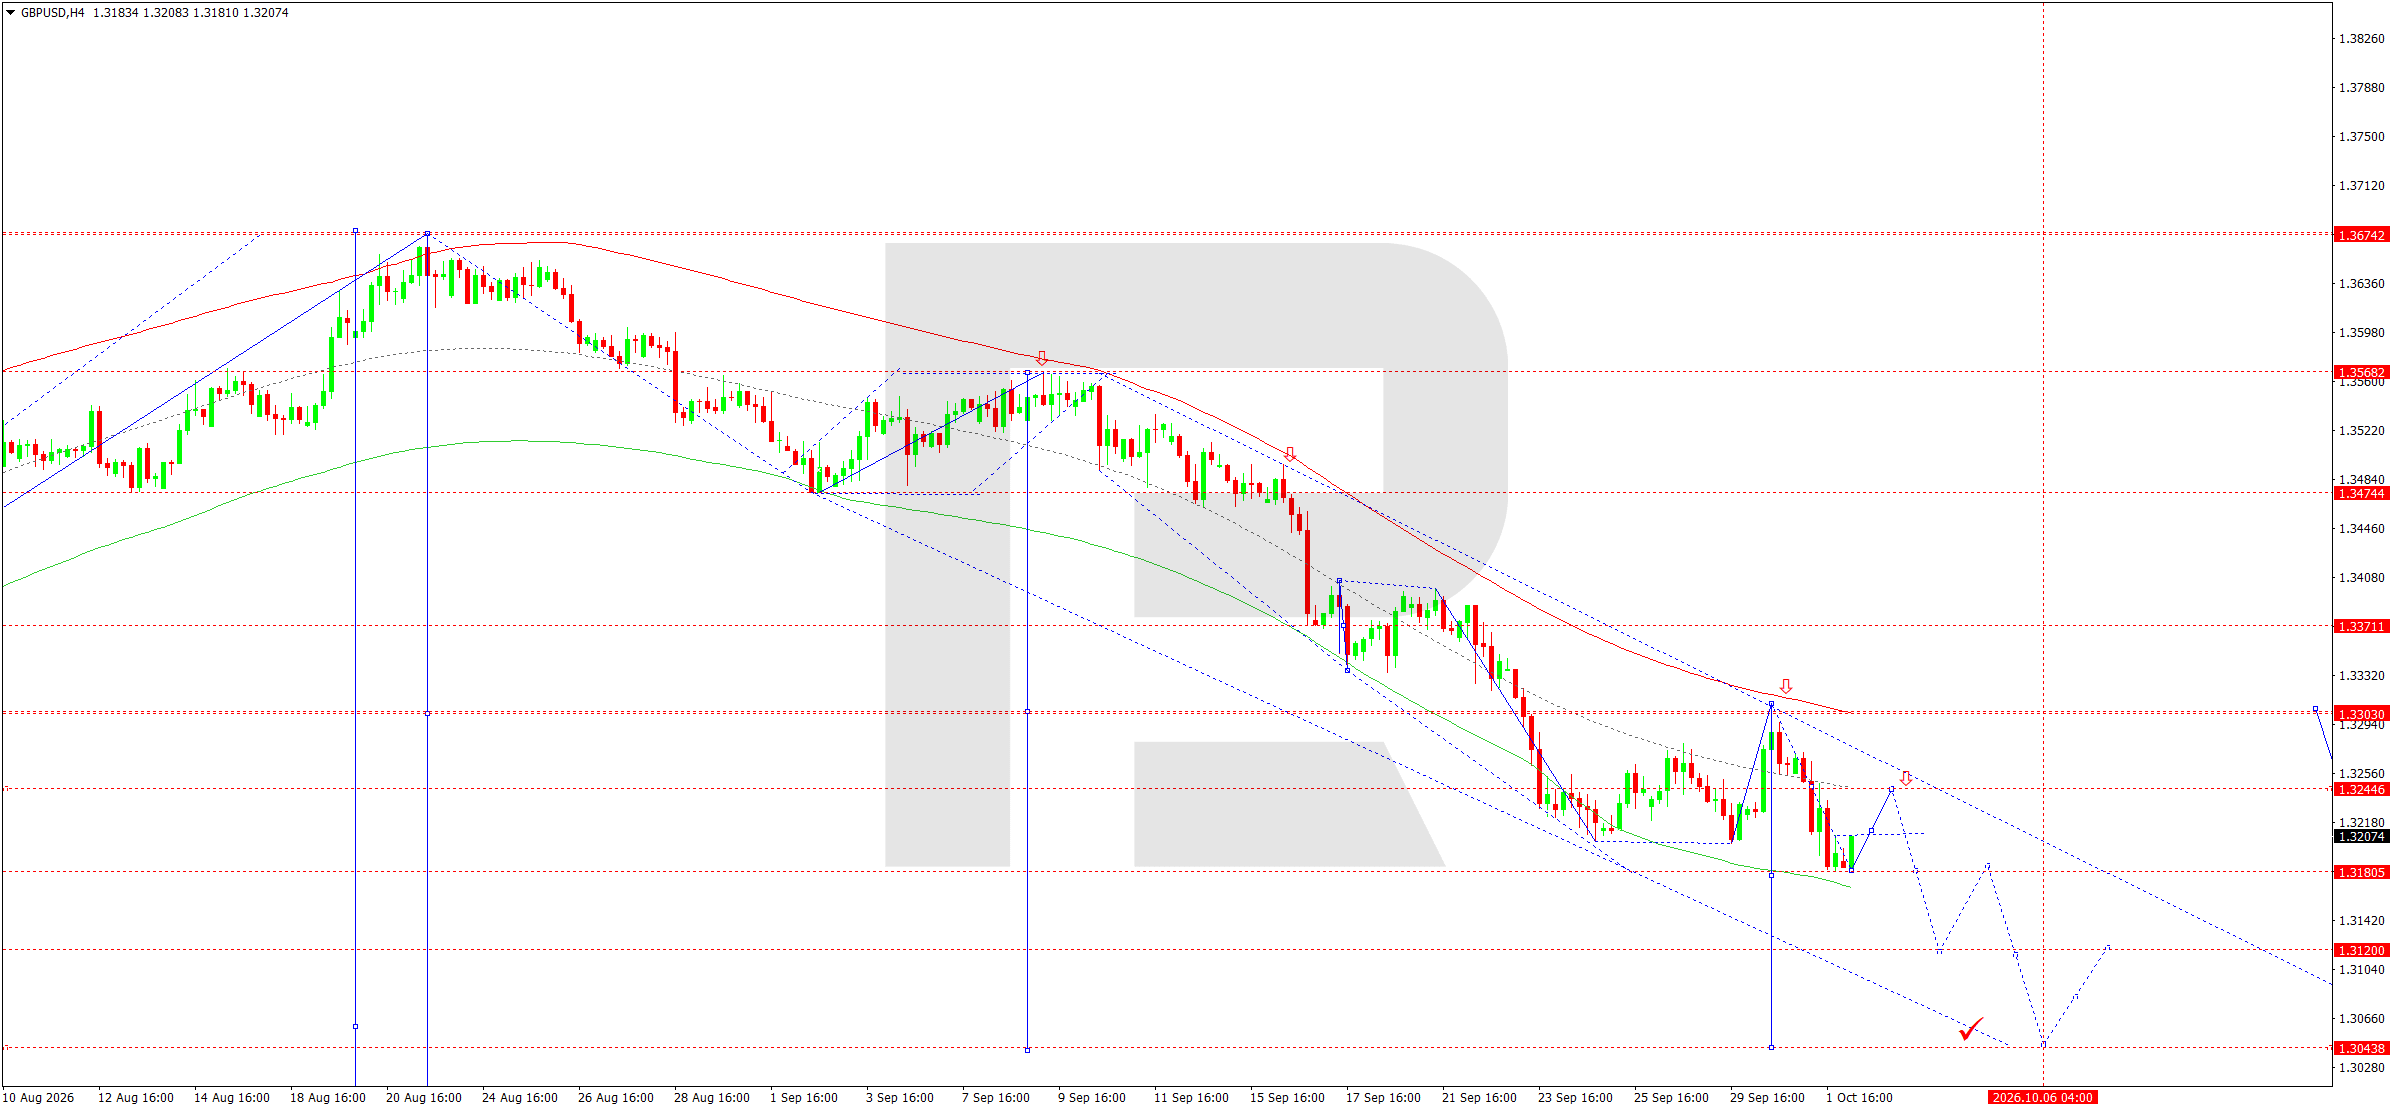
On the H4 chart, GBPUSD continues to develop a consistent downtrend. After forming another impulse, the price reached 1.3181, where local demand emerged. For 2 October, a corrective move towards 1.3244 is likely. This area acts as the nearest resistance and a potential point for the recovery to end.
The Elliott Wave structure and the declining matrix with a pivot at 1.3300 confirm the priority of the downward direction. The price is below the matrix pivot and below the main dynamic resistance levels. Once the correction towards 1.3244 is complete, the next downward impulse is expected to form.
The sellers' first objective is a retest of the 1.3181 level. A breakout below it would open the way towards 1.3120. On the presented chart, this area corresponds to the next important support in the downward structure. Therefore, a rise towards 1.3244 is viewed as a technical correction, while the main direction remains downwards. Invalidation of this scenario would require a sustained return above 1.3300.
GBPUSD forecast scenario
Trading scenario: SELL
- Price at the time of writing: 1.3215
- Entry price: 1.3210
- Stop loss: 1.3250
- Take profit: 1.3120
- Risk-to-reward ratio: 1:2.25
The trade idea is valid until 8:00 AM on 3 October 2026 (server time, UTC+3).
AUDUSD forecast
AUDUSD remains under the influence of broad US dollar strength and cautious investor sentiment towards risk assets. At the start of October, the Australian dollar is near multi-month lows. At the same time, the US dollar is trading around a 17-month high, supported by high US government bond yields and demand for the dollar amid elevated volatility in the global debt market.
For the pair, the difference in expectations regarding Reserve Bank of Australia and US Federal Reserve policy is important. Pressure from the Fed has eased somewhat after US policymakers said they need to wait for new economic data before another rate hike. The probability of an October increase has fallen substantially, although the market still expects further tightening later.
High energy costs and unstable global risk appetite remain additional risks for the Australian currency. Brent remains above 100 USD per barrel amid geopolitical and logistical risks. Today, the US employment report will determine the dollar's main direction.
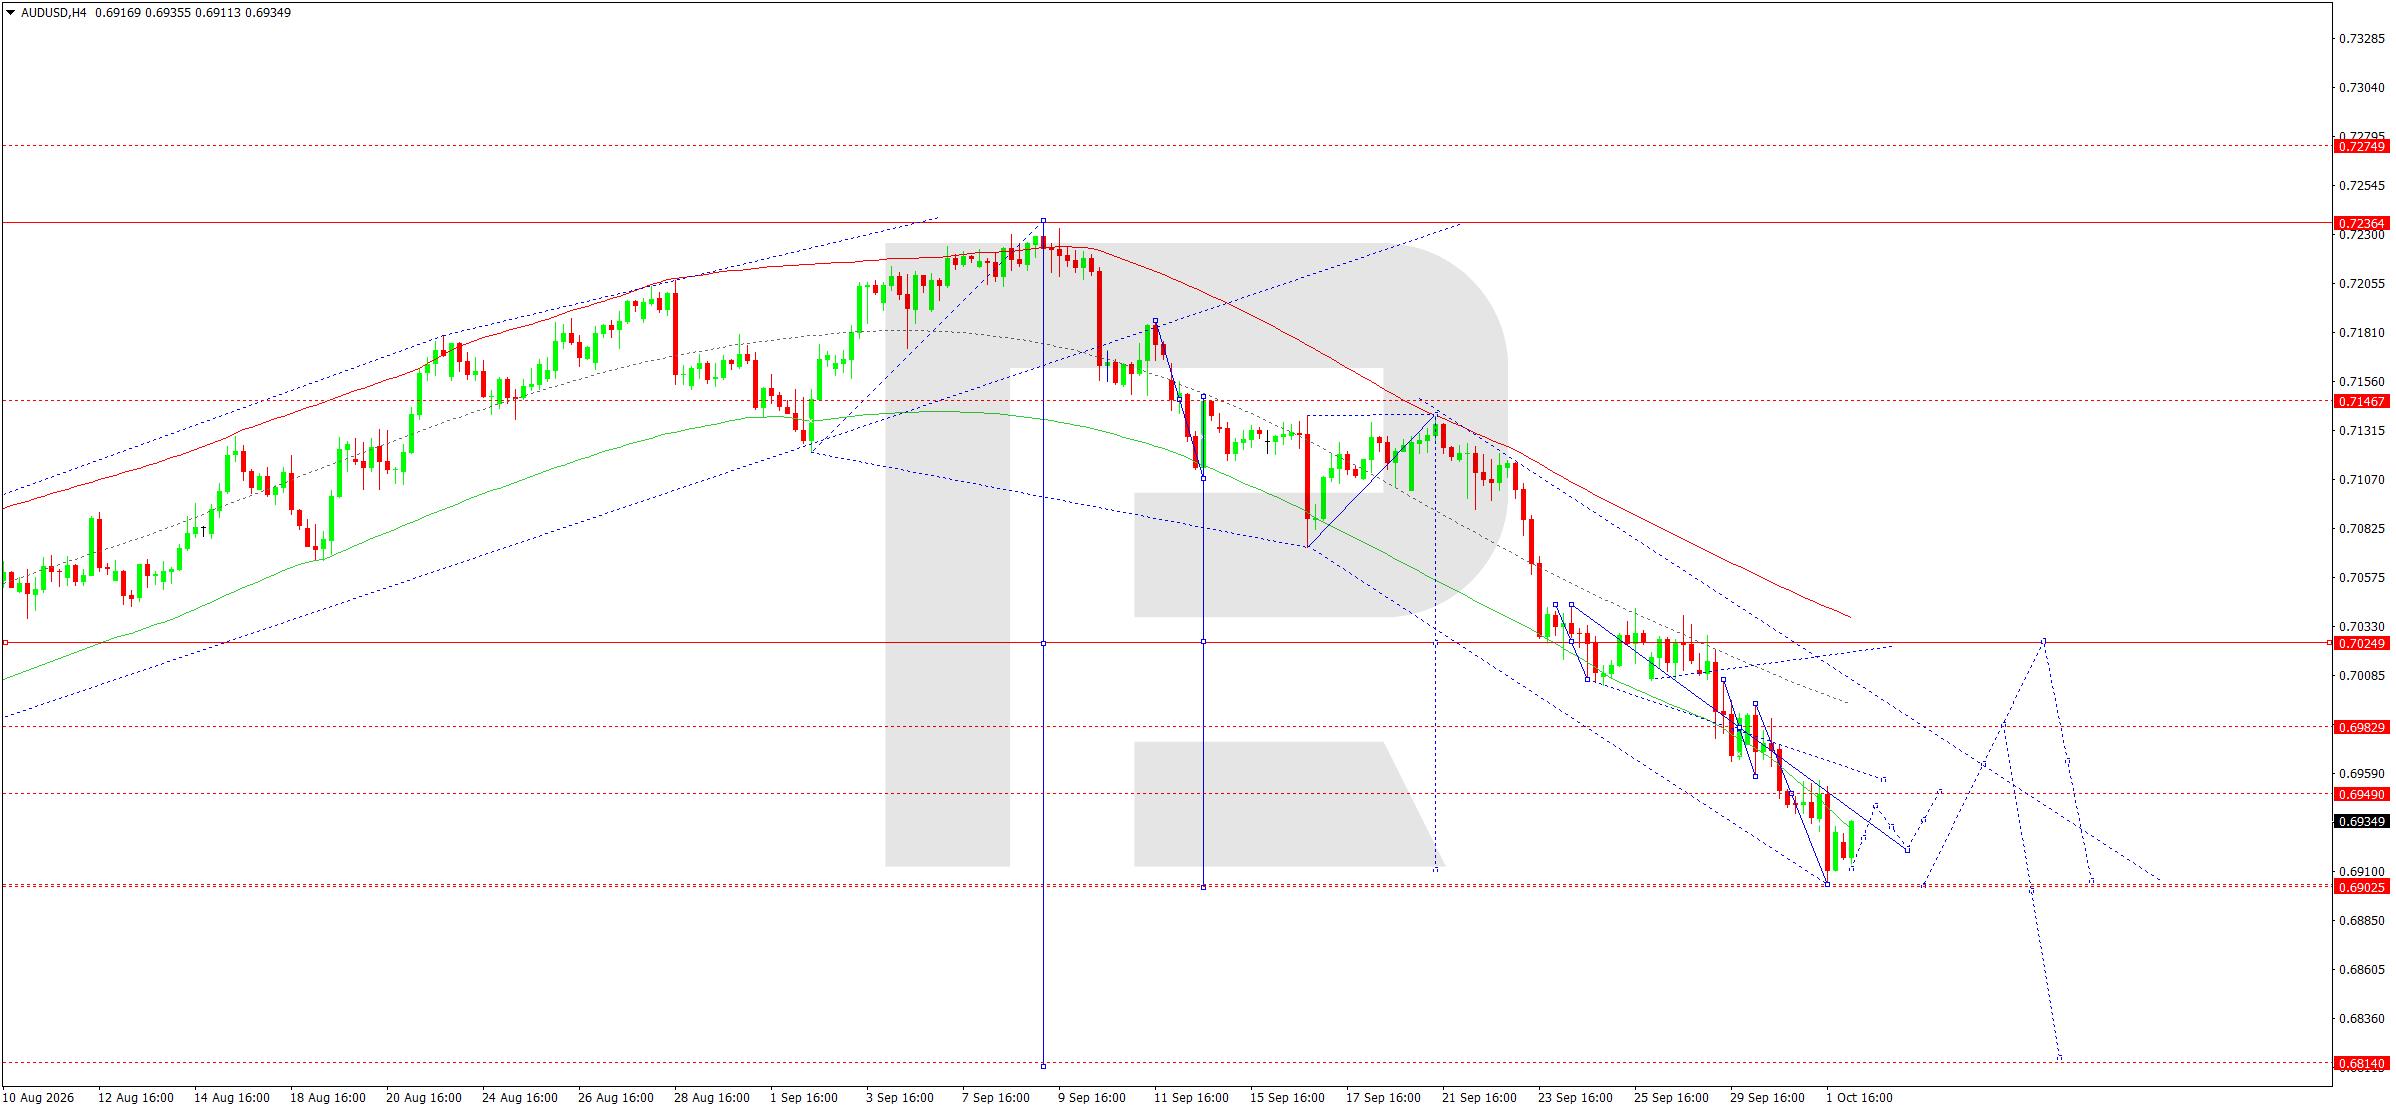
On the H4 chart, AUDUSD retains a pronounced downward structure. After a sustained decline, the market reached the key 0.6903 level and formed a local rebound from it.
For 2 October, a correction towards 0.6940 remains relevant. If the recovery extends, the nearest significant resistance level is the 0.6983 area. The downward wave matrix with a pivot at 0.7029 remains above the current price, confirming the persistence of the main bearish trend.
Once the correction is complete, another decline towards 0.6903–0.6902 is expected. A confident breakout below this support level would open the way towards 0.6860, while the next main target is 0.6810. Therefore, the current rise is viewed as a corrective move within a larger downward structure. A return above 0.7029 would be required for a material reassessment of this scenario.
AUDUSD forecast scenario
Trading scenario: SELL
- Price at the time of writing: 0.6935
- Entry price: 0.6930
- Stop loss: 0.6983
- Take profit: 0.6860
- Risk-to-reward ratio: 1:1.42
The trade idea is valid until 8:00 AM on 3 October 2026 (server time, UTC+3).
USDCAD forecast
USDCAD continues to trade near local highs amid a strong US dollar. The Dollar Index remains near a 17-month high as the global bond sell-off and rising long-term yields support demand for the US currency. At the same time, more cautious comments from US Federal Reserve officials somewhat limit the potential for further dollar appreciation: the likelihood of a rate hike as early as October has fallen substantially.
For the Canadian currency, the oil market remains an important factor. Brent is trading around 102 USD per barrel, with WTI around 93 USD. Oil prices are supported by persistent geopolitical risks and supply uncertainty, although Brent is down over the week. Canada is also accelerating its consideration of a new export oil pipeline project aimed at diversifying supplies beyond the US market.
Bank of Canada policy, oil price movements, and today's US data will determine the short-term balance. A strong US employment report could restore demand for the USD, while weak data would increase the likelihood of a USDCAD correction.
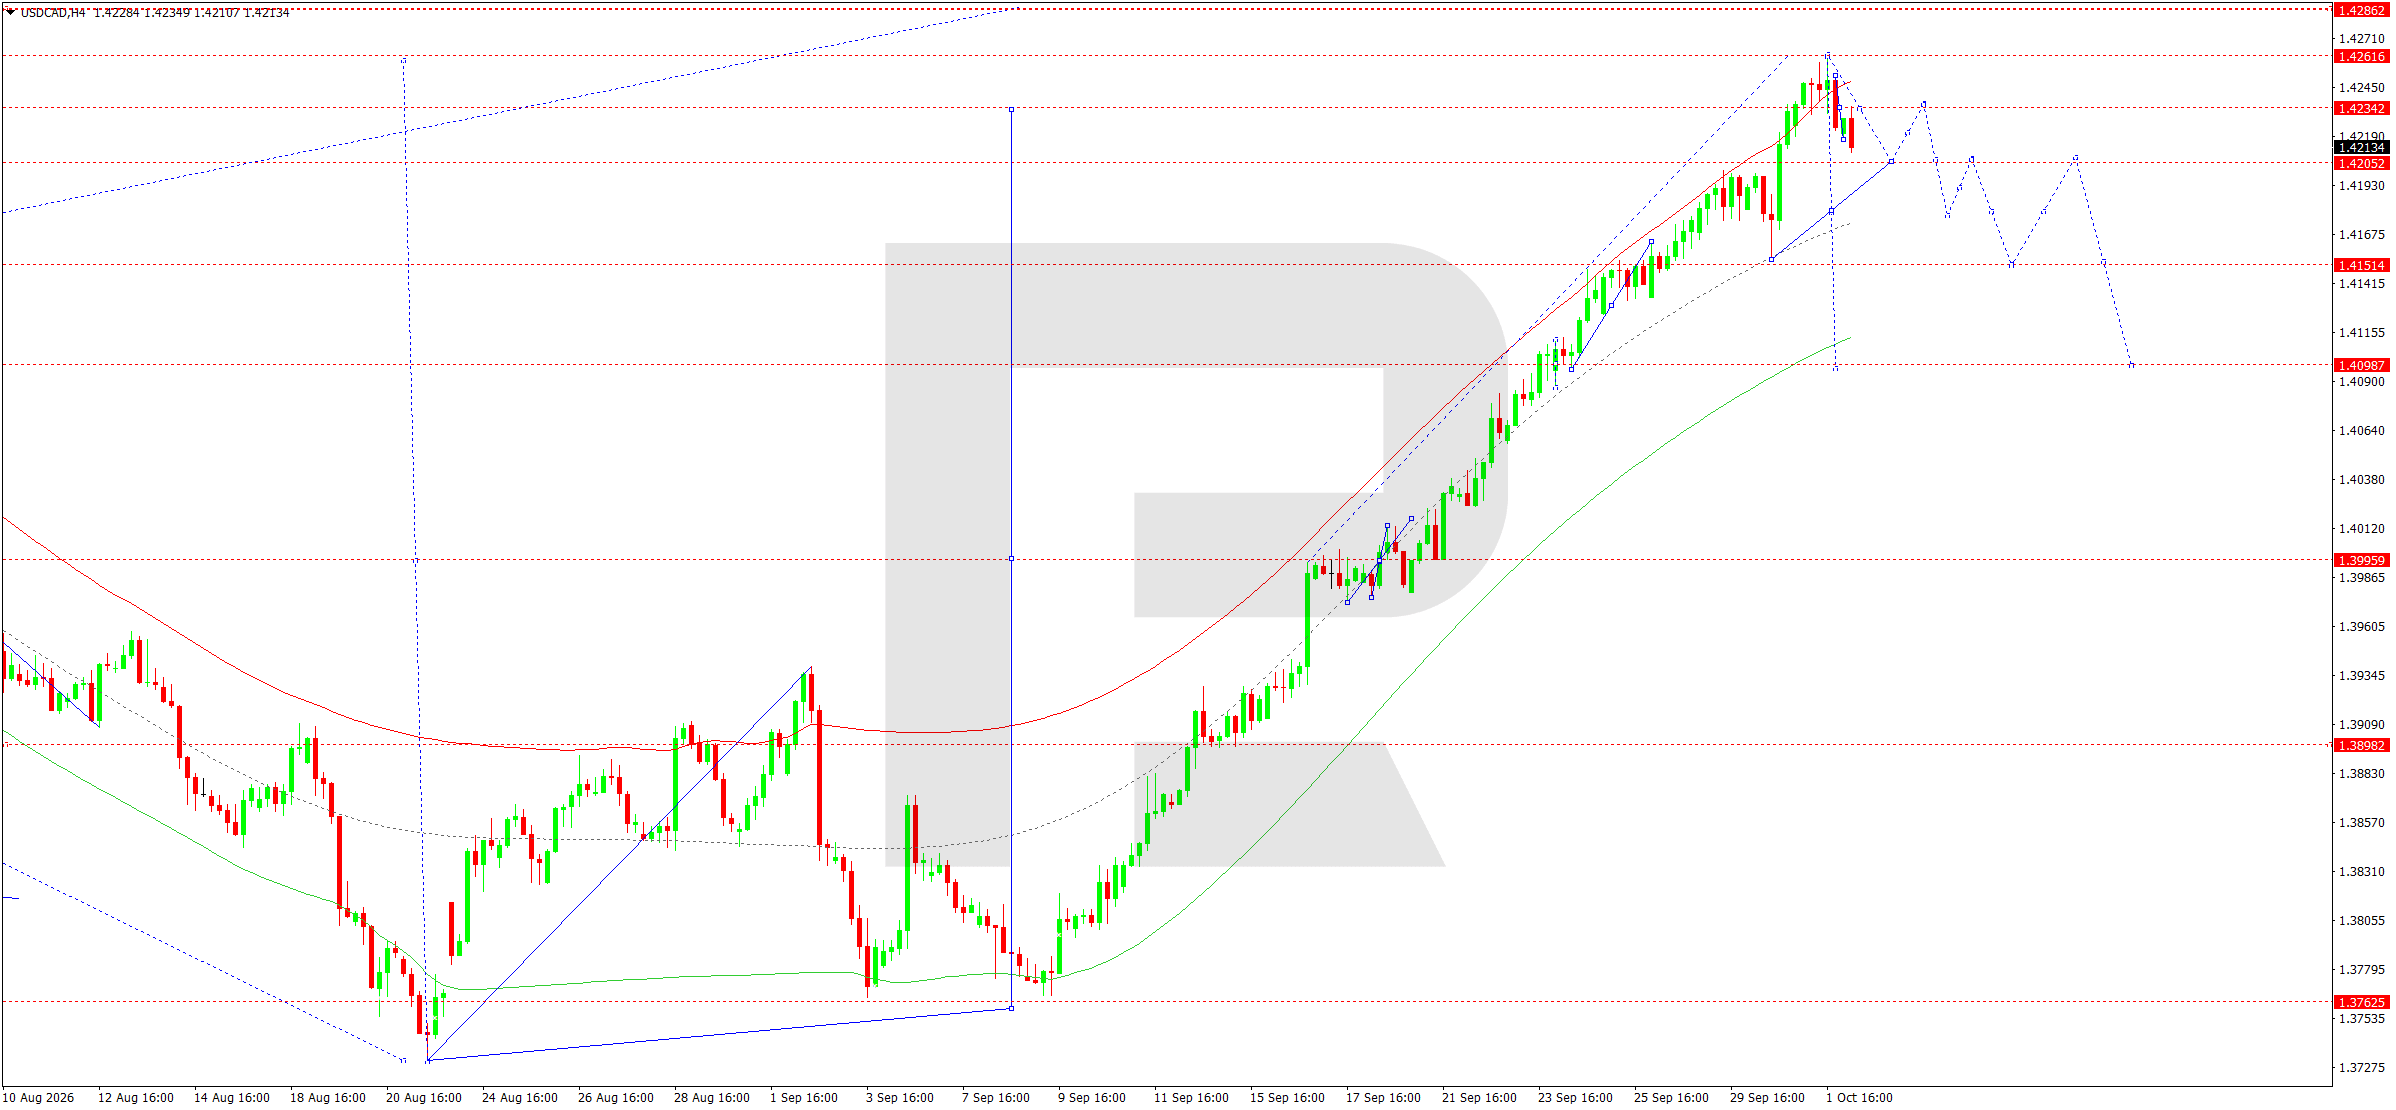
On the H4 chart, USDCAD completed a strong upward wave around 1.4261. Following a test of the structure’s upper boundary, a correction began, and the price returned to the 1.4215 area. The upward impulse is therefore losing momentum, while a local reversal area is forming near the high.
The upward wave matrix with a pivot at 1.3999 confirms that the broader uptrend remains intact, although a correction has matured within it. The key level for the near term is 1.4205. A confident breakout below it would create conditions for a continued decline towards 1.4151. Before the decline, the price could return towards 1.4232–1.4258.
However, while the market remains below 1.4261, such movement will be viewed as a retest of the supply area. The main short-term scenario is a correction towards 1.4151. A breakout below it would make the 1.4099 area, located near the lower dynamic part of the Price Envelope, the next target.
USDCAD forecast scenario
Trading scenario: SELL
- Price at the time of writing: 1.4215
- Entry price: 1.4210
- Stop loss: 1.4262
- Take profit: 1.4151
- Risk-to-reward ratio: 1:1.13
The trade idea is valid until 8:00 AM on 3 October 2026 (server time, UTC+3).
XAUUSD forecast
Gold starts 2 October amid a confrontation between two fundamental factors. On the one hand, persistent geopolitical risks support demand for safe-haven assets. On the other, a strong dollar and exceptionally high US government bond yields significantly increase the opportunity cost of holding gold. On Friday, spot gold traded around 4,188 USD and was heading for a second consecutive weekly decline.
The key factor remains the policy of the US Federal Reserve. Following softer US inflation data and cautious comments from Fed officials, the market reduced the probability of an October rate hike to around one quarter. At the same time, expectations of a possible further increase later have not disappeared completely. Yields on 10- and 30-year US Treasuries are near multi-year highs, limiting gold's recovery potential.
Today's central event is the publication of the US employment report. Stronger figures could support the dollar and yields and renew pressure on XAUUSD. A weak report, by contrast, would create conditions for a more pronounced upward correction in gold.
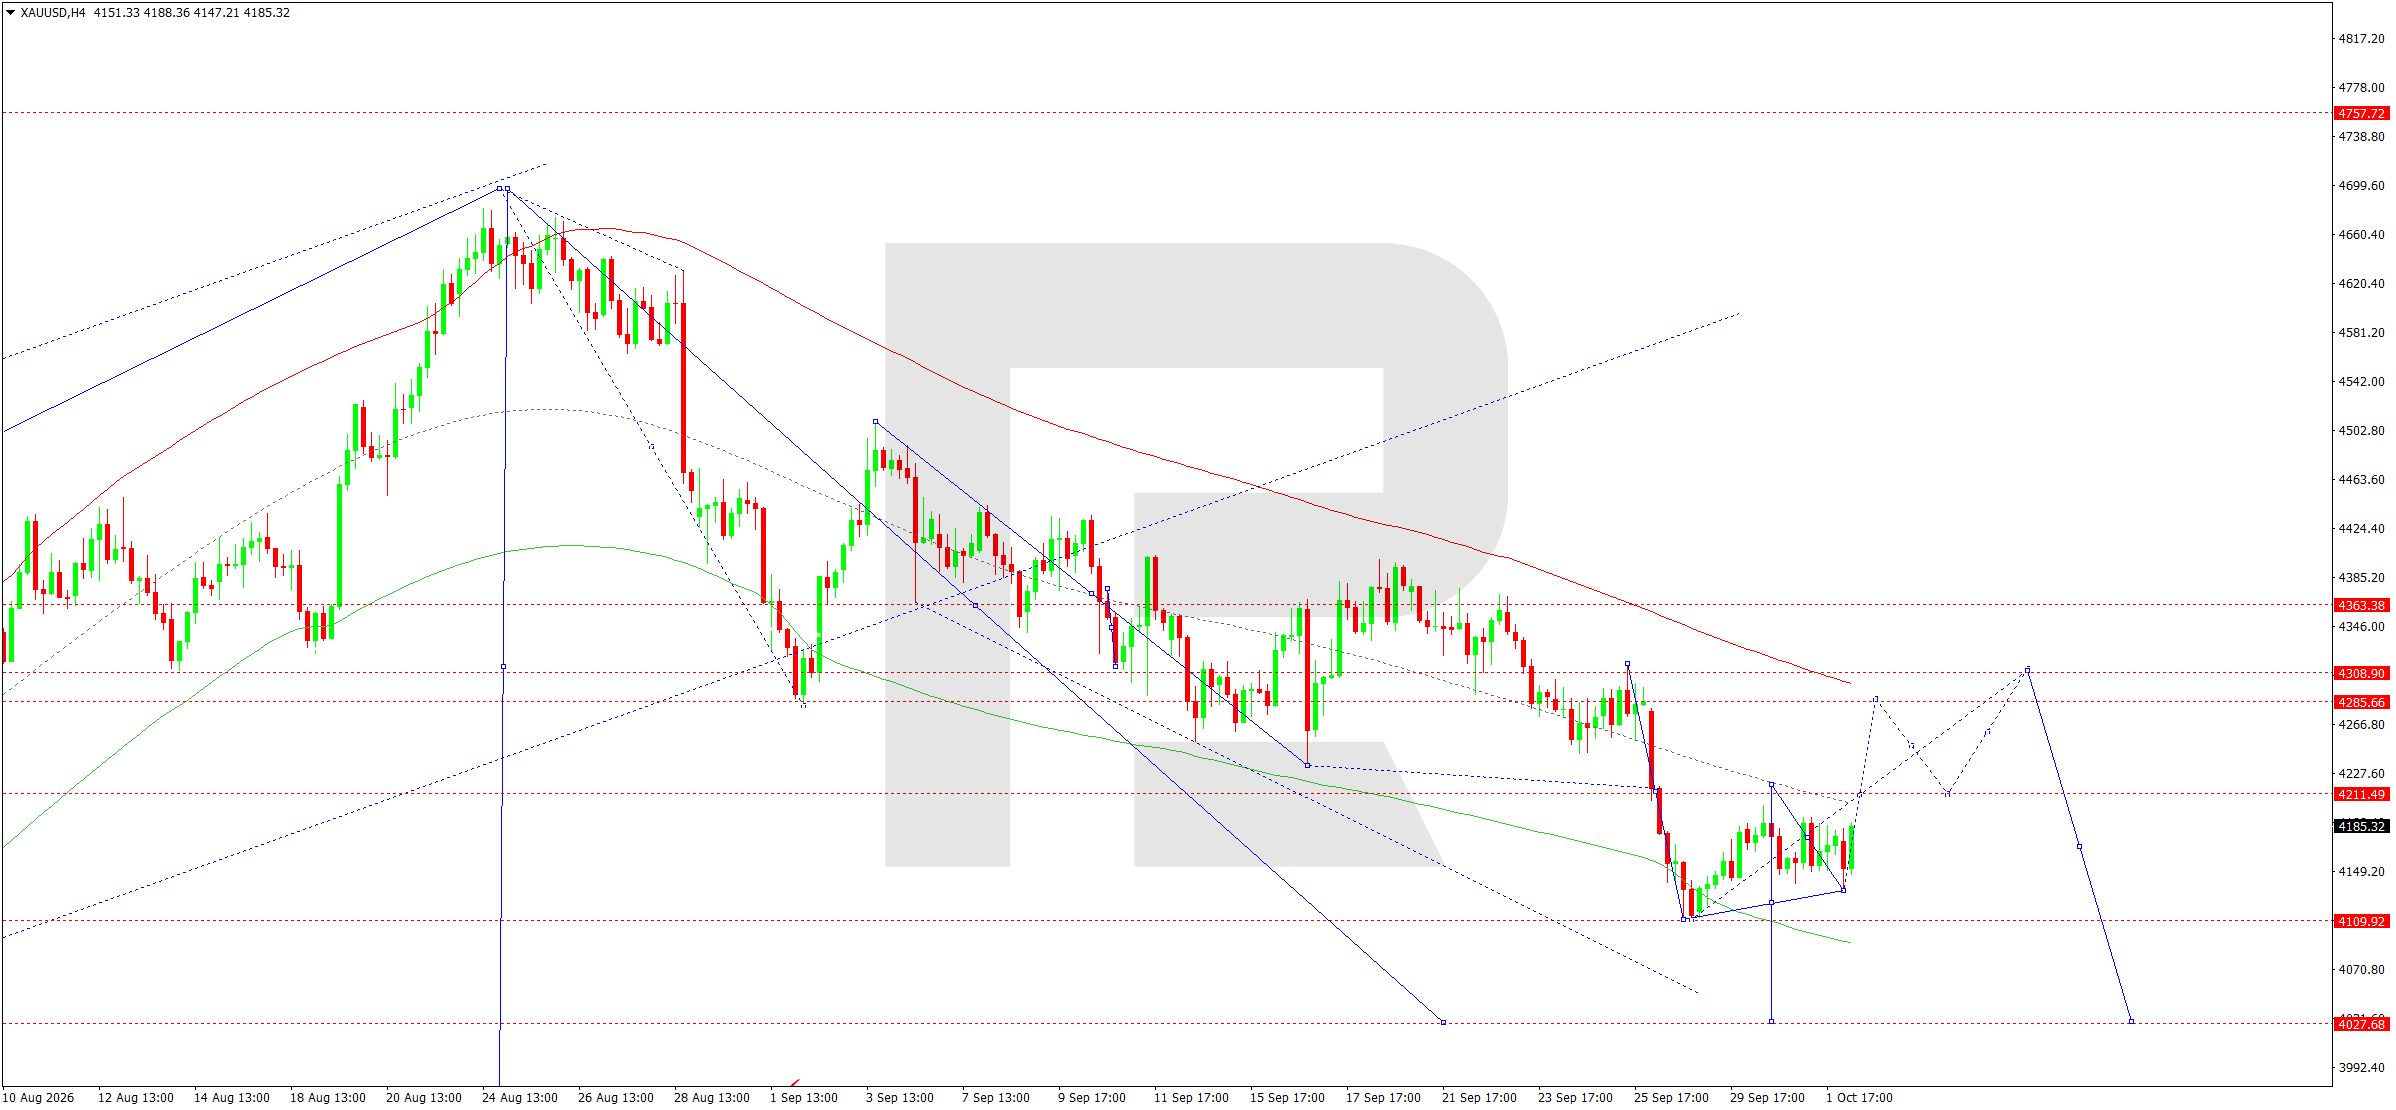
On the H4 chart, XAUUSD has formed a stable downward structure. After another impulse, the market reached the 4,110–4,135 area and formed a local base. A corrective rise is developing from this area. For 2 October, the buyers' nearest objective is the 4,195–4,212 area.
The Elliott Wave structure and the downward wave matrix with a pivot around 4,374 preserve the advantage of the main bearish scenario. The price is significantly below the matrix pivot and below the main dynamic resistance levels.
A correction towards 4,195–4,212 could complete the current recovery. After that, another downward wave is expected, with a retest of 4,110. A breakout below this support level would open the way towards 4,030, which is the main target of the presented H4 structure. Only a sustained breakout above 4,309 would materially weaken this scenario.
XAUUSD forecast scenario
Trading scenario: SELL
- Price at the time of writing: 4,183
- Entry price: 4,178
- Stop loss: 4,212
- Take profit: 4,030
- Risk-to-reward ratio: 1:4.35
The trade idea is valid until 8:00 AM on 3 October 2026 (server time, UTC+3).
US 500 forecast
The US equity market enters Friday's session amid elevated volatility in the debt market. The day before, the S&P 500 managed to recover from a two-week low and ended the session up by around 0.2%. Initially, pressure intensified as the yield on 10-year US Treasuries jumped to around a 24-year high, but the subsequent pullback in yields allowed equities to recover.
The main factor remains the policy of the US Federal Reserve. Fed officials have signalled that the regulator may wait for additional data before raising rates again. Following these comments, the market-implied probability of an October rate hike fell noticeably. This is a moderately positive factor for equities, although high long-term rates continue to weigh on company valuations.
The fundamental picture remains mixed. Corporate earnings growth in 2026 remains significant, but investors are paying increasing attention to the risk of slower spending on artificial intelligence and the impact of high financing costs. Oil prices above 100 USD also support inflation concerns.
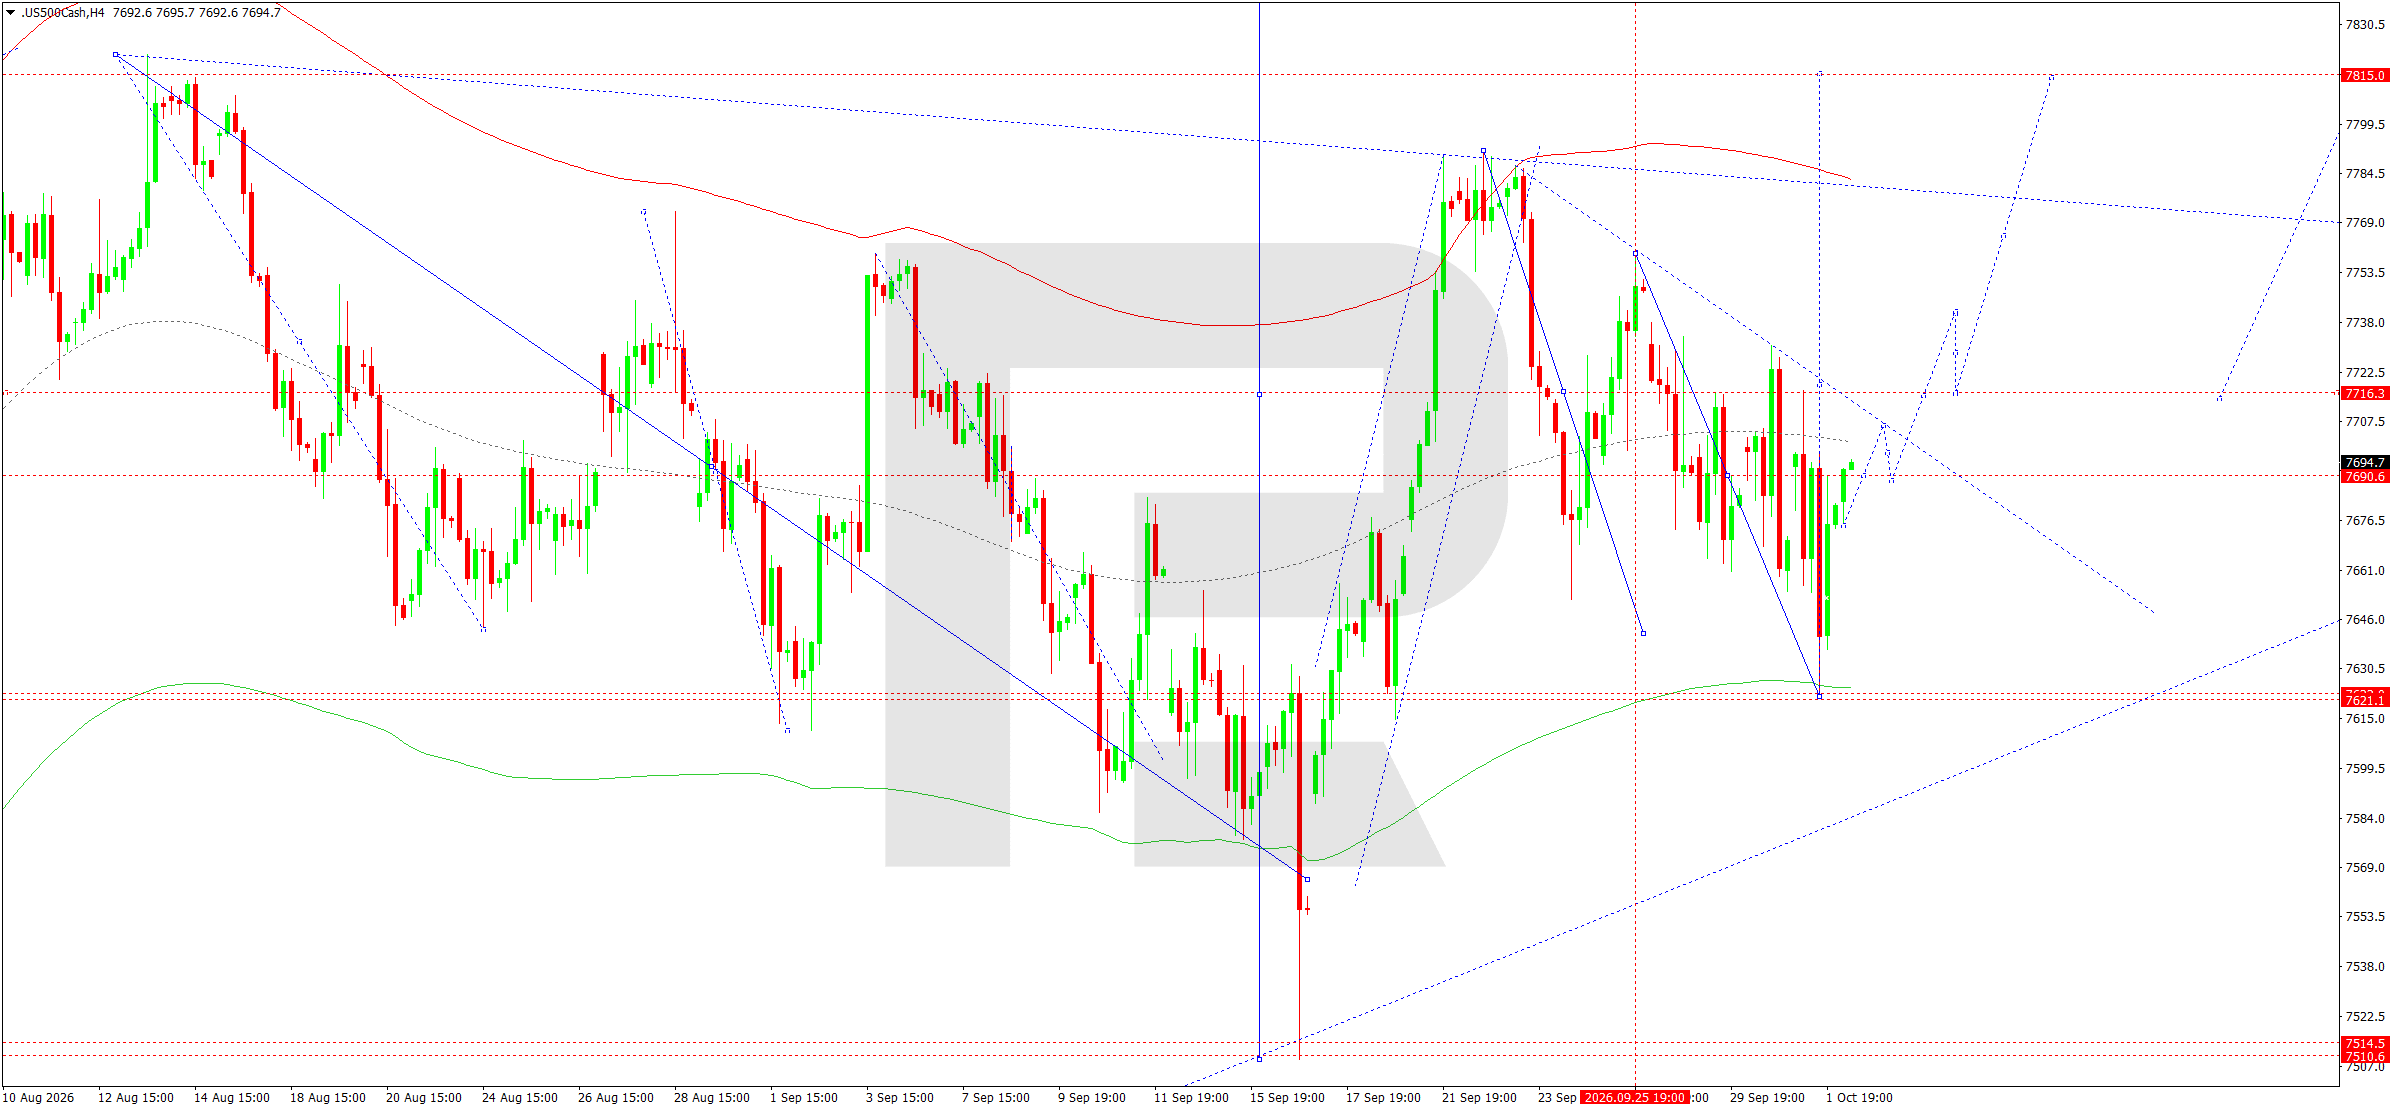
On the H4 chart, the US 500 formed a downward wave towards the 7,621–7,625 area, followed by an impulsive rebound. The price recovered towards 7,690 and moved into a consolidation range around this level. The structure points to an attempt by the market to form a base for further growth.
The matrix of the current wave has a pivot around 7,717. A return above this level would be an important confirmation of buyers' recovery. The first target is the 7,740 area, after which the market could move towards 7,815.
The 7,621 support level remains critical to this scenario. While it holds, the decline is viewed as a completed corrective move. A breakout above 7,717 and consolidation above the descending resistance line would create conditions for accelerated growth. Therefore, for 2 October, the priority scenario is a recovery towards 7,740 and then towards the upper target at 7,815.
US 500 forecast scenario
Trading scenario: BUY
- Price at the time of writing: 7,693
- Entry price: 7,698
- Stop loss: 7,621
- Take profit: 7,815
- Risk-to-reward ratio: 1:1.52
The trade idea is valid until 8:00 AM on 3 October 2026 (server time, UTC+3).
BTCUSD forecast
BTCUSD enters Friday's session amid improving short-term dynamics in the cryptocurrency market, although the global macroeconomic environment remains challenging. High US bond yields and a strong dollar are traditionally constraining factors for risk assets. The US dollar is near a 17-month high, while the global bond market continues to show elevated volatility.
At the same time, a locally positive sector-specific factor has emerged for Bitcoin. Citigroup raised its targets for Bitcoin and Ethereum, citing a recovery in cryptocurrency-sector activity, improving macroeconomic conditions, and renewed capital inflows into exchange-traded funds. This is supporting market sentiment after a period of high volatility.
The key macroeconomic event on 2 October remains the US employment report. Strong data could revive expectations of a rate hike by the US Federal Reserve, support yields, and limit Bitcoin's rise. Weaker figures, by contrast, could strengthen demand for risk assets. Fed officials have shown caution in recent days regarding a rate increase as early as October.
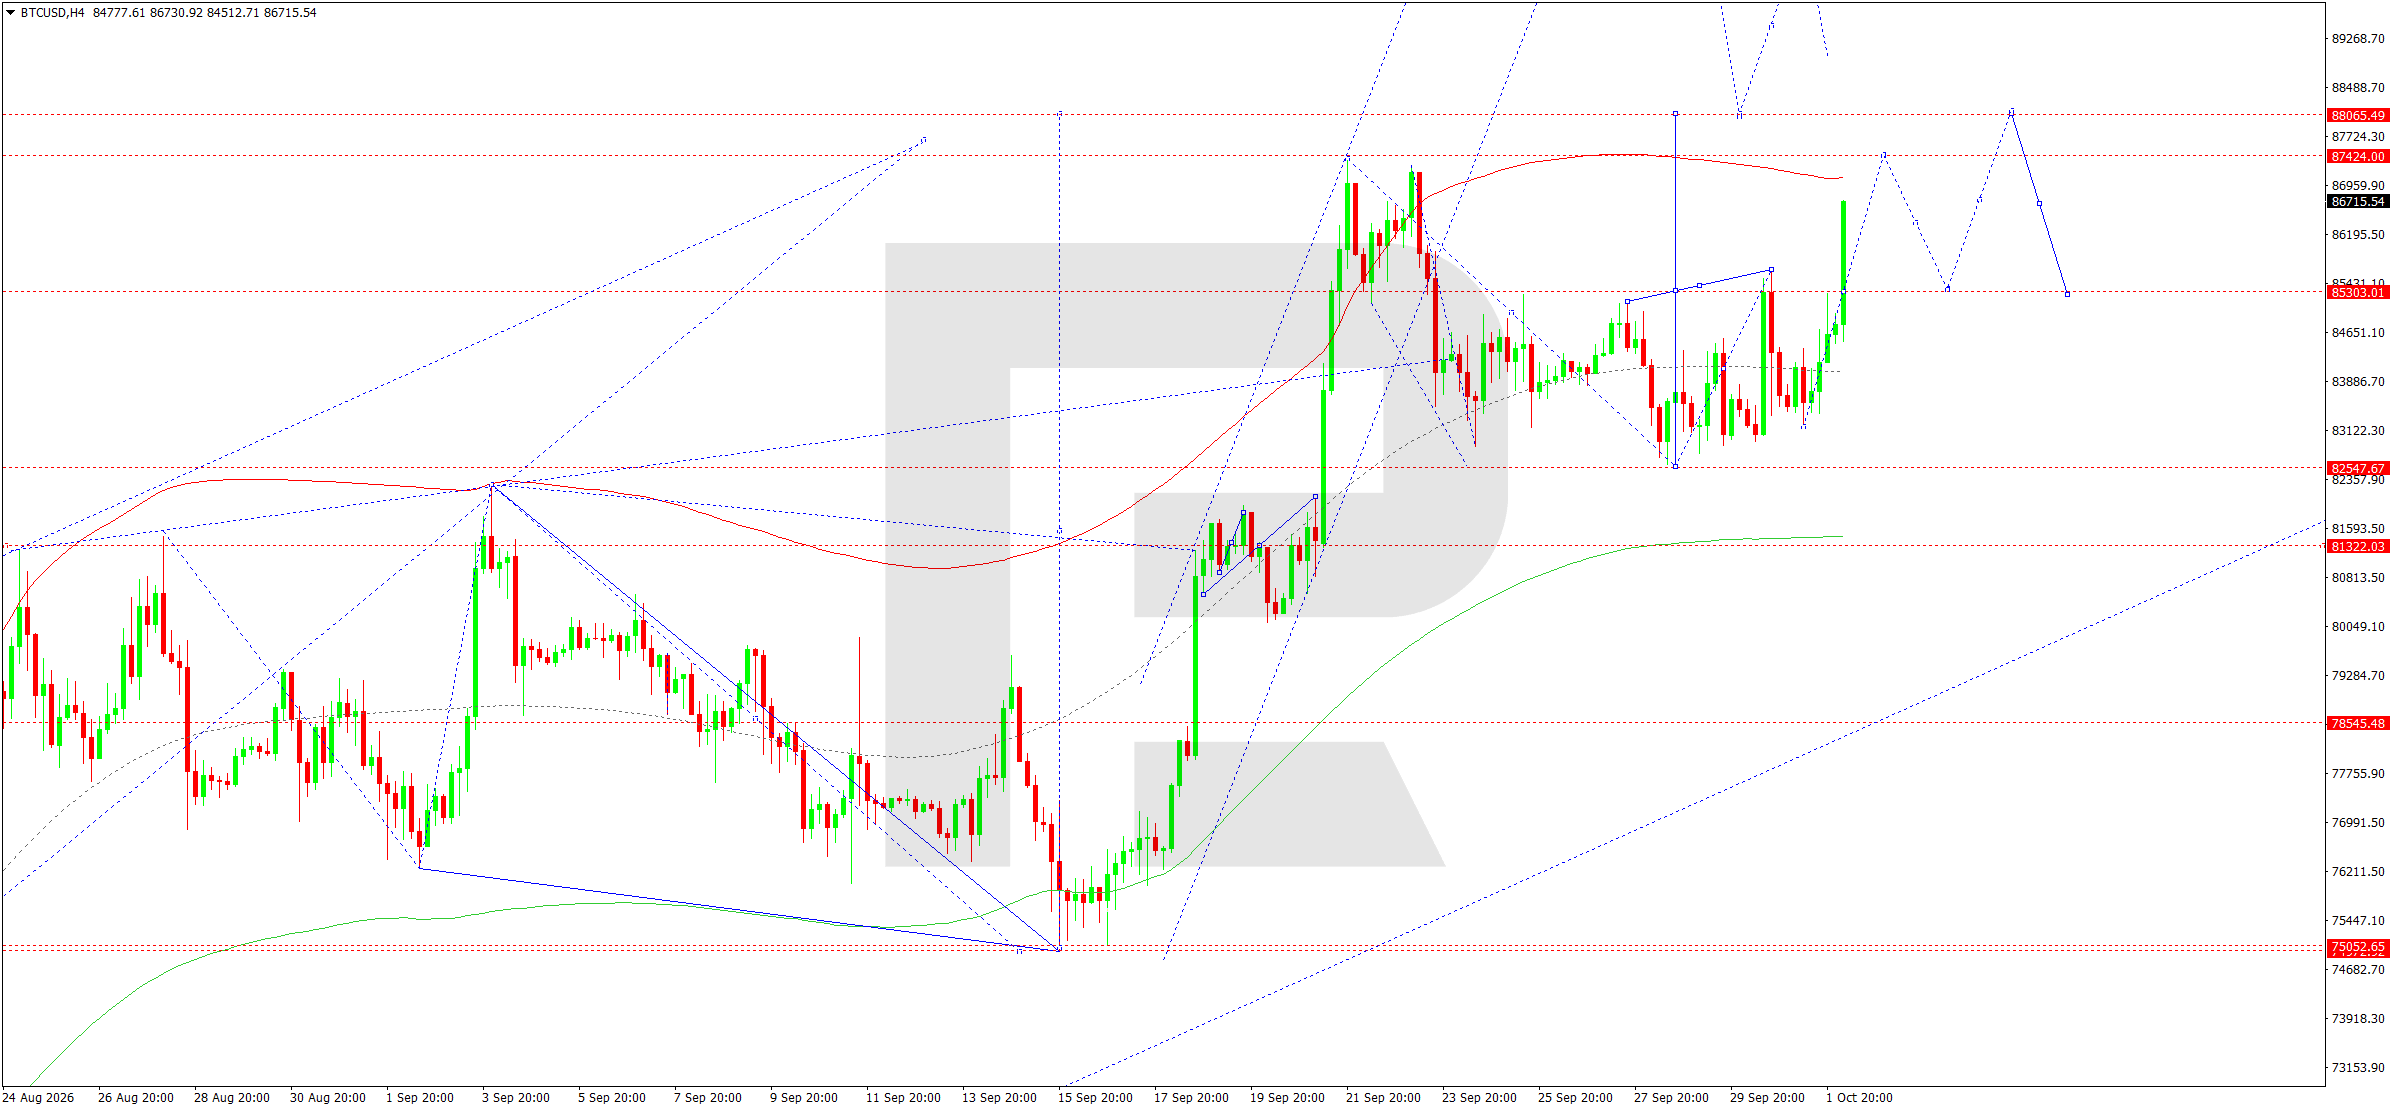
On the H4 chart, BTCUSD completed a corrective structure around 82,547 and formed a new upward impulse. The price returned above 85,303 and briefly approached 86,000, confirming that buyers have regained the initiative.
The upward wave matrix with a pivot at 85,303 remains the key technical structure. Consolidation above this level opens the way towards the upper boundary of the Price Envelope around 87,424, with the next target at 88,065.
After the price reaches 87,424–88,065, a technical correction back towards 85,303 may form. While the price remains above this pivot, the main scenario is a continued upward wave. A breakout above 88,065 could extend the upside potential and confirm the formation of the next upward move. A return below 85,303, by contrast, would weaken the momentum and increase the probability of a retest of the 82,547 level. At this stage, the H4 structure continues to favour buyers.
BTCUSD forecast scenario
Trading scenario: BUY
- Price at the time of writing: 85,955
- Entry price: 85,960
- Stop loss: 85,303
- Take profit: 88,065
- Risk-to-reward ratio: 1:3.20
The trade idea is valid until 8:00 AM on 3 October 2026 (server time, UTC+3).
Editors’ picks
 EURUSD forecast 2026–2027: technical analysis, price levels & predictions
The EURUSD outlook for 2026 and 2027: key levels on the daily chart, three trading scenarios and the policy gap between the Fed and the ECB that drives the pair.
 Gold (XAUUSD) forecast 2026: technical analysis, price levels & predictions
Where gold could trade in 2026: key levels, three trading scenarios with entry triggers and the forecasts from J.P. Morgan, Deutsche Bank and Goldman Sachs.
Forecasts presented in this section only reflect the author’s private opinion and should not be considered as guidance for trading. RoboForex bears no responsibility for trading results based on trading recommendations described in these analytical reviews.