
Daily technical analysis and forecast for 5 October 2026
Daily technical analysis and forecast for EURUSD, USDJPY, GBPUSD, AUDUSD, USDCAD, XAUUSD, US 500, and BTCUSD for 5 October 2026.
Each scenario on this page reflects the market structure on the H4 chart as of 10:00 UTC+3 on 5 October 2026. The assessment considers the current H4 chart structure, key support and resistance levels, the direction of the medium-term movement, and the prevailing fundamental backdrop.
EURUSD forecast
EURUSD starts the new week under pronounced pressure. The euro has fallen to around 17-month lows, with growing concerns over France's fiscal sustainability and the widening spread between French and German government bonds becoming the main drivers of the decline. High energy costs are adding pressure by simultaneously worsening the eurozone growth outlook and sustaining inflation risks. For the European Central Bank, this combination complicates the future path of monetary policy.
The dollar retains an advantage due to high US government bond yields and demand for safe-haven assets. At the same time, the September US labour-market report was weaker than expected: employment rose by only 29,000, unemployment increased to 4.2%, and previous data were revised down. This significantly reduced the probability of another US Federal Reserve rate hike as early as October, although it has not yet changed medium-term demand for the dollar. The market continues to price in the possibility of tighter policy later if inflation remains elevated. Therefore, the fundamental backdrop for EURUSD remains predominantly negative.
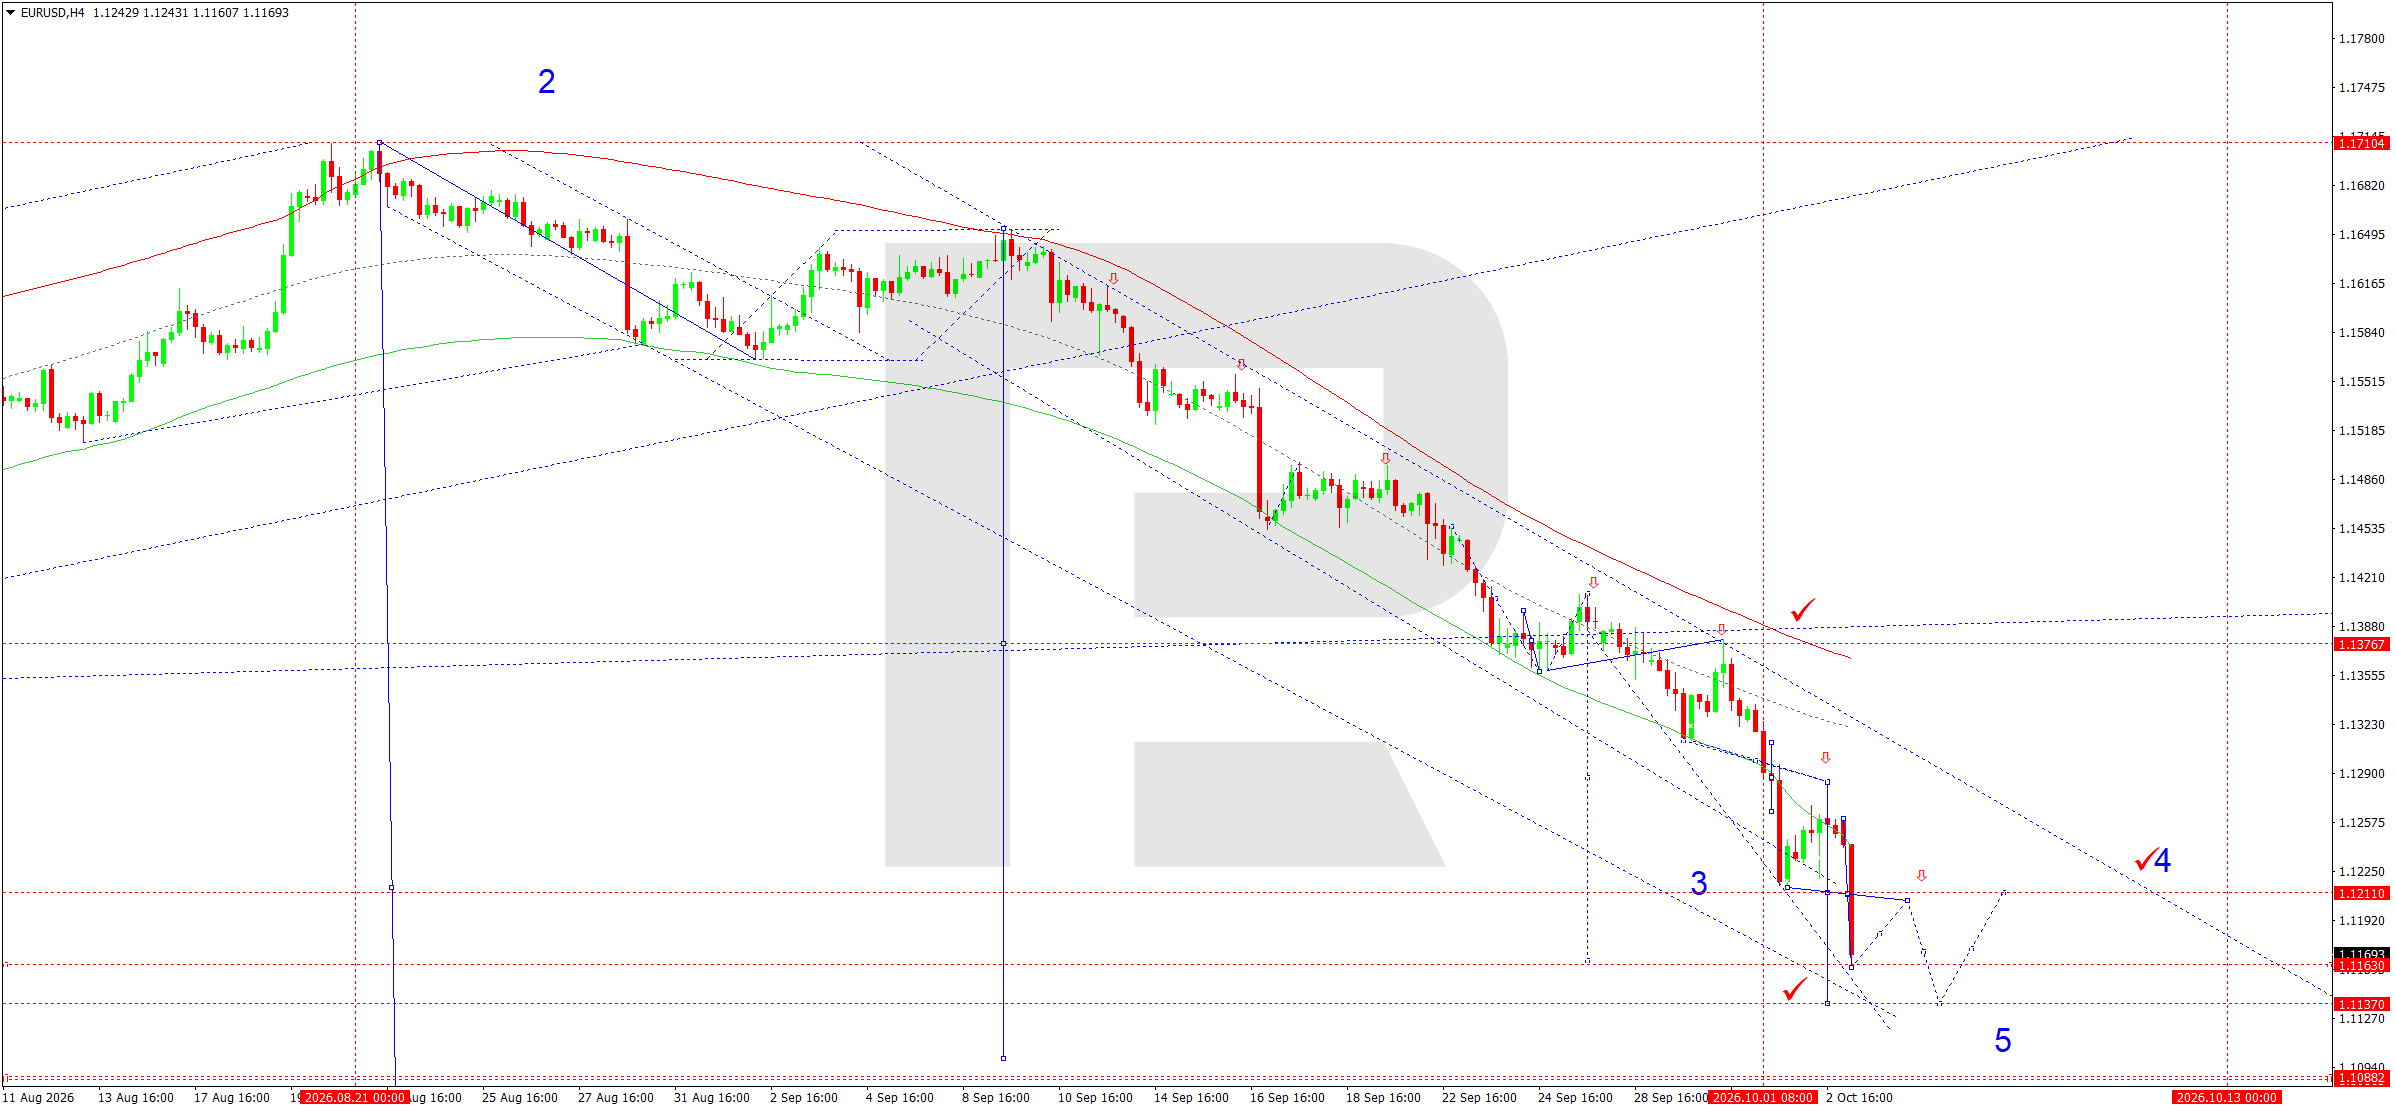
A steady downtrend persists on the EURUSD H4 chart. The market completed a downward wave towards 1.1161, effectively reaching the nearest target of the bearish impulse. After such a move, a technical correction towards 1.1185 is likely, with a possible extension towards 1.1200–1.1210.
The wave matrix has a pivot at 1.1210. This level also acts as key resistance and a potential point for the correction to end. While the price remains below it, the main scenario is a continuation of wave 5 to the downside. After a corrective test of the 1.1200 area, another decline towards 1.1137 and then 1.1088 is expected. The descending channel structure and the price's position relative to the Price Envelope lines confirm that sellers retain the advantage. Therefore, any rise is viewed primarily as corrective.
EURUSD forecast scenario
Trading scenario: SELL
- Price at the time of writing: 1.1188
- Entry price: 1.1183
- Stop loss: 1.1211
- Take profit: 1.1137
- Risk-to-reward ratio: 1:1.64
The trade idea is valid until 8:00 AM on 6 October 2026 (server time, UTC+3).
USDJPY forecast
USDJPY remains under the influence of two opposing factors. On the one hand, the dollar is supported by high US government bond yields and demand for safe-haven assets. On the other hand, the weak September US employment report significantly reduced the probability of an immediate Fed rate hike. The market now largely expects rates to remain unchanged at the October meeting, although the possibility of further tightening in December remains. This limits the scope for uncontrolled dollar appreciation.
For the yen, Bank of Japan policy is becoming the key factor. Deputy Governor Shinichi Uchida noted that the investment boom around artificial intelligence could support inflation and the natural rate of interest. The BoJ has already tightened monetary policy amid inflationary pressure, high energy costs, and weakness in the national currency. Japanese government bonds are also important: yields on long-dated issues remain elevated, gradually creating fundamental support for the yen. Nevertheless, in the short term, the dollar retains the advantage while US yields remain elevated.
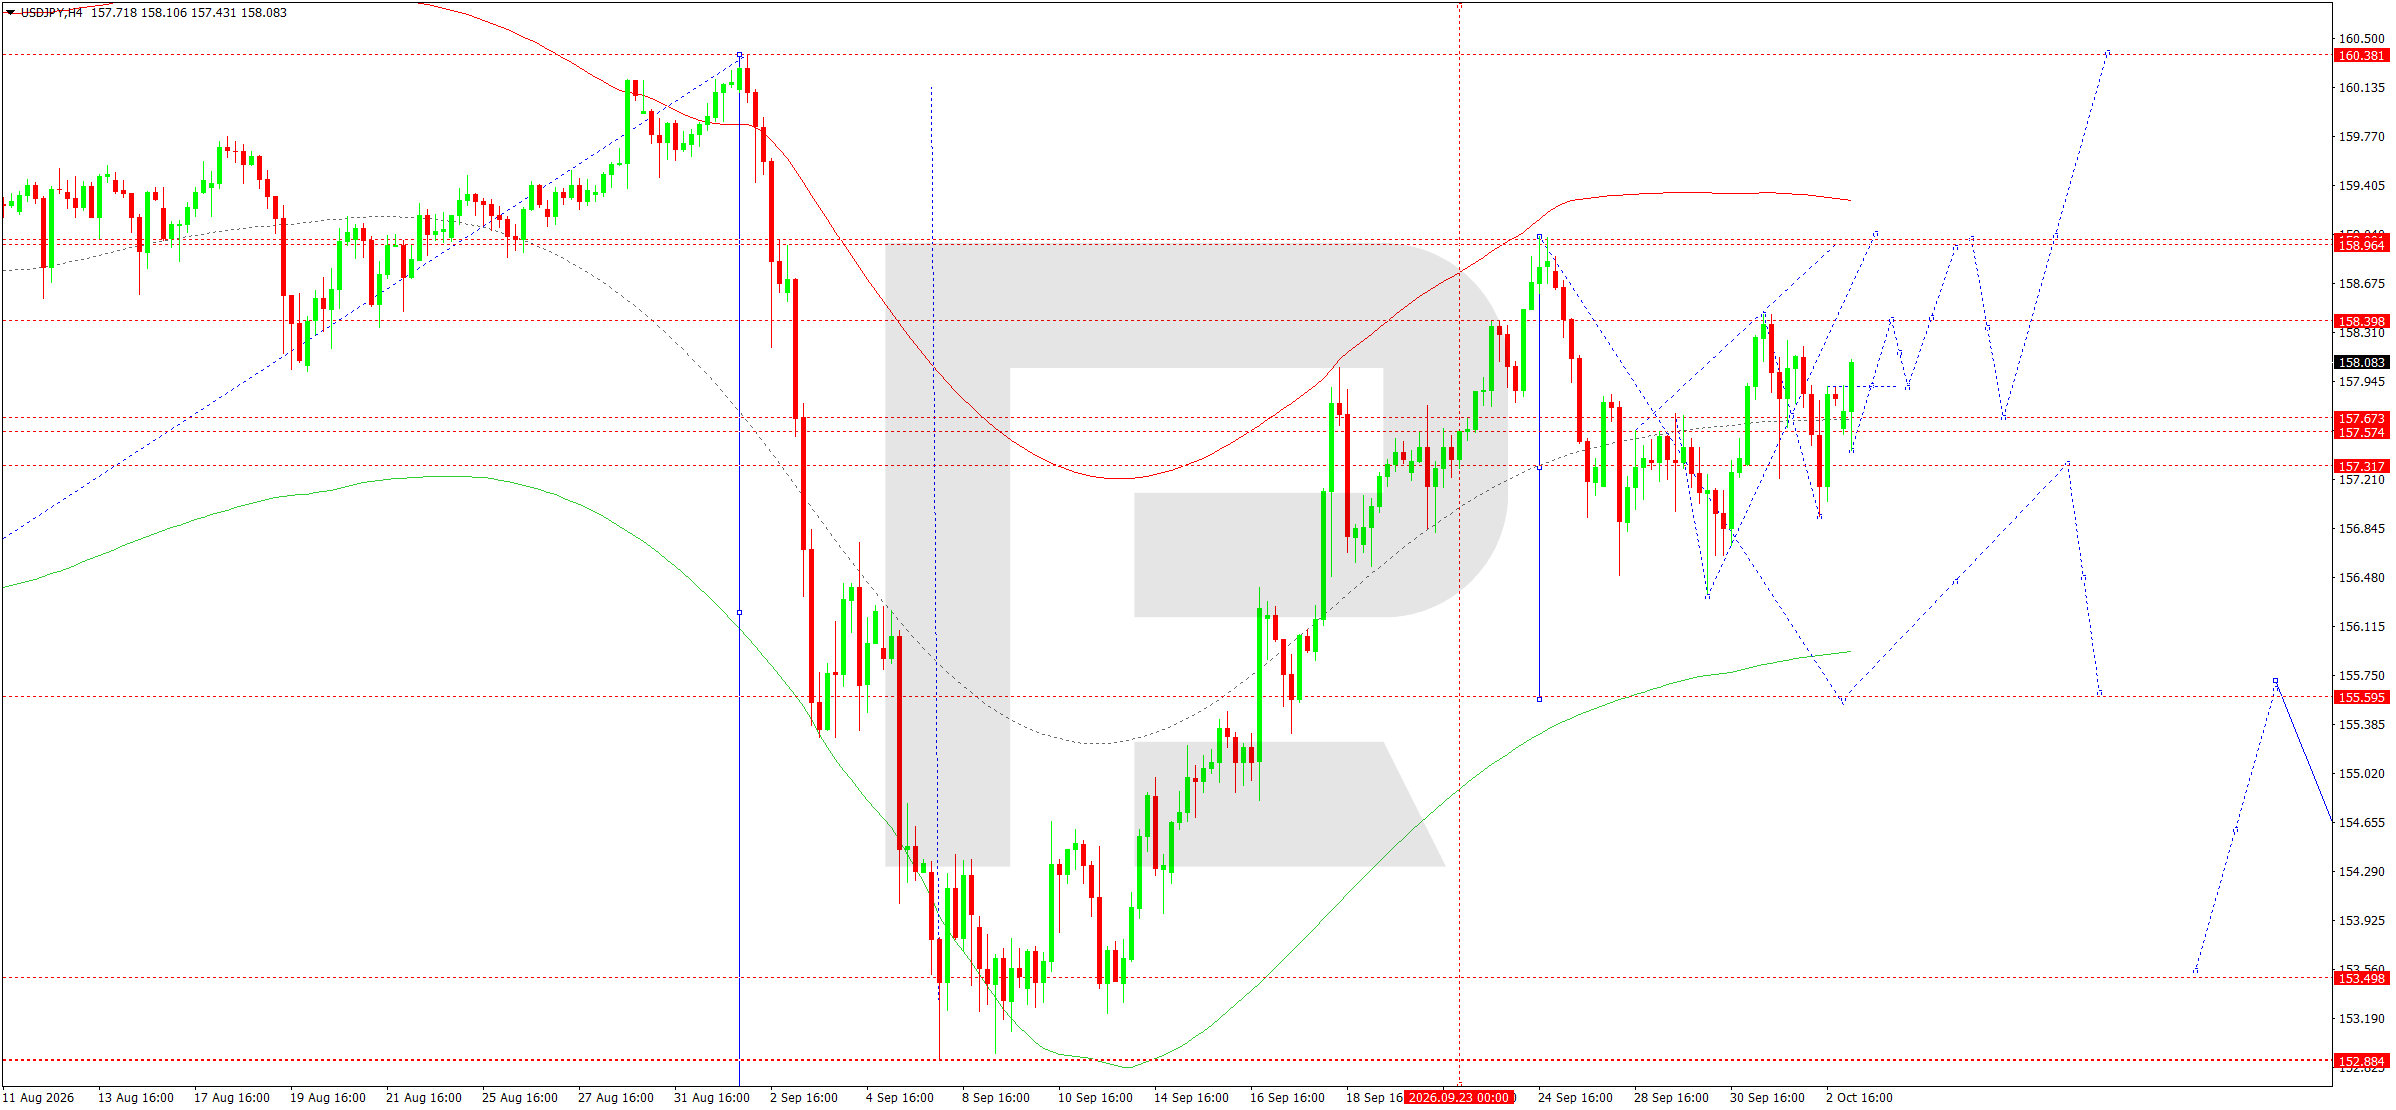
On the H4 chart, USDJPY broke above 157.90 and formed an upward impulse towards 158.18. The move then shifted into local consolidation. The structure retains the potential for further growth first towards 158.40 and then towards the key 158.90–158.96 area.
The matrix pivot is around 157.30. While quotes remain above 157.57–157.30, buyers retain the advantage. The central line of the Price Envelope around 157.60 acted as support, after which the market recovered above 158.00. A breakout above 158.40 would create technical conditions for a test of the 158.96 level. In the broader structure, there is still potential for a move towards 160.38, although this target is distant for the current session.
An alternative scenario would form only after a return below 157.30. In this case, the upward structure would be broken, opening the door for a decline towards 155.60. Until such a signal appears, preference is given to a continuation of the upward wave.
USDJPY forecast scenario
Trading scenario: BUY
- Price at the time of writing: 158.02
- Entry price: 158.07
- Stop loss: 157.55
- Take profit: 158.90
- Risk-to-reward ratio: 1:1.60
The trade idea is valid until 8:00 AM on 6 October 2026 (server time, UTC+3).
GBPUSD forecast
The fundamental backdrop for GBPUSD remains mixed. Sterling receives some support from expectations of further monetary tightening. The upward revision to UK economic growth in Q2 to 0.5% strengthened market expectations of a Bank of England rate hike. Inflationary pressure from the energy market is an additional factor. BoE officials have previously indicated that persistently high energy prices may require a tighter interest-rate policy.
However, sterling remains weak against the dollar. High US Treasury yields support the US currency, while global uncertainty increases safe-haven demand for the dollar. September US employment data came in significantly below forecasts, reducing the probability of a Fed rate hike in October. Nevertheless, inflation risks remain, so the market continues to price in the possibility of a December increase. The pound traded around 1.3205 in morning trading, confirming continued pressure on the British currency. Fundamentally, BoE policy limits the scale of GBPUSD's decline but is not yet sufficient to form a sustained reversal against the strong dollar.
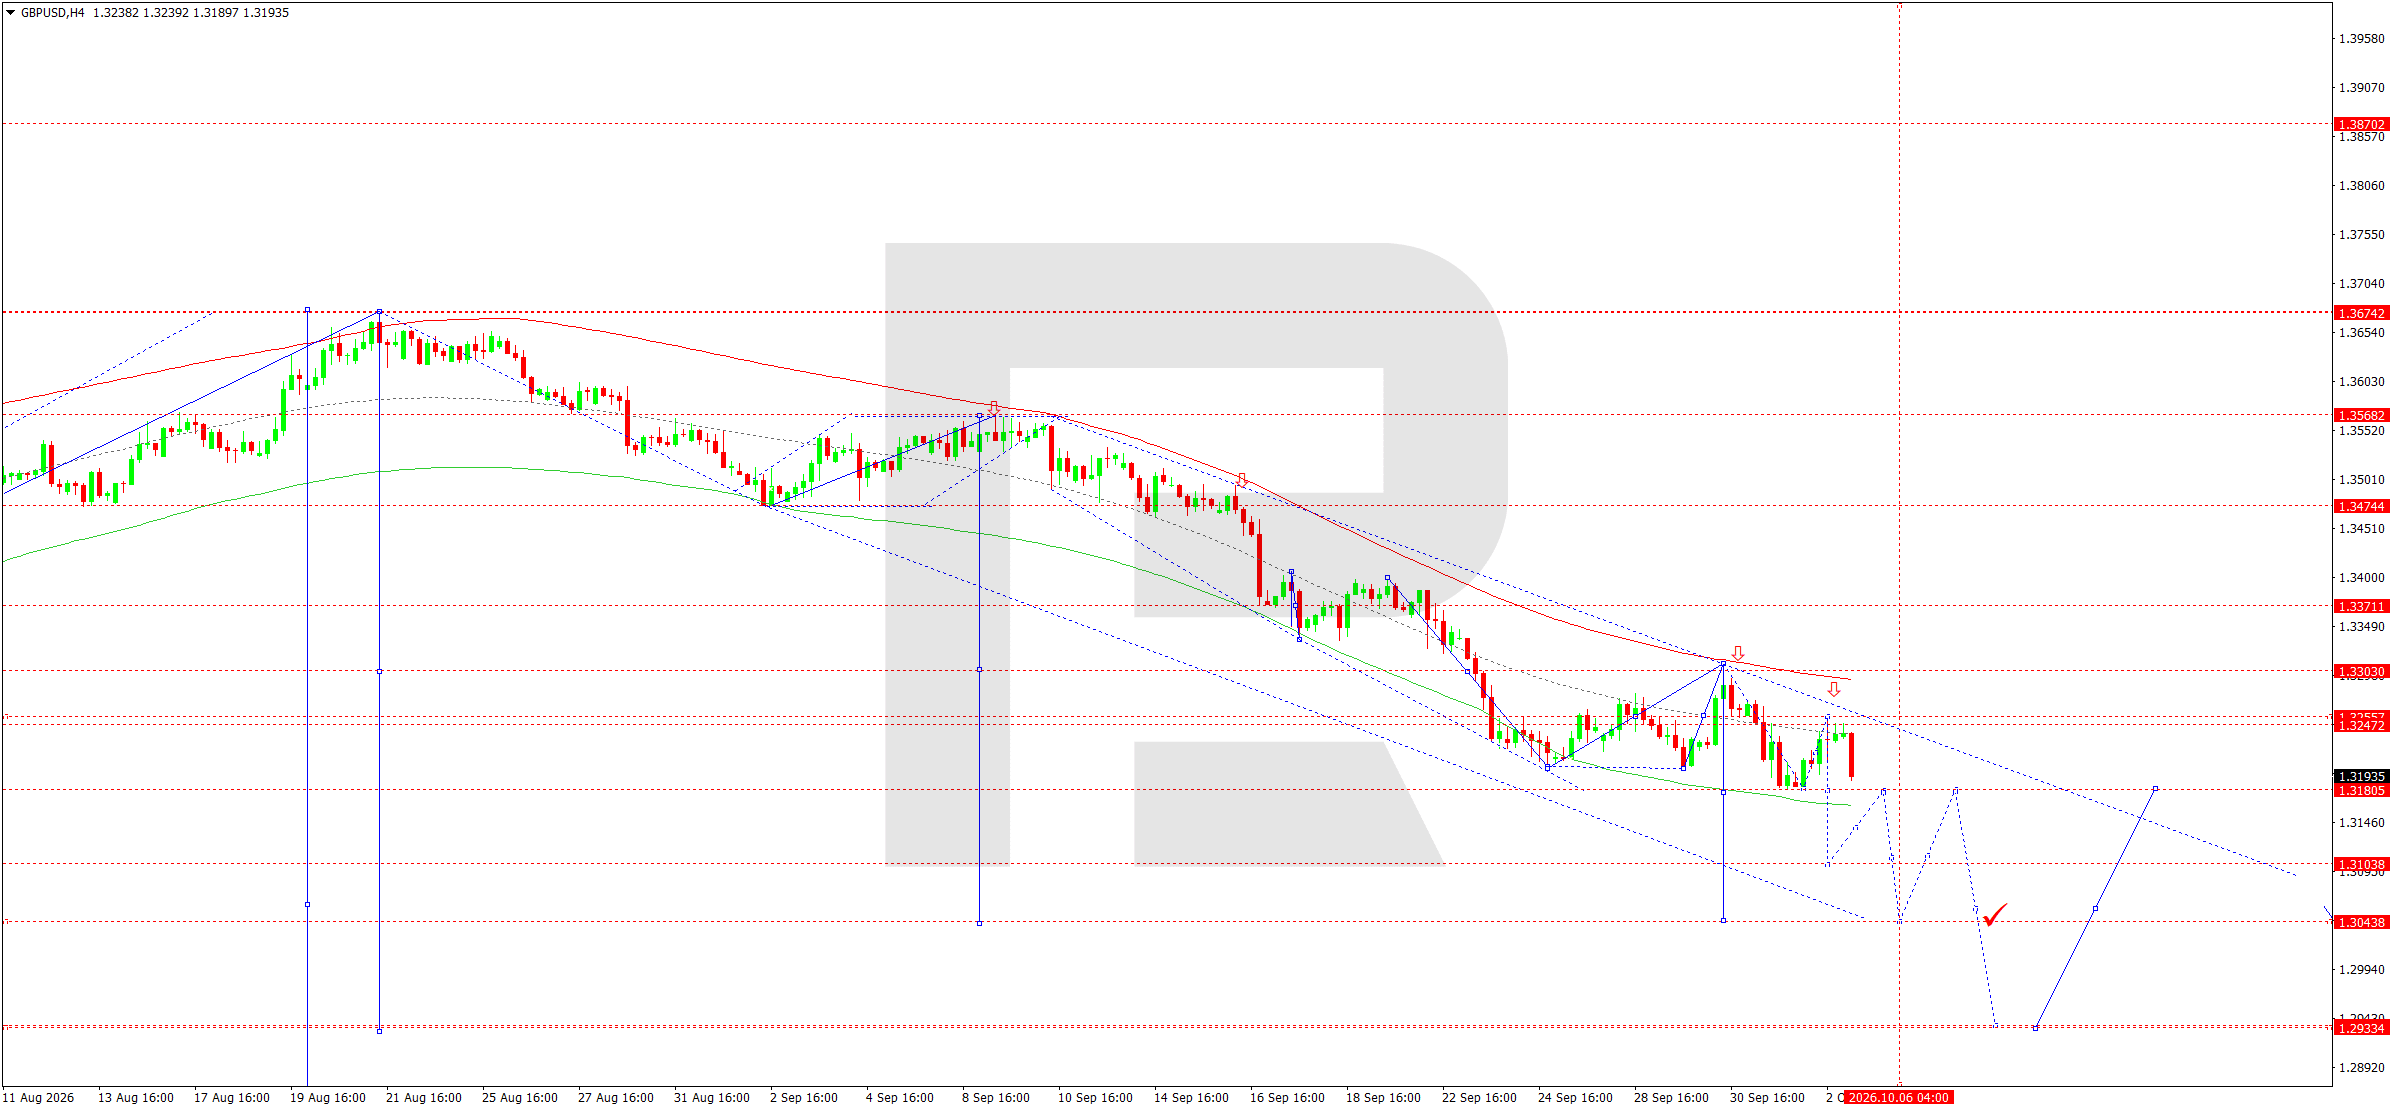
On the H4 chart, GBPUSD continues the previously established downtrend. After declining towards 1.3181, the market completed a corrective move towards 1.3252 but failed to consolidate above this mark. This keeps the probability of another downward impulse elevated.
The downward wave matrix has a pivot in the 1.3303 area. While the price holds below this level, the technical advantage remains with sellers. The nearest support level is at 1.3180. A confident breakout below it would open the way towards 1.3103, corresponding to the lower area of the Price Envelope, with the next target at 1.3044.
The descending channel structure remains intact, while the sequence of local highs continues to move lower. Therefore, corrective rises towards 1.3247–1.3255 should be viewed as elements of the main downward wave rather than the start of a reversal. The main scenario suggests a retest of the 1.3180 level followed by a decline towards 1.3103.
GBPUSD forecast scenario
Trading scenario: SELL
- Price at the time of writing: 1.3206
- Entry price: 1.3201
- Stop loss: 1.3255
- Take profit: 1.3103
- Risk-to-reward ratio: 1:1.81
The trade idea is valid until 8:00 AM on 6 October 2026 (server time, UTC+3).
AUDUSD forecast
AUDUSD remains under pressure from a strong US dollar, although Australia's fundamental backdrop is not unequivocally negative for the national currency. The Reserve Bank of Australia continues to focus primarily on the persistence of inflation. RBA Governor Michele Bullock has pointed to new inflation risks related, among other things, to the investment boom in the artificial-intelligence sector and rising technology-component costs. Following a significant rate-increase cycle, the market is debating how close the policy rate is to its peak.
At the same time, slowing Australian economic indicators and signs of a weakening labour market limit the scope for further aggressive tightening. The external backdrop is also important for the AUD: high global yields, energy risks, and sustained demand for the dollar reduce the appeal of currencies sensitive to global risk appetite. The US labour market created only 29,000 jobs in September, so the probability of a Fed rate hike in October fell sharply. This factor could potentially limit further dollar appreciation, but it has not yet produced a sustained reversal in AUDUSD.
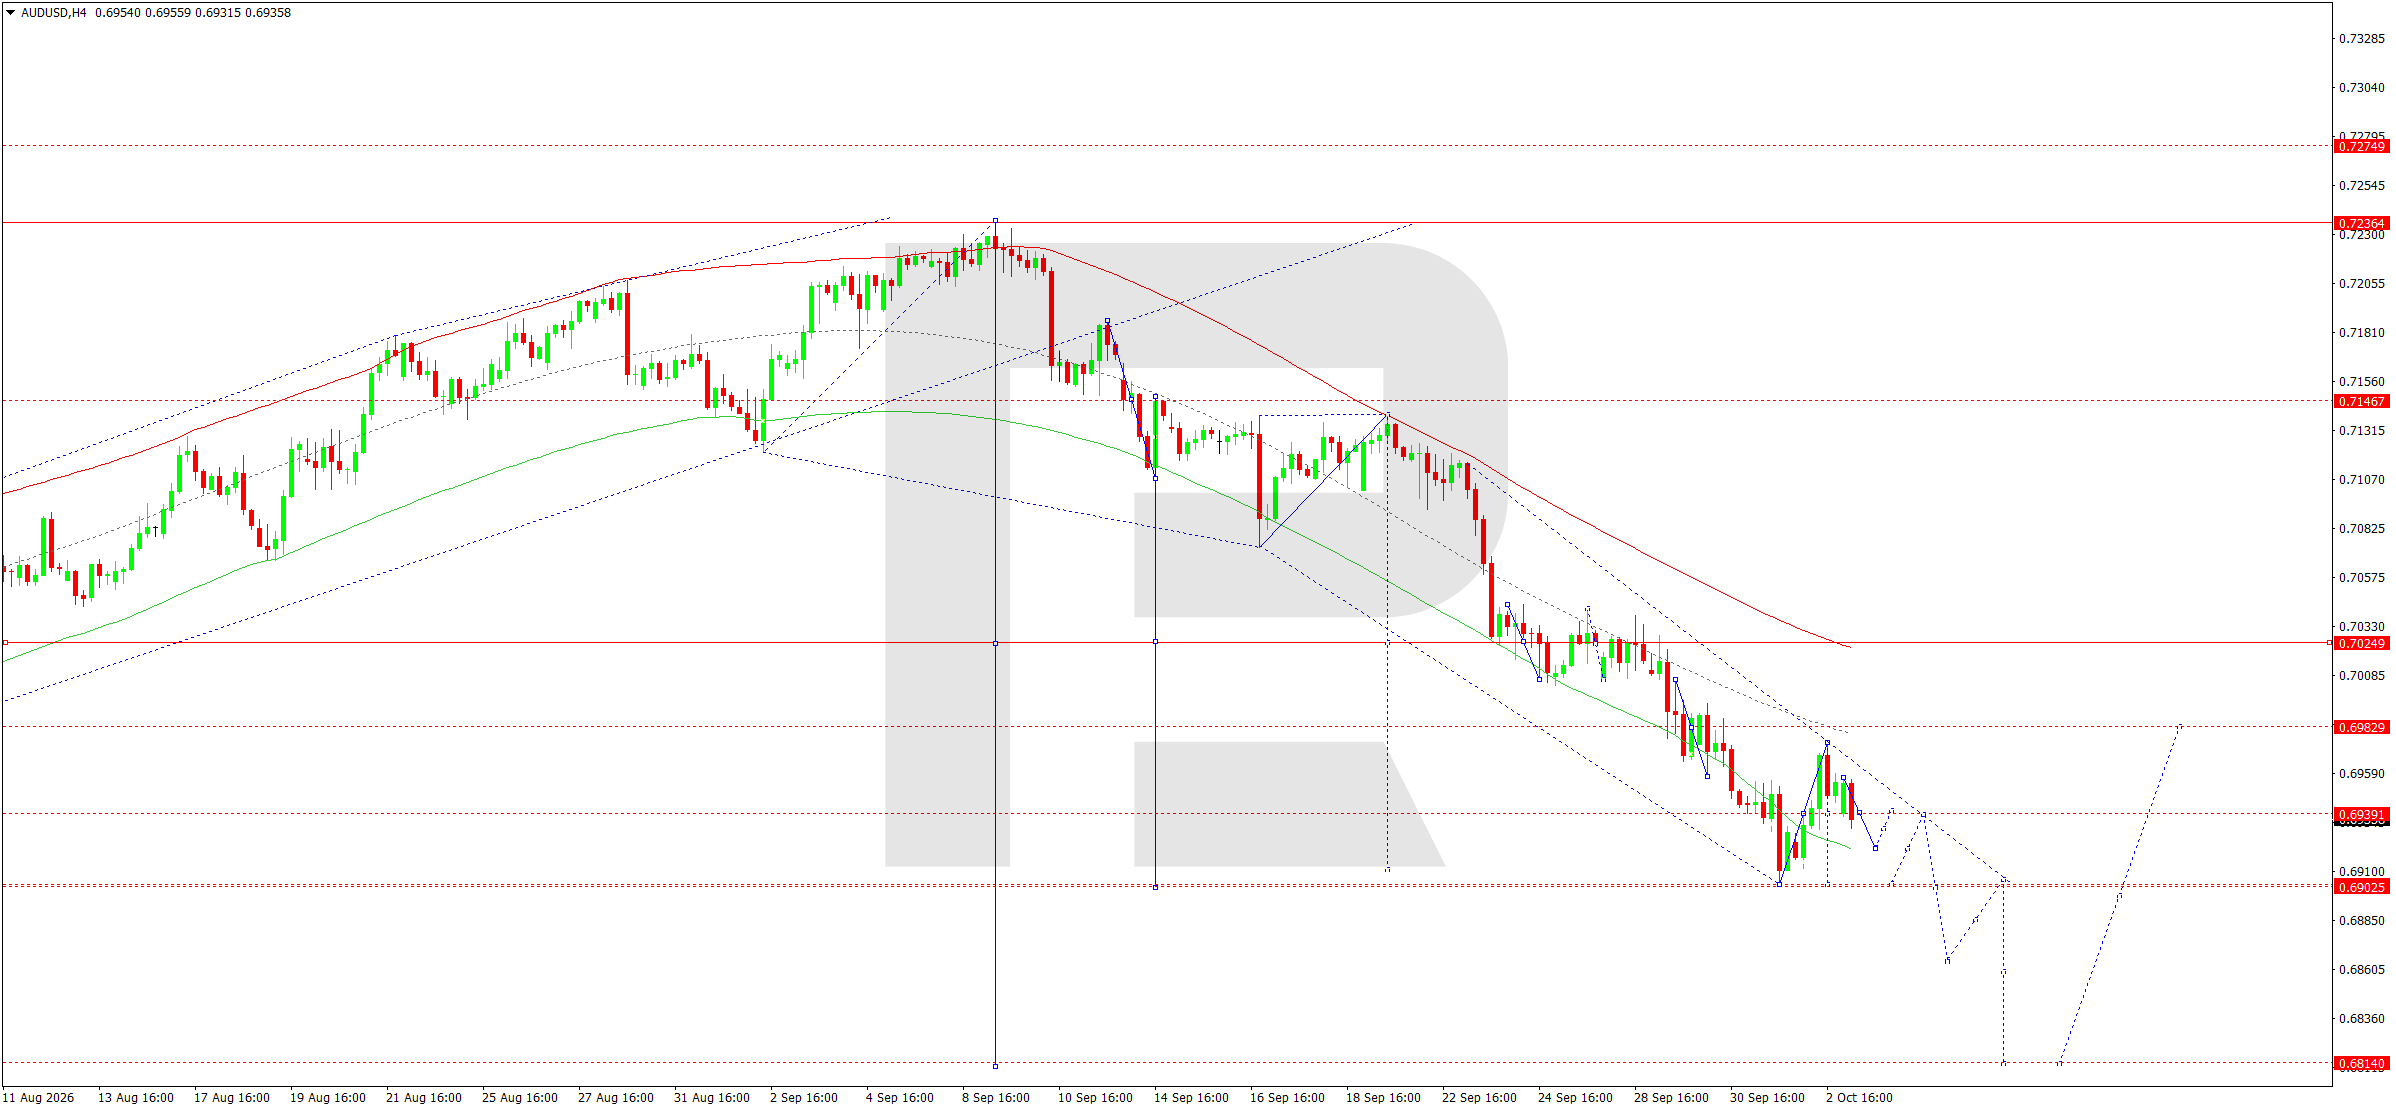
On the H4 chart, AUDUSD retains a pronounced downward structure. The market continues to form lower highs and lower lows within the descending channel. After the price reached 0.6903, a correction formed towards the 0.6940–0.6950 area, which still looks like an intermediate recovery within the main trend.
The matrix pivot is around 0.7029. While the price remains significantly below this level, the main scenario remains bearish. The nearest resistance level is around 0.6983, although even a test of this level would not change the broader structure without consolidation above 0.7025–0.7029.
The main target is another decline towards 0.6905. A breakout below this level would allow the fifth wave to continue towards 0.6860 and then 0.6810. The price remaining below the main Price Envelope lines also confirms the sellers' advantage. Therefore, the correction towards 0.6950 is viewed as an opportunity for further selling.
AUDUSD forecast scenario
Trading scenario: SELL
- Price at the time of writing: 0.6939
- Entry price: 0.6934
- Stop loss: 0.6983
- Take profit: 0.6810
- Risk-to-reward ratio: 1:2.53
The trade idea is valid until 8:00 AM on 6 October 2026 (server time, UTC+3).
USDCAD forecast
USDCAD retains an upward fundamental bias, supported by the overall strength of the US dollar. Despite the weak September US employment report, the dollar is supported by high Treasury yields and demand for safe-haven assets. Following its September rate hike, the Fed is most likely to pause in October, although the market continues to price in the possibility of another increase in December. This preserves a positive interest rate factor for the dollar.
For the Canadian currency, oil remains the most significant external factor. At the start of the week, oil prices eased somewhat amid increased supply from the Middle East and reserve releases by G7 countries. Brent traded around 102 USD per barrel. Lower oil prices traditionally limit support for the Canadian dollar as the currency of a major commodity exporter. At the same time, the Bank of Canada must take into account the impact of high energy prices on domestic inflation and economic activity.
The combination of a strong dollar, high US yields, and an unstable commodity market keeps the fundamental balance for USDCAD tilted to the upside, although technical overbought conditions increase the probability of an intermediate correction.
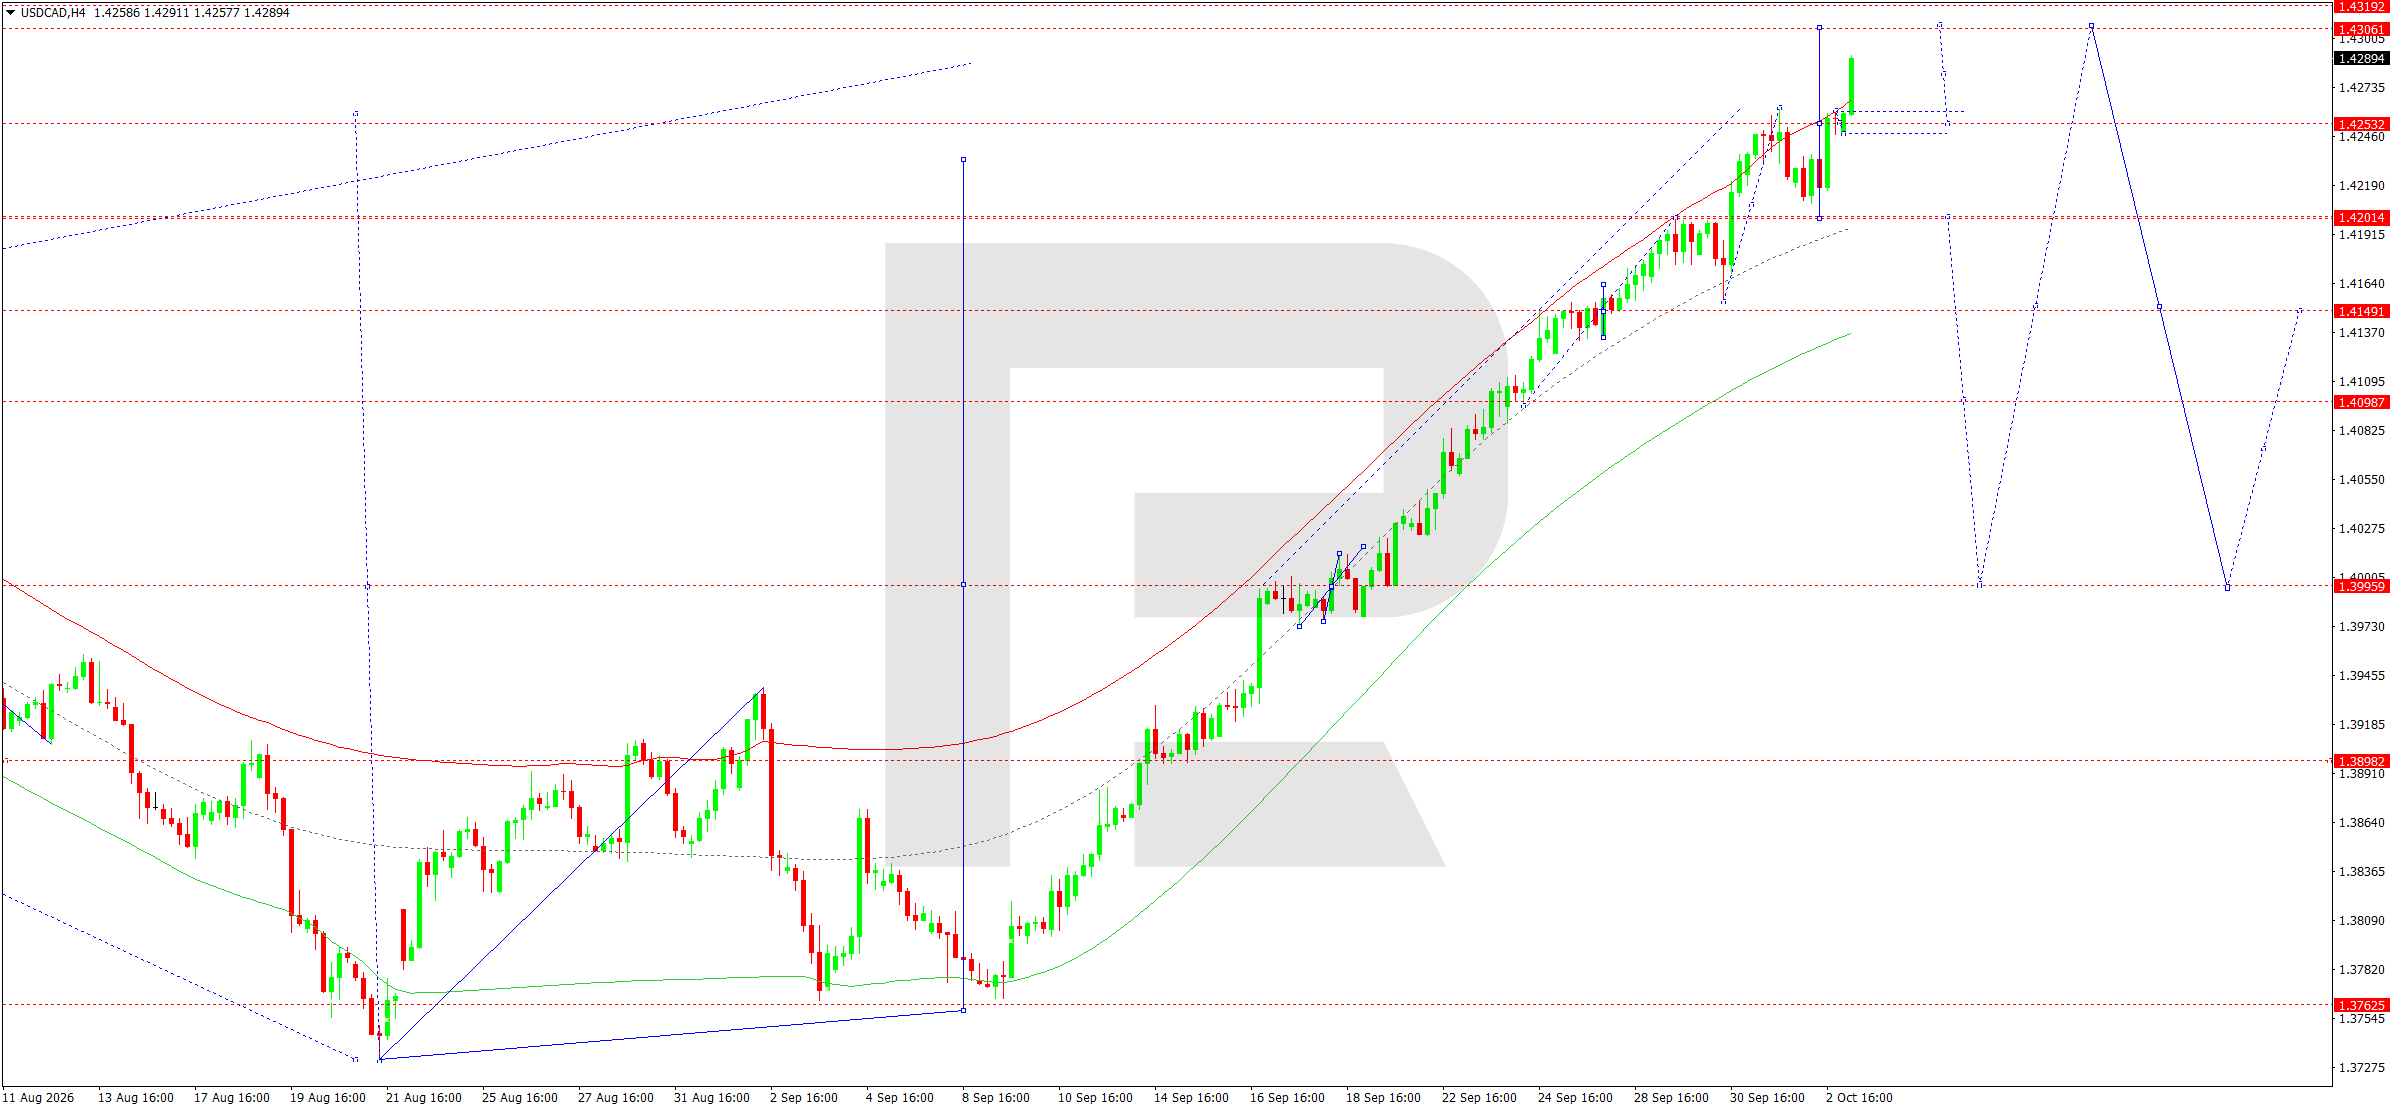
On the H4 chart, USDCAD retains a strong uptrend formed after the reversal from the 1.3763 area. The sequence of higher lows and higher highs remains intact. The market reached 1.4292 and approached the upper boundary of the Price Envelope.
After such an extended impulse, a local range is likely to form in the 1.4250–1.4306 area. The pivot of the current matrix is around 1.4000, highlighting the significant distance of the price from the centre and increasing the probability of a correction. The nearest support level is located at 1.4253. A breakout below it would open the way towards 1.4201 and then 1.4149.
Therefore, for the current day, the preferred scenario is a corrective SELL scenario despite the broader uptrend remaining intact. A return above 1.4306 would invalidate the nearest downside scenario and open the way towards 1.4319 and new highs. While the market remains below 1.4306, the upward momentum is expected to ease.
USDCAD forecast scenario
Trading scenario: SELL
- Price at the time of writing: 1.4280
- Entry price: 1.4275
- Stop loss: 1.4310
- Take profit: 1.4201
- Risk-to-reward ratio: 1:2.11
The trade idea is valid until 8:00 AM on 6 October 2026 (server time, UTC+3).
XAUUSD forecast
Gold starts the week amid a confrontation between several fundamental factors. On the one hand, a strong dollar and elevated US government bond yields are weighing on the metal. In the morning, gold traded around 4,132 USD per ounce, while the Dollar Index continued to strengthen. High real yields increase the opportunity cost of holding an asset that does not generate interest income.
On the other hand, weak September US labour market data significantly reduced the probability of a Fed rate hike at the October meeting. Following the September increase to the 3.75–4.00% range, the market now expects a pause, although the possibility of further tightening in December remains. A softer expected rate path could potentially limit gold's decline.
Additional support comes from geopolitical risks in the Middle East and sustained long-term demand for safe-haven assets. However, in the short term, a stronger dollar and elevated yields remain the dominant factors. Therefore, the fundamental backdrop suggests continued pressure on XAUUSD, alongside higher volatility and sharp corrective recoveries.
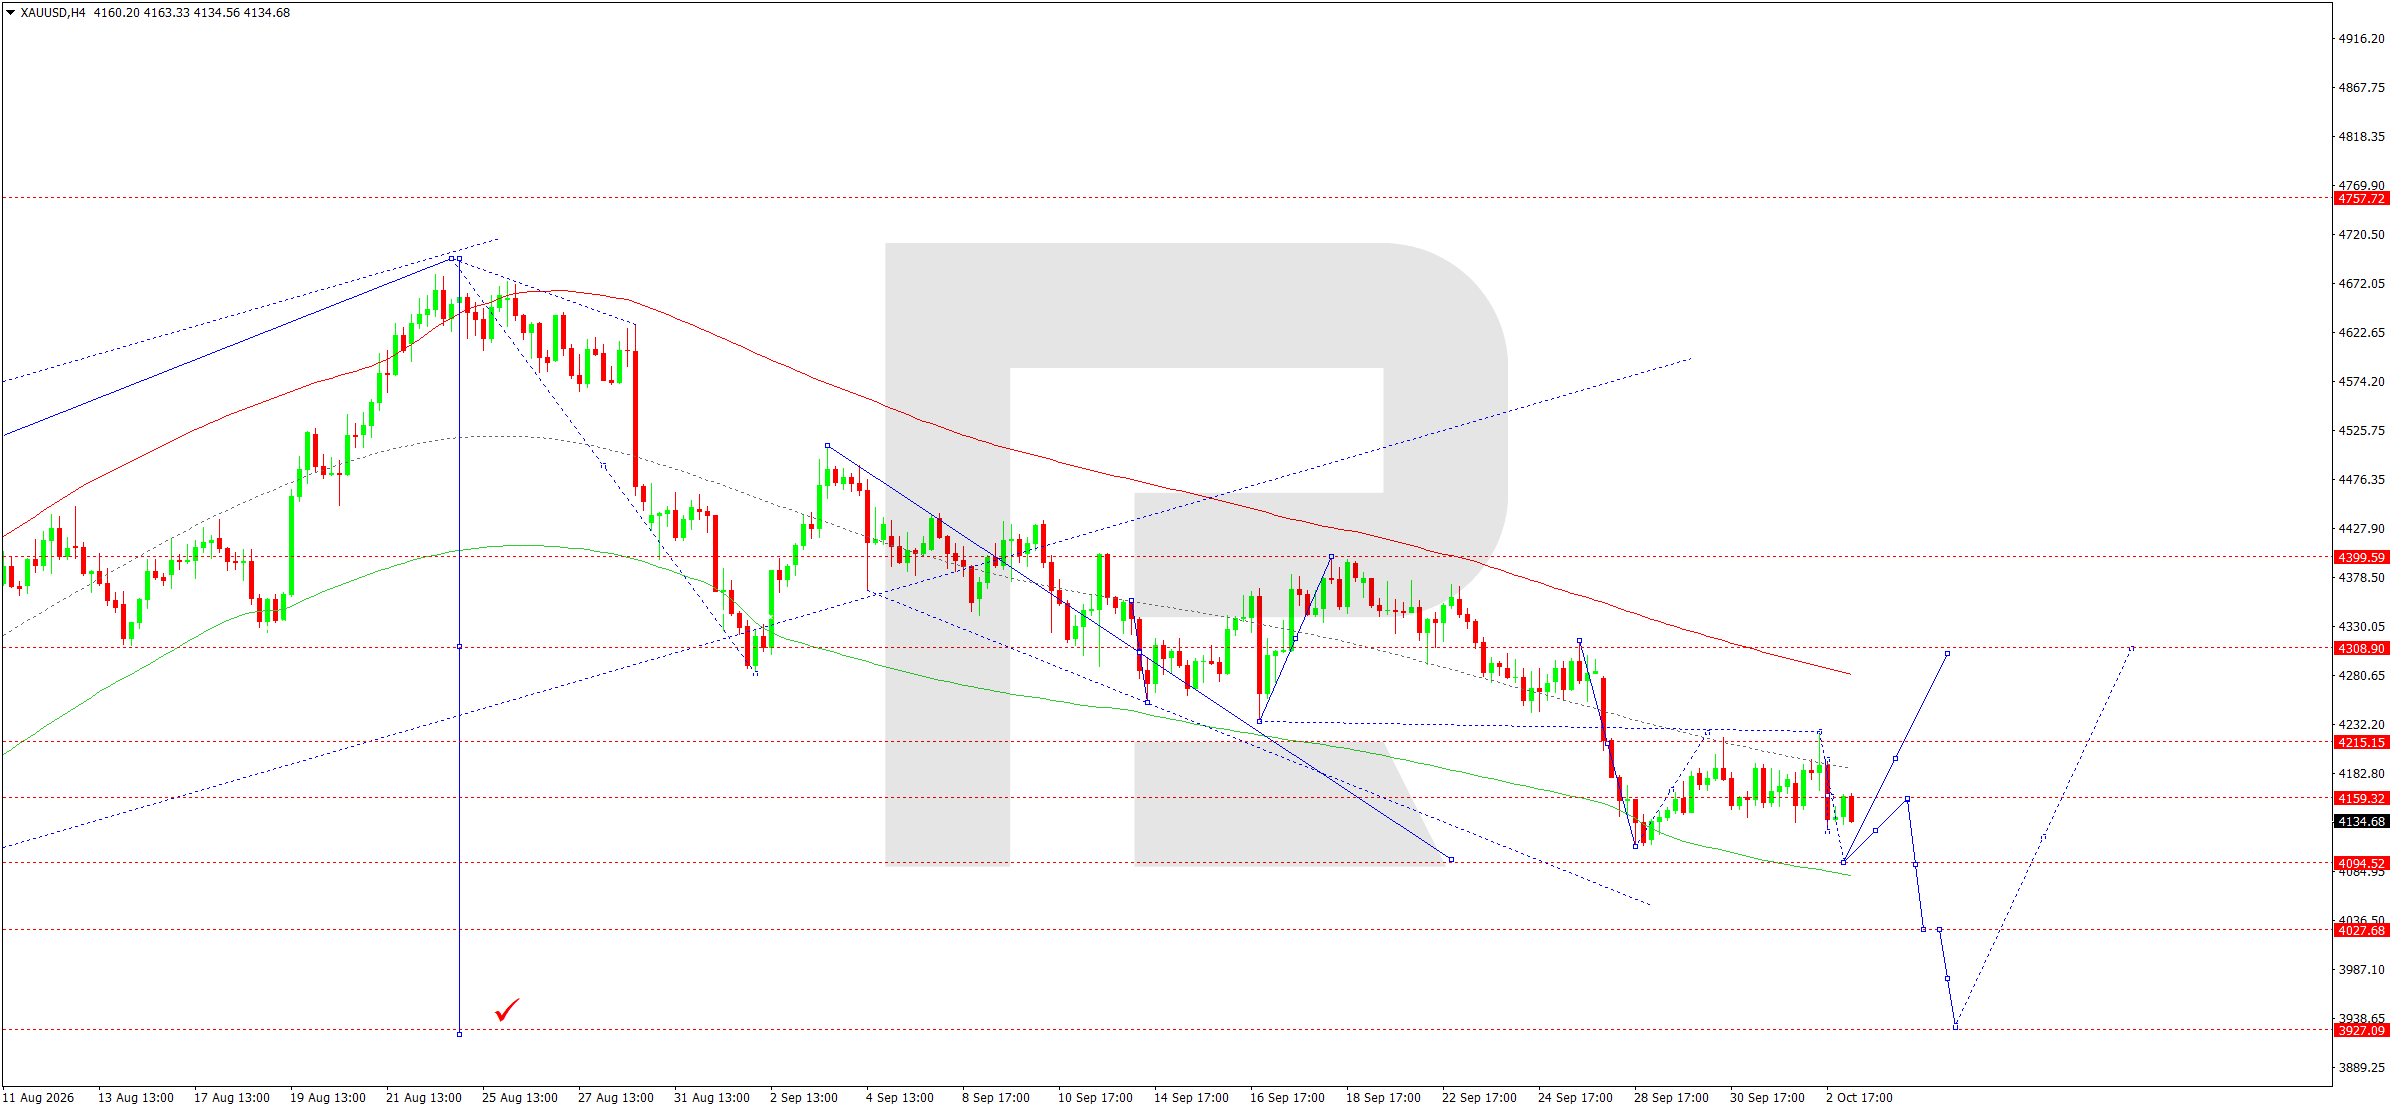
On the H4 chart, XAUUSD continues to develop a downward structure. After forming a high in August, the market has continued to form lower local highs and remains within a descending channel. The latest wave brought prices towards the 4,125–4,095 area, after which consolidation formed.
The downward wave matrix has a pivot around 4,309. While prices remain significantly below this level, the medium-term advantage remains with sellers. The nearest support level is located at 4,095. A breakout below it would confirm continued momentum towards 4,028, with the next target at 3,927.
A corrective rise could return prices towards 4,159–4,215, but only consolidation above 4,215 would weaken the current bearish scenario. The main scenario for today remains a continued decline once the local consolidation is complete.
XAUUSD forecast scenario
Trading scenario: SELL
- Price at the time of writing: 4,138
- Entry price: 4,133
- Stop loss: 4,165
- Take profit: 4,028
- Risk-to-reward ratio: 1:3.28
The trade idea is valid until 8:00 AM on 6 October 2026 (server time, UTC+3).
US 500 forecast
The US equity market starts the week amid a notable shift in expectations regarding Fed policy. The September labour market report showed employment growth of just 29,000 versus expectations of around 90,000, while previous months' data was revised down. Following the release, the probability of a Federal Reserve rate hike in October fell sharply. This is a positive factor for equities, as it reduces the risk of a further short-term rise in financing costs.
At the same time, the situation remains mixed. The yield on 10-year US Treasuries remains above 5%, while the global bond market is under pressure from inflation, energy, and fiscal risks. High yields on debt instruments compete with equities and are particularly important for the highly valued technology segment.
The stock market is also supported by sustained interest in the artificial intelligence sector. Global risk appetite remains relatively resilient this morning, with Asian indices mostly rising. Therefore, the fundamental balance for the US 500 is moderately positive, although any upside move may be accompanied by high volatility due to the bond market and geopolitics.
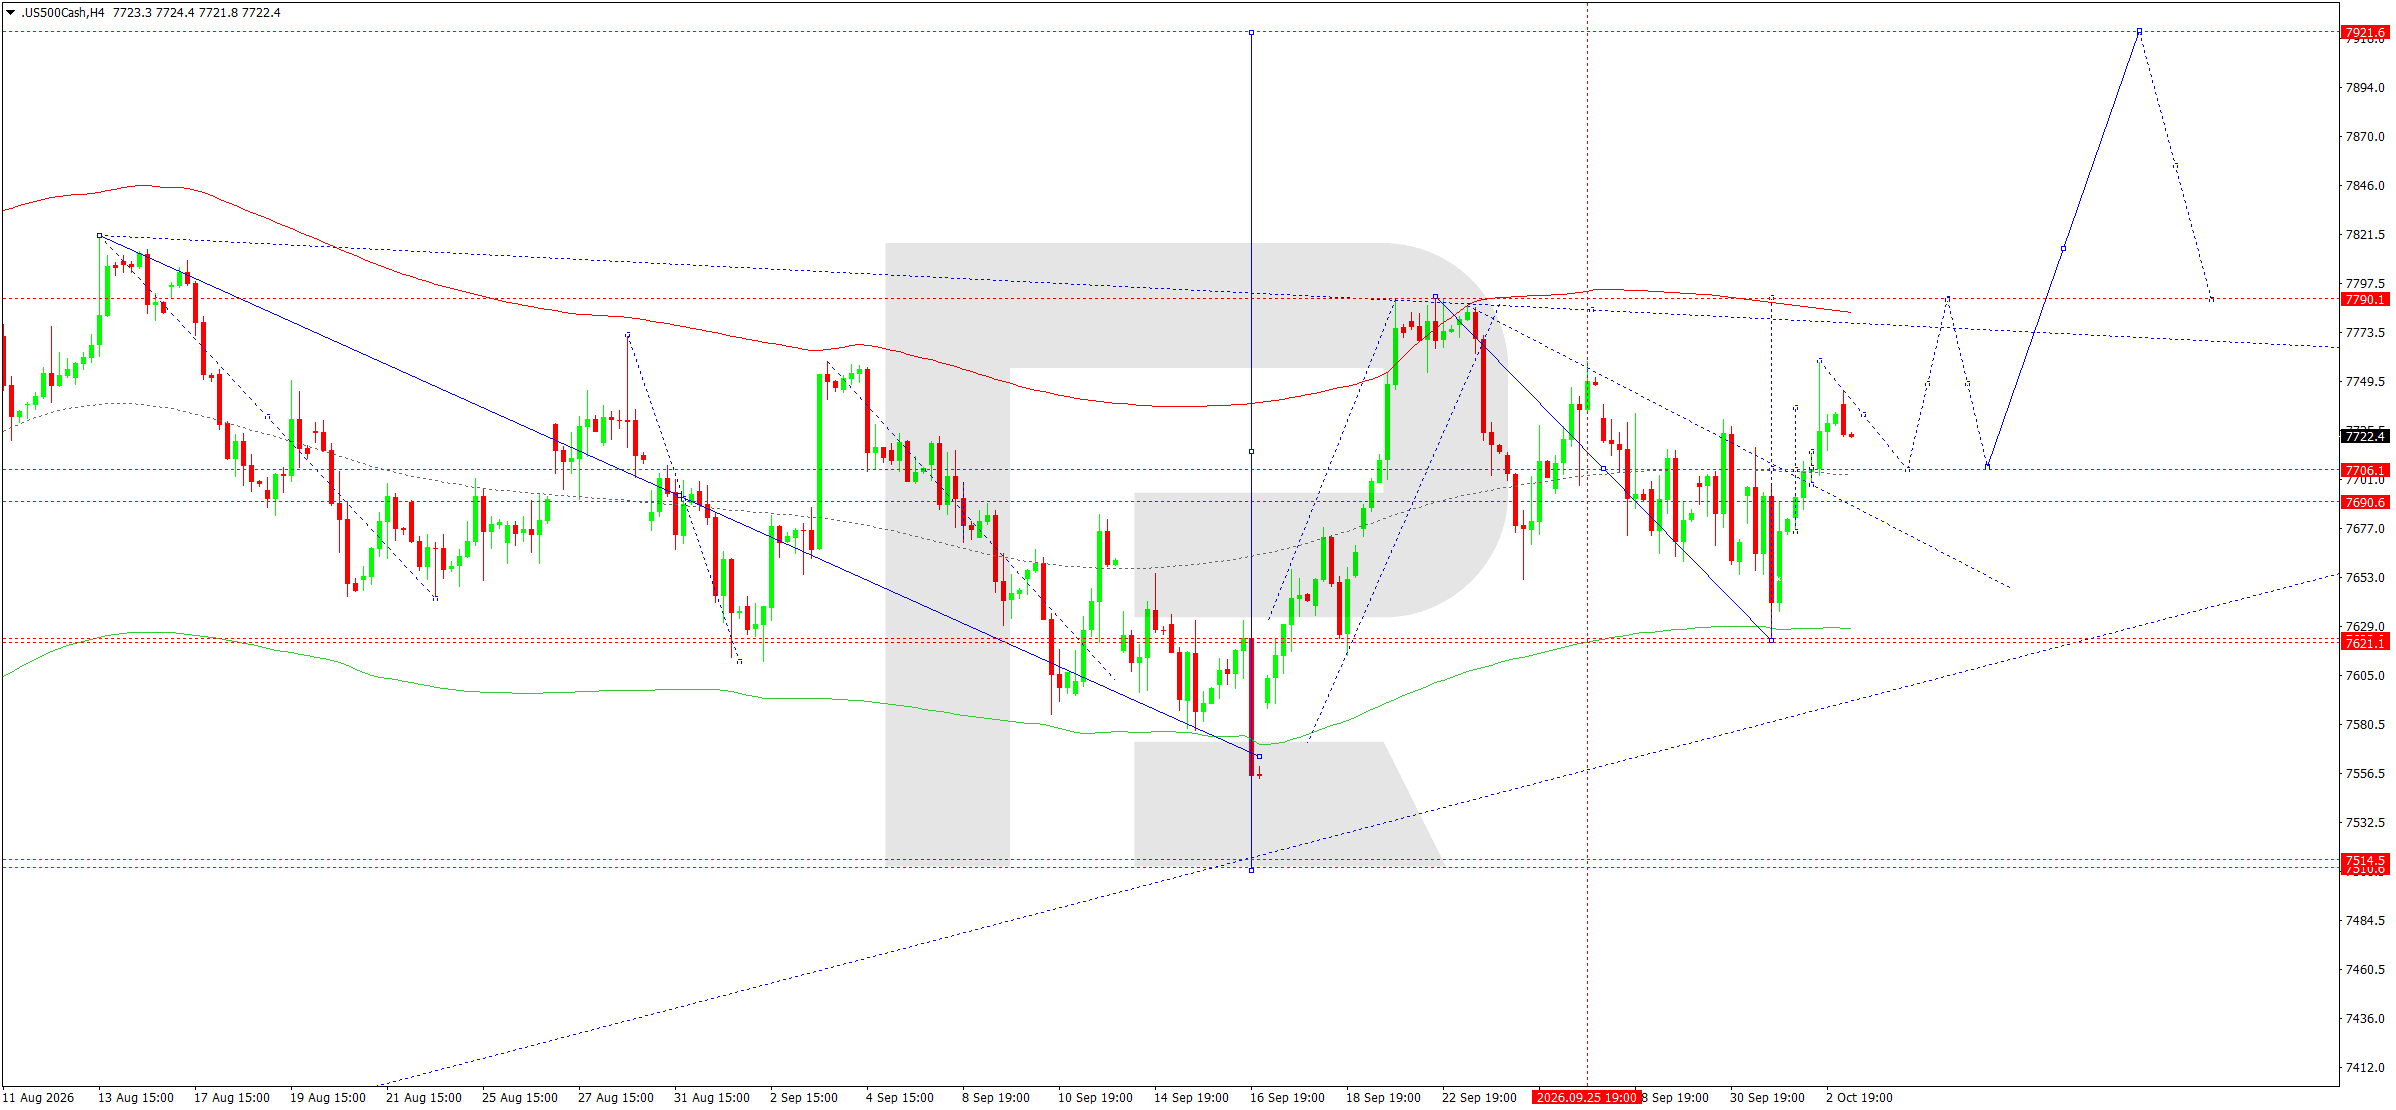
On the H4 chart, the US 500 formed a pronounced recovery impulse after declining towards the 7,621 area. The price has returned above 7,700 and is consolidating around the central area of the Price Envelope.
The current structure is gradually shifting the short-term balance in favour of buyers. The matrix pivot is located around 7,717. Holding above 7,706–7,691 preserves the potential for the upward wave to continue.
The nearest target is 7,790. A breakout above it would open the way towards 7,815 and then the upper target at 7,922. The key support level remains 7,621. Only a return below it would disrupt the established momentum and make a move towards 7,515 relevant again. Until such a signal appears, the preferred scenario remains buying, anticipating an extension of the range to the upside.
US 500 forecast scenario
Trading scenario: BUY
- Price at the time of writing: 7,715
- Entry price: 7,720
- Stop loss: 7,680
- Take profit: 7,815
- Risk-to-reward ratio: 1:2.38
The trade idea is valid until 8:00 AM on 6 October 2026 (server time, UTC+3).
BTCUSD forecast
Bitcoin enters the new week with an improved short-term fundamental backdrop. At the end of last week, the price rose above 86,000 after weak US labour market data reduced expectations of another Fed rate hike in October. This is crucial for cryptocurrencies: a lower risk of further immediate tightening in financial conditions supports demand for higher-risk assets.
A recovery in institutional demand remains an additional positive factor. At the end of September, spot instruments linked to Bitcoin again recorded substantial capital inflows, while large corporate holders continued to increase their positions. This provides fundamental support after the deep decline seen in the first half of the year. At the same time, Bitcoin remains sensitive to US bond yields. The yield on 10-year Treasuries remains elevated, so any further rise could limit capital inflows into the cryptocurrency sector.
Global risk appetite is moderately positive this morning, with Asian equity markets mostly strengthening after weak US employment data. Therefore, the short-term fundamental backdrop for BTCUSD is moderately positive, although the high cost of capital preserves the risk of sharp corrections.
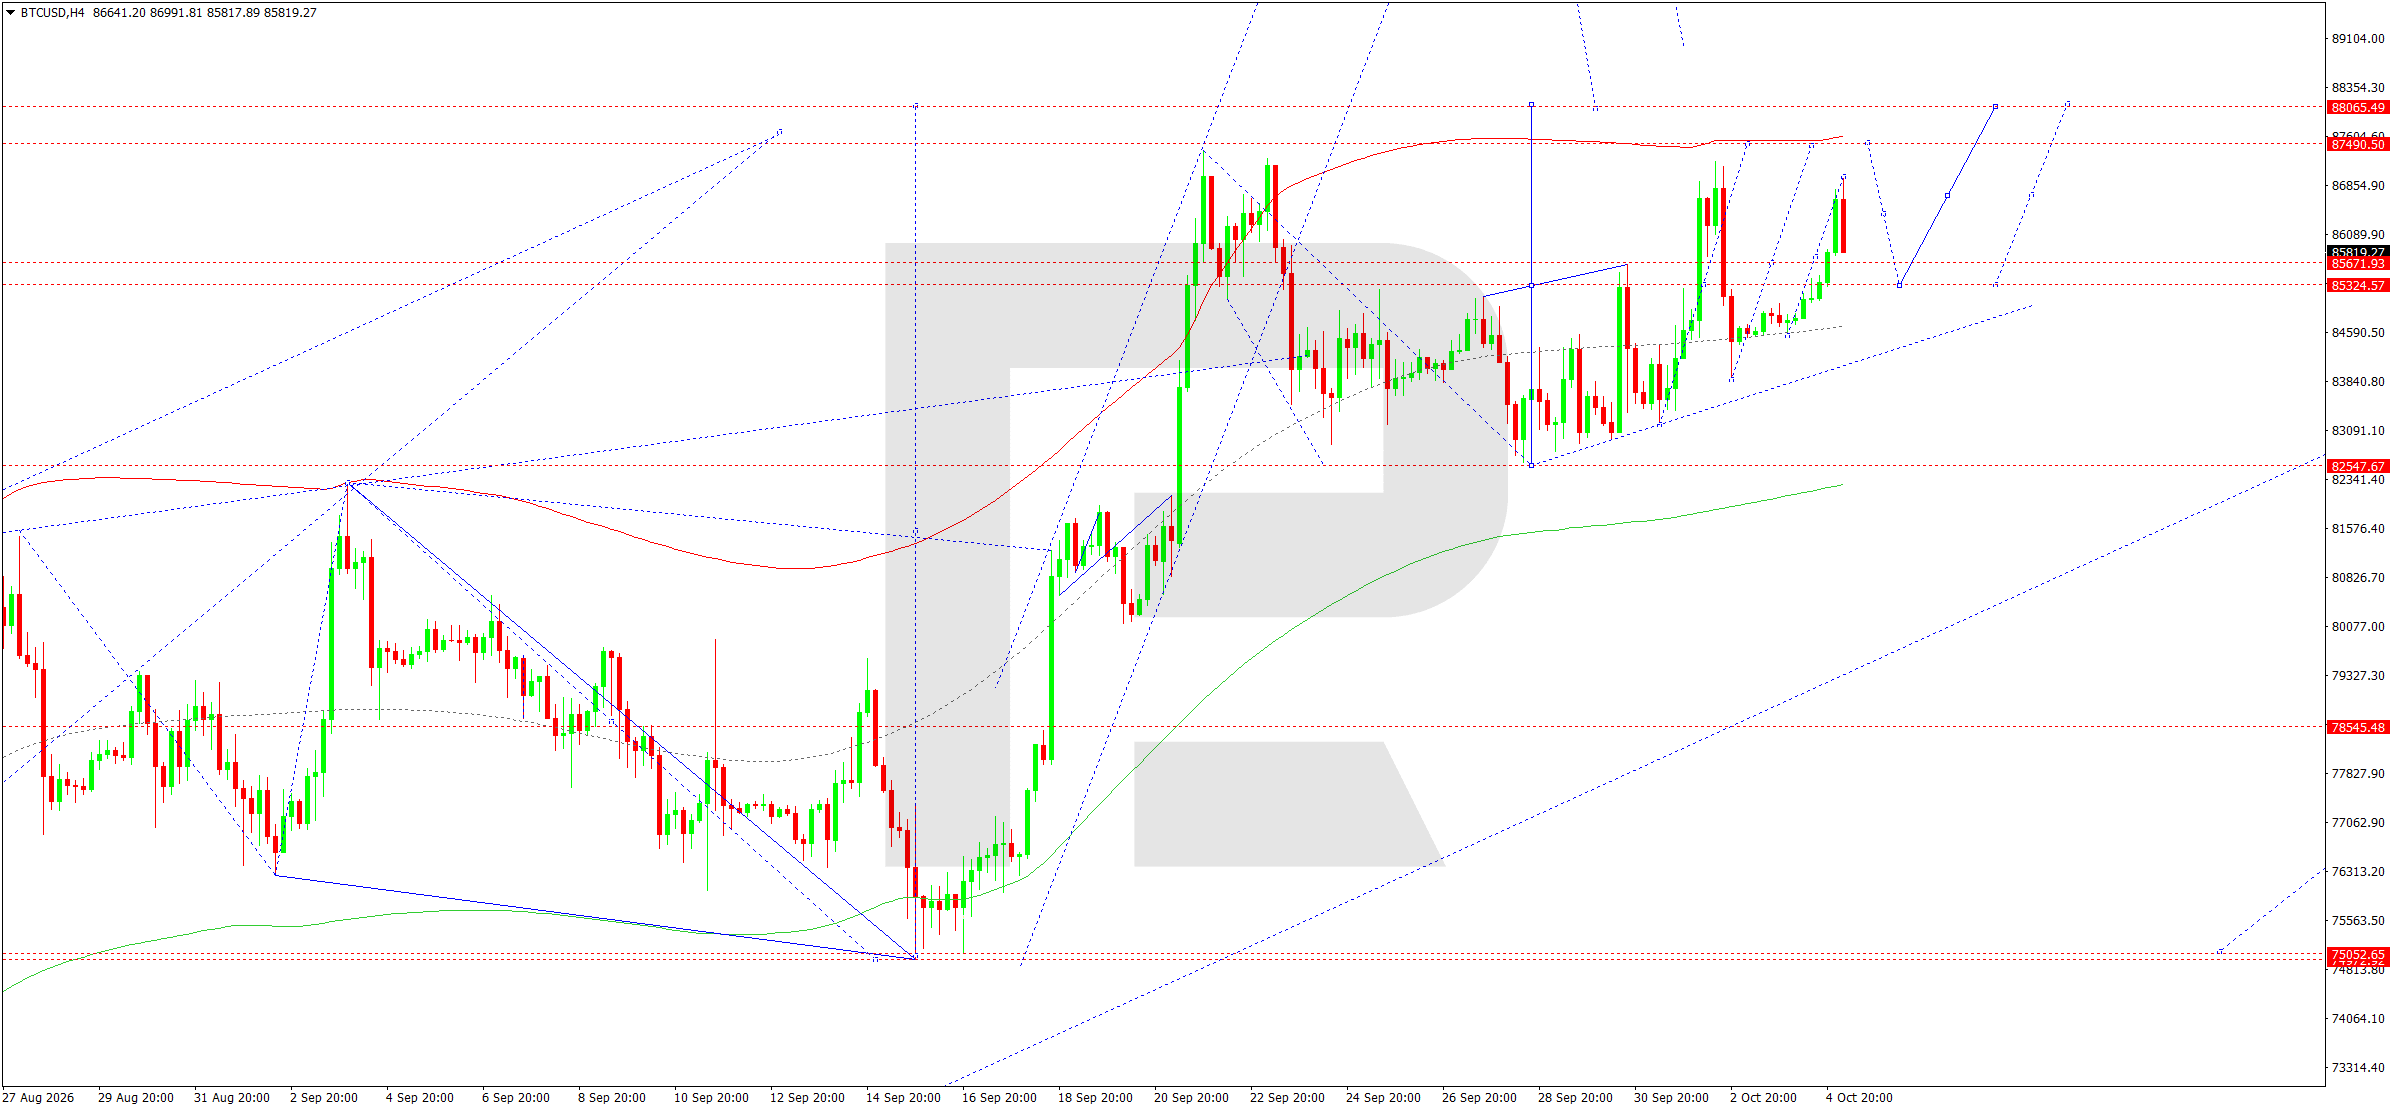
On the H4 chart, BTCUSD developed an upward wave after forming support around 82,548 and reached the 87,491 area. The subsequent correction returned the price towards 85,444–85,325, after which buyers became active again. This structure preserves the sequence of higher lows.
The matrix pivot is around 85,325. While the price remains above this level, the main scenario is continued growth. The nearest resistance level is located at 87,491. A breakout above it would allow the market to test 88,065. Above this level, there is room for the next upward wave to develop.
The central area of the Price Envelope around 85,700 is currently acting as dynamic support. An additional retest of this zone is possible before growth resumes. Only a sustained decline below 85,325 would weaken the short-term structure and increase the probability of a move towards 82,548. For the current session, buyers retain the advantage.
BTCUSD forecast scenario
Trading scenario: BUY
- Price at the time of writing: 85,762
- Entry price: 85,767
- Stop loss: 85,250
- Take profit: 88,065
- Risk-to-reward ratio: 1:4.45
The trade idea is valid until 8:00 AM on 6 October 2026 (server time, UTC+3).
Editors’ picks
 EURUSD forecast 2026–2027: technical analysis, price levels & predictions
The EURUSD outlook for 2026 and 2027: key levels on the daily chart, three trading scenarios and the policy gap between the Fed and the ECB that drives the pair.
 Gold (XAUUSD) forecast 2026: technical analysis, price levels & predictions
Where gold could trade in 2026: key levels, three trading scenarios with entry triggers and the forecasts from J.P. Morgan, Deutsche Bank and Goldman Sachs.
Forecasts presented in this section only reflect the author’s private opinion and should not be considered as guidance for trading. RoboForex bears no responsibility for trading results based on trading recommendations described in these analytical reviews.