
Daily technical analysis and forecast for 7 October 2026
Daily technical analysis and forecast for EURUSD, USDJPY, GBPUSD, AUDUSD, USDCAD, XAUUSD, US 500, and BTCUSD for 7 October 2026.
Each scenario on this page reflects the market structure on the H4 chart as of 10:00 UTC+3 on 7 October 2026. The assessment considers the current H4 chart structure, key support and resistance levels, the direction of the medium-term movement, and the prevailing fundamental backdrop.
EURUSD forecast
EURUSD remains under pressure from the combination of US interest rates and European political and fiscal risks. The US Federal Reserve is in focus ahead of the publication of the minutes of its September meeting. The market has noticeably reduced the probability of a rate hike as early as October, although expectations of additional tightening later in the year remain. This keeps US bond yields elevated and limits the euro’s recovery. The Dollar Index is strengthening again this morning after the previous decline.
For the single currency, the situation in the European debt market remains an additional factor. Concerns over French public finances had previously intensified selling pressure on the euro, although some recovery in French bonds temporarily eased the pressure. The geopolitical backdrop also supports safe-haven demand for the dollar: tensions in the Middle East are accompanied by higher oil prices, which at the same time increase inflation risks for the energy-importing eurozone.
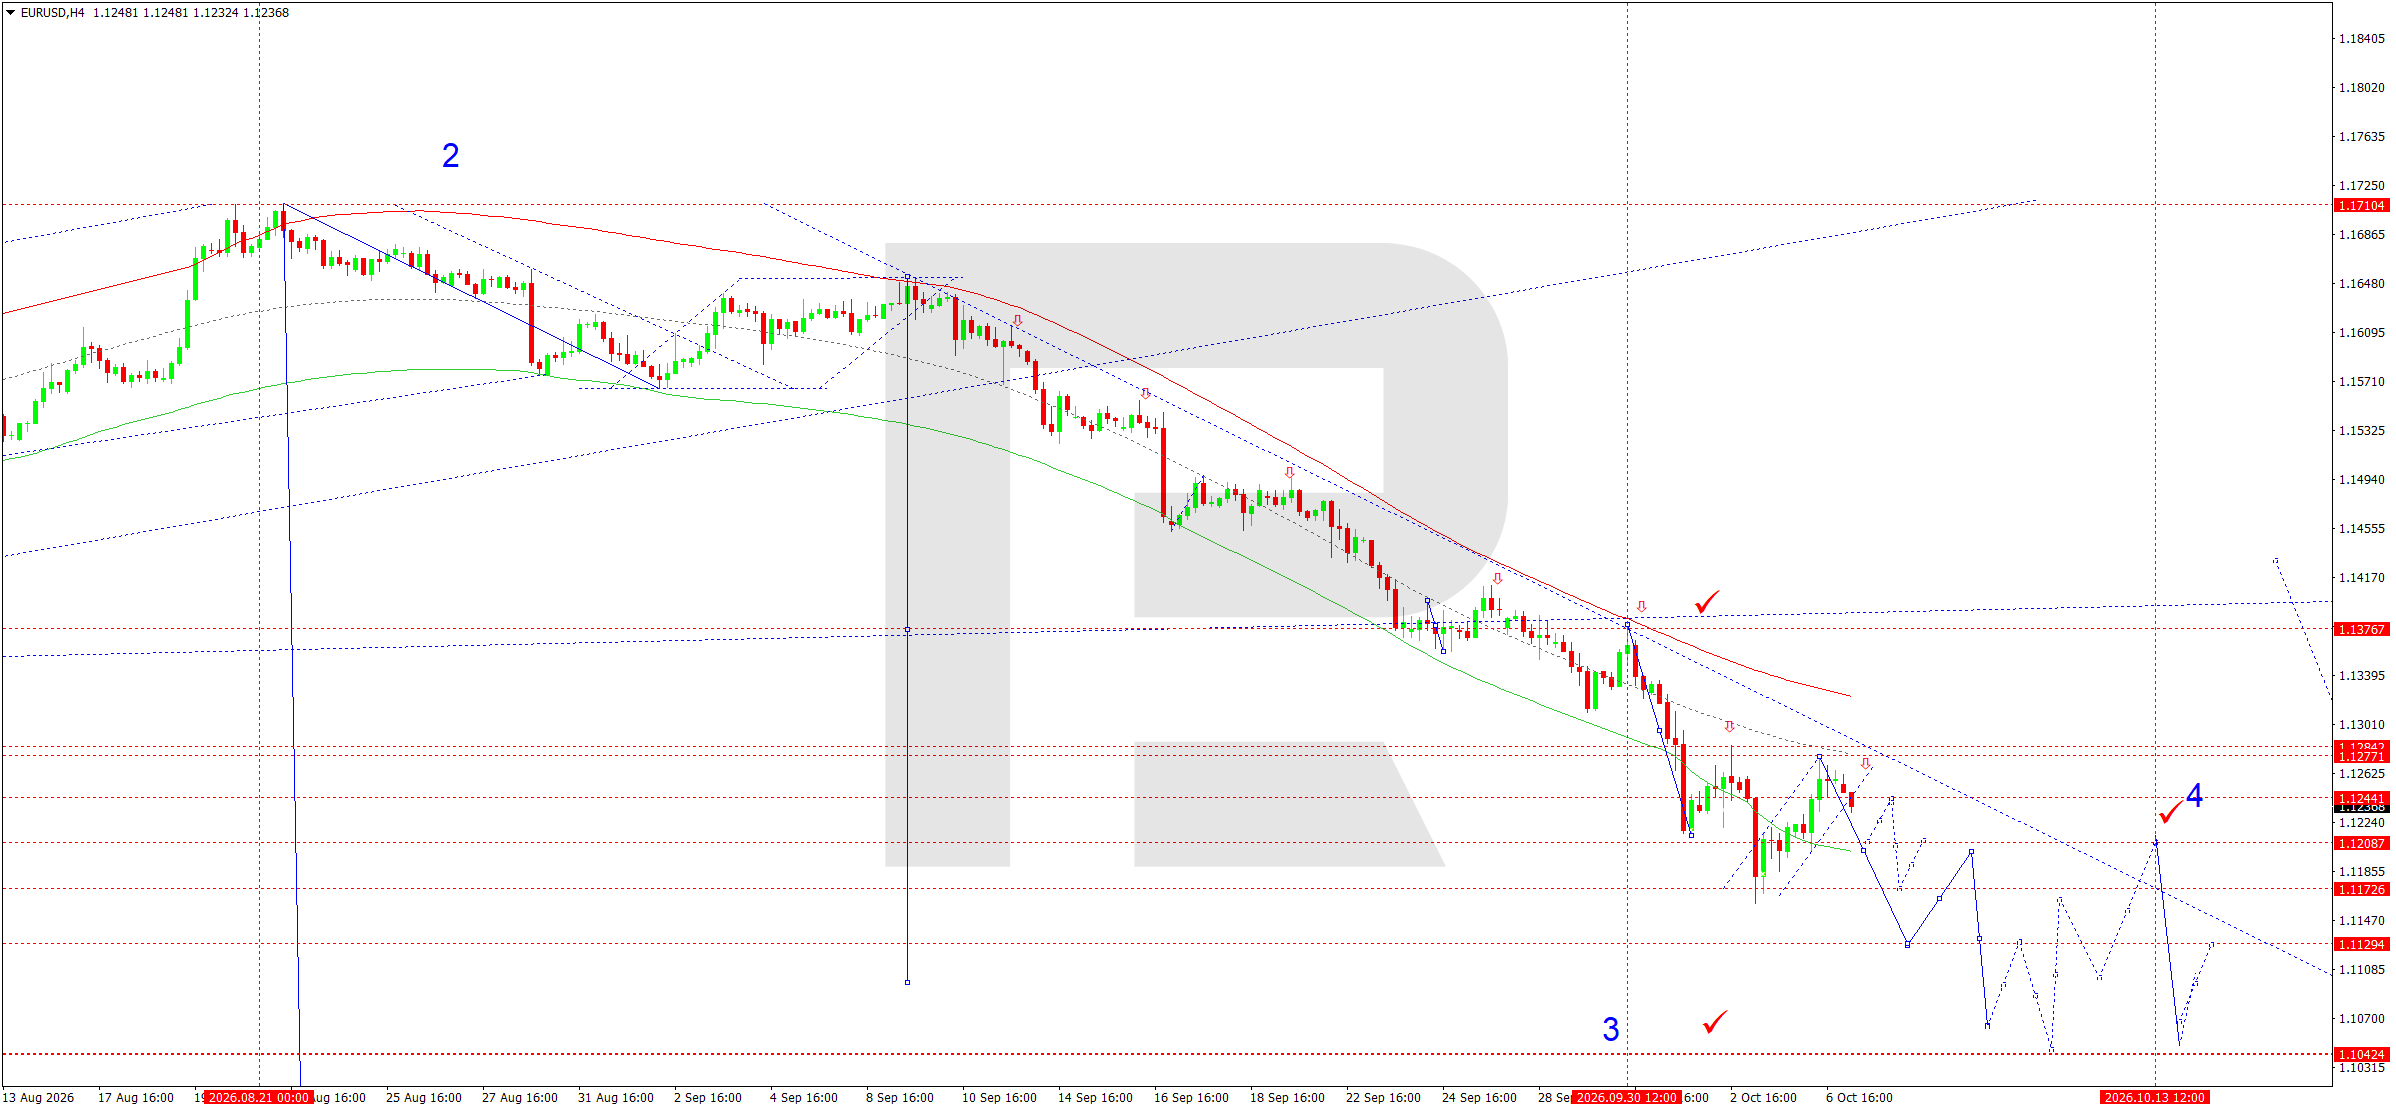
On the H4 chart, EURUSD retains a pronounced downtrend. After a corrective move, the market formed a local high in the 1.1275 area and resumed its decline. Today, the development of the wave towards 1.1210 remains relevant. A breakout below this level could open the way towards 1.1173–1.1160, with the next target in the 1.1130–1.1129 area. A more distant target of the current downward structure remains 1.1042.
The Elliott Wave structure and the position of the price relative to the descending channel confirm the sellers’ advantage. The matrix of the current wave has a pivot around 1.1275. The price remains below the dynamic resistance levels and continues to form a downward impulse after breaking 1.1240. A local return above 1.1244 could lead to a retest of 1.1275, although without consolidation above this zone such a move should be viewed as corrective. The main scenario for the trading day remains a decline with successive tests of 1.1210 and 1.1173.
EURUSD forecast scenario
Trading scenario: SELL
- Price at the time of writing: 1.1229
- Entry price: 1.1224
- Stop loss: 1.1275
- Take profit: 1.1129
- Risk-to-reward ratio: 1:1.86
The trade idea is valid until 8:00 AM on 8 October 2026 (server time, UTC+3).
USDJPY forecast
USDJPY continues to receive support from high US government bond yields and the persistent interest rate differential. The US Federal Reserve remains the main source of event risk today, as investors await the minutes of the September meeting and comments from policymakers. The probability of an immediate rate hike has declined, but the market still allows for further tightening later in the year. The yield on 10-year US Treasuries remains above 5%, providing fundamental support for the dollar against the low-yielding yen.
At the same time, the Bank of Japan retains the option of further monetary policy normalisation, as inflation is close to target. This limits the potential for uncontrolled yen weakness. Another risk factor is the Japanese currency’s high sensitivity to global safe-haven demand. Escalating tensions in the Middle East and rising oil prices are potentially negative for Japan’s trade balance, but in the event of a sharp shift to risk-off sentiment, the yen could temporarily strengthen.
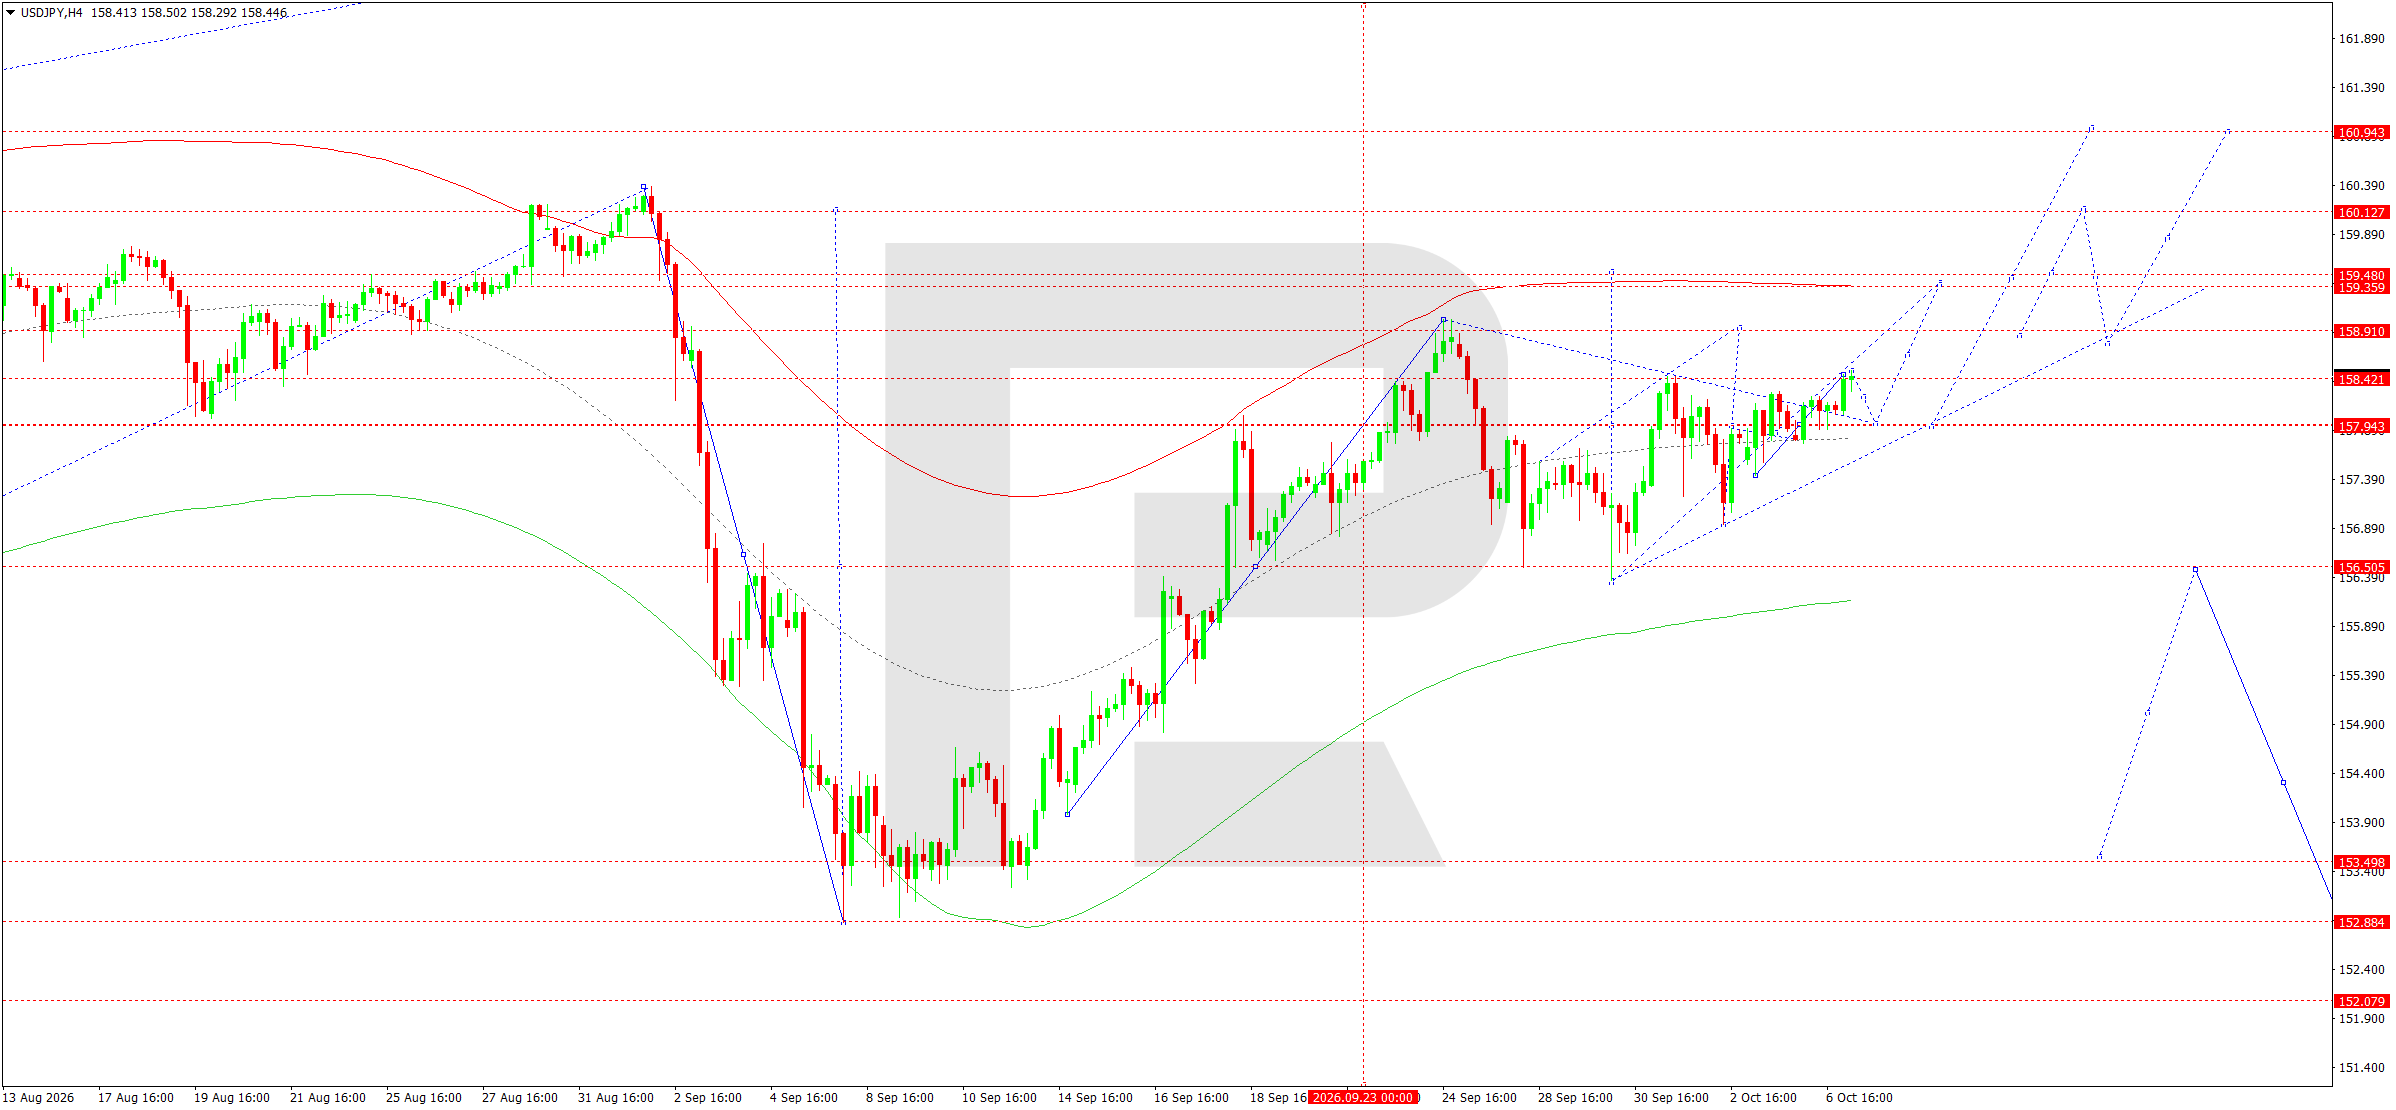
On the H4 chart, the market broke above resistance at 157.94 and continued to develop its upward structure. After forming a range above 158.40, the main target remains 158.91. Consolidation above this level would open the way for the impulse to continue towards 159.40–159.48. The next resistance levels are 160.13 and 160.94.
The Elliott Wave structure continues to favour the bullish scenario. The matrix of the current move, with a pivot at 157.94, also points to the possibility of further growth. The price is holding above the central area of the Price Envelope, while the sequence of higher local lows confirms the presence of buyers. A move below 157.94 would weaken the current momentum, while a breakout below 157.04 would signal a deeper correction.
While these support levels hold, declines should be viewed primarily as technical pullbacks within the upward wave. For today, the preferred scenario is continued growth first towards 158.91 and then 159.40.
USDJPY forecast scenario
Trading scenario: BUY
- Price at the time of writing: 158.40
- Entry price: 158.45
- Stop loss: 157.94
- Take profit: 159.40
- Risk-to-reward ratio: 1:1.86
The trade idea is valid until 8:00 AM on 8 October 2026 (server time, UTC+3).
GBPUSD forecast
The fundamental backdrop for GBPUSD remains mixed, but in the short term the US currency retains the advantage. The Federal Reserve is preparing to publish the minutes of its September meeting. Although the probability of a rate hike in October has declined noticeably, the market continues to price in the possibility of another increase later in the year. High US bond yields create additional demand for the dollar and limit attempts by sterling to recover.
At its September meeting, the Bank of England kept the rate at 3.75%, with three members of the Monetary Policy Committee voting for an increase to 4%. UK inflation reached 3.1% in August, while the energy shock creates a risk of further acceleration. This configuration limits the BoE’s room to ease policy and fundamentally supports sterling, although at the same time high energy prices worsen the outlook for the UK economy. Rising oil prices amid Middle East risks add to this uncertainty.
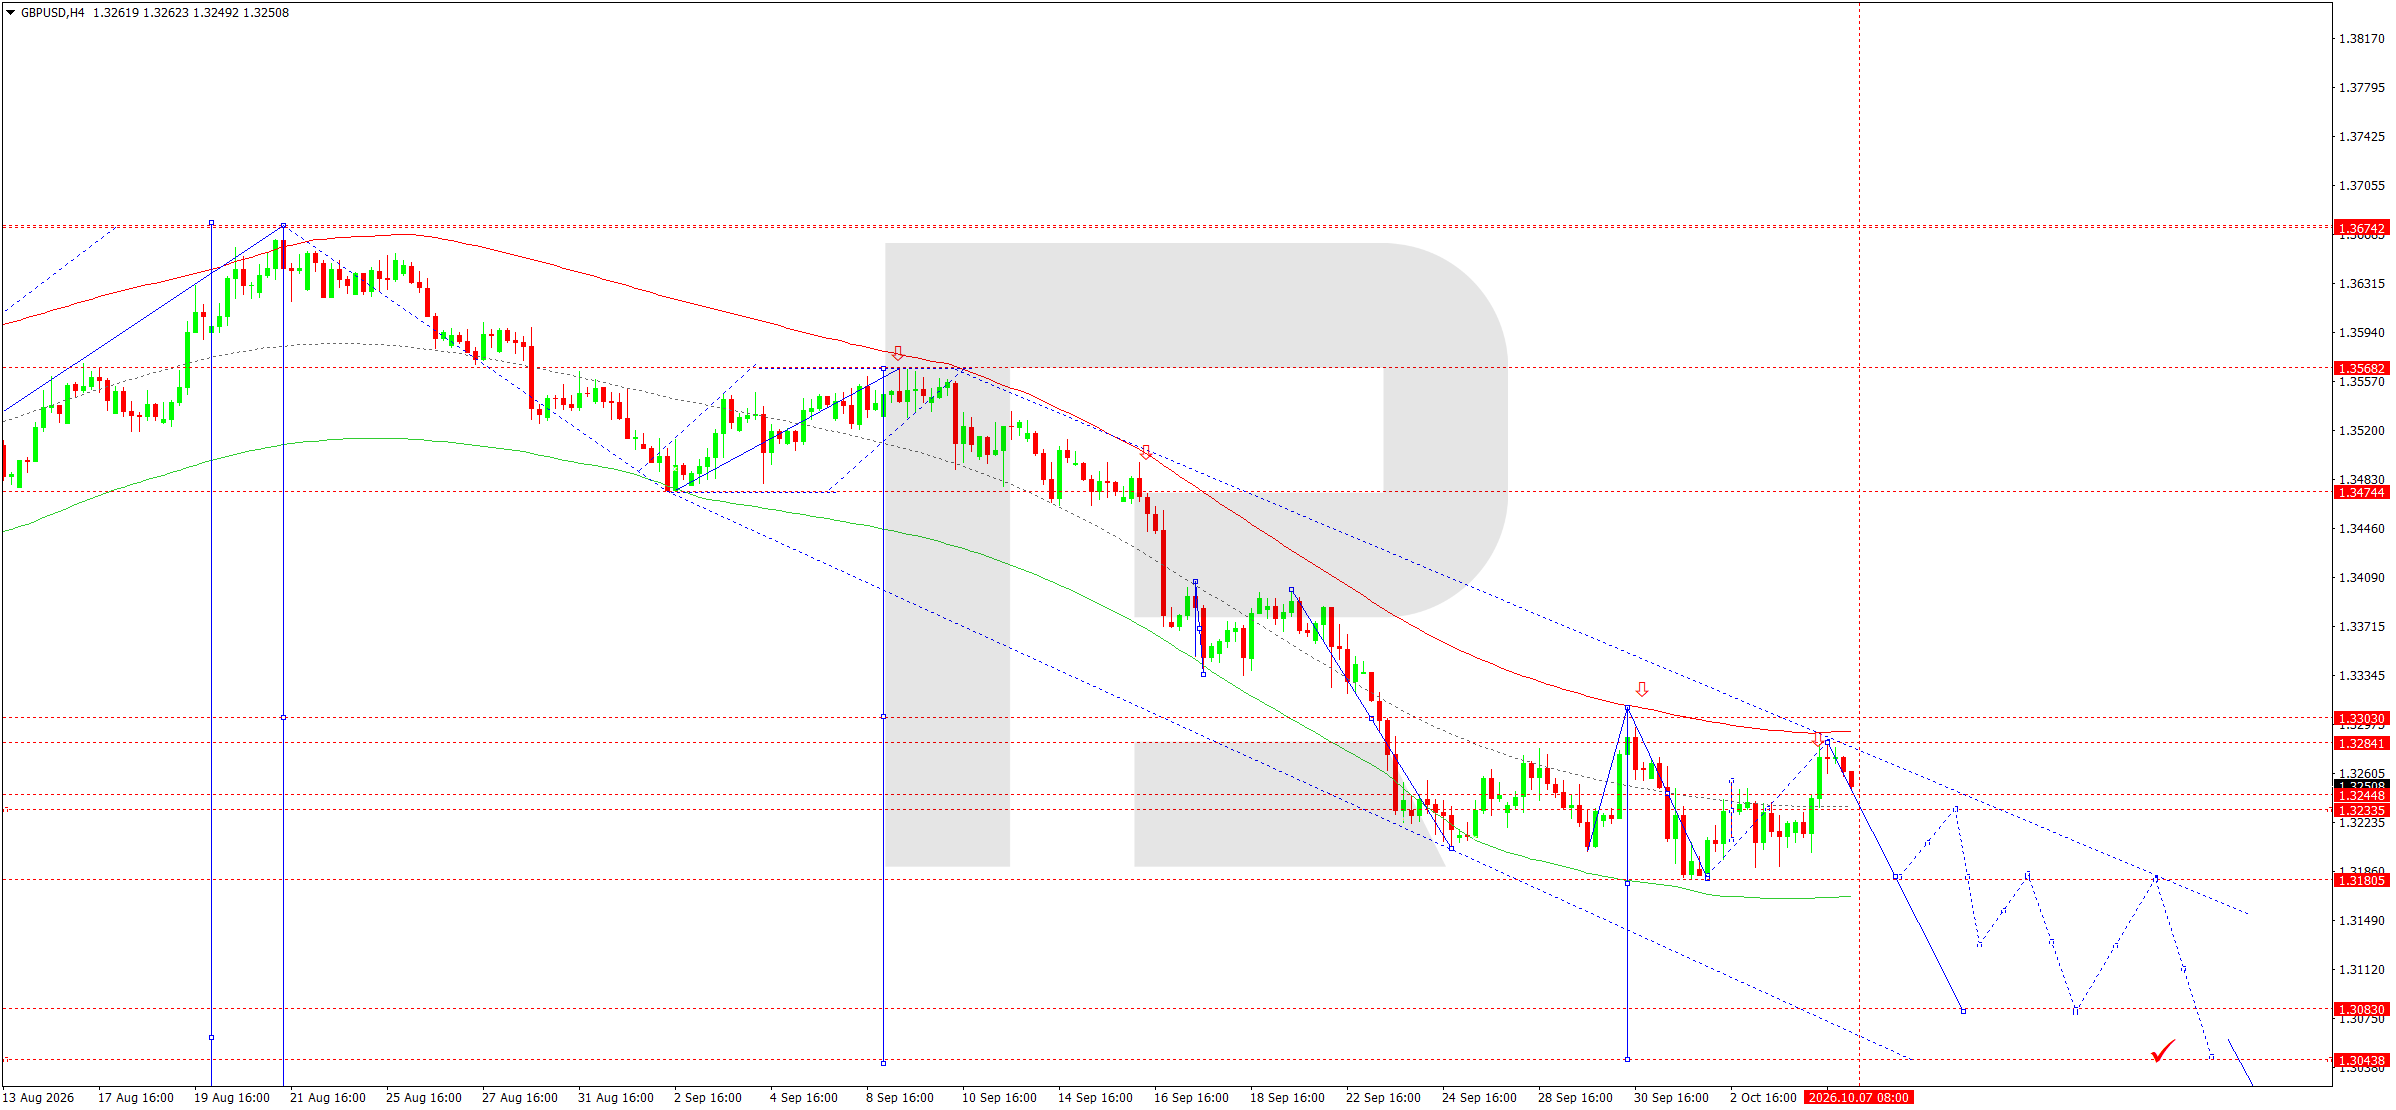
On the H4 chart, GBPUSD retains a stable downtrend. After completing a corrective wave around 1.3284, the market moved lower again and is testing the 1.3244–1.3234 area. The next technical target is 1.3180. A breakout below this level could open potential for a decline towards 1.3102–1.3083 and then towards 1.3044.
The Elliott Wave structure and the descending channel confirm continued selling pressure. The downward wave matrix has a pivot around 1.3244. The price remains below the main dynamic resistance levels, while the recovery attempt towards 1.3284 was halted near the upper boundary of the local structure. Therefore, returns towards the 1.3244–1.3284 area are still viewed as corrective.
A sustained breakout above 1.3303 would be required to change the medium-term scenario. Until then, the main scenario remains a continuation of the downward wave first towards 1.3180 and then 1.3102. The lower area of the Price Envelope around 1.3044 remains a more distant target.
GBPUSD forecast scenario
Trading scenario: SELL
- Price at the time of writing: 1.3245
- Entry price: 1.3240
- Stop loss: 1.3303
- Take profit: 1.3102
- Risk-to-reward ratio: 1:2.19
The trade idea is valid until 8:00 AM on 8 October 2026 (server time, UTC+3).
AUDUSD forecast
For AUDUSD, the external backdrop remains predominantly unfavourable. The US dollar is recovering this morning ahead of the publication of the US Federal Reserve minutes. Despite the lower probability of another rate hike directly in October, expectations of further policy tightening remain. High US Treasury yields increase the appeal of the dollar and put pressure on high-beta currencies, including the Australian dollar.
A further factor is the decline in risk appetite across Asian markets. Regional indices are trading lower this morning amid rising tensions between Saudi Arabia and the Houthis and higher oil prices. For the Australian currency, the state of Asian demand is particularly important because of the Australian economy’s high dependence on commodity trade and the Chinese cycle.
The Reserve Bank of Australia, while facing persistent inflation risks, has to take into account both energy costs and the outlook for domestic demand. While global yields remain high and the dollar strengthens, the fundamental backdrop is more consistent with continued pressure on AUDUSD.
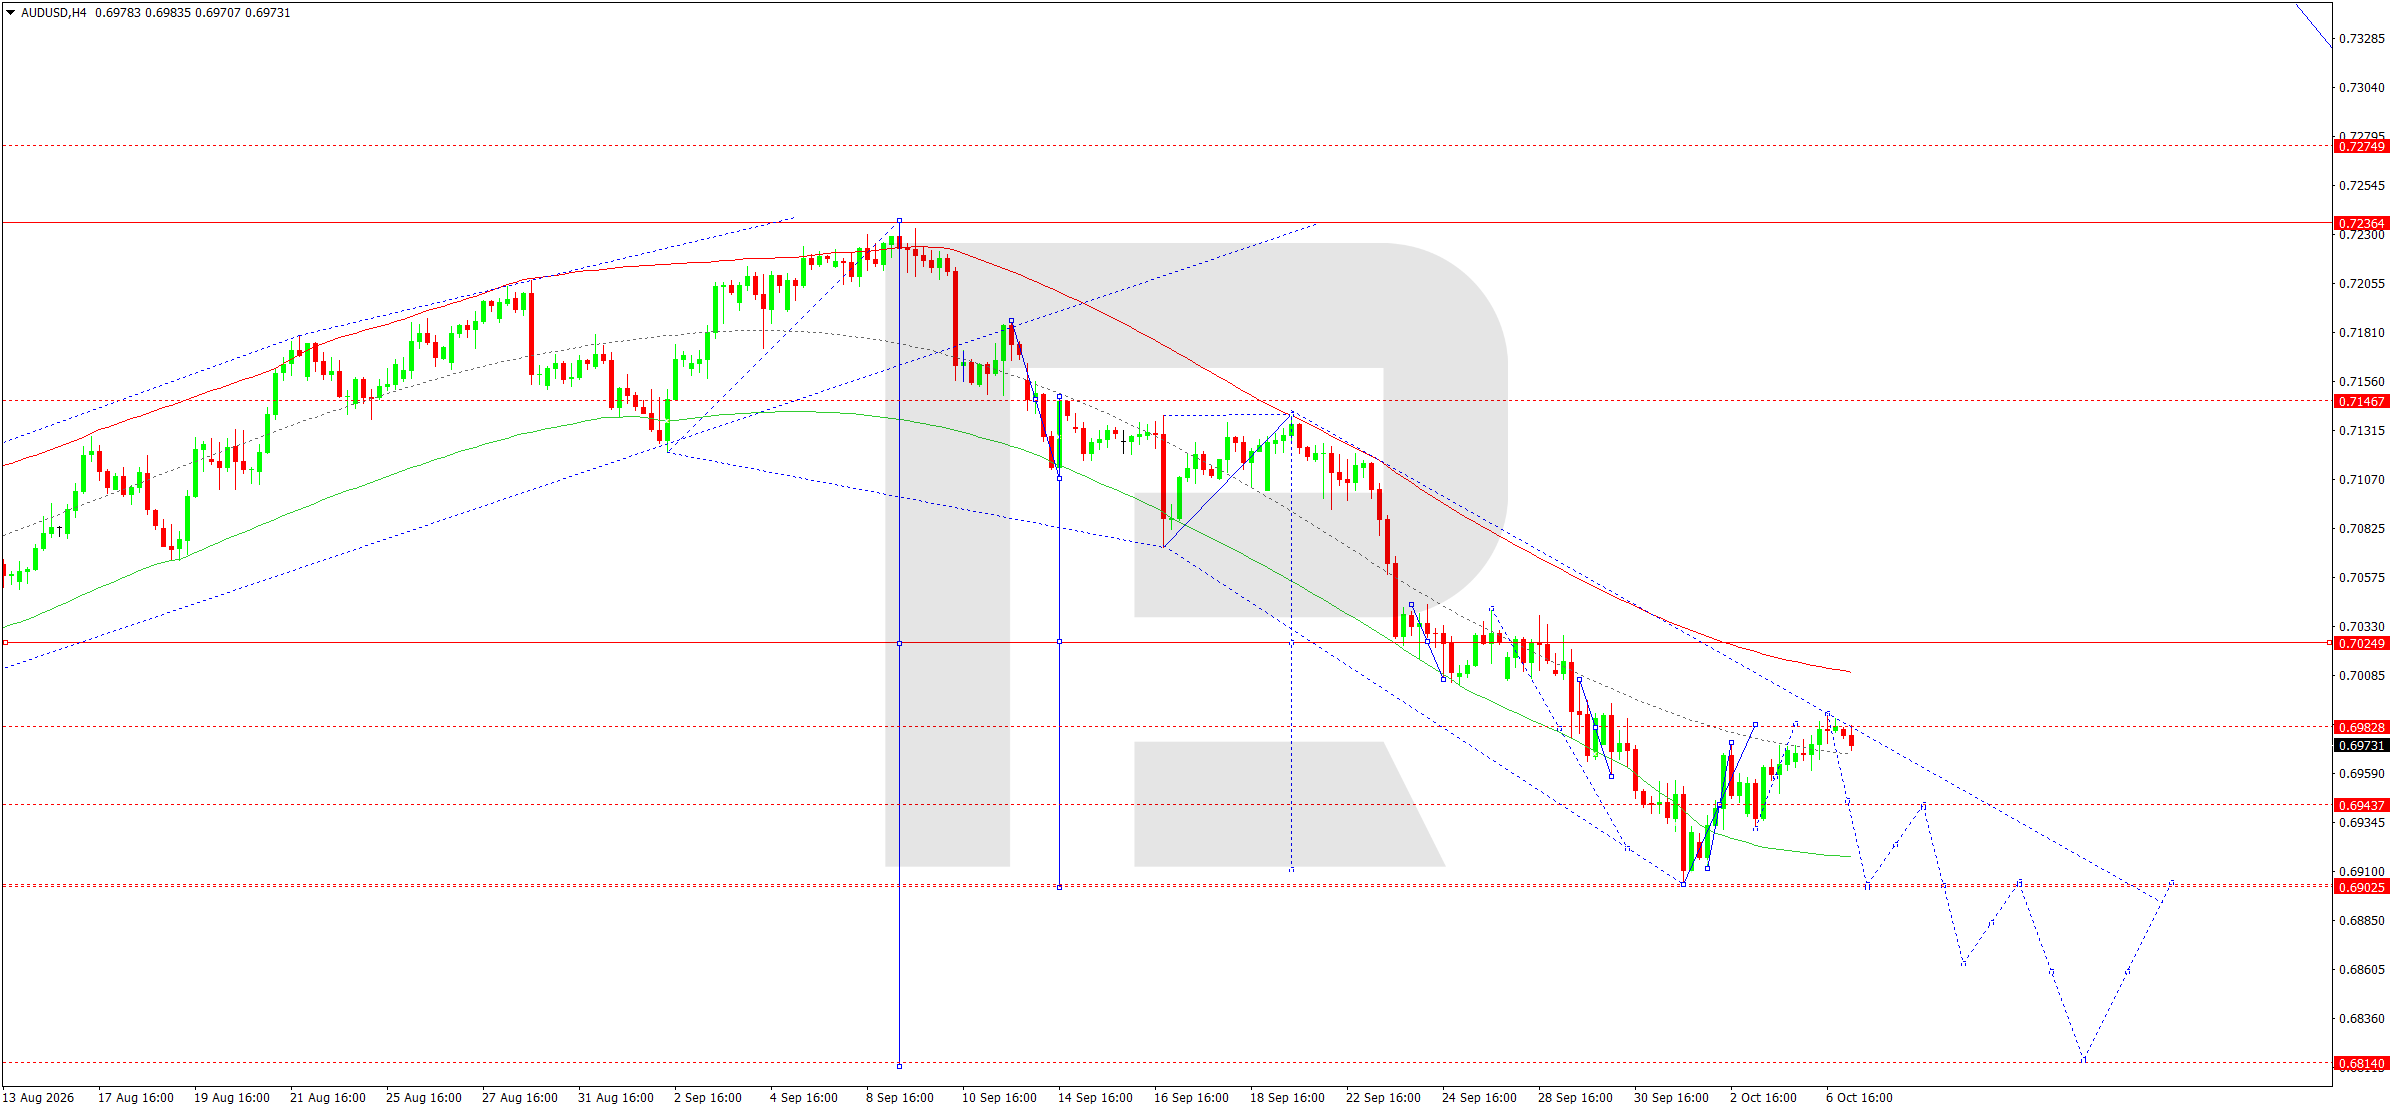
EN OfficeOn the H4 chart, the downward structure remains intact. After forming a high around 0.7236, the market declined steadily within a directional channel and reached the 0.6905 area. The subsequent correction towards 0.6983 has not yet disrupted the main bearish scenario. The nearest intermediate level is 0.6944, after which sellers may retest 0.6905.
The downward wave matrix has a pivot around 0.7029. The price is below this level and below the descending dynamic resistance levels. The Elliott Wave structure allows for the local correction to end around 0.6983 and for another downward impulse to form. A breakout below 0.6905 would confirm continuation of the move with intermediate corrections and open potential towards 0.6860 and then the main target at 0.6814. Only consolidation above 0.7029 would materially weaken this scenario. Therefore, selling remains preferable for the current trading session.
AUDUSD forecast scenario
Trading scenario: SELL
- Price at the time of writing: 0.6969
- Entry price: 0.6964
- Stop loss: 0.7029
- Take profit: 0.6814
- Risk-to-reward ratio: 1:2.31
The trade idea is valid until 8:00 AM on 8 October 2026 (server time, UTC+3).
USDCAD forecast
USDCAD is being driven by two opposing factors: high US interest rates and a notable rise in oil prices. The Federal Reserve remains in focus ahead of the publication of the minutes of its September meeting. The market has lowered its estimate of the probability of a rate hike in October but continues to expect further tightening later. High US government bond yields support the dollar and preserve the fundamental basis for elevated USDCAD quotes.
On the other hand, the Bank of Canada is keeping the target overnight rate at 2.25%. Oil is a significant source of support for the Canadian dollar: Brent rose above 100 USD per barrel this morning amid the threat of supply disruptions, weather risks in the Gulf of Mexico, and escalating tensions in the Middle East. For the Canadian dollar, as the currency of a major energy exporter, this partially offsets the US dollar’s yield advantage.
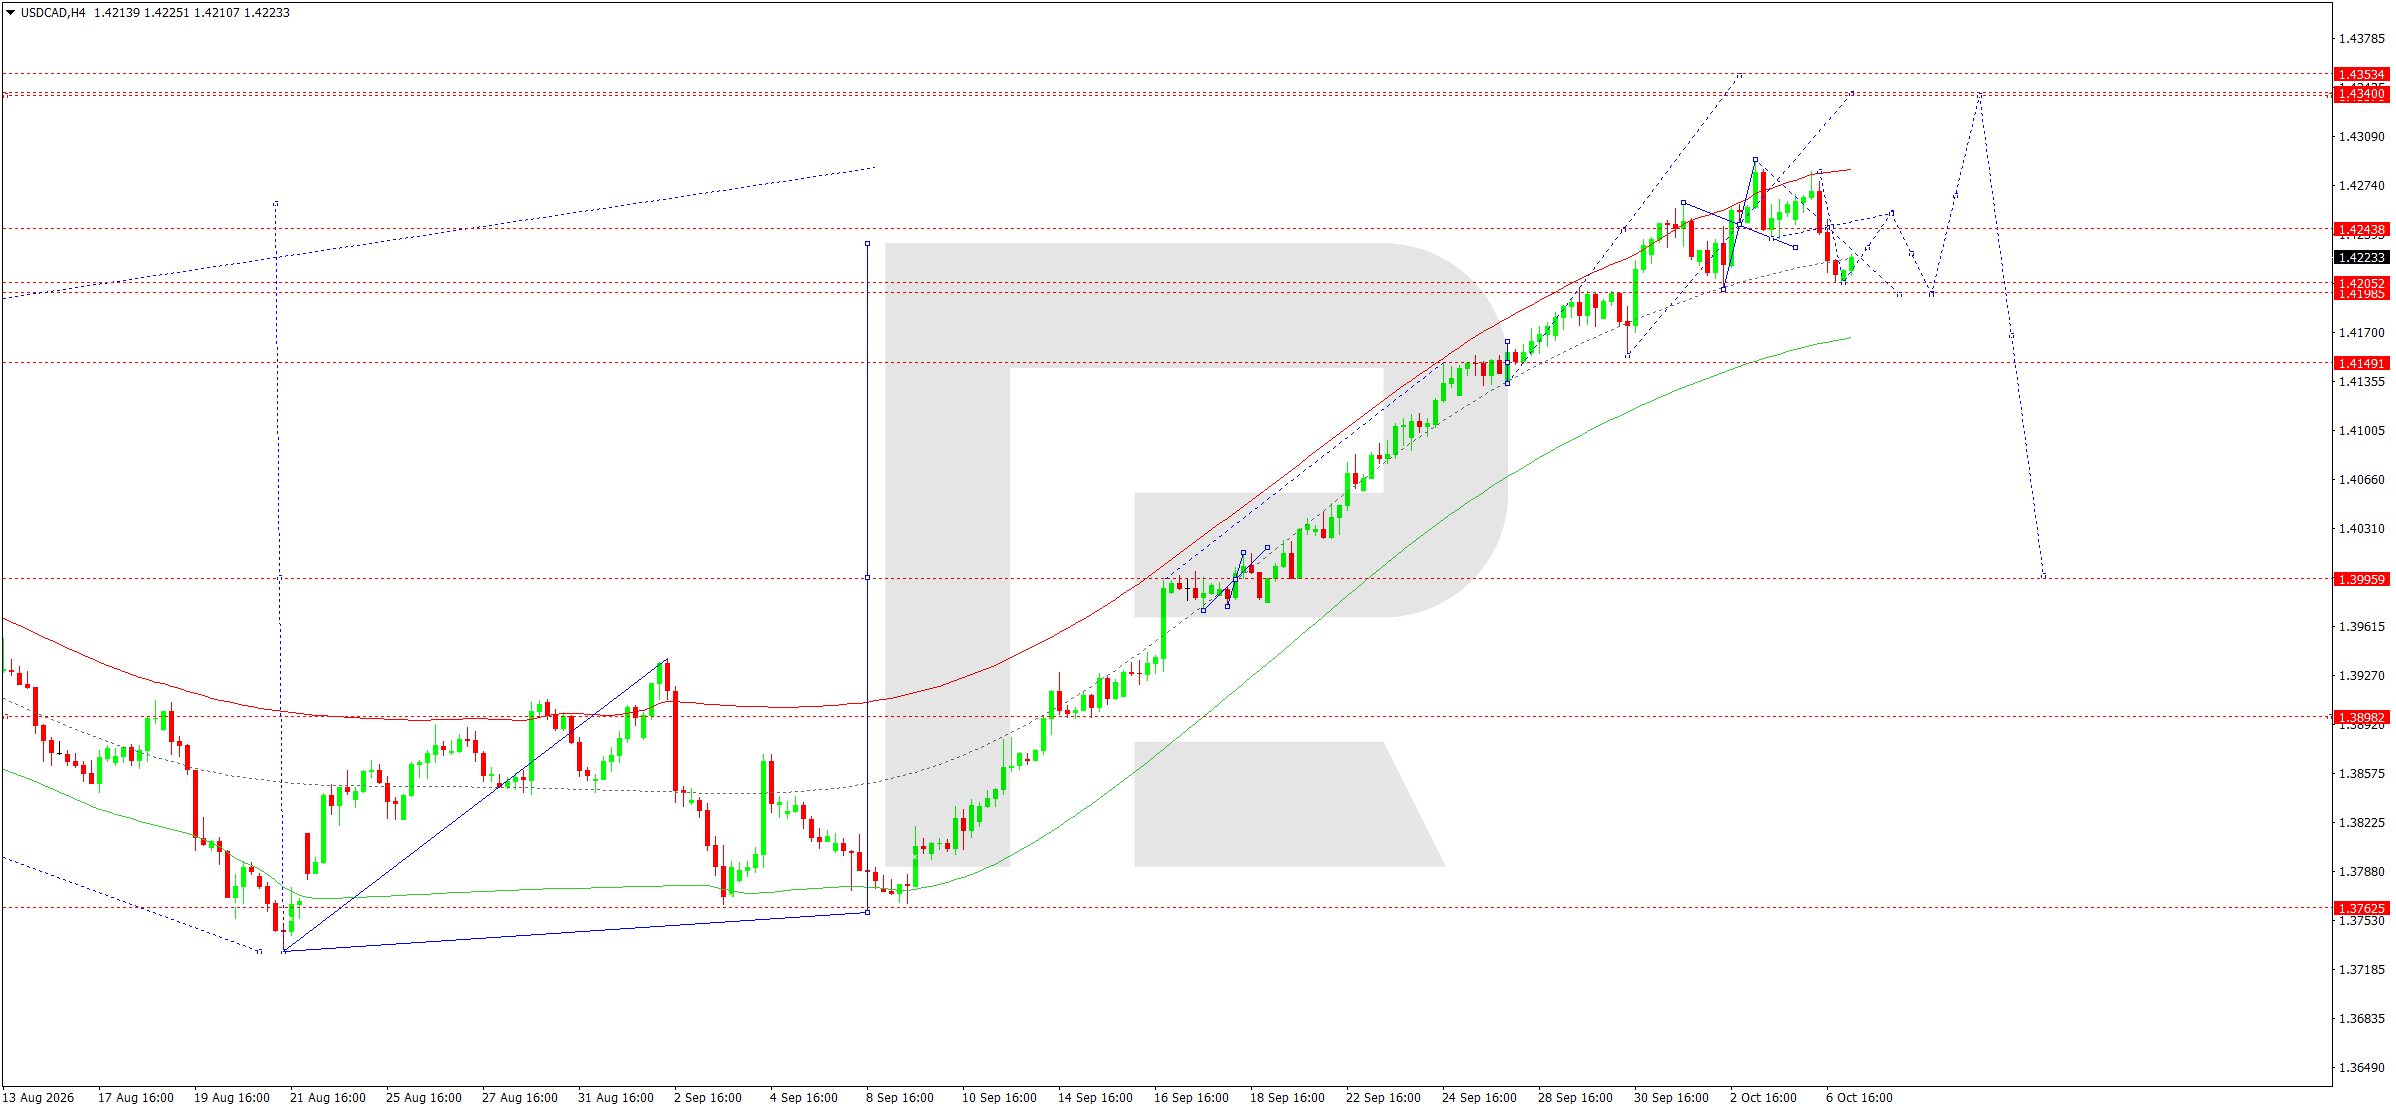
On the H4 chart, after a strong upward wave from the 1.3763 area, USDCAD formed a high around 1.4285 and moved into a correction. The market is currently holding around 1.4223 after declining towards 1.4206. The main local scenario remains the formation of a consolidation above the 1.4195–1.4205 zone.
The matrix of the main upward wave has a pivot around 1.4000, so the medium-term bullish structure remains intact. At the same time, the price has retreated from the upper boundary of the Price Envelope, preserving the probability of another corrective leg towards 1.4195. Once the correction is complete, another attempt to rise towards 1.4244 is expected, followed by 1.4340–1.4353. Consolidation below 1.4195 would change the short-term structure and open the way towards 1.4149. While this support holds, the decline is viewed as a correction within the main upward wave.
USDCAD forecast scenario
Trading scenario: BUY
- Price at the time of writing: 1.4226
- Entry price: 1.4231
- Stop loss: 1.4195
- Take profit: 1.4340
- Risk-to-reward ratio: 1:3.03
The trade idea is valid until 8:00 AM on 8 October 2026 (server time, UTC+3).
XAUUSD forecast
Gold is caught between support from geopolitical uncertainty and pressure from high interest rates. The Fed publishes the minutes of its September meeting today, so the market is looking for further signals regarding the future path of rates. The probability of an increase as early as October has fallen substantially, but investors continue to price in the possibility of tightening later in the year. High Treasury yields remain a negative factor for gold, which does not generate interest income.
At the same time, the geopolitical backdrop supports safe-haven demand. Rising tensions in the Middle East have led to another increase in oil prices and raise the risk that global inflationary pressure will persist. Gold received support the day before from lower yields and a weaker dollar, but on the morning of 7 October prices came under pressure again: spot gold fell to around 4,137. As a result, short-term dynamics are particularly sensitive to US rates and the dollar.
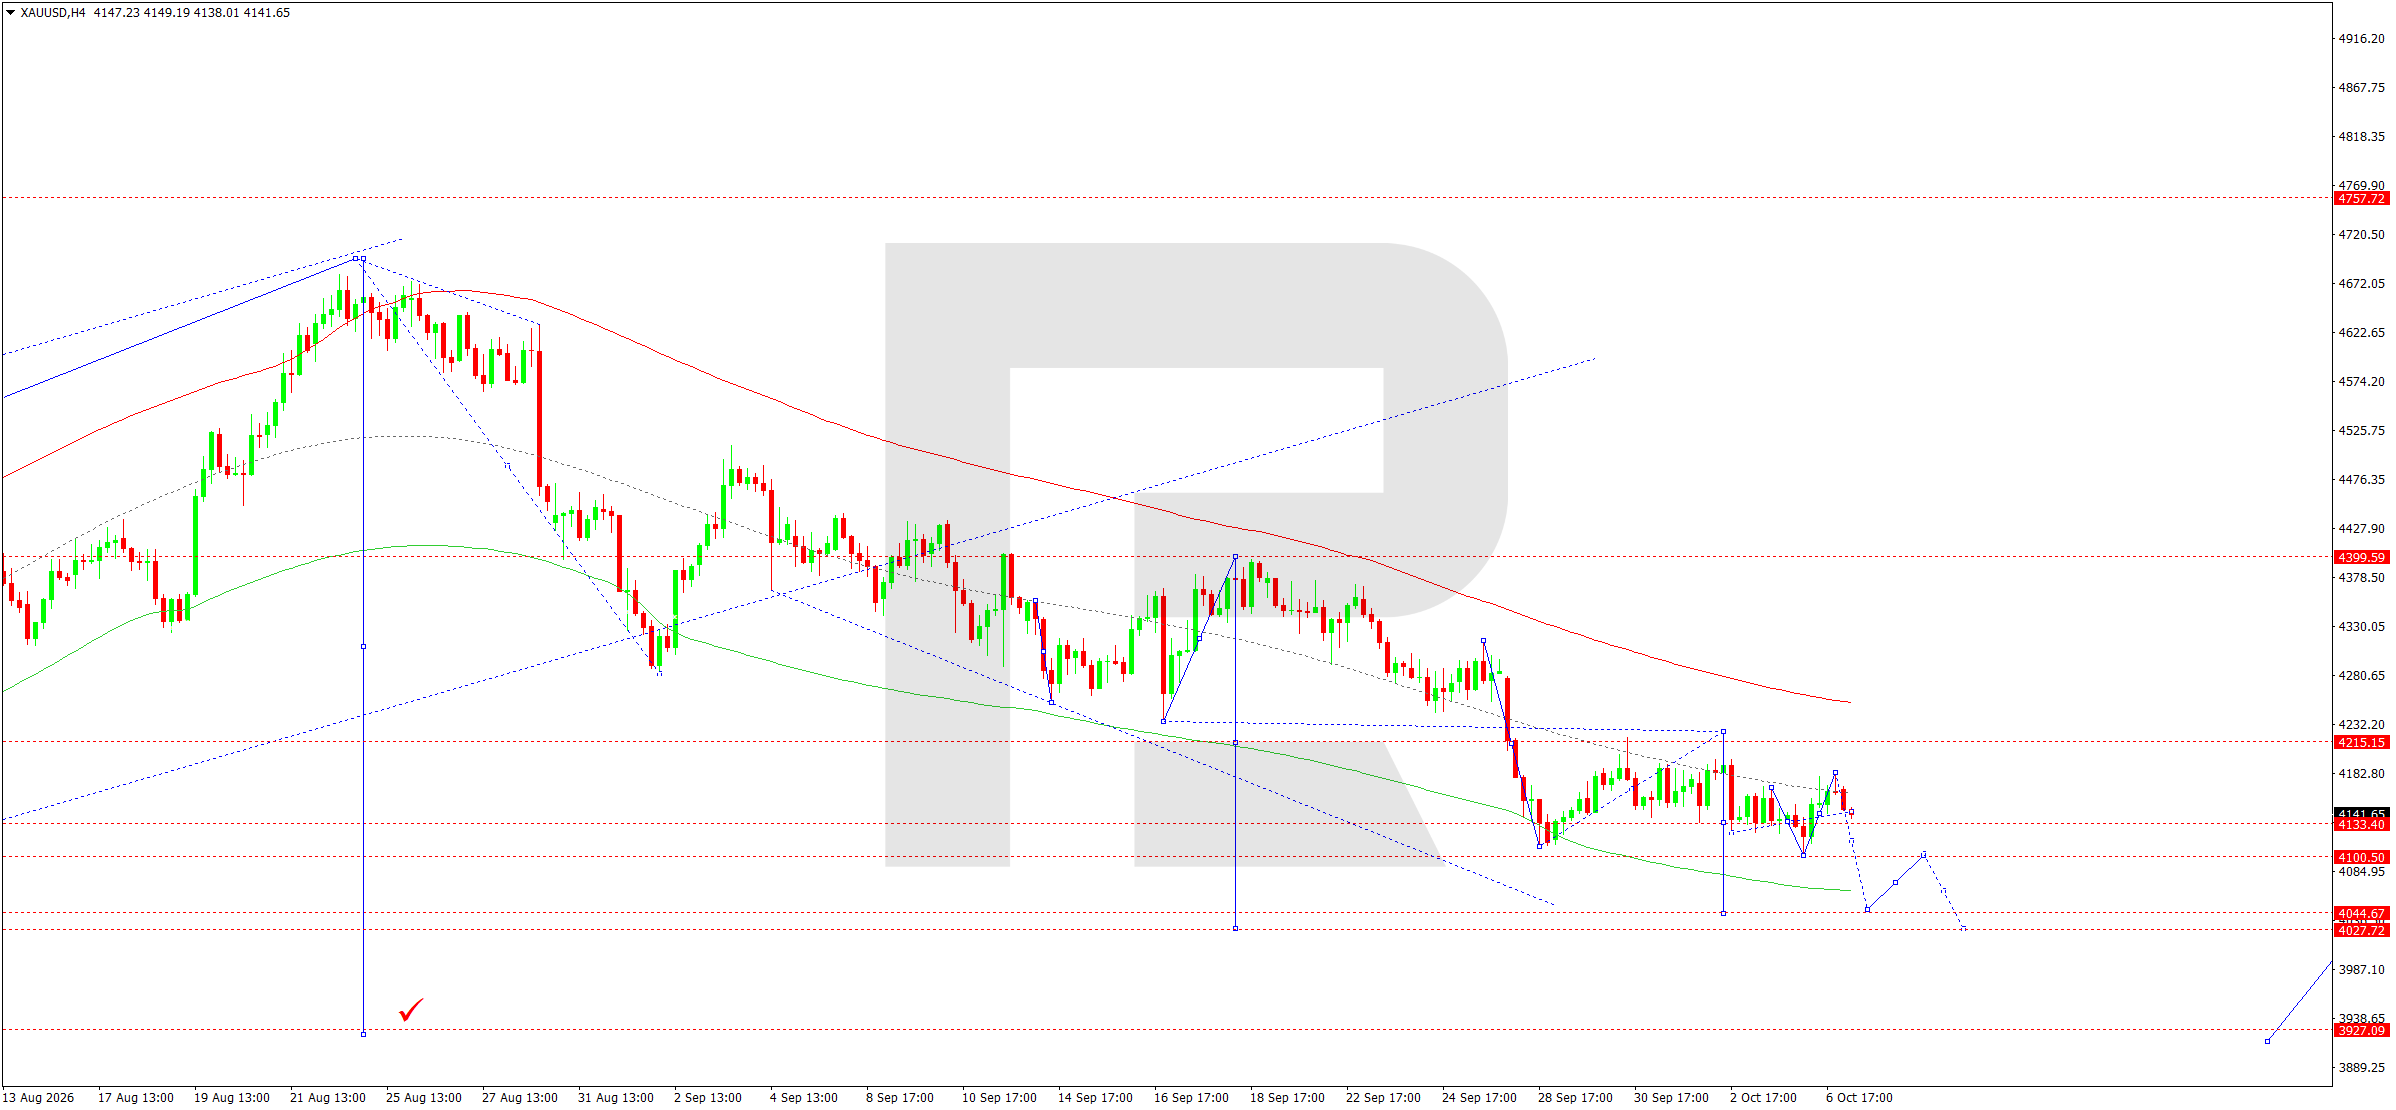
On the H4 chart, XAUUSD retains a downward structure. After a corrective rise towards 4,183, the market fell back into the 4,133 area. The current consolidation is forming directly above important support, but the sequence of lower highs indicates that sellers retain the initiative.
The Elliott Wave structure and the downward wave matrix with a pivot around 4,308 confirm the main bearish scenario. The price is below the main dynamic resistance levels and is moving towards the lower part of the Price Envelope.
The nearest support is around 4,100. A breakout below it would open the way towards 4,044, after which the target would be 4,020. The chart also highlights a more distant area at 3,927. A return above 4,215 would be the first sign of weakening selling pressure, but until that happens, corrective rallies are preferably viewed as opportunities to continue selling.
XAUUSD forecast scenario
Trading scenario: SELL
- Price at the time of writing: 4,133
- Entry price: 4,128
- Stop loss: 4,215
- Take profit: 4,020
- Risk-to-reward ratio: 1:1.32
The trade idea is valid until 8:00 AM on 8 October 2026 (server time, UTC+3).
US 500 forecast
The US stock market approaches the trading session after setting new all-time highs. The S&P 500 and Nasdaq were supported by the technology sector and continued optimism surrounding companies linked to artificial intelligence. The start of the corporate earnings season is also supporting demand for equities. However, the combination of high valuations and sharply higher government bond yields makes the market sensitive to any changes in interest-rate expectations.
The Federal Reserve publishes the minutes of its September meeting today. The probability of a rate hike in October has declined, although the market continues to price in a significant probability of further tightening by the end of the year. The yield on 10-year US Treasuries remains near multi-year highs, creating competition for equities.
An additional risk comes from rising oil prices and tensions in the Middle East. Asian markets declined this morning, while US indices remain near the record levels reached earlier.
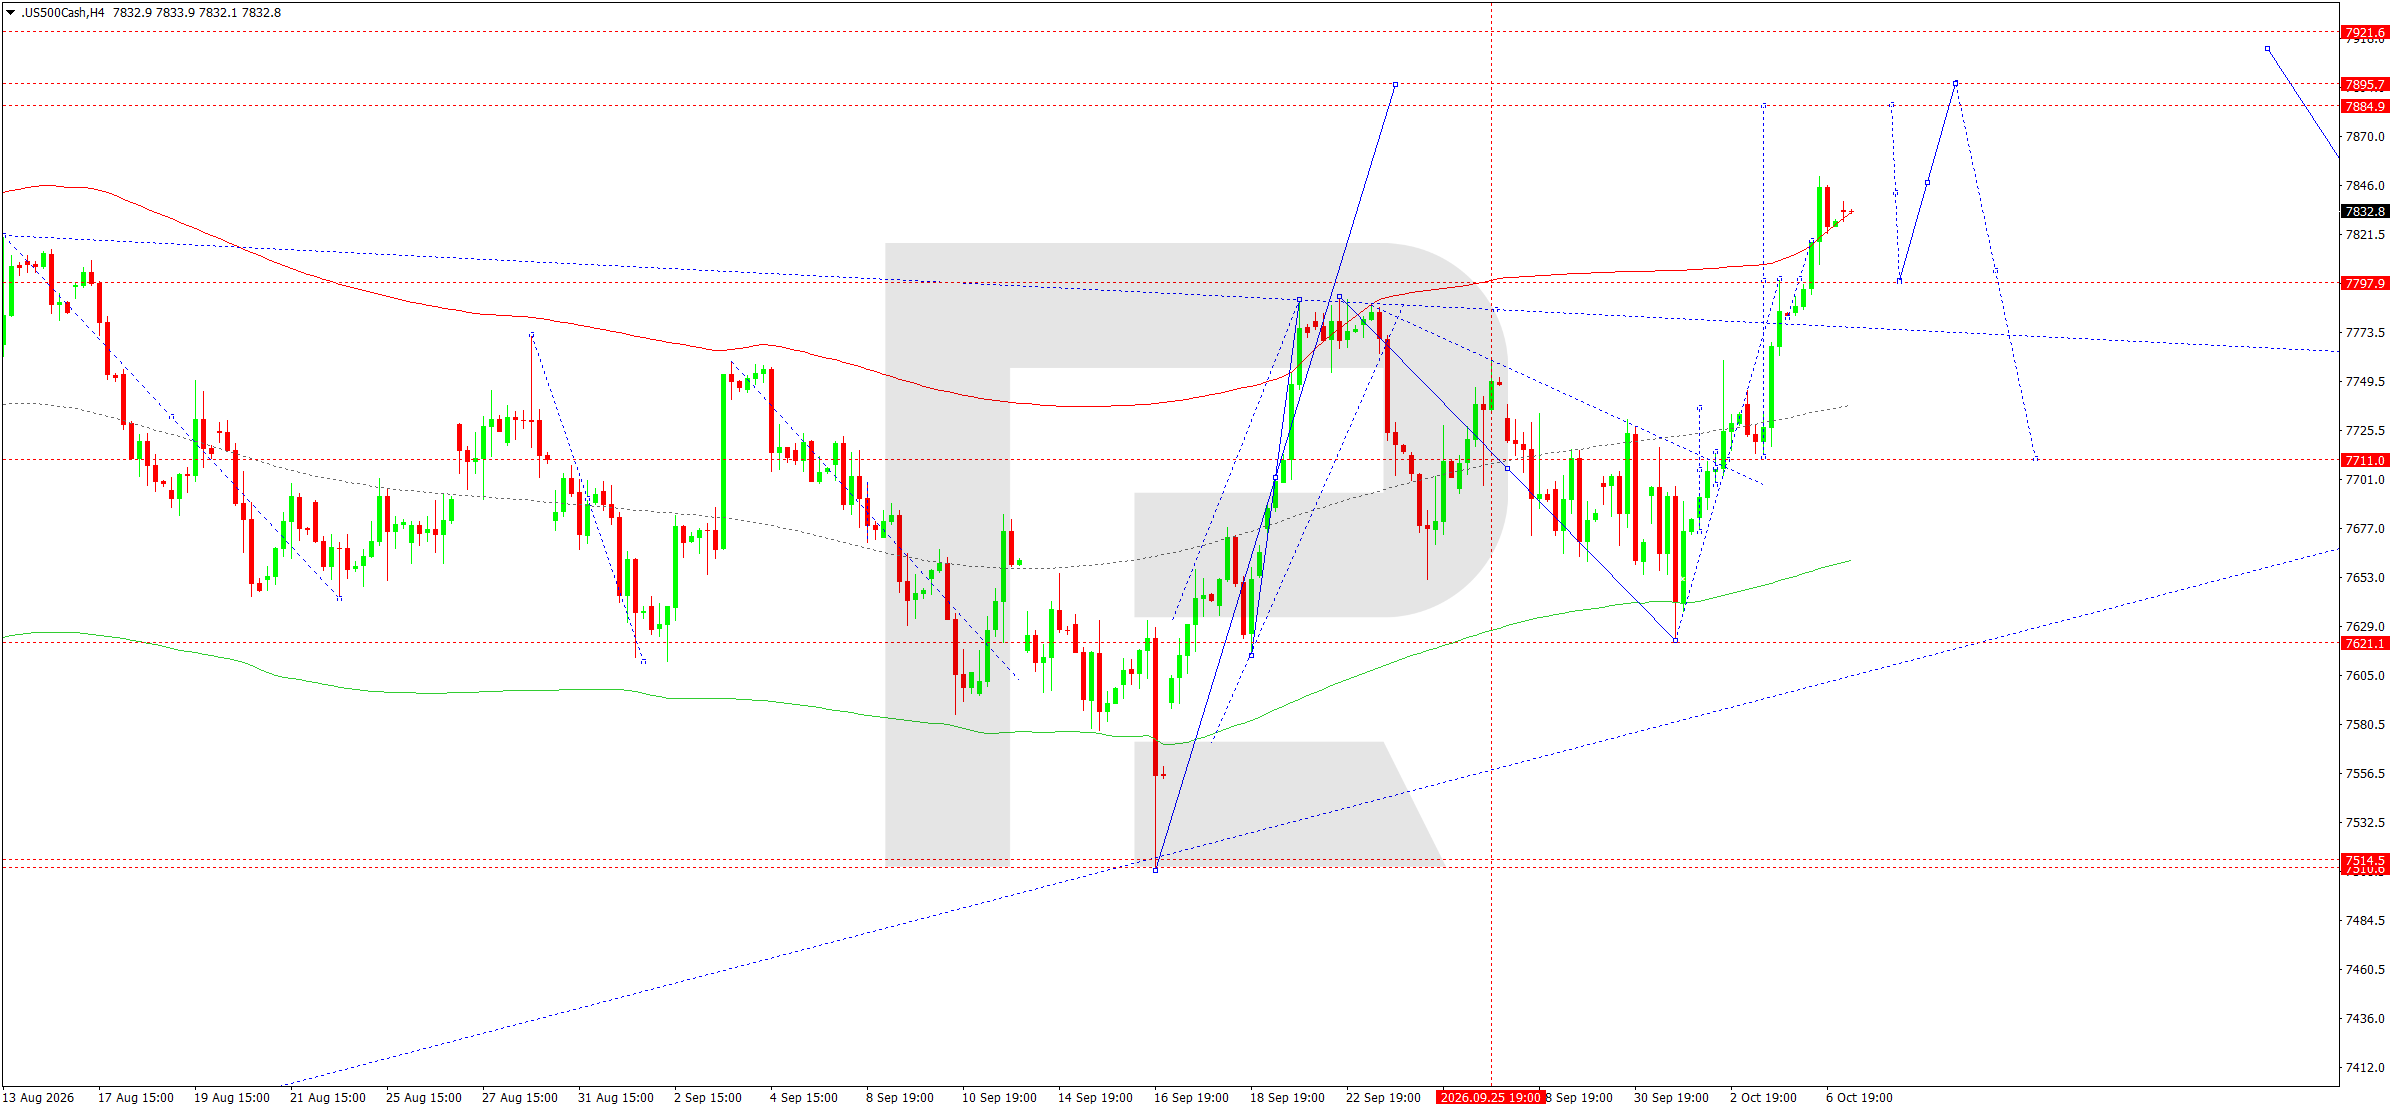
On the H4 chart, the US 500 completed a corrective structure around 7,621 and formed a strong upward impulse. After breaking 7,711 and 7,798, the price reached the 7,850 area, confirming the return of buyers. The current structure allows for local consolidation or a technical pullback before the next impulse.
The upward wave matrix with a pivot around 7,711 remains the basis of the current scenario. The price moved above the upper dynamic boundary and is holding above the important 7,798 level. While this level remains support, the main target is the 7,885–7,896 area. A breakout above 7,896 could open the way towards 7,922.
During a correction, the most important development would be a retest of 7,798 from above. Only a return below this level would materially increase the probability of a move back towards 7,711. Therefore, despite the likelihood of an intermediate correction after the strong impulse, the technical advantage remains with buyers and the preferred scenario is a continuation of growth.
US 500 forecast scenario
Trading scenario: BUY
- Price at the time of writing: 7,827
- Entry price: 7,832
- Stop loss: 7,798
- Take profit: 7,896
- Risk-to-reward ratio: 1:1.88
The trade idea is valid until 8:00 AM on 8 October 2026 (server time, UTC+3).
BTCUSD forecast
BTCUSD remains sensitive to changes in global risk appetite and US interest rate expectations. The Fed publishes the minutes of its September meeting today. Despite the reduced probability of an immediate rate hike in October, financial conditions remain tight and US bond yields are still elevated. For cryptocurrencies, this means continued competition from high-yielding dollar-denominated assets.
At the same time, the US stock market remains resilient: the S&P 500 and Nasdaq have set record highs on demand for technology and AI-related companies. Such a backdrop usually supports interest in risk assets, although the cryptocurrency market came under pressure on the morning of 7 October: bitcoin fell by around 1.8%, while ether declined by more than 3%. Escalating tensions in the Middle East and rising oil prices are further increasing the probability of a short-term shift by investors towards defensive positioning.
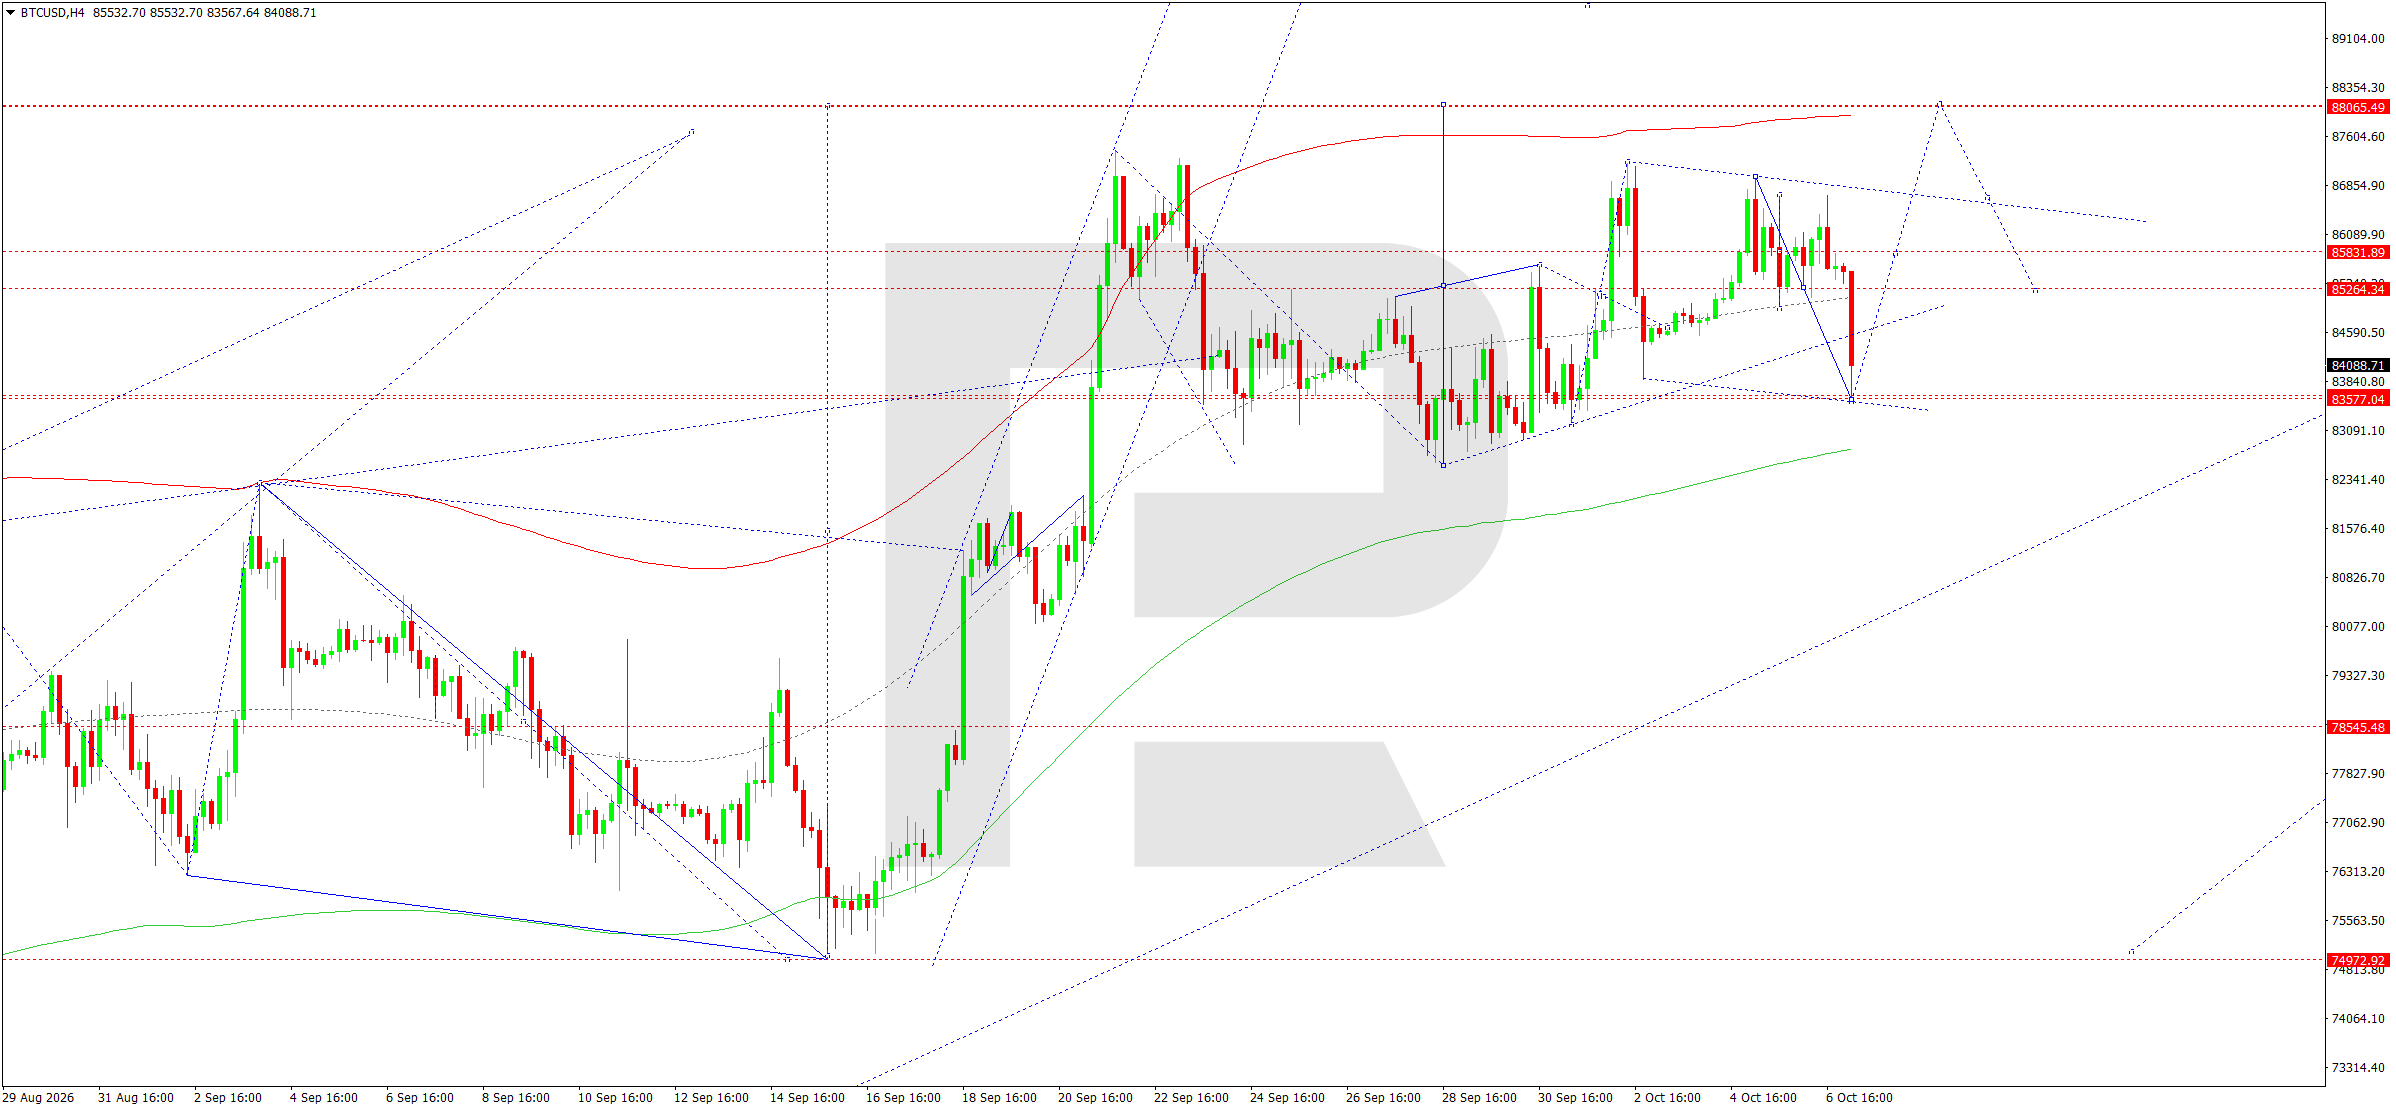
On the H4 chart, BTCUSD moved into a correction after rising into the 86,500–87,000 area. A sharp downward impulse brought the price directly to the key support zone at 83,577. This area is critical for determining the next move. While the market remains above it, the possibility of forming a new upward wave remains.
The matrix of the current structure has a pivot around 85,323. The buyers’ first objective is a return above 85,264–85,832. Consolidation above this area would confirm a recovery in momentum and open the way towards 88,065. The wave structure also allows for this scenario after the correction around 83,577 is complete. At the same time, a breakout below 83,577 would invalidate the local bullish scenario and increase the probability of a deeper correction.
Therefore, the current area is of heightened importance. If support holds, the main scenario envisages a recovery first towards 85,832 and then towards the upper boundary of the structure around 88,065.
BTCUSD forecast scenario
Trading scenario: BUY
- Price at the time of writing: 84,196
- Entry price: 84,201
- Stop loss: 83,577
- Take profit: 88,065
- Risk-to-reward ratio: 1:6.19
The trade idea is valid until 8:00 AM on 8 October 2026 (server time, UTC+3).
Editors’ picks
 EURUSD forecast 2026–2027: technical analysis, price levels & predictions
The EURUSD outlook for 2026 and 2027: key levels on the daily chart, three trading scenarios and the policy gap between the Fed and the ECB that drives the pair.
 Gold (XAUUSD) forecast 2026: technical analysis, price levels & predictions
Where gold could trade in 2026: key levels, three trading scenarios with entry triggers and the forecasts from J.P. Morgan, Deutsche Bank and Goldman Sachs.
Forecasts presented in this section only reflect the author’s private opinion and should not be considered as guidance for trading. RoboForex bears no responsibility for trading results based on trading recommendations described in these analytical reviews.