
Daily technical analysis and forecast for 8 October 2026
Daily technical analysis and forecast for EURUSD, USDJPY, GBPUSD, AUDUSD, USDCAD, XAUUSD, US 500, and BTCUSD for 8 October 2026.
Each scenario on this page reflects the market structure on the H4 chart as of 10:00 UTC+3 on 8 October 2026. The assessment considers the current H4 chart structure, key support and resistance levels, the direction of the medium-term movement, and the prevailing fundamental backdrop.
EURUSD forecast
On Thursday, 8 October 2026, the euro remains vulnerable amid a stronger US dollar and rising US government bond yields. The published minutes of the September meeting of the US Federal Reserve confirmed the regulator’s concerns about persistent inflationary pressure. Most participants allow for an additional interest rate hike before the end of the year, although the decision is not yet predetermined.
The US Dollar Index remains around 102.25, near an 18-month high. The yield on 10-year US Treasuries reached approximately 5.30%, increasing the appeal of dollar-denominated instruments and limiting demand for European assets.
In the eurozone, market participants are focused on the outlook for industrial production, public finances, and further decisions by the European Central Bank. Published German industrial production data came in better than expected, although the sustainability of the European economic recovery remains uncertain.
Additional uncertainty comes from the energy markets. Higher oil prices increase production costs for European companies and create risks of accelerating inflation. At the same time, high energy prices may also limit consumer activity and worsen the outlook for the industrial sector.
During the trading day, investors will assess comments from Fed officials and the publication of European monetary documents. Movements in US bond yields remain highly significant. While yields stay elevated, the fundamental balance predominantly favours the dollar, and any recovery in the euro may remain limited.
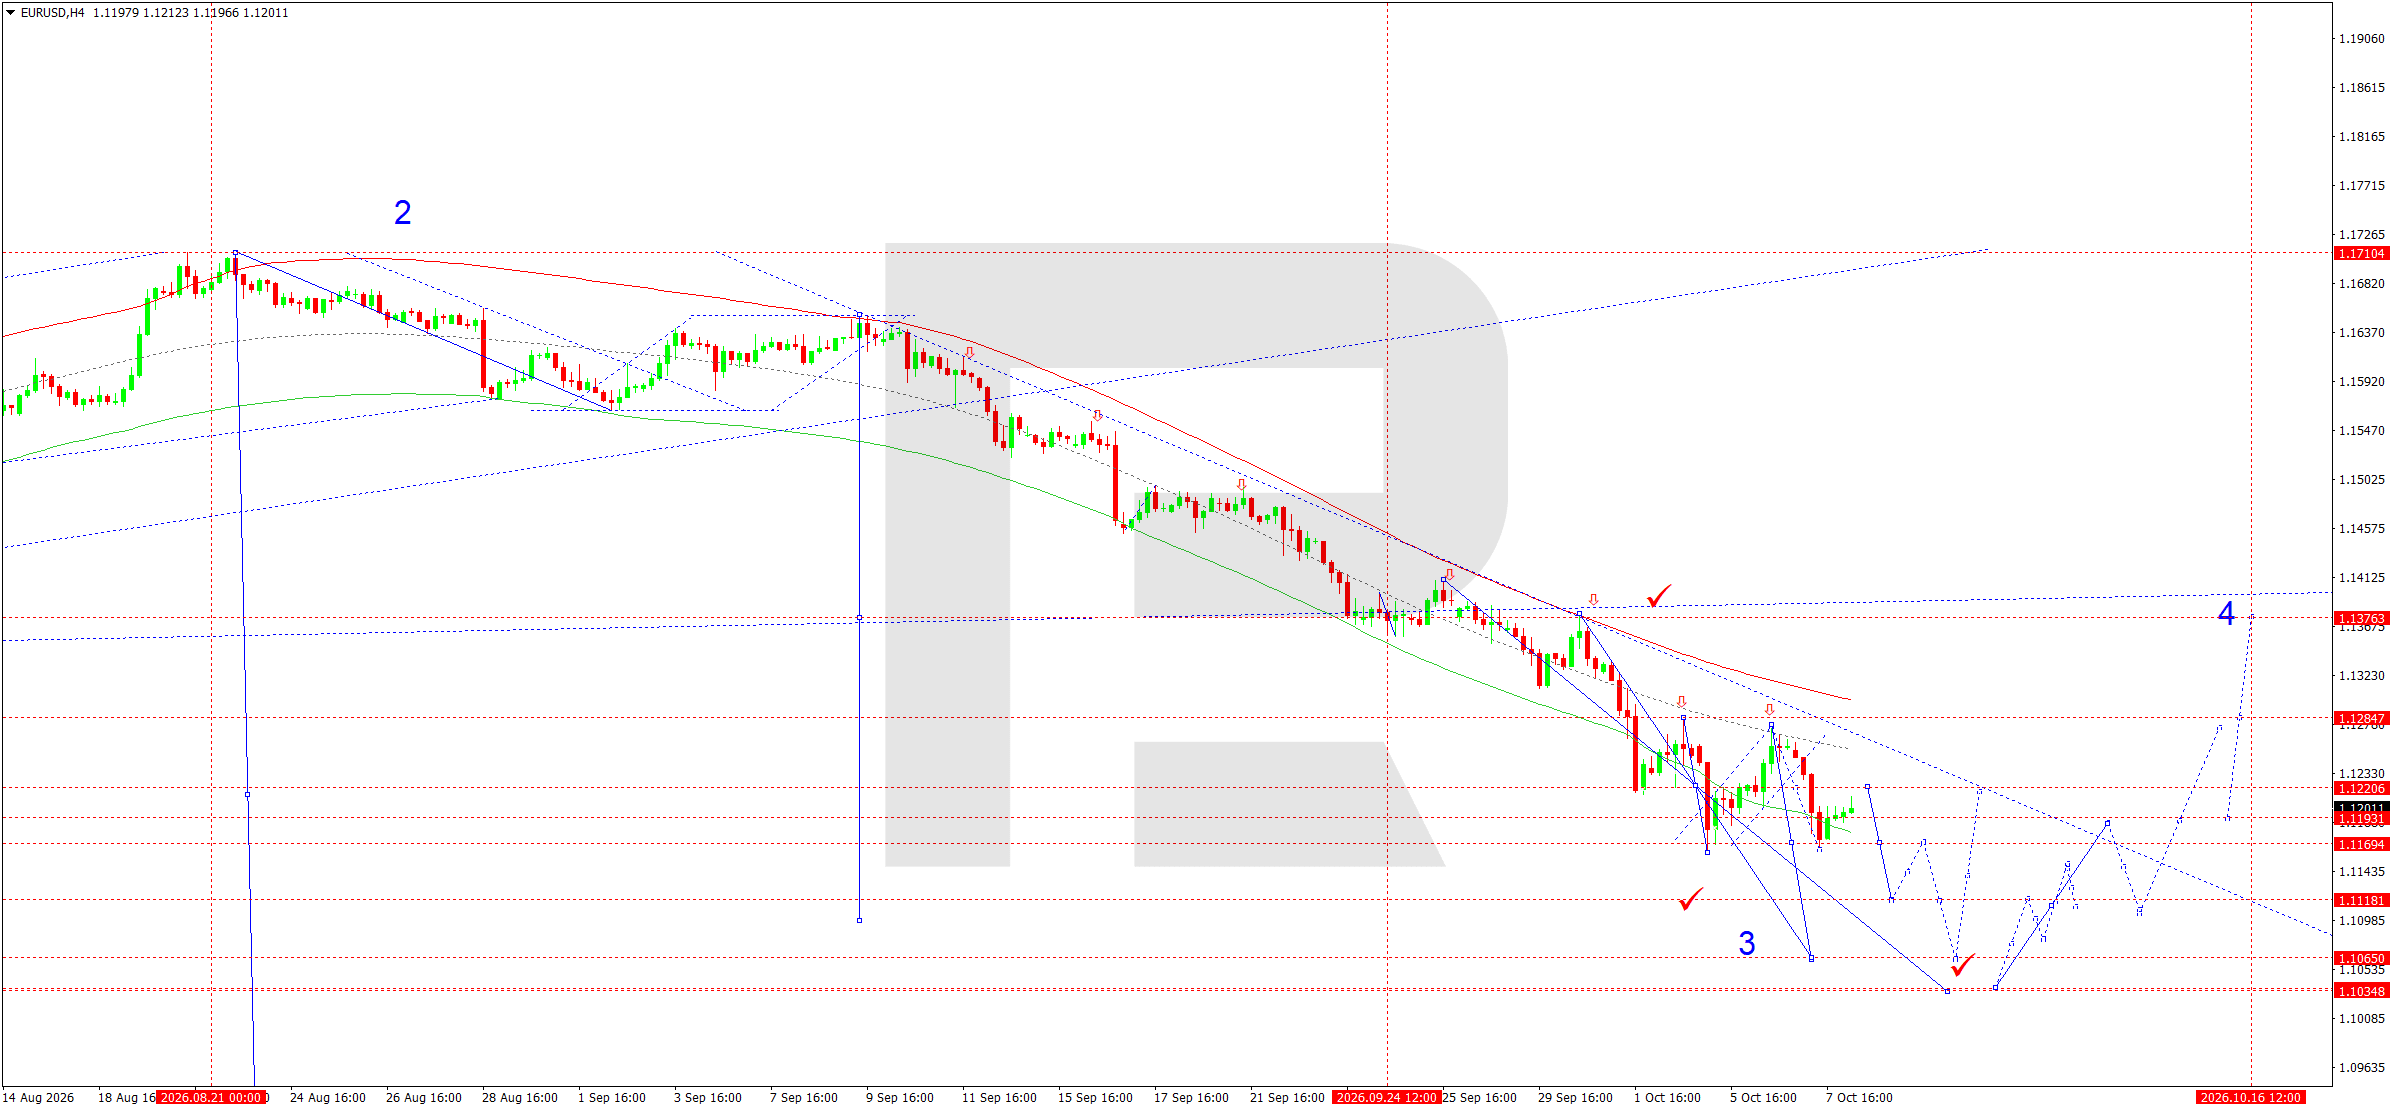
On the H4 chart, EURUSD retains a pronounced downward structure. After forming another impulse, the market reached the 1.1164 support level, from where a corrective recovery towards 1.1212 followed. However, this rise has not yet disrupted the sequence of lower highs and lower lows.
Today, 8 October, the primary scenario remains a continued decline, with the initial target being a retest of the 1.1164 mark. A breakout below this support level would open the door for downward momentum towards 1.1118, which aligns with the lower boundary of the Price Envelope.
The wave matrix with a pivot at 1.1222 is the key technical reference point. While quotes remain below this level, sellers hold the upper hand. The Elliott Wave structure suggests another downward move after the local correction is complete.
Consolidation below 1.1118 would open the way towards 1.1106, with the next estimated target at 1.1065, where the current downward momentum may end.
An alternative scenario suggests a return above 1.1222 followed by a recovery towards 1.1285. However, changing the main direction would require a confident breakout above the descending resistance line.
Until such signals appear, preference remains with selling. The main reference levels are 1.1118 and 1.1065.
EURUSD forecast scenario
Trading scenario: SELL
- Price at the time of writing: 1.1202
- Entry price: 1.1197
- Stop loss: 1.1237
- Take profit: 1.1118
- Risk-to-reward ratio: 1:1.98
The trade idea is valid until 8:00 AM on 9 October 2026 (server time, UTC+3).
USDJPY forecast
The Japanese yen remains under pressure on 8 October 2026 from a stronger US dollar and the persistent wide interest rate differential between the US and Japan. The published minutes of the September meeting of the US Federal Reserve confirmed the regulator’s readiness to consider further monetary tightening if inflation risks persist.
The yield on 10-year US Treasuries rose to around 5.30%, supporting the appeal of dollar-denominated instruments. At the same time, expectations for the Fed’s October meeting remain cautious: investors mostly expect current interest rates to remain unchanged.
The Bank of Japan continues to take a gradual approach to monetary policy normalisation. A central bank representative previously allowed for further rate hikes, although the need to take domestic demand into account limits the scope for rapid tightening of financial conditions.
Published Japanese wage data showed positive dynamics, potentially supporting the outlook for further BOJ decisions. At the same time, higher imported energy costs increase inflation risks and place additional pressure on the Japanese economy.
Market participants are paying particular attention to movements in Japanese government bond yields and the possible reaction of financial authorities to weakness in the national currency. A rapid rise in USDJPY could increase the likelihood of official warnings about excessive volatility.
In the short term, the fundamental balance remains favourable for the dollar. However, as quotes approach significant technical resistance levels, the probability of corrective moves increases, especially if expectations regarding further decisions by the US regulator change.
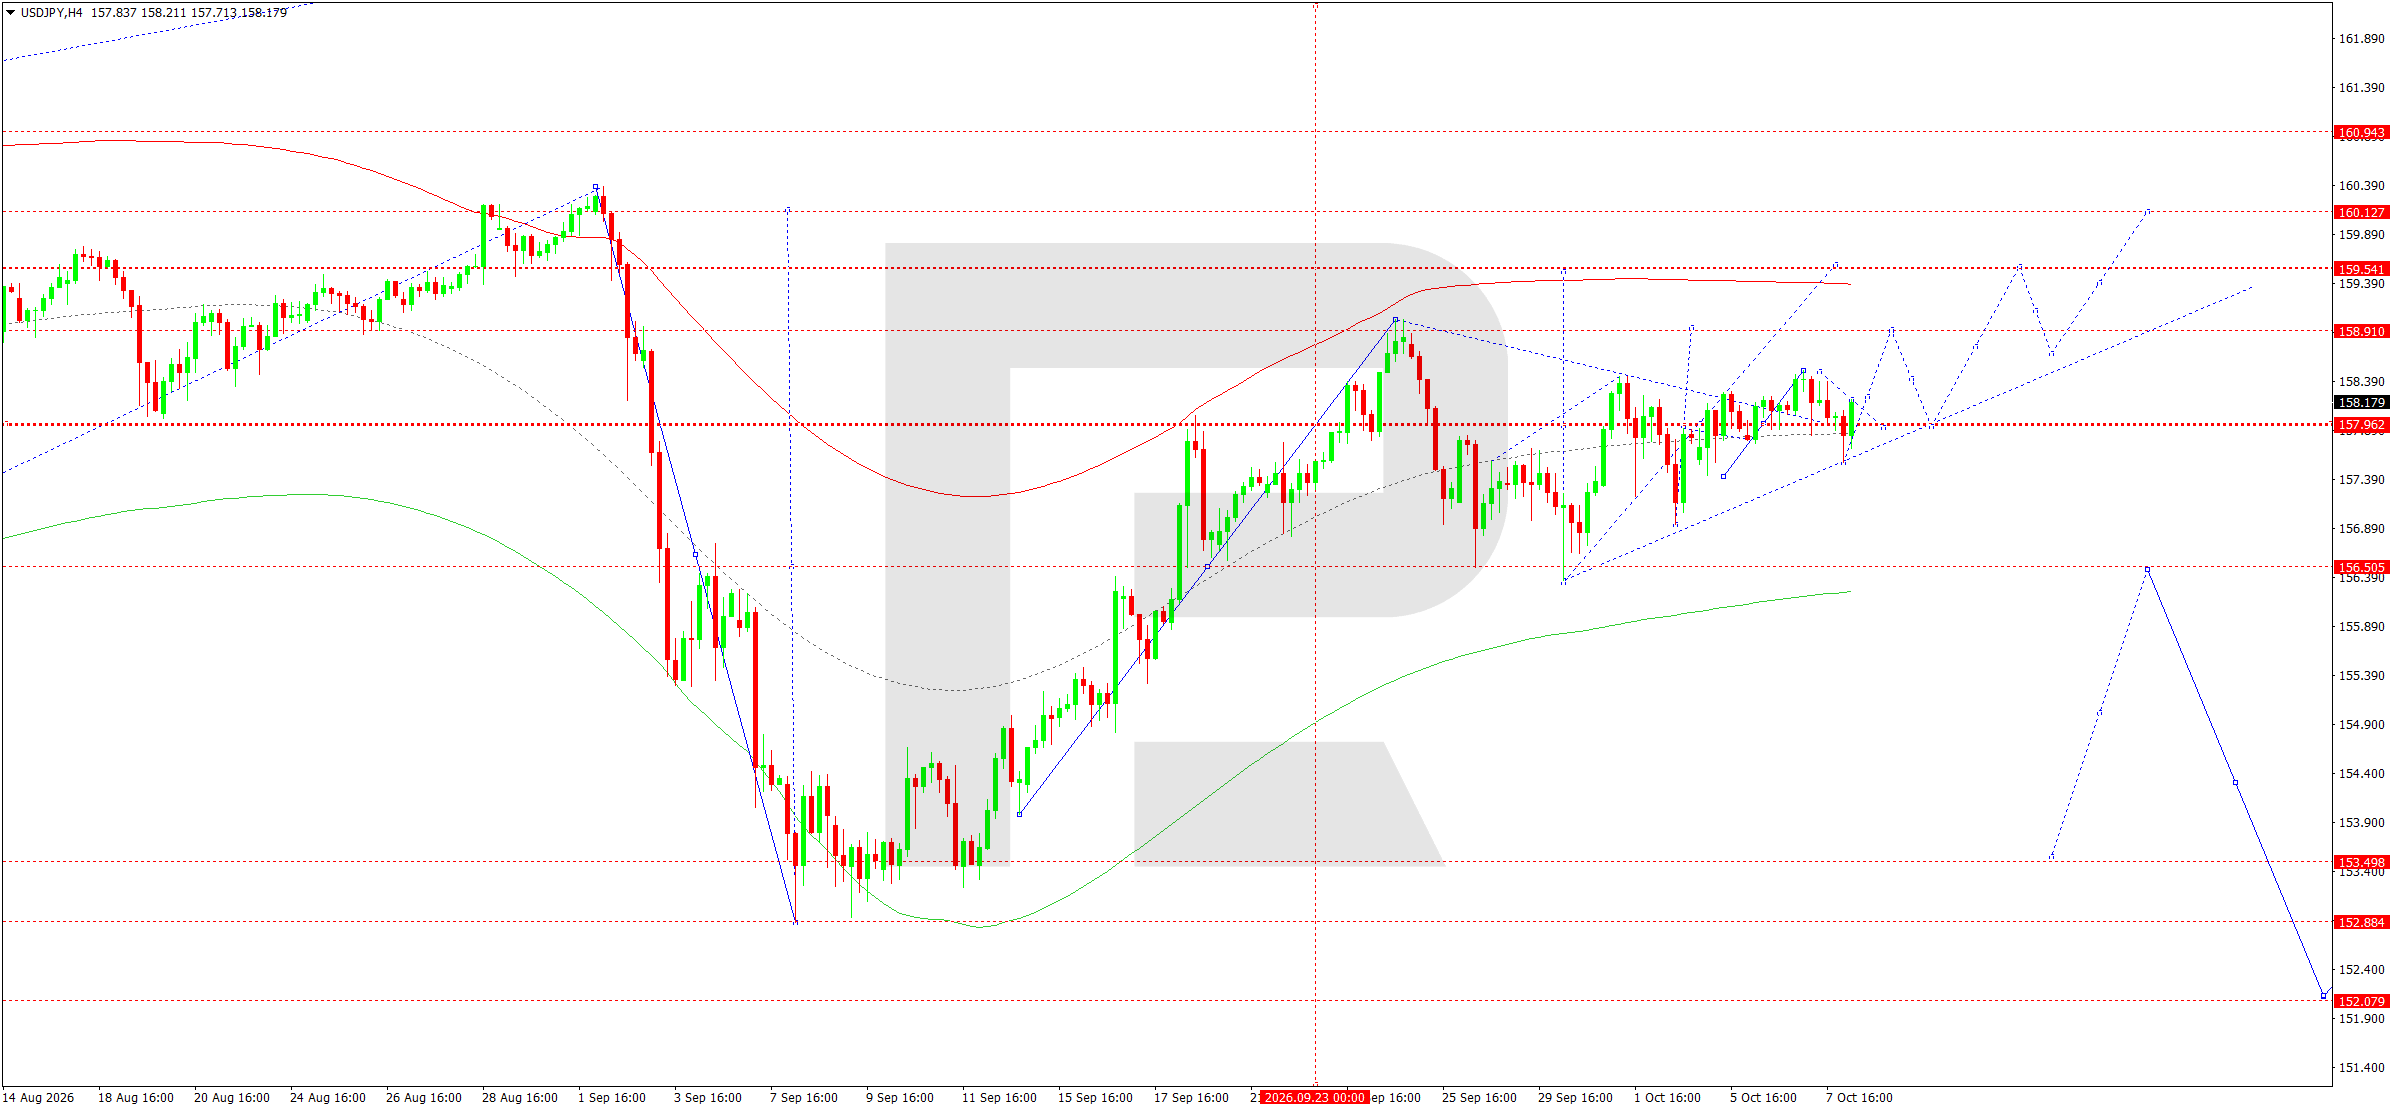
On the H4 chart, USDJPY retains a recovery structure after the previous downward move ended. The market broke above resistance at 158.20 and then formed a compact consolidation range above support at 157.92.
Today, 8 October, the main scenario is an upside breakout from consolidation followed by further development of the impulse towards 158.91. A breakout above this resistance would create conditions for continued growth towards 159.40.
The wave matrix with a pivot at 157.94 is the key reference point for the current structure. Holding above this level confirms that buying activity remains intact. The Elliott Wave structure suggests another upward move after the local correction is complete.
The central line of the Price Envelope is located around 157.94. While the market remains above it, buyers retain the technical advantage.
Additional resistance is located at 159.54. A breakout above it would open the way towards 160.13, although such a move would require stronger upward momentum.
An alternative scenario suggests a decline towards 157.40. Consolidation below this support level would increase the probability of a continued correction towards 156.50 and then 155.60.
For the current session, growth remains the priority, with the main targets at 158.91 and 159.40. Possible declines towards the matrix pivot are viewed as corrective moves within the upward structure.
USDJPY forecast scenario
Trading scenario: BUY
- Price at the time of writing: 158.28
- Entry price: 158.33
- Stop loss: 157.83
- Take profit: 159.40
- Risk-to-reward ratio: 1:2.14
The trade idea is valid until 8:00 AM on 9 October 2026 (server time, UTC+3).
GBPUSD forecast
The British pound remains under pressure on 8 October 2026 from a strong US dollar, high US government bond yields, and uncertainty surrounding the outlook for the UK economy. The published minutes of the Federal Reserve’s September meeting confirmed persistent concerns about inflation risks. The possibility of additional tightening of US monetary policy supports dollar-denominated assets.
The Bank of England continues to assess the persistence of inflationary pressure and the state of domestic demand. Higher energy costs create additional risks of accelerating consumer inflation while at the same time increasing costs for UK businesses and households.
The published RICS house price balance came in weaker than market expectations. This points to continued caution among property market participants and reflects the impact of high borrowing costs.
The outlook for further changes in mortgage rates is also important. Rising government bond yields could increase the cost of financing, limiting homebuyer activity and consumer spending.
During the trading session, market participants will focus on speeches by BoE officials, including senior policymakers, as well as the publication of the credit conditions survey. These materials may clarify the assessment of the UK economic outlook and future interest rate decisions.
At the same time, the US dollar is receiving support from high Treasury yields. As a result, the fundamental advantage remains with the US currency for now.
A sustained recovery in sterling would require either a weaker dollar or a change in expectations regarding BoE policy. Until such factors emerge, local rises in GBPUSD may remain limited.
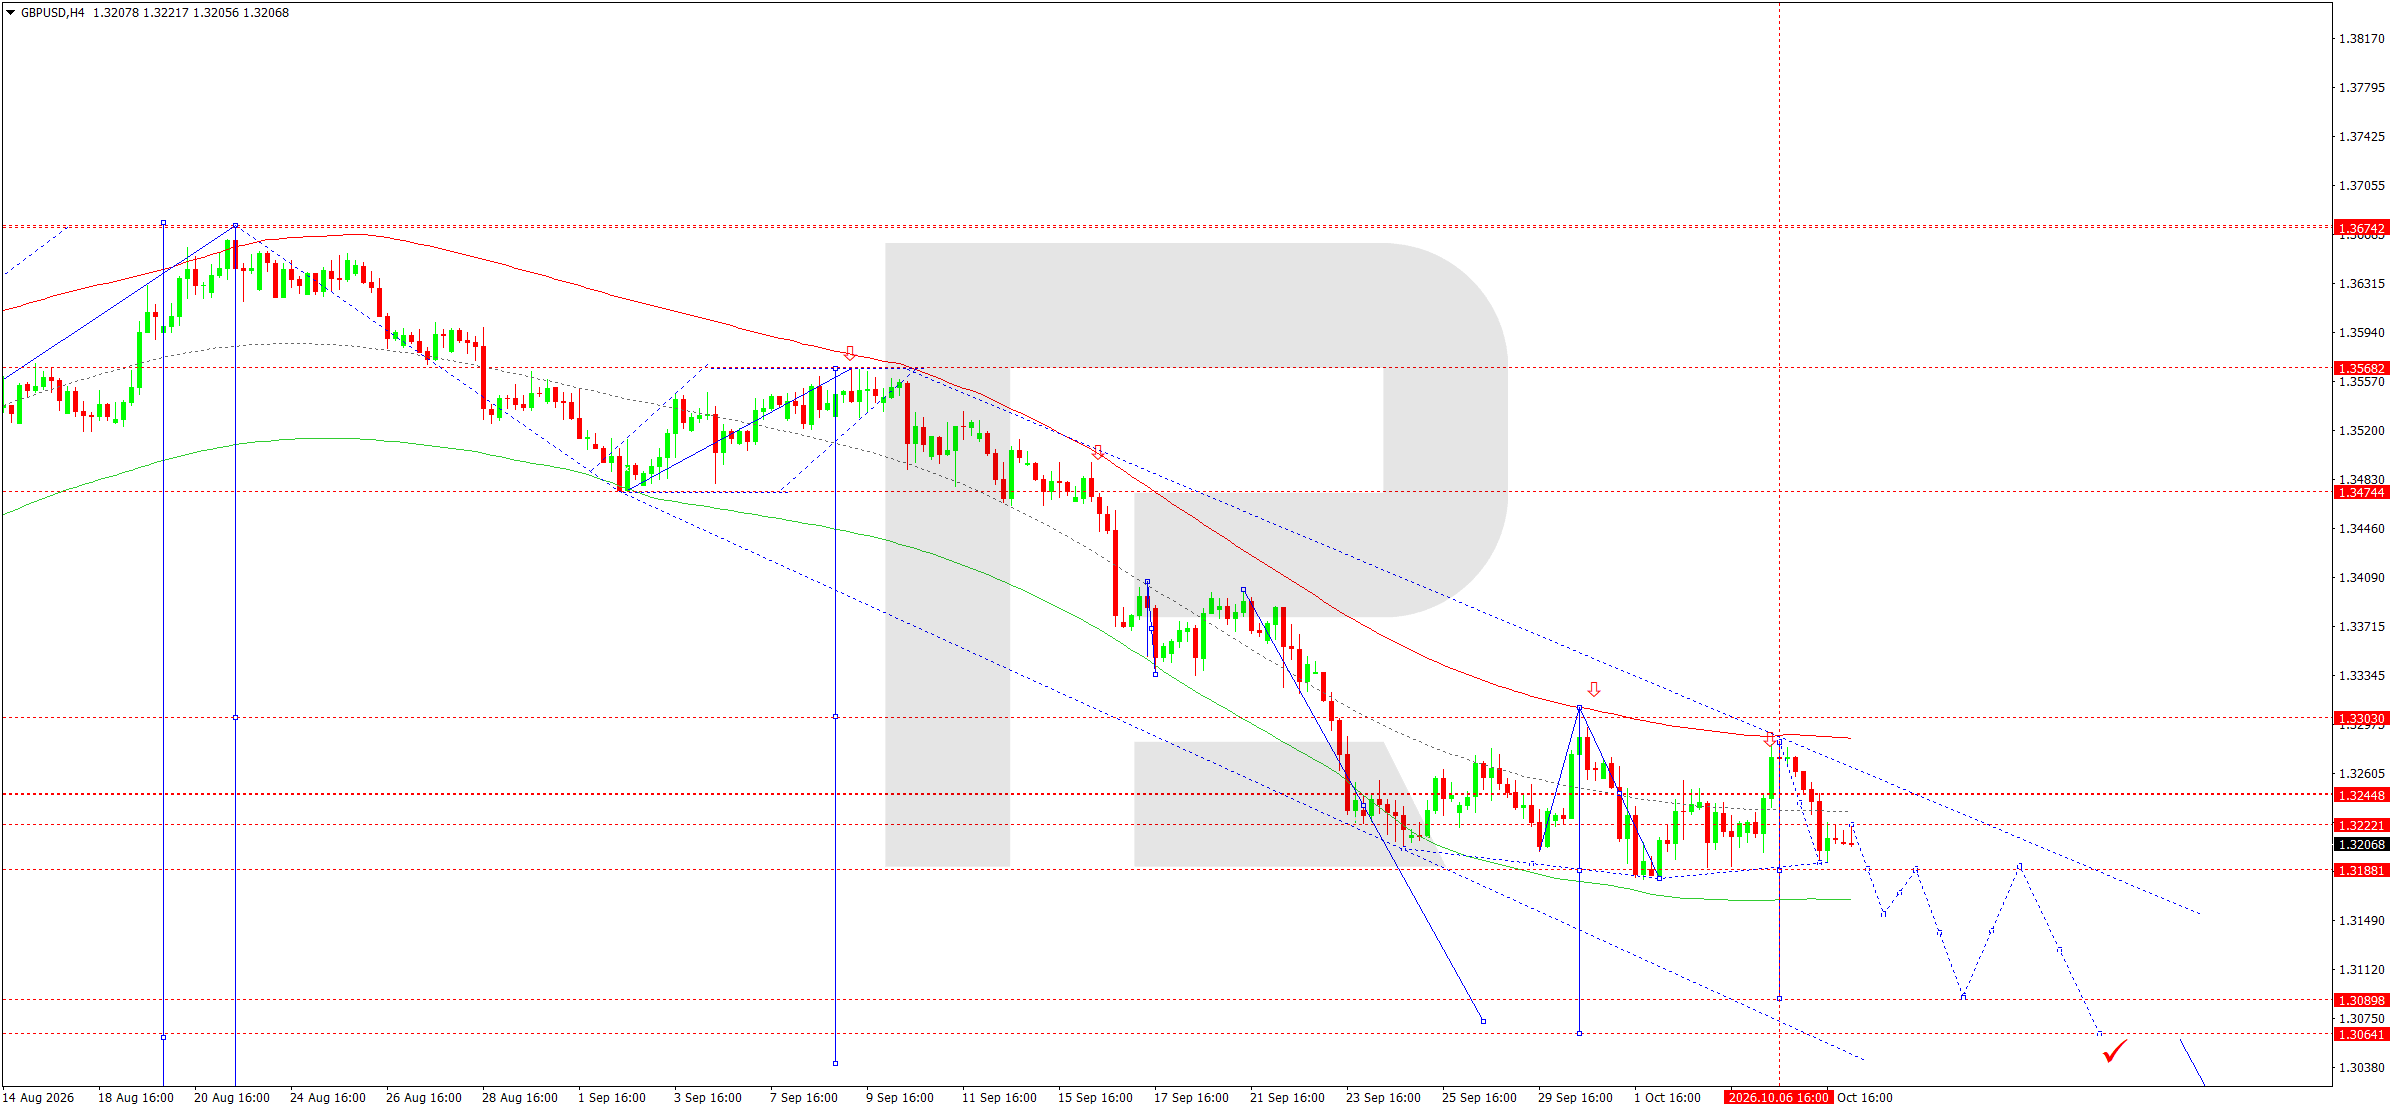
On the H4 chart, GBPUSD continues to develop a downtrend. After forming a local low at 1.3193, the market made a corrective recovery towards 1.3222. However, buyers failed to change the main structure, and quotes came under pressure again.
Today, 8 October, the scenario of another downward wave remains relevant, with an initial target at 1.3151. A breakout below this support would create conditions for a continued move towards 1.3088.
The downward wave matrix with a pivot at 1.3244 is the main technical reference point. While quotes remain below this level, sellers retain the advantage.
The Elliott Wave structure suggests the downward impulse could continue after the local correction is complete. The lower boundary of the Price Envelope is located around 1.3088 and acts as the next key target.
Consolidation below this level would open the way for a further decline towards 1.3061. Short-term demand and a corrective recovery may emerge in this area.
The nearest resistance level is located at 1.3222. A breakout above it would allow for a retest of the matrix pivot at 1.3244, although this would not be sufficient to change the main trend.
Therefore, selling remains the priority, with the main estimated targets of the current downward move at 1.3151, 1.3088, and 1.3061.
GBPUSD forecast scenario
Trading scenario: SELL
- Price at the time of writing: 1.3198
- Entry price: 1.3193
- Stop loss: 1.3244
- Take profit: 1.3088
- Risk-to-reward ratio: 1:2.06
The trade idea is valid until 8:00 AM on 9 October 2026 (server time, UTC+3).
AUDUSD forecast
The Australian dollar remains under pressure on 8 October 2026 from a strengthening US currency and rising US government bond yields. The minutes of the Federal Reserve’s September meeting confirmed concerns about persistent inflation and the possibility of additional monetary tightening before the end of the year.
The US Dollar Index remains near an 18-month high, while the yield on 10-year US Treasuries is around 5.30%. This environment limits demand for commodity-linked currencies, including the Australian dollar.
Another factor is the change in global investor risk appetite. Rising oil prices, geopolitical tensions, and high borrowing costs create conditions for reducing positions in assets that are sensitive to the economic cycle.
The Reserve Bank of Australia continues to take into account inflation risks, labour market conditions, and the outlook for domestic demand. Published consumer inflation expectations rose to 5.3% from the previous 4.9%. This trend increases the focus on the possibility that tight financial conditions will persist.
The outlook for the Chinese economy remains an important external factor. Changes in Chinese industrial activity directly affect demand for Australian commodities and the country’s export revenues. A slowdown in Chinese production could further limit a recovery in AUDUSD.
At the same time, a sustained rise in commodity prices could partially offset the negative impact of a strong dollar. However, an improvement in global investment sentiment would be required to change the fundamental balance.
In the short term, the US currency retains the advantage. The Australian dollar remains sensitive to US bond yields, energy prices, and changes in expectations regarding RBA decisions.
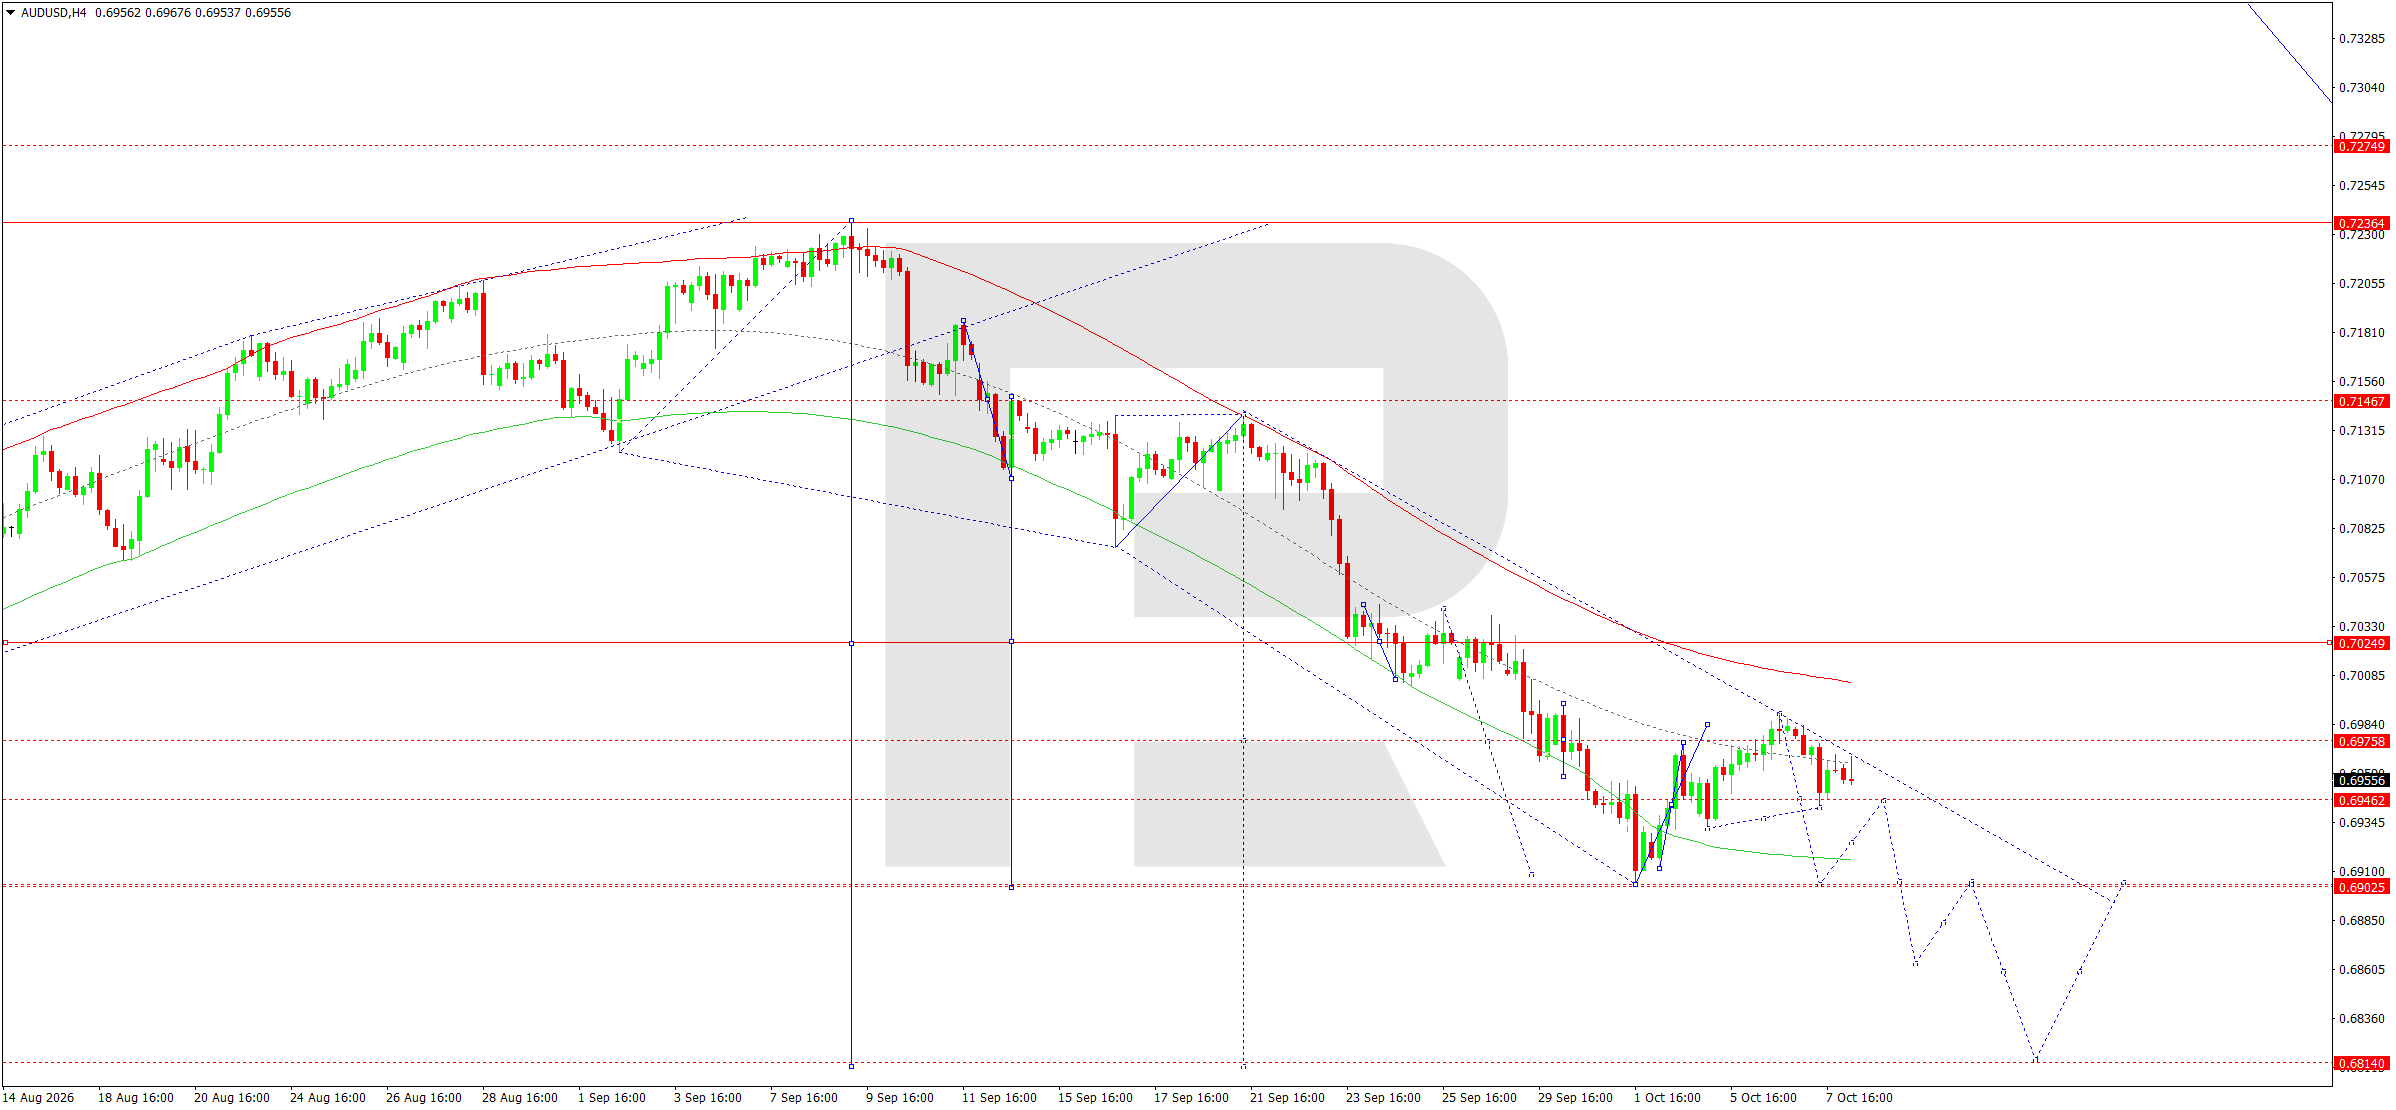
On the H4 chart, AUDUSD remains in a downtrend. After forming the previous high, the market continued to post lower local lows, confirming the development of a downward impulse structure.
Quotes reached the 0.6902 support leve, after which a corrective recovery formed towards 0.6976. However, buyers failed to consolidate above the nearest resistance. The subsequent decline towards 0.6946 indicates renewed selling pressure.
Today, 8 October, the main scenario remains a continued downward move with an initial target at 0.6902. A breakout below this level would open the way for a further decline towards 0.6860 and 0.6814.
The wave matrix with a pivot at 0.7049 confirms that the bearish technical balance remains intact. While quotes hold below the matrix pivot, corrective rallies are viewed as intermediate moves.
The Elliott Wave structure suggests another downward impulse. The lower boundary of the Price Envelope is located around 0.6814 and acts as a prospective target.
The nearest resistance level lies at 0.6976. Consolidation above it would enable a recovery towards 0.7025, although this would not invalidate the main bearish scenario.
Preference remains with selling, with successive targets at 0.6902 and 0.6814. A change in direction would require sustained consolidation above the matrix pivot.
AUDUSD forecast scenario
Trading scenario: SELL
- Price at the time of writing: 0.6945
- Entry price: 0.6940
- Stop loss: 0.6980
- Take profit: 0.6814
- Risk-to-reward ratio: 1:3.15
The trade idea is valid until 8:00 AM on 9 October 2026 (server time, UTC+3).
USDCAD forecast
The Canadian dollar on 8 October 2026 is being influenced by opposing fundamental factors. A stronger US currency and rising US government bond yields support the upward dynamics of USDCAD. At the same time, higher oil prices potentially support the Canadian dollar, limiting the extent of its weakness.
The published minutes of the Fed’s September meeting confirmed the regulator’s concerns about inflation risks. Most participants allow for an additional interest rate hike, although the probability of maintaining current conditions at the October meeting remains high.
The rise in the yield on 10-year US Treasuries towards approximately 5.30% increases the appeal of dollar-denominated instruments. This helps sustain demand for the US currency and limits the potential for a corrective decline in USDCAD.
For the Canadian economy, conditions in the global oil market are highly significant. Geopolitical tensions in the Middle East are keeping energy prices volatile. Higher oil prices can improve Canada’s export revenues, while at the same time increasing global inflation risks.
The Bank of Canada continues to take into account the state of the domestic labour market, inflation, and the outlook for economic activity. High borrowing costs in the US also affect Canadian financial conditions through the close links between the two economies.
Another factor is the interest rate differential between US and Canadian bonds. The continued yield advantage of the US dollar supports the pair’s upward direction.
In the short term, the fundamental balance remains moderately favourable for the US currency. However, a further rise in oil prices could strengthen the Canadian dollar and lead to intermediate corrections.
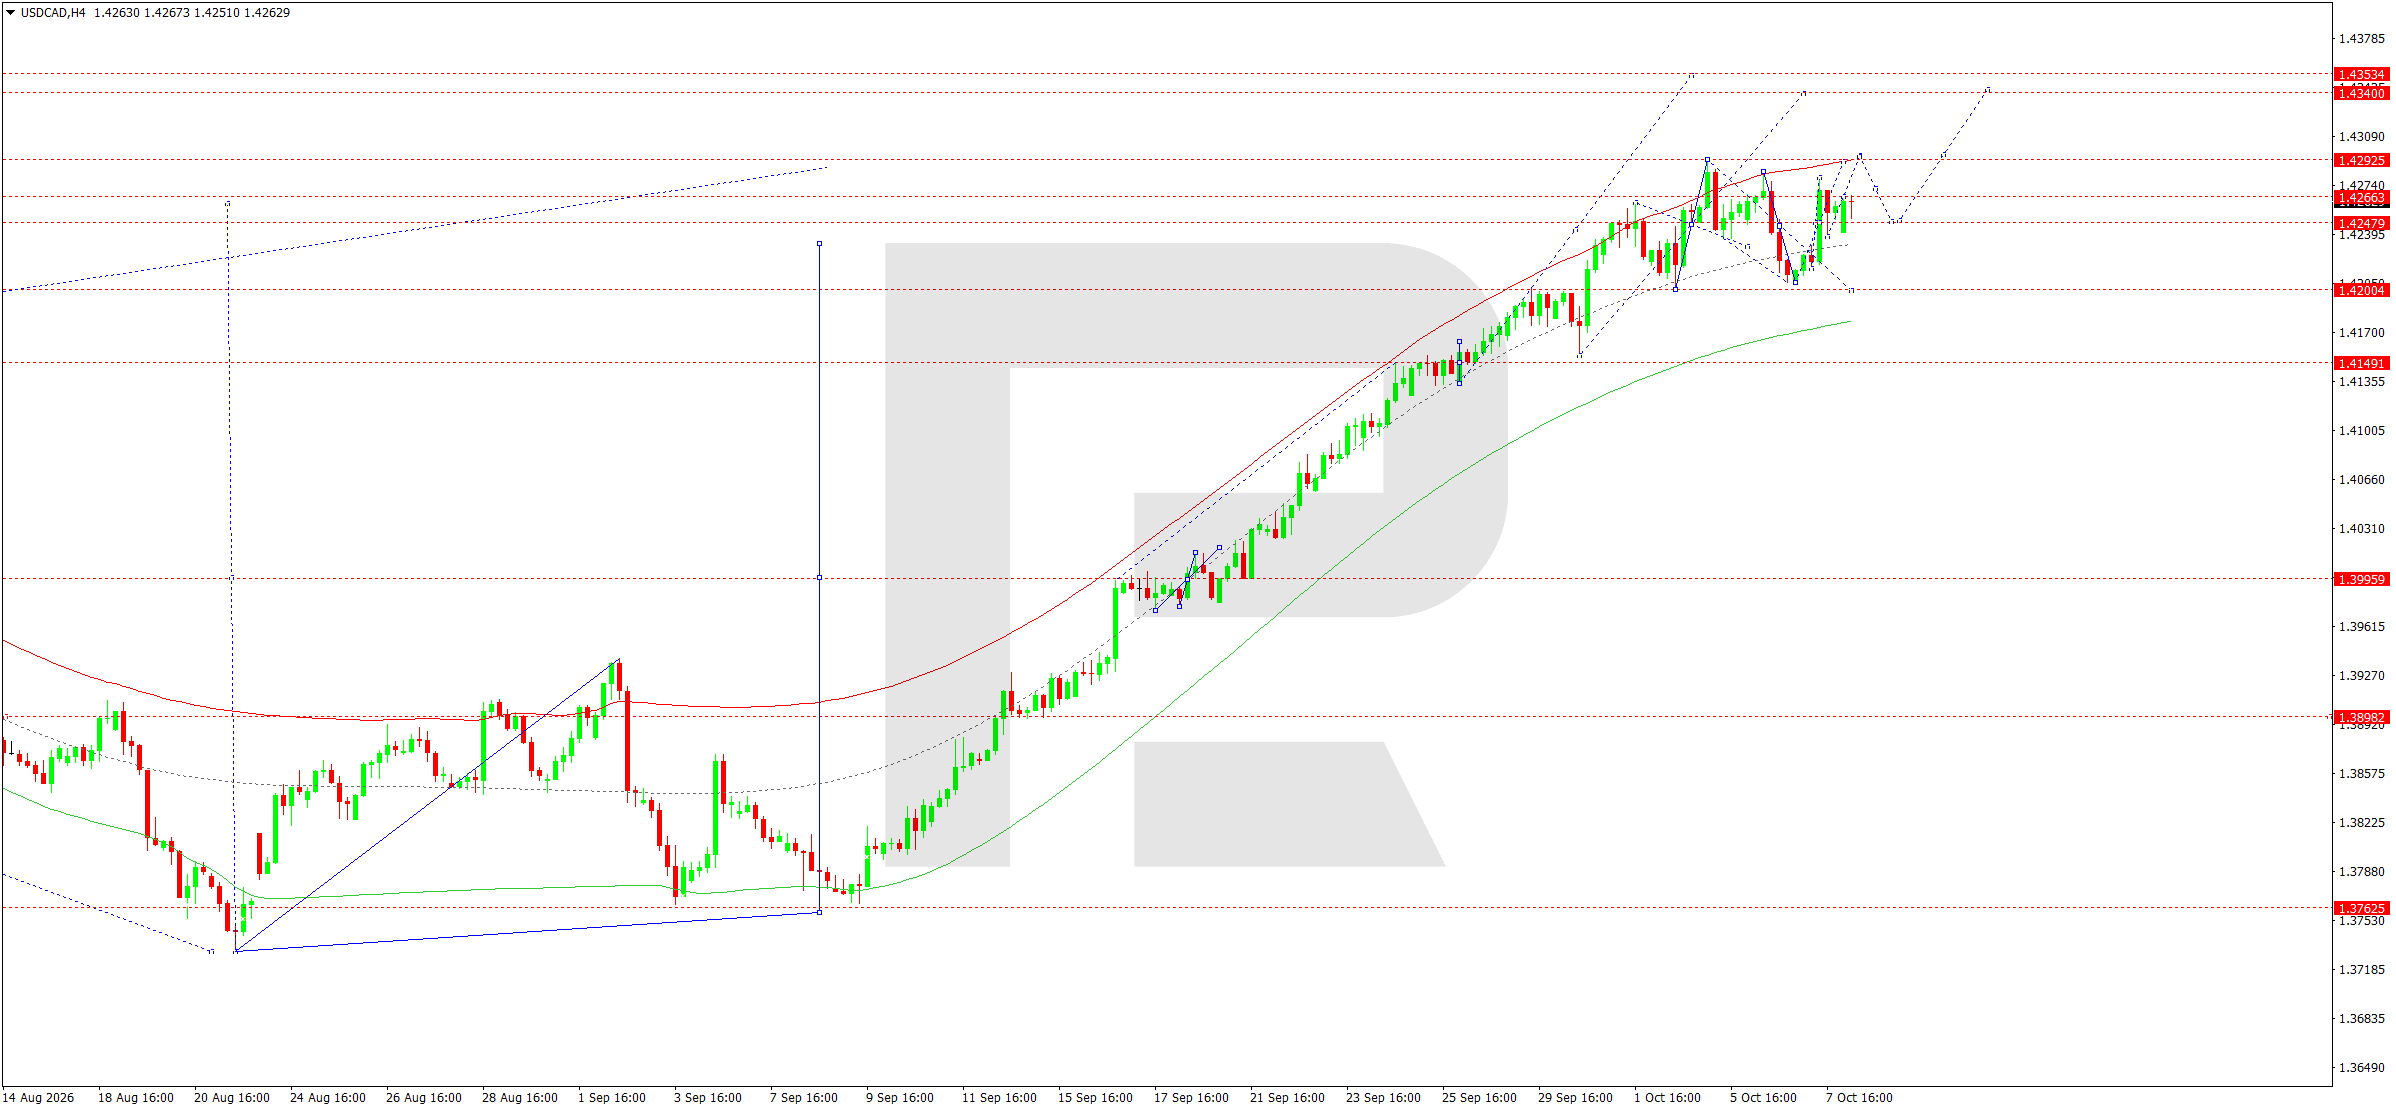
On the H4 chart, USDCAD remains in an uptrend. The market formed a sequence of higher lows and reached the 1.4278 resistance level, after which it corrected towards support at 1.4240.
Today, 8 October, a compact consolidation range could develop above this level. A sustained upside breakout would create conditions for a retest of 1.4278 and further growth towards 1.4295.
The upward wave matrix with a pivot at 1.4000 is the main technical reference point. While quotes remain significantly above this level, buyers retain the advantage.
The Elliott Wave structure suggests an intermediate correction before growth resumes. A breakout below the 1.4240 support level could lead to a decline towards 1.4200 and the central line of the Price Envelope around 1.4195.
Once the corrective move is complete, buying activity is expected to recover, with the main targets at 1.4295 and 1.4340. A breakout above the latter resistance level would open the way for further growth towards 1.4353.
Consolidation below 1.4195 would weaken the upward structure and increase the probability of a deeper correction.
The primary trend remains upward, although a preliminary decline towards the nearest support levels cannot be ruled out. Preference is given to buying after confirmation of an upside breakout from the local consolidation.
USDCAD forecast scenario
Trading scenario: BUY
- Price at the time of writing: 1.4268
- Entry price: 1.4273
- Stop loss: 1.4233
- Take profit: 1.4340
- Risk-to-reward ratio: 1:1.68
The trade idea is valid until 8:00 AM on 9 October 2026 (server time, UTC+3).
XAUUSD forecast
The gold market remains under pressure on 8 October 2026 from high US government bond yields and a stronger US dollar. The published minutes of the Federal Reserve’s September meeting confirmed persistent concerns about inflation risks and the possibility of an additional interest rate hike.
The yield on 10-year US Treasuries is around 5.30%, increasing the opportunity cost of holding gold. The precious metal does not generate interest income, so higher yields on debt instruments traditionally limit its investment appeal.
The US Dollar Index remains near an 18-month high. A strong US currency puts additional pressure on gold prices because it makes the metal more expensive for buyers using other currencies.
During the Asian session, the precious metal traded around 4,107 USD per troy ounce. The decline was accompanied by investor caution regarding the US regulator’s future decisions.
At the same time, geopolitical tensions in the Middle East support demand for safe-haven assets. Rising oil prices are increasing global inflation risks and may boost interest in gold as a store of value.
Additional support for the precious metal comes from central-bank demand. Continued accumulation of gold reserves by individual countries limits the depth of corrective moves over the long term.
However, short-term dynamics are mainly determined by US interest rates and conditions in the dollar market. While bond yields remain elevated, a sustained recovery in gold is difficult.
The fundamental balance remains mixed. Geopolitical factors support potential demand, while a strong dollar and high yields continue to favour sellers.
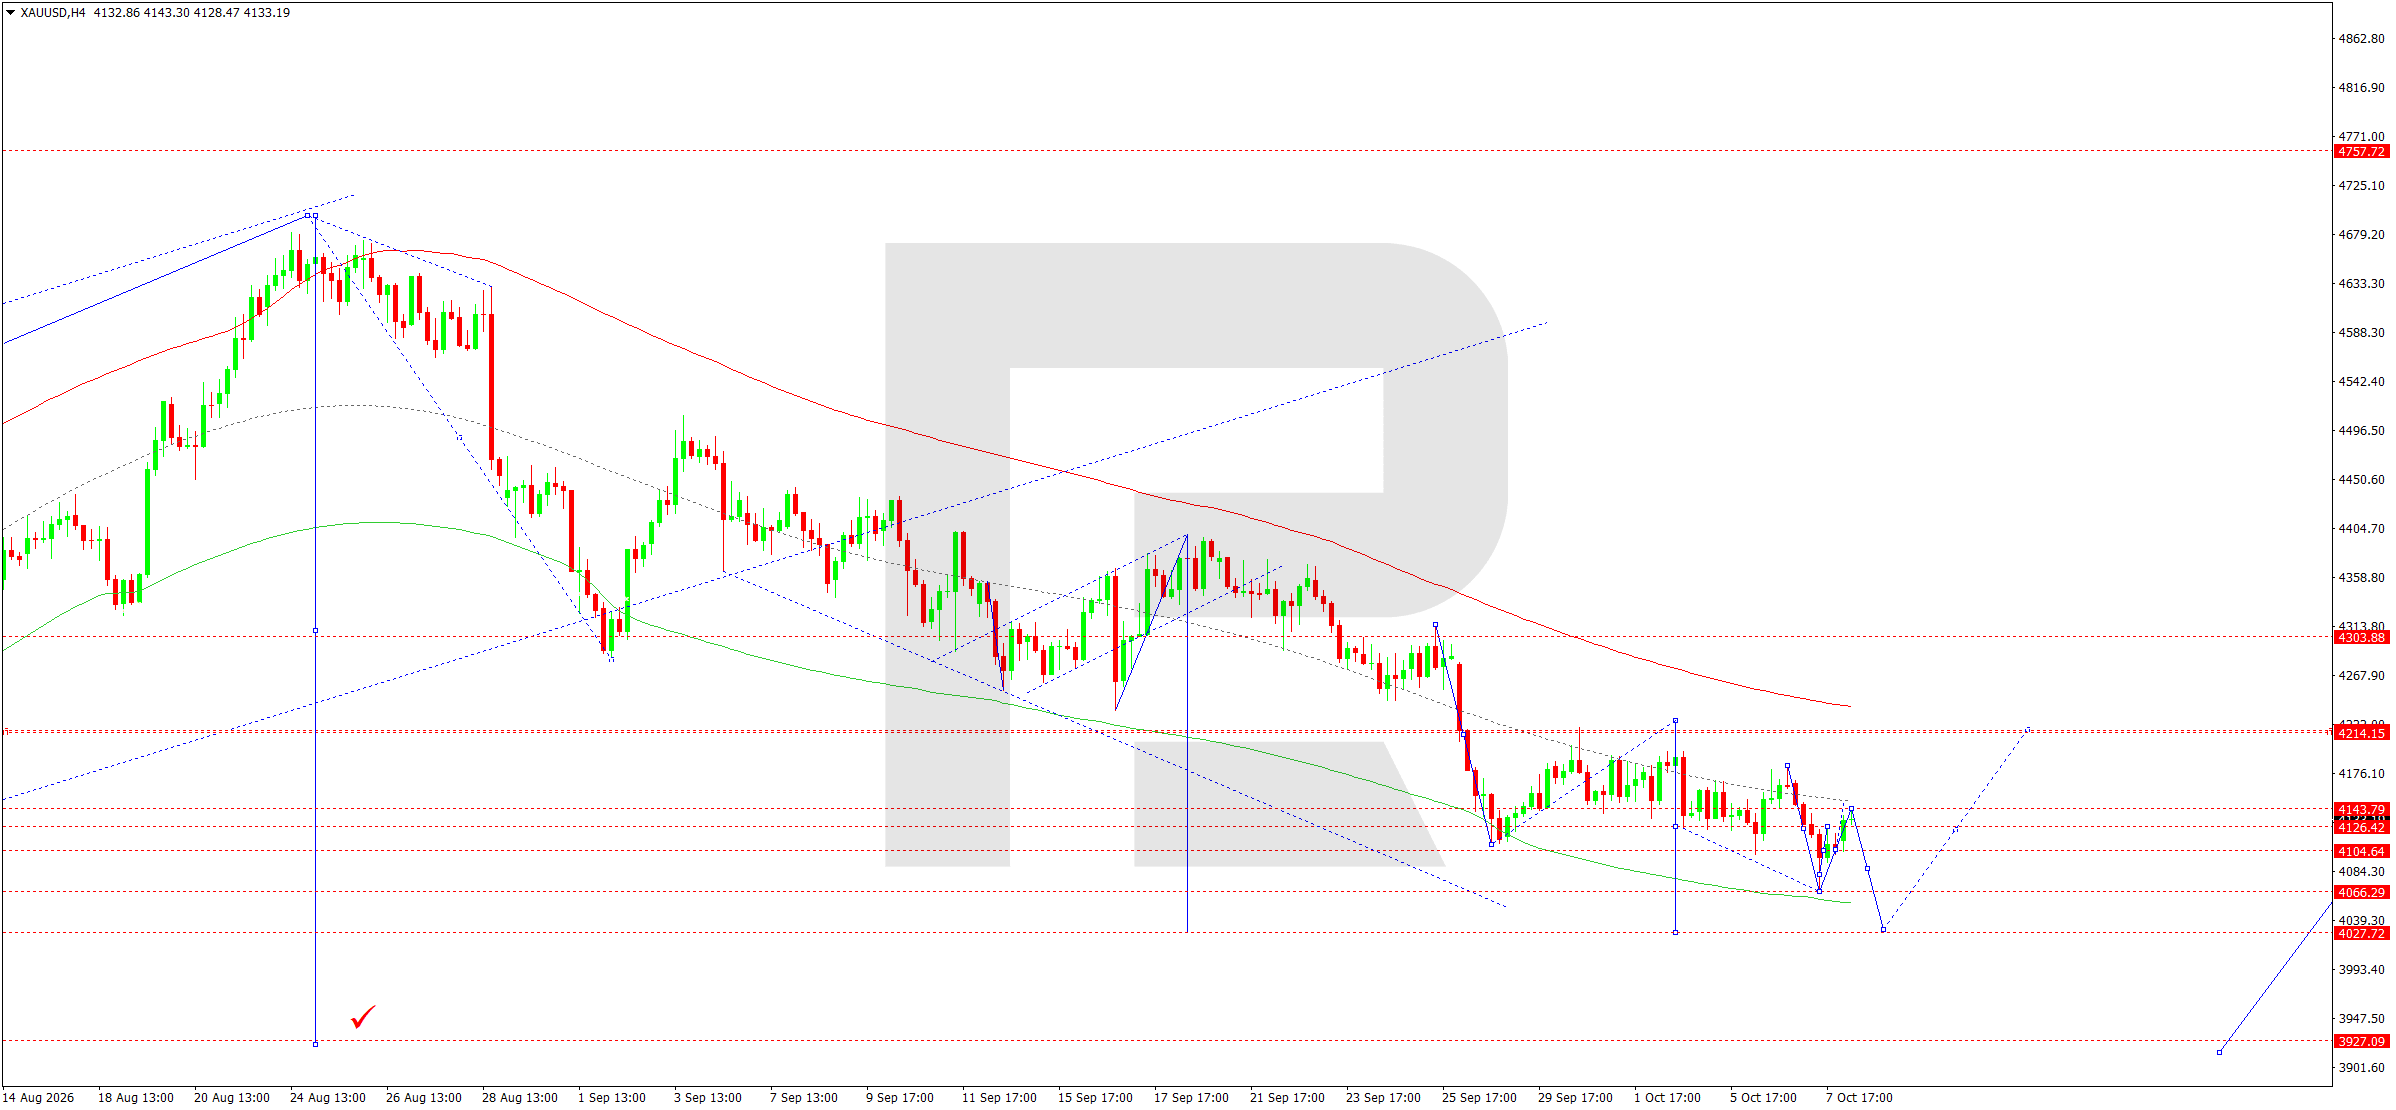
On the H4 chart, XAUUSD remains in a downtrend after the previous upward cycle ended. The market is forming a sequence of lower highs, confirming the predominance of selling pressure.
During the latest correction, quotes reached 4,141 before dropping to the 4,117 support level.
Today, 8 October, a compact consolidation range may form above this level. The main scenario remains a continued decline once local stabilisation is complete. The initial target is the 4,066 support level, followed by the 4,027–4,020 area.
The downward wave matrix with a pivot at 4,215 confirms that the negative technical balance remains intact. While quotes hold below this level, sellers hold the upper hand.
The Elliott Wave structure suggests another downward momentum. The lower boundary of the Price Envelope is located around 4,027 and acts as the key estimated target.
A breakout below this support level could lead to a further decline. However, reaching the lower boundary of the Envelope may be accompanied by a technical recovery.
The nearest resistance level is at 4,143. Consolidation above it would create conditions for a recovery towards 4,214–4,215.
For the current session, preference remains with selling, targeting 4,066 and 4,027. A sustained breakout above the matrix pivot would be required to change the main scenario.
XAUUSD forecast scenario
Trading scenario: SELL
- Price at the time of writing: 4,120
- Entry price: 4,115
- Stop loss: 4,155
- Take profit: 4,027
- Risk-to-reward ratio: 1:2.20
The trade idea is valid until 8:00 AM on 9 October 2026 (server time, UTC+3).
US 500 forecast
The US stock market on 8 October 2026 is being influenced by rising government bond yields, persistent inflationary pressure, and uncertainty surrounding the future Fed monetary policy.
The published minutes of the September meeting confirmed that most policymakers allow for an additional interest rate hike before the end of the year. However, market participants mostly expect current conditions to remain unchanged at the October meeting.
The yield on 10-year US Treasuries has approached 5.30%, increasing the cost of raising capital for US companies. High interest rates are particularly significant for the technology sector because they reduce the present value of expected future cash flows.
At the end of the previous trading session, the S&P 500 posted a moderate decline. Investors reduced positions amid higher borrowing costs, although some technology companies remained resilient thanks to expectations of profit growth.
Another source of uncertainty is the rise in oil prices due to geopolitical tensions in the Middle East. Higher energy costs may increase production expenses and sustain inflationary pressure.
At the same time, investment in artificial intelligence infrastructure continues to support interest in the largest US technology companies. However, large-scale capital expenditure and rising corporate borrowing are increasing the stock market’s sensitivity to interest rates.
During the trading session, investors will assess statements by Fed officials and US labour market data. Changes in expectations regarding future interest rate decisions may cause noticeable fluctuations in equity indices.
The fundamental balance remains mixed. High yields limit upside potential, while resilient corporate earnings support demand for equities. Therefore, short-term corrections do not necessarily mean the end of the upward market cycle.
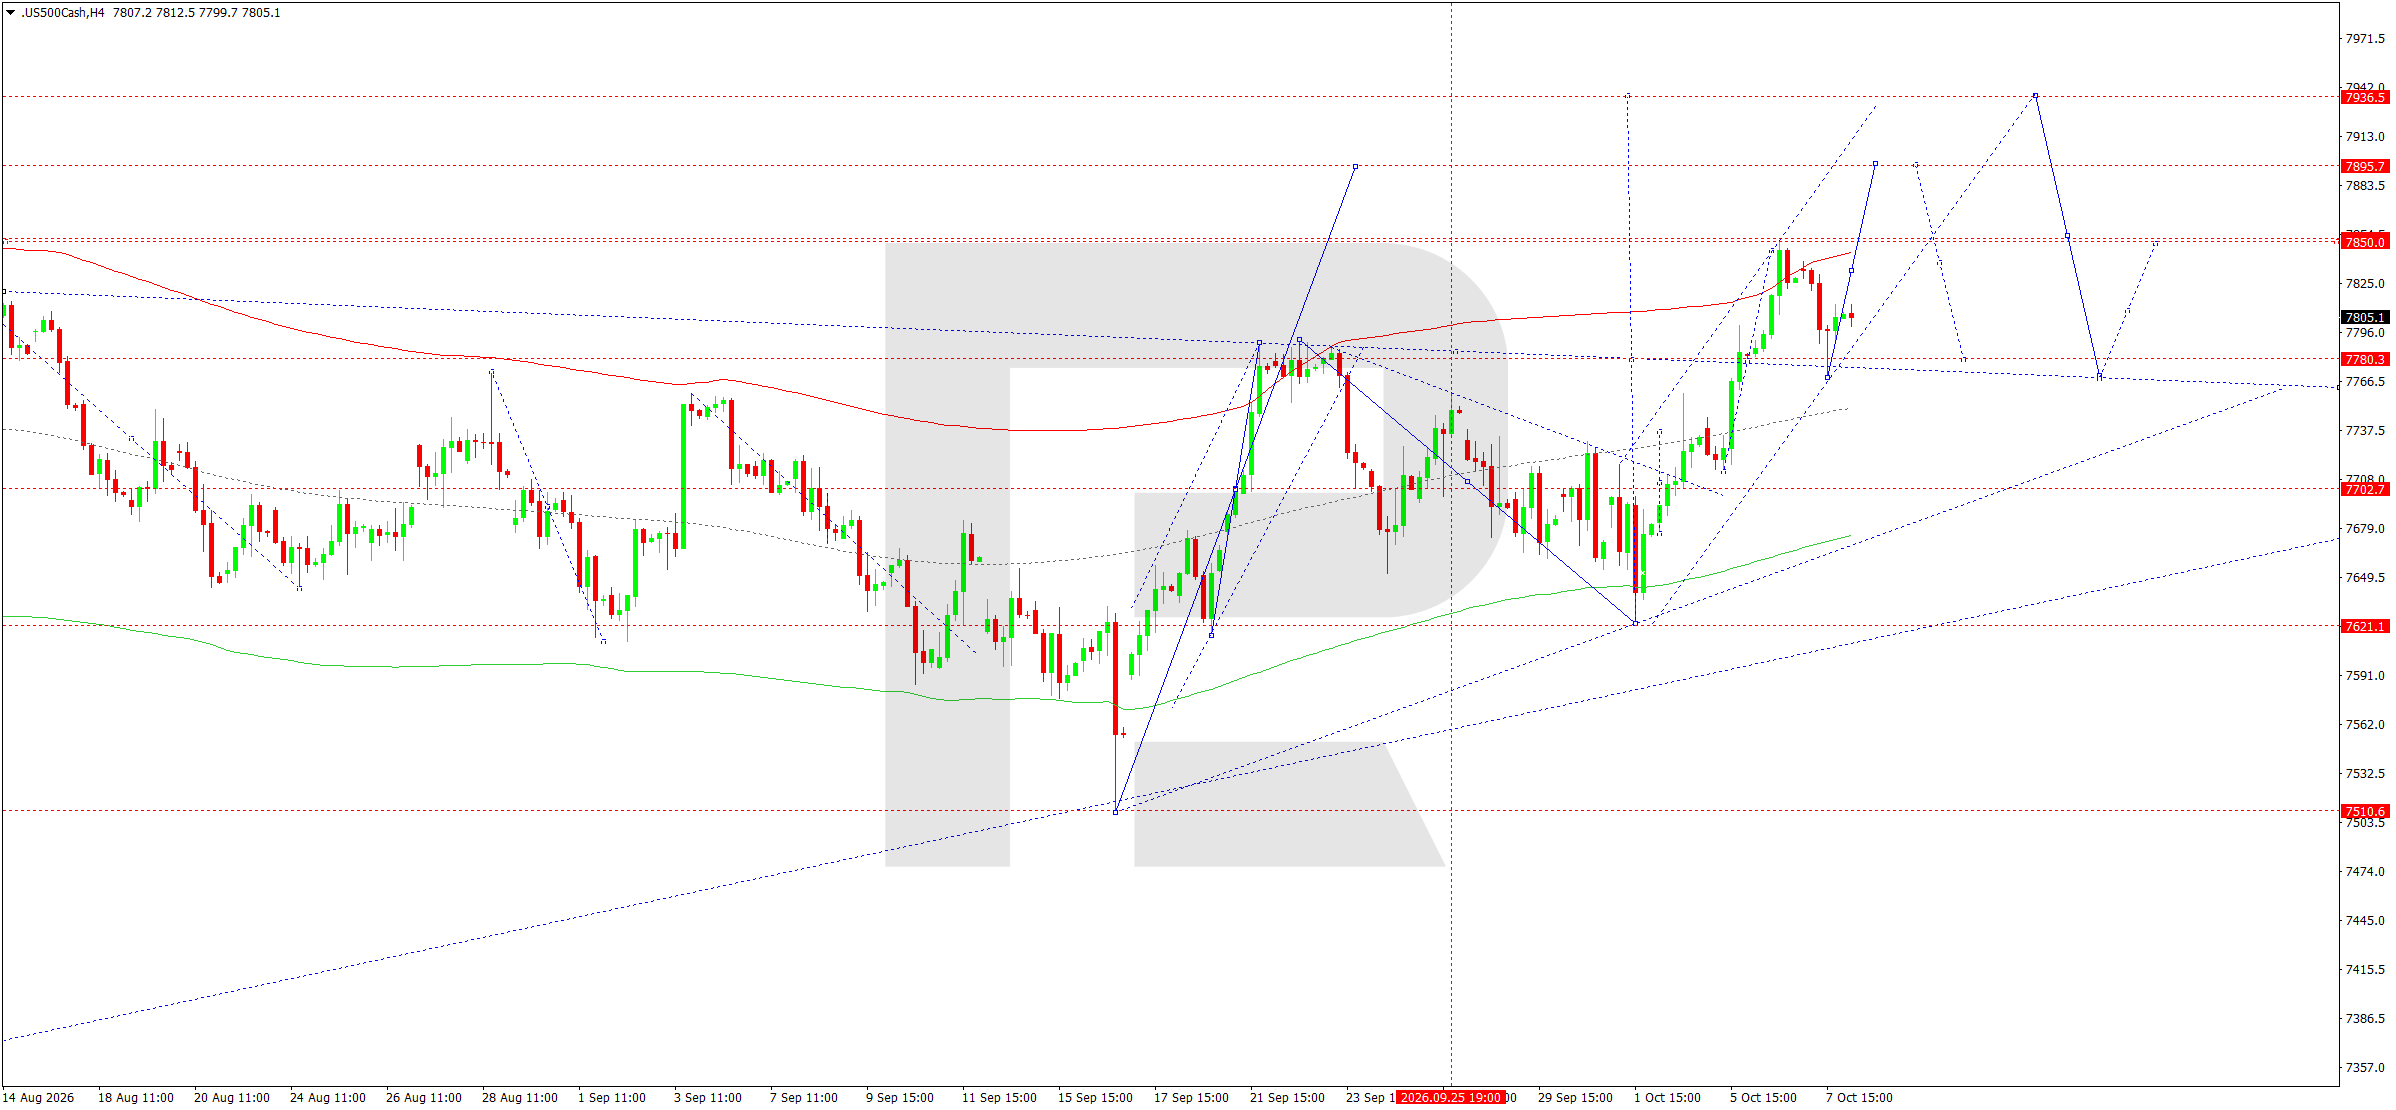
On the H4 chart, the US 500 retains an upward structure after the previous correction ended. The market declined towards the 7,777 support level and then formed a recovery impulse towards 7,812.
Today, 8 October, quotes are developing a local consolidation below the nearest resistance level. An upside breakout would create conditions for continued growth towards 7,850 and then 7,895.
The upward wave matrix with a pivot at 7,717 is the key technical reference point. While the market remains above this level, buyers retain the main advantage.
The Elliott Wave structure suggests another upward impulse after the local consolidation is complete. At the same time, a preliminary decline towards support at 7,757 cannot be ruled out, followed by a retest from above of the previously broken area.
The central line of the Price Envelope is located around 7,757. The upper boundary forms a prospective resistance area at 7,885–7,895.
A breakout above 7,895 would open the way for further growth towards 7,936. However, consolidation below 7,757 would weaken the bullish scenario and increase the probability of a decline towards 7,702.
Growth remains the main direction. Preference is given to buying after confirmation of an upside breakout from the local consolidation range. The nearest targets are 7,850 and 7,895, while 7,936 remains the longer-term reference point.
US 500 forecast scenario
Trading scenario: BUY
- Price at the time of writing: 7,797
- Entry price: 7,802
- Stop loss: 7,752
- Take profit: 7,895
- Risk-to-reward ratio: 1:1.86
The trade idea is valid until 8:00 AM on 9 October 2026 (server time, UTC+3).
BTCUSD forecast
The Bitcoin market remains under pressure on 8 October 2026 from tight global financial conditions, a stronger US dollar, and reduced investor risk appetite. The main macroeconomic factor remains the Federal Reserve monetary policy, which determines the cost of dollar liquidity.
The published minutes of the Fed’s September meeting confirmed concerns about inflation risks. Most participants allow for an additional interest rate hike before the end of the year, although the need for such a decision will depend on incoming economic data.
The yield on 10-year US Treasuries remains around 5.30%. The high cost of financing limits the appeal of high-risk assets and contributes to a reduction in speculative positions.
The US dollar is near an 18-month high, adding further pressure on the cryptocurrency market. During the previous trading session, Bitcoin fell below 84,000 USD, reflecting a deterioration in global investment sentiment.
Geopolitical tensions in the Middle East are an additional factor. Rising oil prices are increasing inflation expectations and supporting the likelihood that tight US monetary policy will persist.
Against this backdrop, investors are showing increased caution towards cryptocurrency assets. A reduction in leveraged positions may intensify short-term Bitcoin volatility, especially if important technical support levels are broken.
At the same time, the cryptocurrency market remains highly sensitive to changes in global liquidity. Lower government bond yields or a weaker dollar could trigger a rapid recovery in buying activity.
The fundamental balance remains predominantly restrictive. However, after a significant corrective move, the probability of a technical recovery is gradually increasing. The sustainability of such a recovery will depend on the US dollar’s dynamics and overall investor risk appetite.
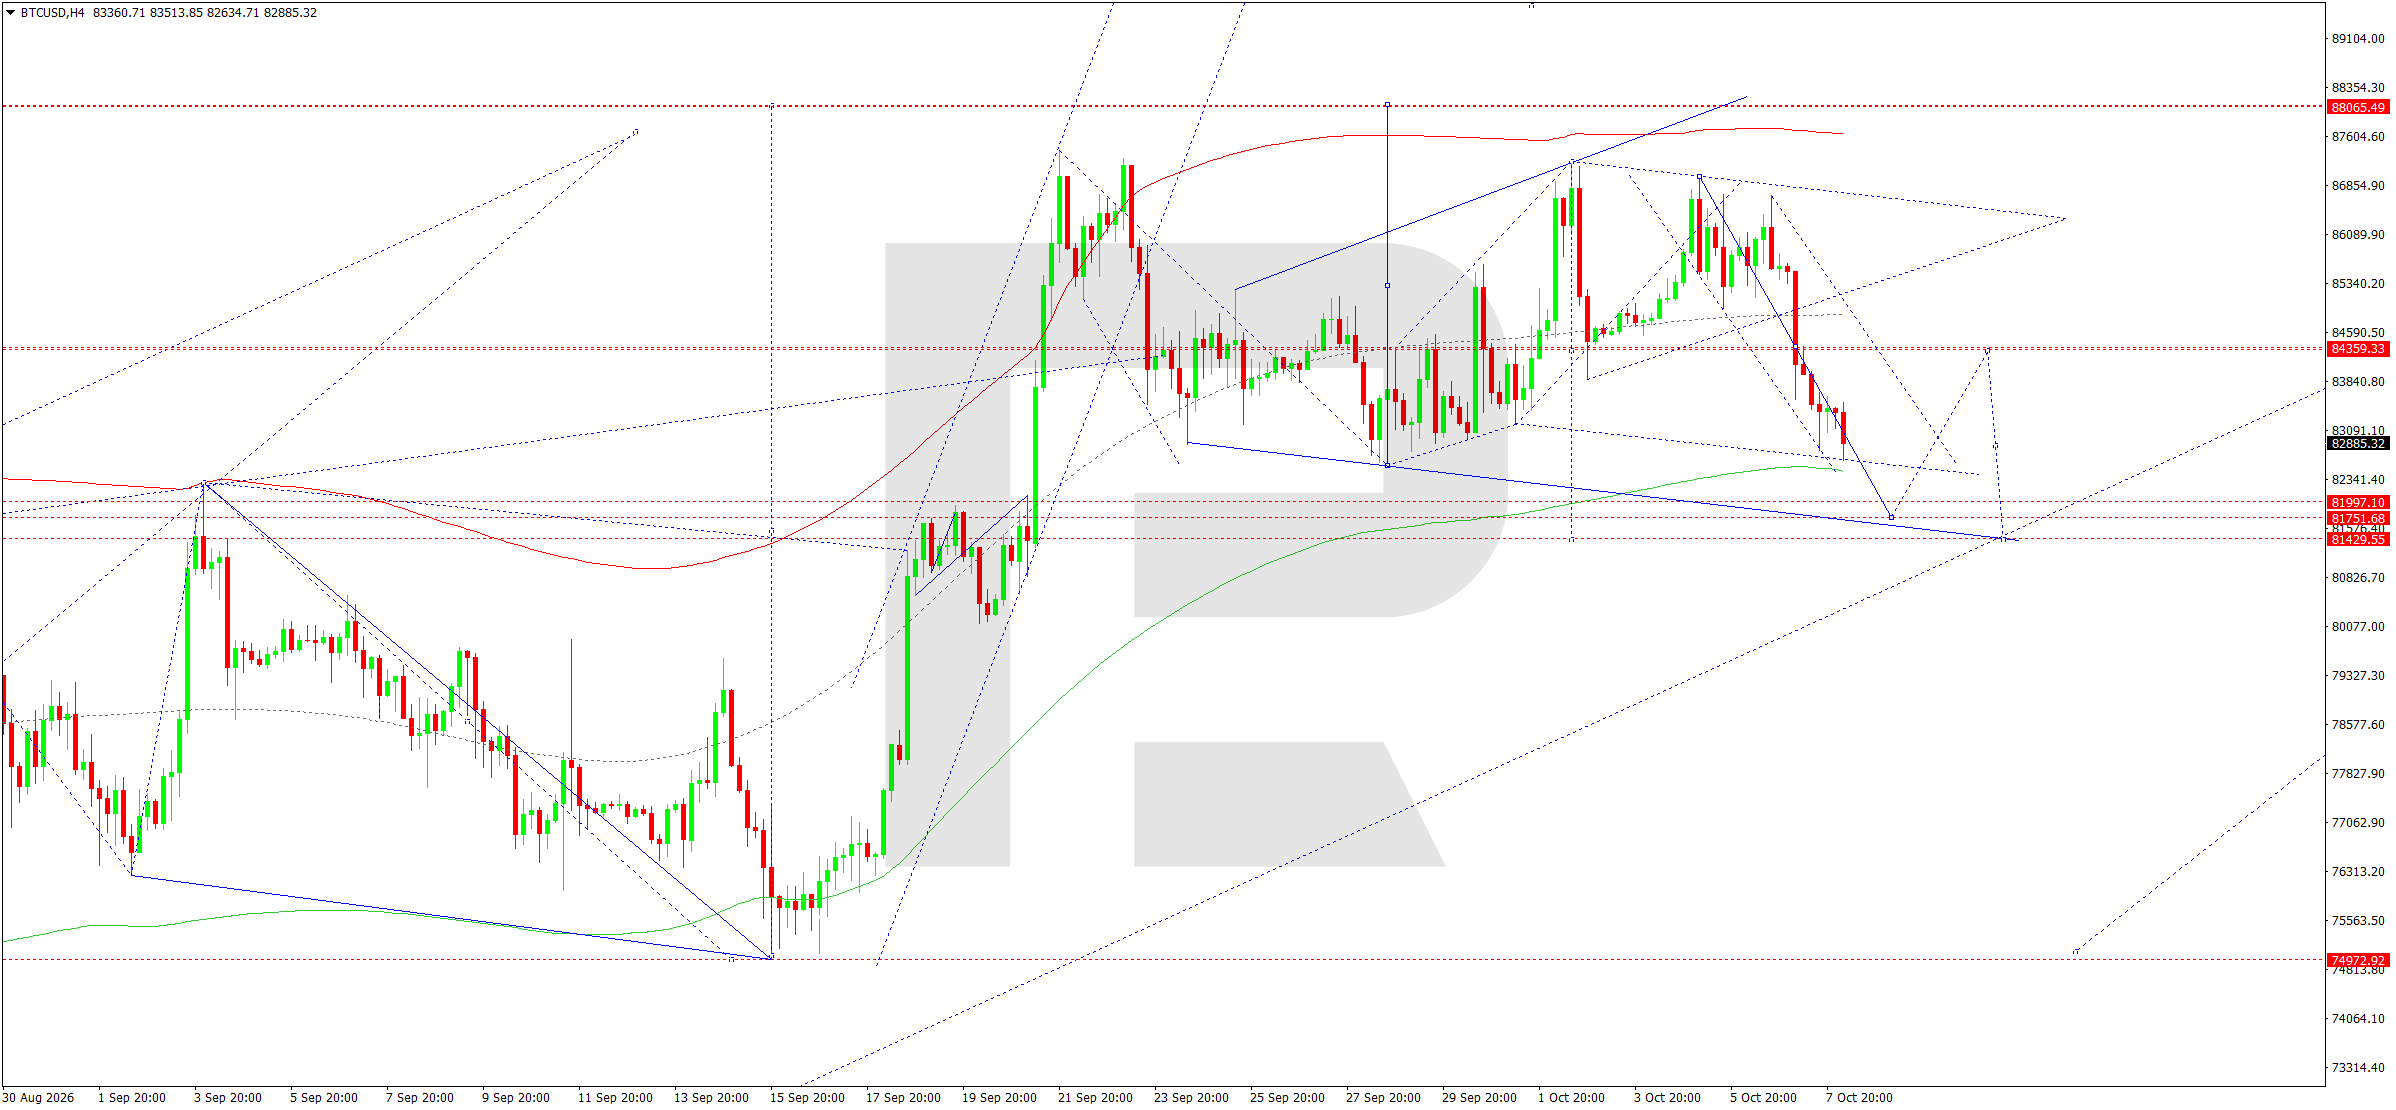
On the H4 chart, BTCUSD is developing a corrective structure after the completion of the previous upward impulse. The market declined towards 82,228, after which signs of local price stabilisation emerged.
Today, 8 October, the relevant scenario envisages an initial recovery towards 83,688. However, this rise may remain corrective, as the current downward structure has not yet been completed.
The upward wave matrix with a pivot at 85,323 is the main technical reference point. While quotes remain below the matrix pivot, the probability of continued short-term selling pressure remains.
The Elliott Wave structure suggests an additional downward move after the local recovery is complete. In this case, the price is expected to retest the 81,997 support level before moving towards 81,751.
The lower boundary of the Price Envelope is located around 81,751. Reaching this area may complete the current correction and create conditions for a new upward impulse.
After a confirmed reversal, a recovery towards 84,359 and then the matrix pivot at 85,323 would become relevant. A breakout above this resistance would open the prospect of further growth towards 88,065.
An alternative scenario suggests consolidation below 81,429, which would increase the risk of a further decline.
The main medium-term scenario remains the completion of the correction followed by a recovery. However, opening buy positions requires confirmation that the nearest support levels are holding.
BTCUSD forecast scenario
Trading scenario: BUY
- Price at the time of writing: 82,852
- Entry price: 82,857
- Stop loss: 81,397
- Take profit: 88,065
- Risk-to-reward ratio: 1:3.57
The trade idea is valid until 8:00 AM on 9 October 2026 (server time, UTC+3).
Editors’ picks
 EURUSD forecast 2026–2027: technical analysis, price levels & predictions
The EURUSD outlook for 2026 and 2027: key levels on the daily chart, three trading scenarios and the policy gap between the Fed and the ECB that drives the pair.
 Gold (XAUUSD) forecast 2026: technical analysis, price levels & predictions
Where gold could trade in 2026: key levels, three trading scenarios with entry triggers and the forecasts from J.P. Morgan, Deutsche Bank and Goldman Sachs.
Forecasts presented in this section only reflect the author’s private opinion and should not be considered as guidance for trading. RoboForex bears no responsibility for trading results based on trading recommendations described in these analytical reviews.