
Daily technical analysis and forecast for 9 October 2026
Daily technical analysis and forecast for EURUSD, USDJPY, GBPUSD, AUDUSD, USDCAD, XAUUSD, US 500, and BTCUSD for 9 October 2026.
Each scenario on this page reflects the market structure on the H4 chart as of 10:00 UTC+3 on 9 October 2026. The assessment considers the current H4 chart structure, key support and resistance levels, the direction of the medium-term movement, and the prevailing fundamental backdrop.
EURUSD forecast
The euro is ending the trading week under pressure from the US dollar. The main factor is the divergence in expectations for the future monetary policies of the European Central Bank and the Federal Reserve. The minutes of the Fed's latest meeting confirmed the regulator's concerns about persistent inflation. US central bank officials have left open the possibility of further policy tightening if incoming economic data maintain their current trend.
Political uncertainty in France is placing additional pressure on the euro. Discussions of budget constraints, the state of public finances, and fluctuations in French bond yields are making market participants more cautious. Although stabilisation in the European debt market has somewhat limited selling of the single currency, the fundamental conditions for a sustained recovery remain insufficient.
Rising oil prices are increasing inflation risks for the European economy, which depends on energy imports. At the same time, high borrowing costs are constraining the outlook for business activity. The ECB must balance the need to contain inflation against the risks of slowing economic growth.
Relatively resilient employment figures in the US are supporting the dollar. Initial jobless claims stood at 197 thousand, confirming that the labour market has not deteriorated sharply. Against this backdrop, traders continue to assess the likelihood of restrictive financial conditions remaining in place. In the short term, the fundamental balance predominantly favours the dollar, although falling US bond yields could temporarily limit the decline in EURUSD.
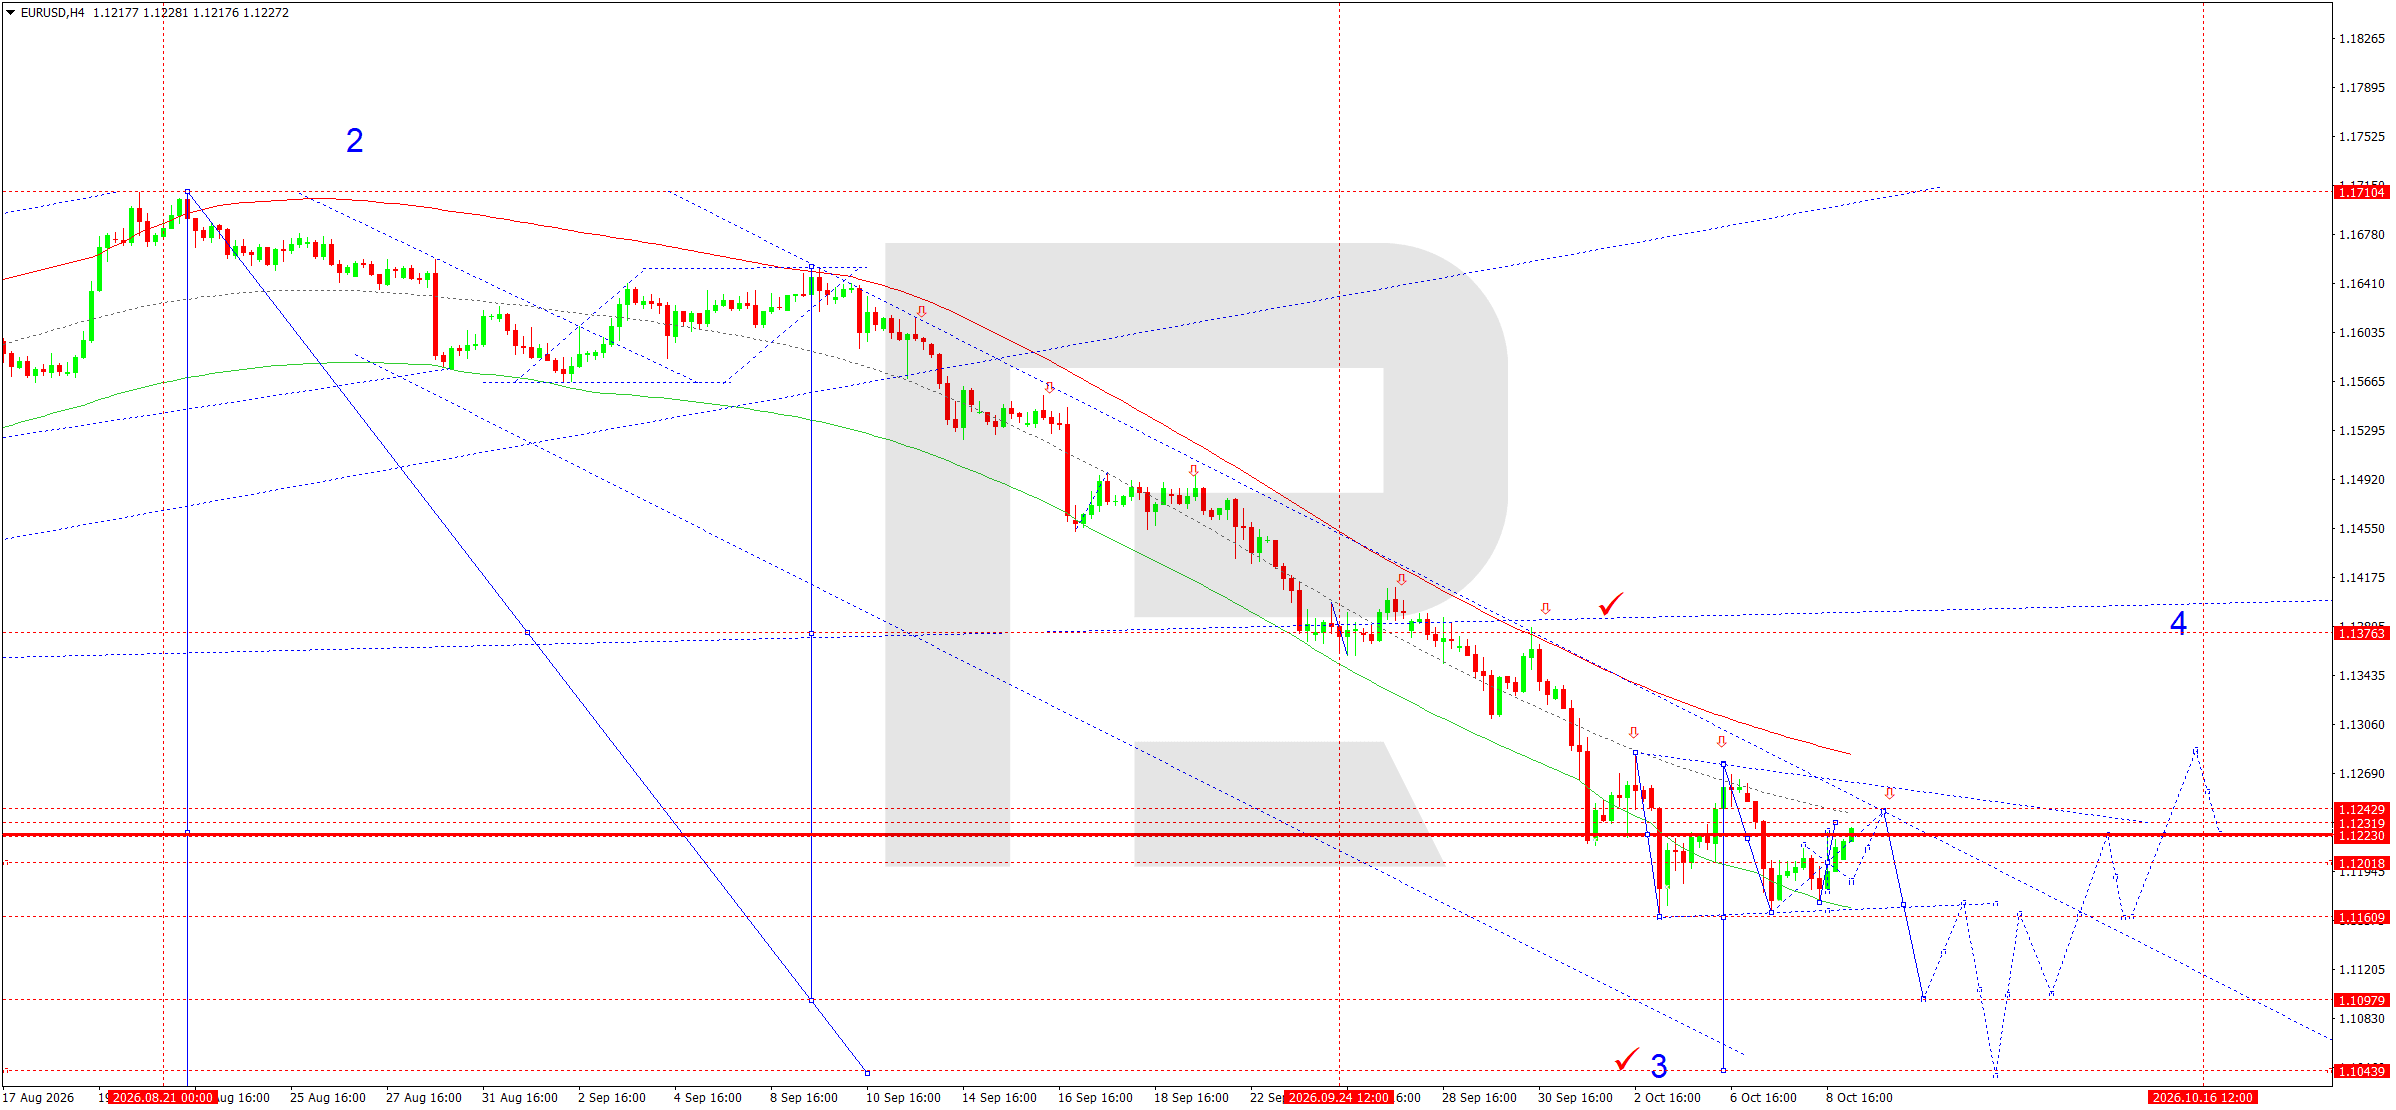
On the H4 chart, EURUSD completed another downward wave at 1.1164 before staging a corrective rise towards the 1.1242 resistance level. Today, 9 October 2026, the main scenario suggests a renewed decline, initially targeting 1.1161. A breakout below this support would open the way towards 1.1111, followed by the longer-term target at 1.1050.
The Elliott wave structure indicates downward momentum following the completion of the local correction. The wave matrix, with its pivot centre at 1.1222, defines the key trading decision area. Consolidation below this level would confirm the sellers' advantage. The earlier breakout above 1.1245 failed to trigger a sustained upward movement, increasing the likelihood of the price returning to its main descending channel.
The nearest technical target is the 1.1202 support level. A breakout below it would create conditions for a test of the 1.1161 mark. The lower boundary of the price Envelope lies around 1.1111. An alternative scenario suggests a recovery above 1.1245 followed by a test of 1.1270. As long as resistance holds, selling on local corrective rallies remains preferable.
EURUSD forecast scenario
Trading scenario: SELL
- Price at the time of writing: 1.1225
- Entry price: 1.1220
- Stop loss: 1.1260
- Take profit: 1.1111
- Risk-to-reward ratio: 1:2.73
The trade idea is valid until 8:00 on 10 October 2026 (server time, UTC+3).
USDJPY forecast
The Japanese yen remains vulnerable against the US dollar because of differences in monetary conditions between the US and Japan. The Federal Reserve continues to take a cautious approach to further interest rate changes. Recent comments from Fed officials point to persistent inflation risks and the possibility of further policy tightening if the US economy remains resilient.
The Bank of Japan, by contrast, is considering a gradual normalisation of monetary conditions. Although some policymakers are prepared to support further rate increases, market participants expect changes to be introduced in stages, taking account of wages, consumer prices, and domestic demand. This difference in the pace of monetary policy continues to favour the yield on dollar-denominated assets relative to Japanese instruments.
Higher global energy prices are another factor. Japan is heavily dependent on oil and gas imports, so rising commodity costs worsen its terms of trade and place additional pressure on the national currency. At the same time, increased energy costs may fuel domestic inflation, raising the likelihood of further action by the BoJ.
Published Japanese current account data showed a substantial surplus, limiting fundamental pressure on the yen. However, the short-term direction of USDJPY is largely determined by movements in US bond yields and interest rate expectations. Persistently elevated US Treasury yields support the dollar. The main risk to the bullish scenario is a sharp narrowing of the yield differential or growing expectations of more decisive action by the Japanese regulator.
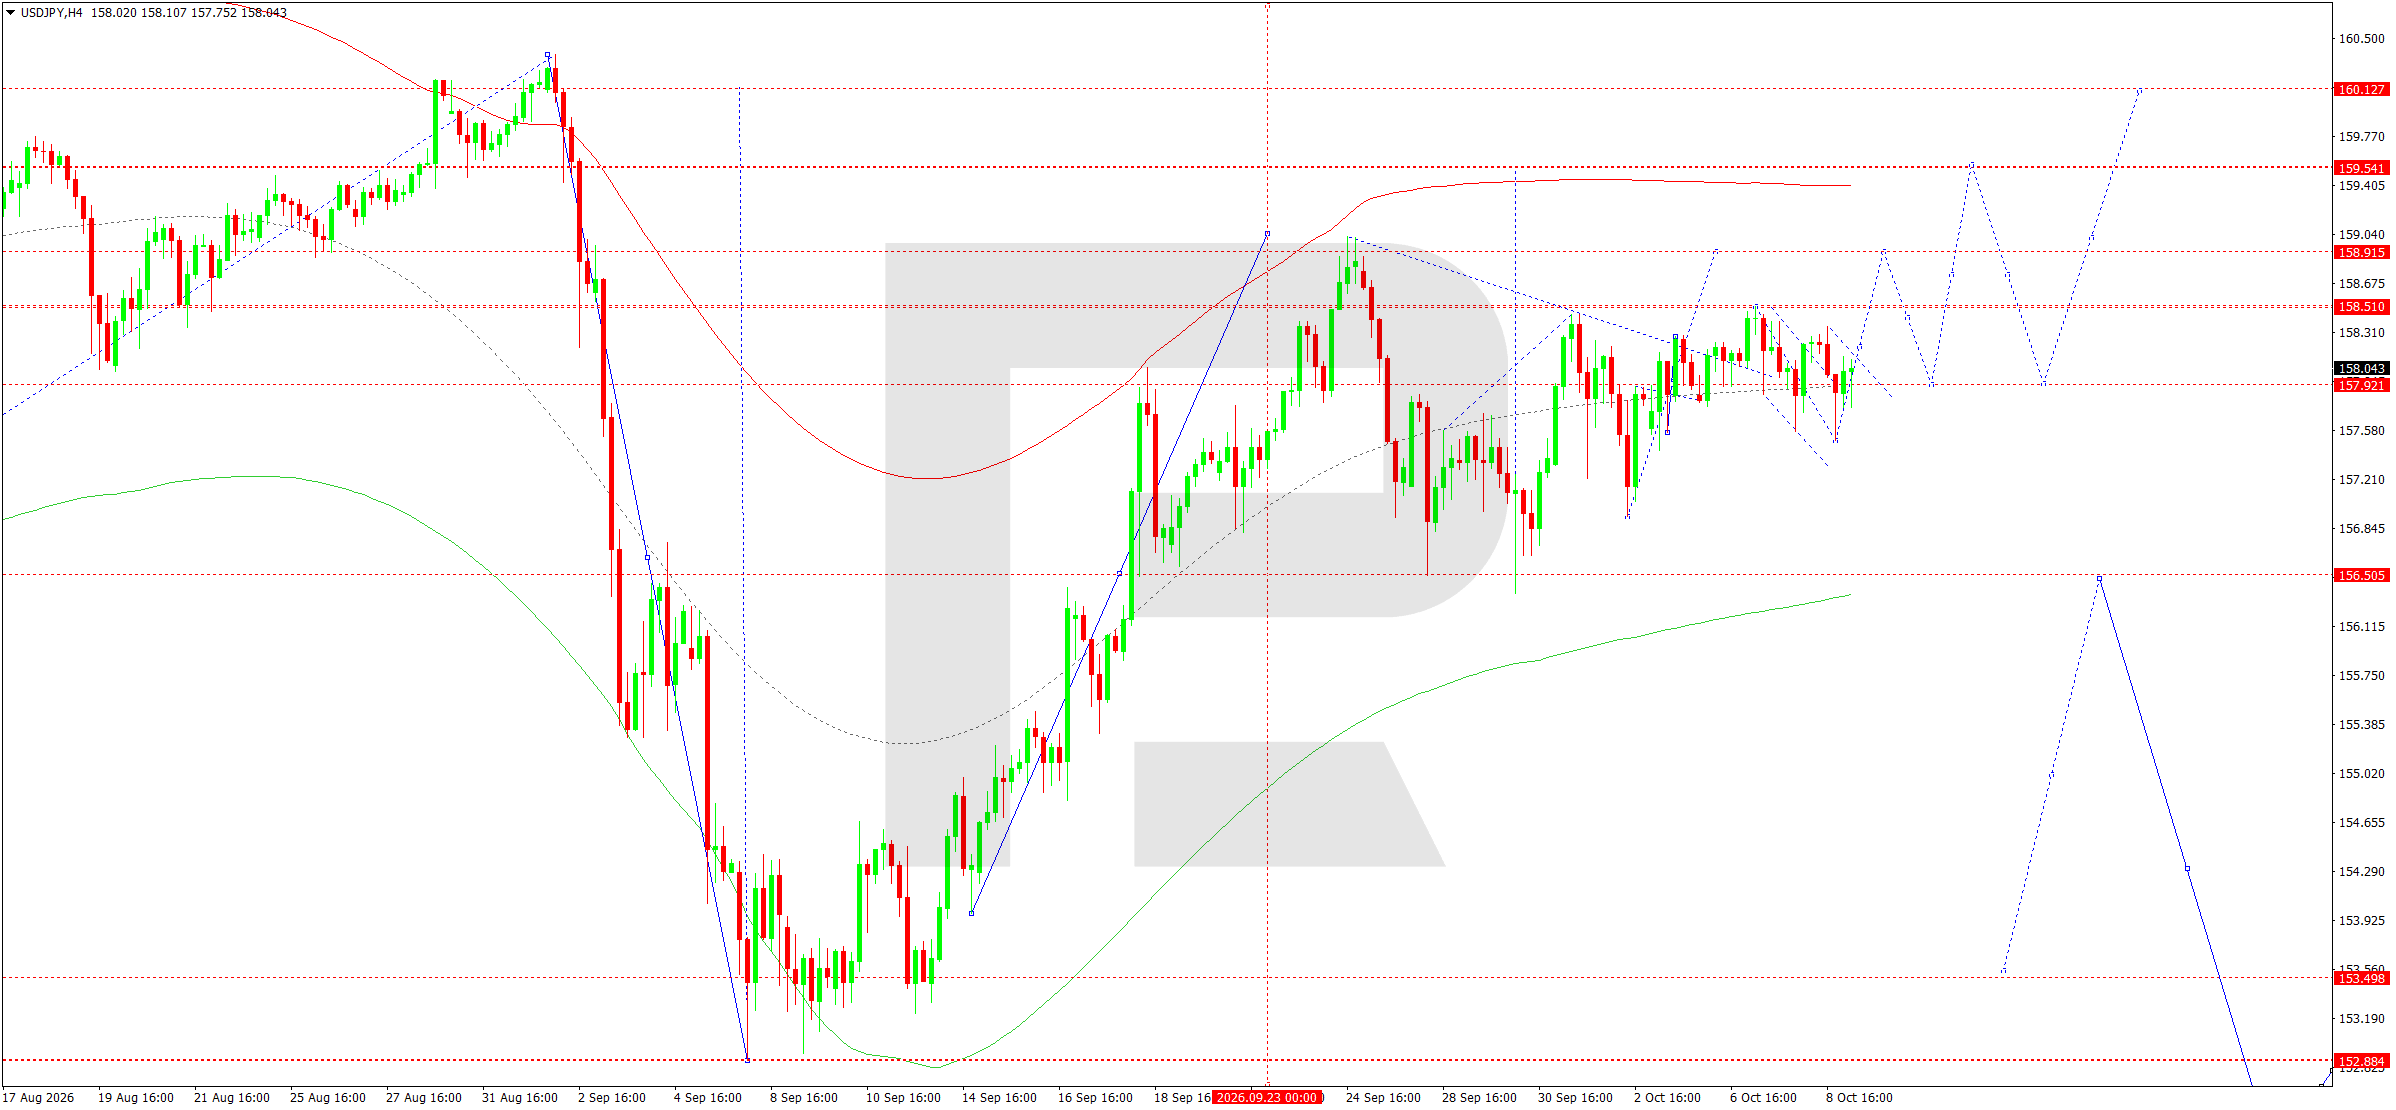
On the H4 chart, USDJPY formed an upward structure after consolidating above support at 157.92. The current consolidation is developing within the 157.92–158.51 range. Today, 9 October 2026, the priority scenario remains further growth, initially targeting 158.91. A decisive breakout above this resistance would create conditions for the upward wave to extend towards 159.40.
The Elliott wave count allows for another impulse leg after the completion of the local correction. The wave matrix, with its pivot centre at 157.94, defines the key support for the current move. Holding above this value confirms the buyers' advantage and allows the present range to be treated as an intermediate consolidation.
The centre line of the price Envelope runs close to 157.94. Holding this level would provide a technical basis for a retest of the 158.51 level and a subsequent move towards 158.91. An additional target is the 159.40 resistance level located in the upper part of the current wave structure.
An alternative scenario suggests a decline towards 157.40. Consolidation below this level would disrupt the short-term bullish configuration and open the way towards 156.50 and, subsequently, 155.60. As long as the price holds above the matrix centre, buyers retain the advantage.
USDJPY forecast scenario
Trading scenario: BUY
- Price at the time of writing: 158.22
- Entry price: 158.27
- Stop loss: 157.90
- Take profit: 159.40
- Risk-to-reward ratio: 1:3.05
The trade idea is valid until 8:00 on 10 October 2026 (server time, UTC+3).
GBPUSD forecast
The British pound continues to trade under the influence of a stronger US dollar and ongoing uncertainty over the UK economic outlook. Market participants are primarily focused on the relationship between the monetary policies of the Bank of England and the Federal Reserve. Persistent inflationary pressure limits both central banks' ability to move quickly towards easier financial conditions.
Higher energy costs are an additional source of uncertainty for the British economy. Rising oil prices increase companies' production and transport costs and could intensify consumer inflation. This complicates the BoE's decisions, as the need to maintain price stability coincides with risks of slowing domestic demand.
The US dollar is supported by the resilience of the US labour market. Recent jobless claims data show no pronounced deterioration in employment. Fed officials continue to discuss the need to maintain restrictive monetary policy, supporting the appeal of dollar-denominated instruments.
Meanwhile, fluctuations in UK and US government bond yields create additional short-term impulses for GBPUSD. A rise in the relative yield on US assets could increase pressure on the pound. Conversely, falling US Treasury yields could trigger a corrective recovery in the British currency.
Against the backdrop of ongoing geopolitical tensions, investors remain cautious towards European currencies. The fundamental picture for the next trading session therefore remains moderately negative for the pound, despite the possibility of occasional upward corrections.
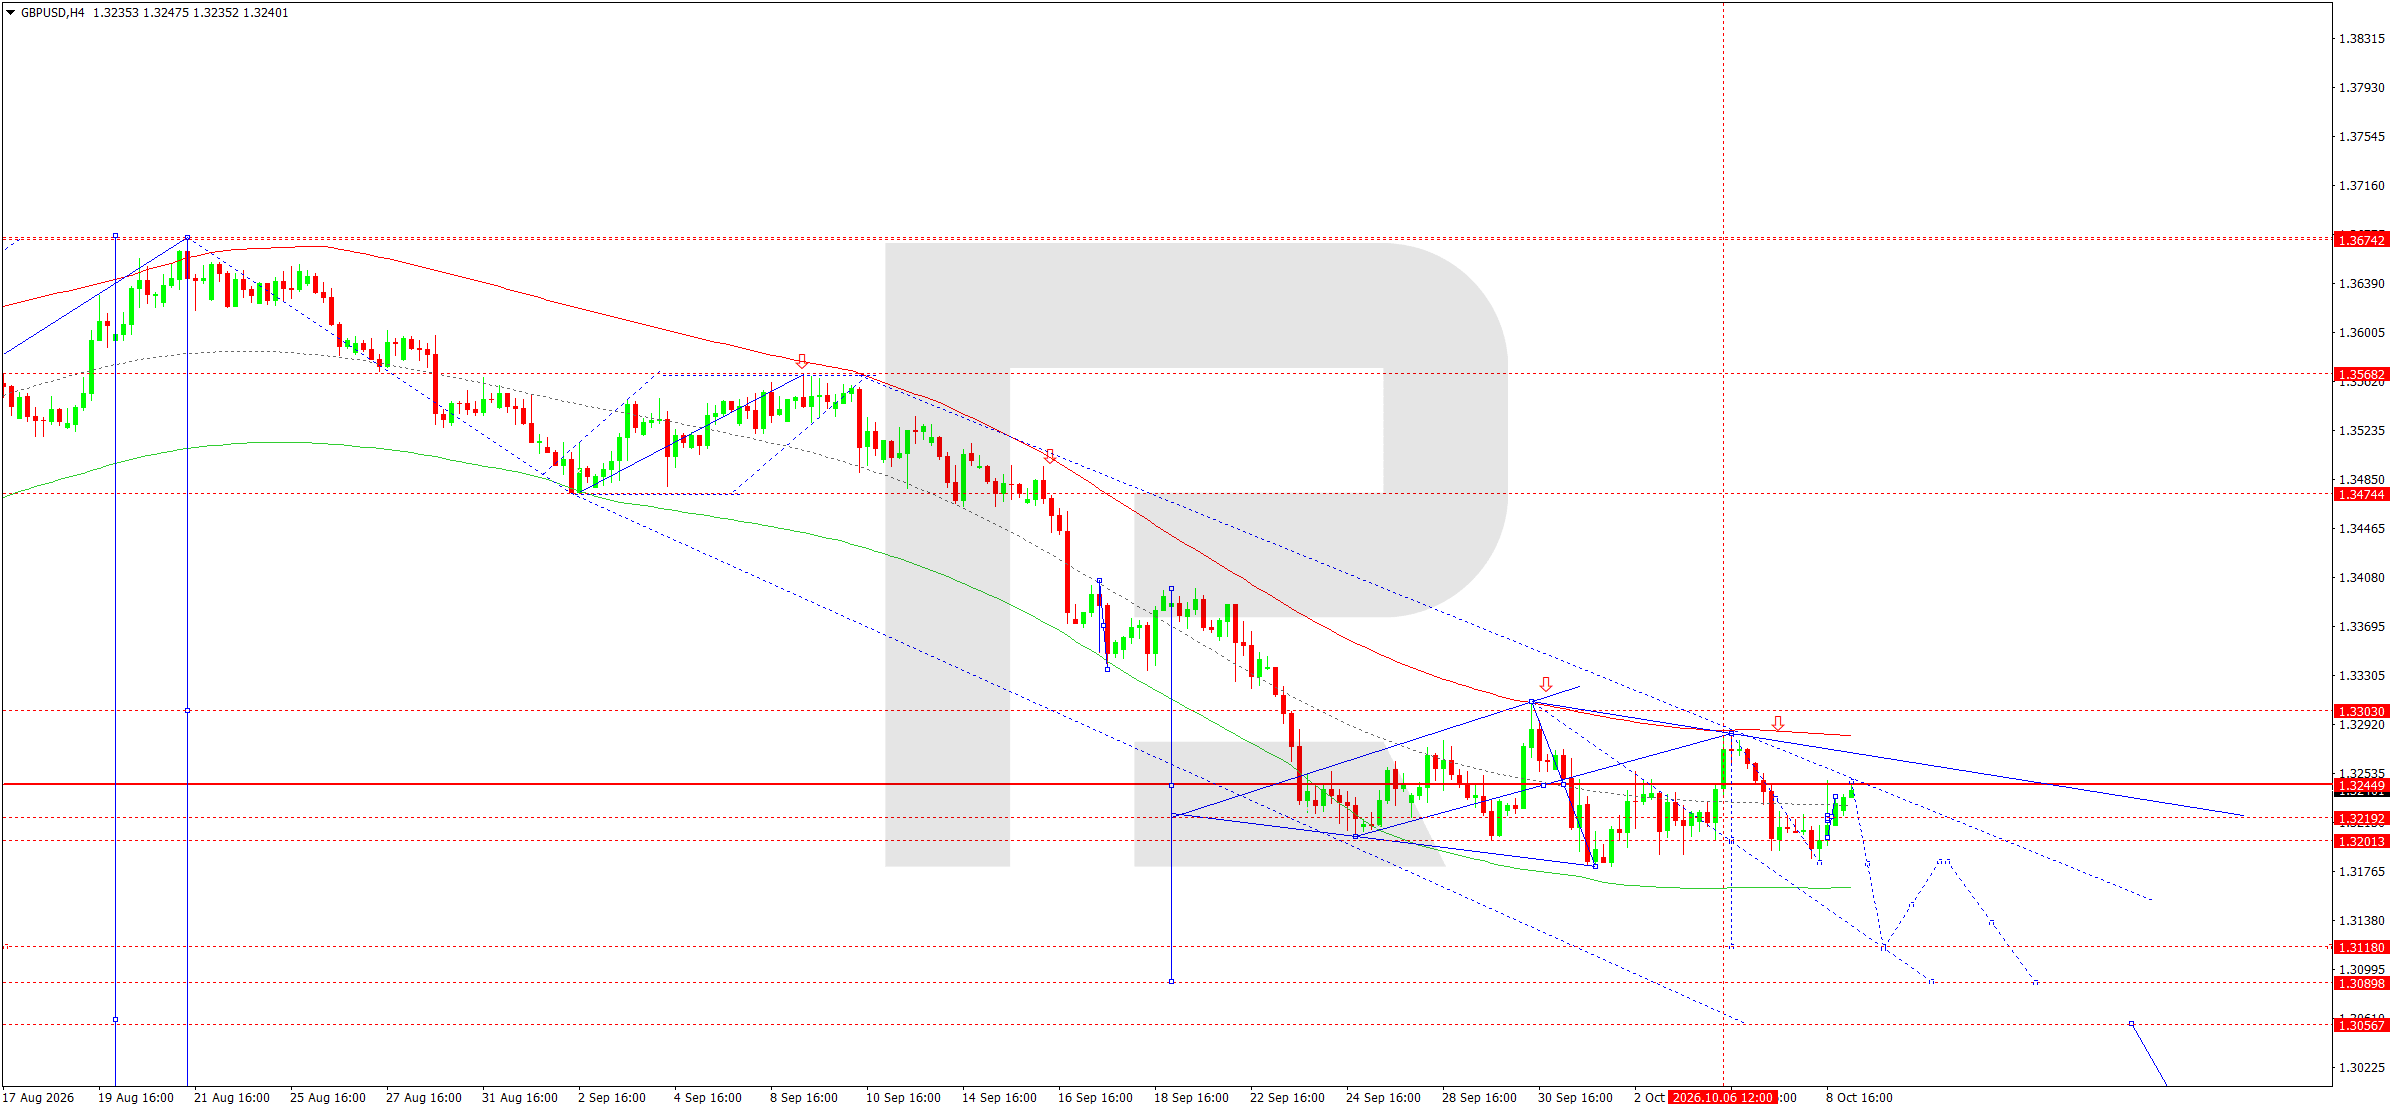
On the H4 chart, GBPUSD completed another downward wave at 1.3193 before staging a corrective recovery towards 1.3244. Today, 9 October 2026, the downward move is expected to resume, initially targeting 1.3181. A breakout below this support would open the way for further declines towards 1.3118, then 1.3088 and the longer-term target at 1.3061.
The Elliott wave structure reflects the continuation of a downward impulse interrupted by brief corrective rallies. The wave matrix, with its pivot centre at 1.3244, acts as the main resistance for the current move. As long as the price remains below this level, sellers retain the technical advantage.
A descending channel is clearly visible on the four-hour chart, limiting recovery potential. The 1.3219 area acts as intermediate support, while the 1.3244–1.3303 zone forms resistance. The lower boundary of the price Envelope is near 1.3088, defining the main target for the current wave.
Consolidation below 1.3181 would confirm the market's readiness to develop the next downward leg. An alternative scenario suggests an upside breakout above 1.3244 followed by a recovery towards 1.3303. Until such a signal appears, selling on corrective rallies remains the priority.
GBPUSD forecast scenario
Trading scenario: SELL
- Price at the time of writing: 1.3238
- Entry price: 1.3233
- Stop loss: 1.3273
- Take profit: 1.3088
- Risk-to-reward ratio: 1:3.63
The trade idea is valid until 8:00 on 10 October 2026 (server time, UTC+3).
AUDUSD forecast
The Australian dollar remains sensitive to changes in global risk appetite, US dollar movements, and the outlook for China's economy. The main source of pressure is the Fed’s relatively hawkish stance. The minutes of the Federal Reserve's latest meeting and comments from policymakers point to persistent inflation risks, supporting demand for dollar-denominated assets.
The Reserve Bank of Australia's policy is important for the Australian economy. The central bank must take account of persistent inflation expectations and the potential impact of high interest rates on consumer demand. The latest published data showed that expected consumer inflation in Australia rose to 5.3% from 4.9% previously. This limits room for monetary easing and could provide support for the Australian currency.
Conditions in China's industrial sector also have a significant impact on AUDUSD. China remains Australia's key trading partner, so changes in demand for iron ore, coal, and other commodities directly affect the country's export revenue outlook. Weak Chinese industrial activity could limit a recovery in the Australian dollar even if domestic economic data remain relatively resilient.
Rising oil prices and geopolitical tensions are increasing uncertainty in global financial markets. A decline in investor appetite for risk assets traditionally weighs on currencies of commodity-exporting economies. Meanwhile, stabilising equity markets and recovering Chinese demand could support a local strengthening of AUDUSD.
In the short term, the fundamental balance remains mixed. However, the Australian dollar's technical weakness and the continued appeal of US assets create conditions for the downtrend to continue.
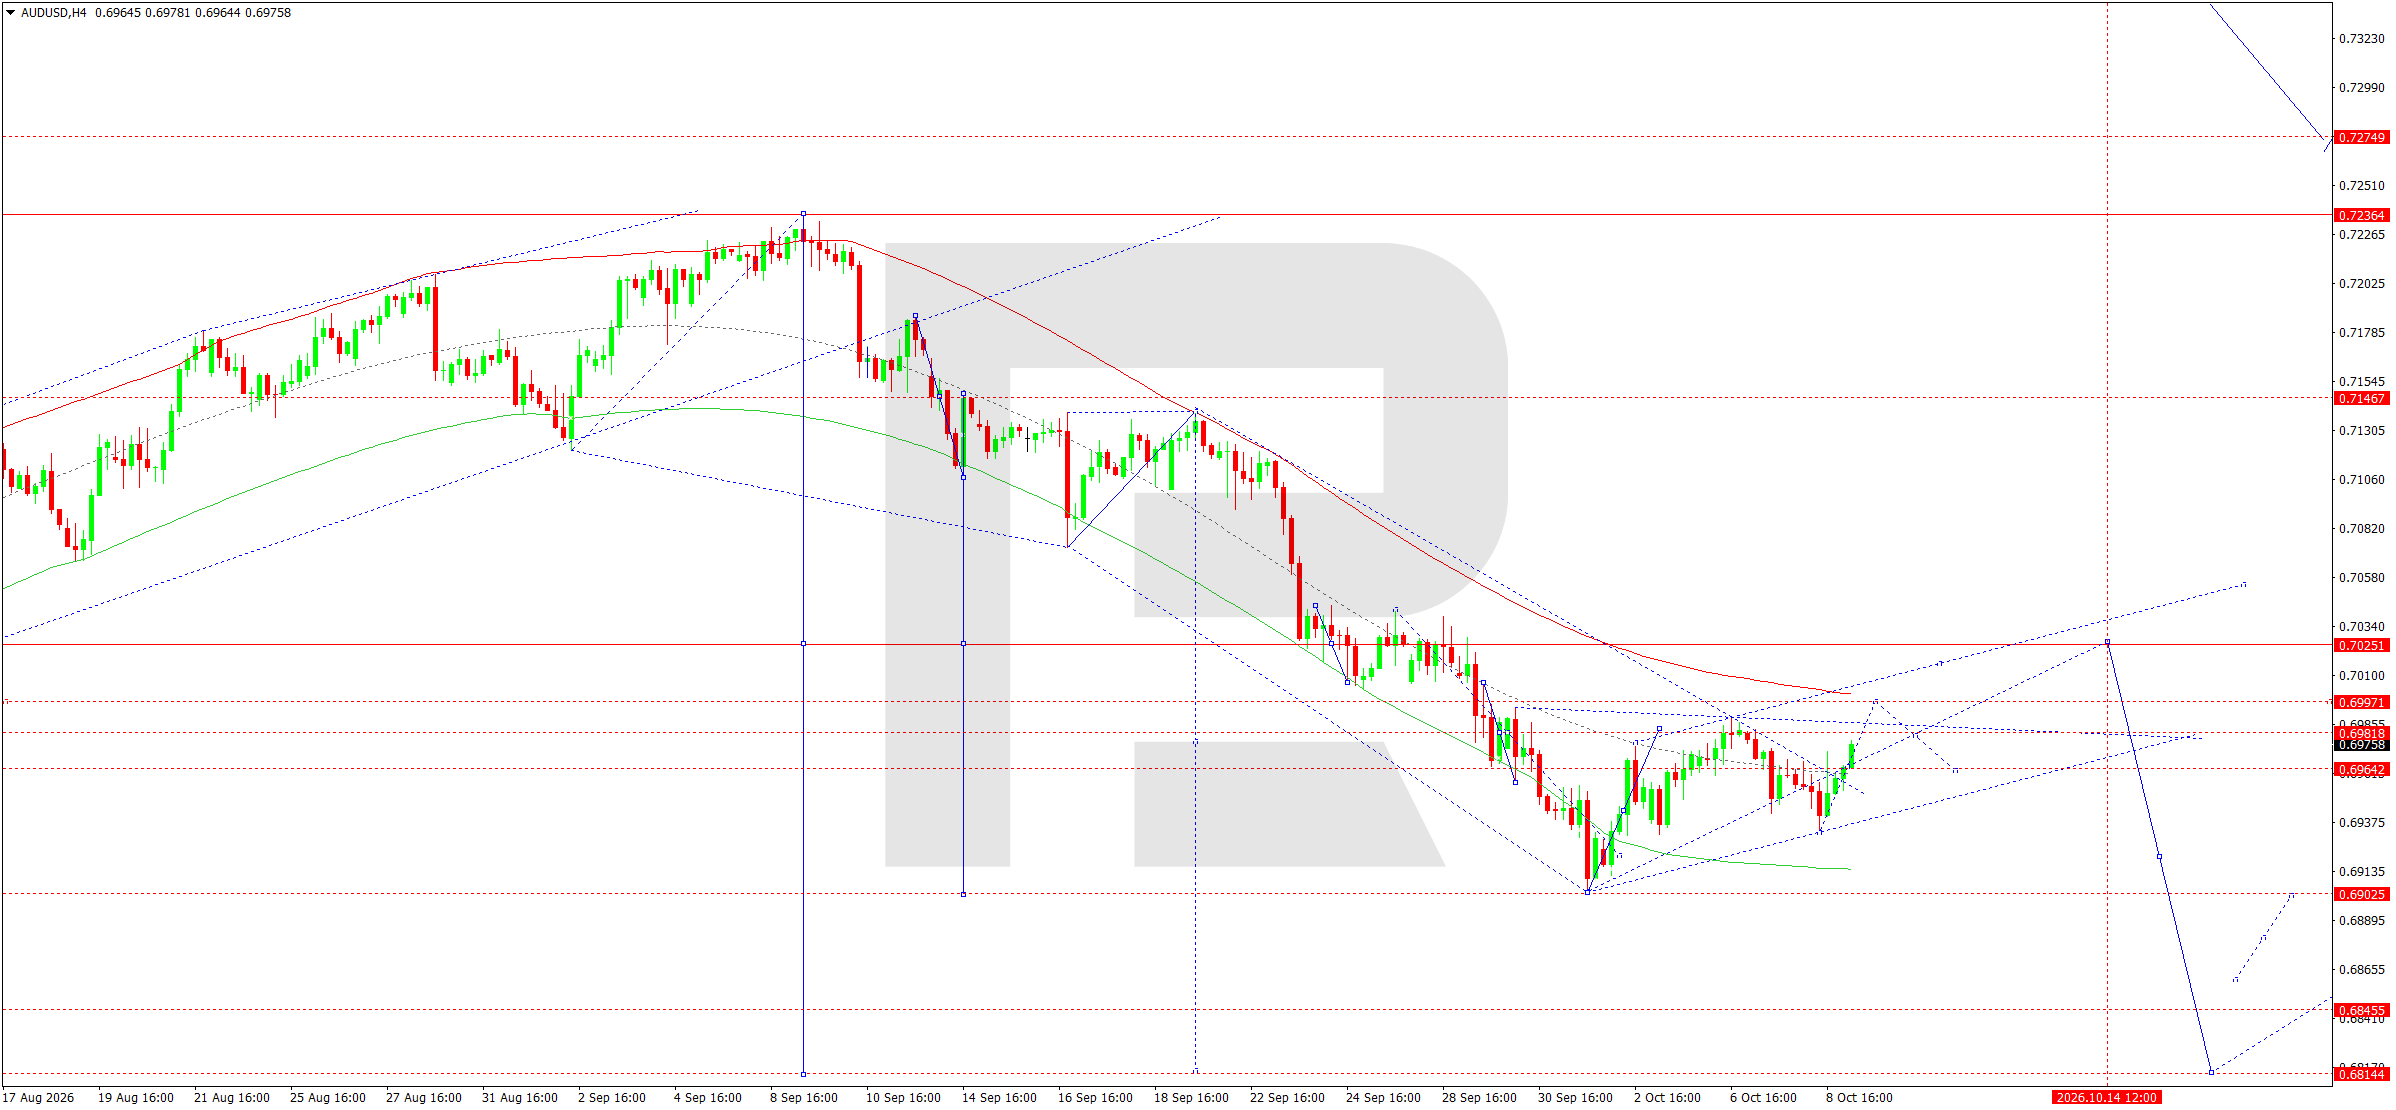
On the H4 chart, AUDUSD formed a sequence of lower moves after the advance towards 0.7236 ended. The subsequent decline brought prices to support at 0.6902, where a corrective recovery began. Today, 9 October 2026, the main scenario envisages the completion of the local correction and the resumption of the downward move.
The initial target is 0.6902. A decisive breakout below this level would open the way for a further decline towards 0.6845 and then 0.6810. These levels correspond to the continuation of the downward impulse within the current Elliott wave structure.
The downward wave matrix, with its pivot centre at 0.7049, defines the key resistance area. As long as the price stays below this level, the medium-term technical outlook remains bearish. The nearest resistance lies around 0.6997, while intermediate support is at 0.6964.
The descending channel remains in place on the four-hour chart. The corrective movement of recent sessions did not produce a sustained breakout above its upper boundary. The lower boundary of the price Envelope lies around 0.6810, forming a longer-term downside target.
An alternative scenario suggests consolidation above 0.6997 followed by a test of 0.7025. However, such a move is still viewed primarily as corrective. Selling remains the priority, targeting new local lows.
AUDUSD forecast scenario
Trading scenario: SELL
- Price at the time of writing: 0.6980
- Entry price: 0.6975
- Stop loss: 0.7015
- Take profit: 0.6902
- Risk-to-reward ratio: 1:1.83
The trade idea is valid until 8:00 on 10 October 2026 (server time, UTC+3).
USDCAD forecast
The Canadian dollar continues to be influenced by oil market movements, US monetary policy, and the outlook for economic growth in North America. The main factor in recent trading sessions has been the rise in global oil prices amid geopolitical tensions in the Middle East. Higher energy prices could support Canada's export revenues and create conditions for its currency to strengthen.
Bank of Canada policy is another influence. The central bank is assessing inflation persistence, domestic demand, and the consequences of changes in borrowing costs. Higher oil prices could improve the country's trade performance but also intensify inflationary pressure and increase business costs. This combination of factors makes the central bank's future decisions harder to predict.
The Federal Reserve remains cautious about the outlook for interest rates. Recent statements by Fed officials suggest that further monetary tightening is possible if inflation remains persistent. The US labour market is also showing relative stability, supporting the attractiveness of dollar-denominated assets.
Two opposing forces are crucial for USDCAD. On the one hand, high US interest rates support the dollar. On the other hand, rising oil prices could strengthen the Canadian currency and limit the pair's upward movement.
Market participants are also assessing prospects for industrial production, consumer demand, and trade relations between the US and Canada. Amid heightened uncertainty, short-term moves may be accompanied by sizeable corrections.
The fundamental picture allows for a temporary strengthening of the Canadian dollar, although restrictive financial conditions in the US continue to support USDCAD's medium-term upside potential.
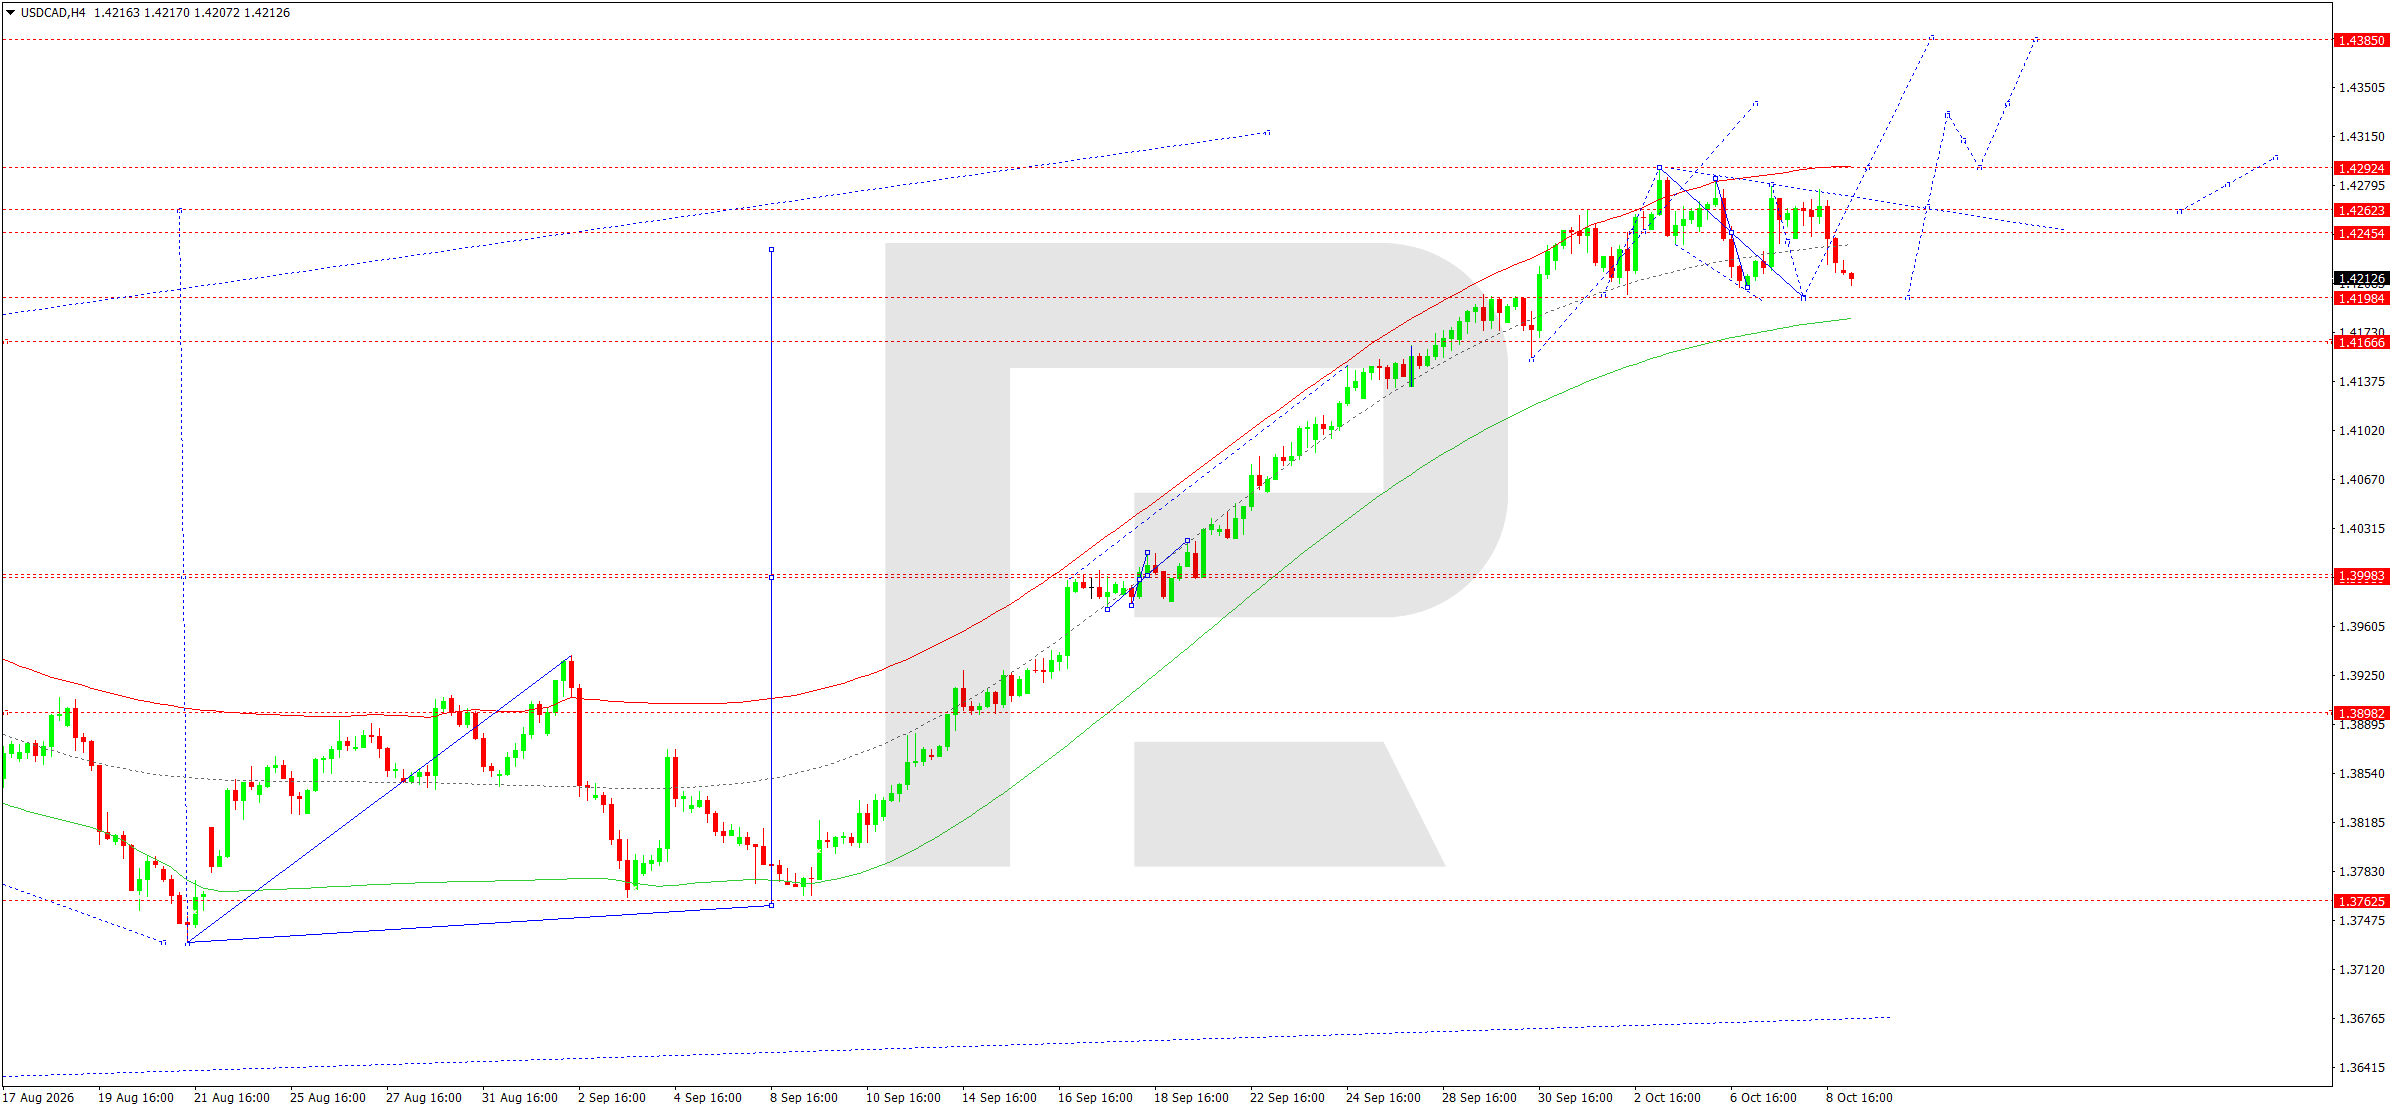
On the H4 chart, USDCAD completed a pronounced upward wave by reaching the 1.4278 area before entering a corrective decline. Today, 9 October 2026, the local correction is expected to extend towards support at 1.4198. If this level holds, a new upward impulse could develop, targeting a retest of 1.4295.
The Elliott wave structure reflects the completion of another impulse leg and the market's transition into an intermediate corrective phase. The upward wave matrix, with its pivot centre at 1.4000, remains the main support area. As long as prices hold above this level, the medium-term uptrend remains intact.
A local range between support at 1.4198 and resistance at 1.4292 has formed on the four-hour chart. The upper boundary of the price Envelope lies near 1.4280, while its centre line is around 1.4198. A return to the centre line is viewed as a technically natural correction following the previous rise.
A breakout below support at 1.4198 would create a risk of a deeper decline towards 1.4167. However, if a reversal structure forms in this area, a recovery towards 1.4295 could follow, with the prospect of reaching 1.4340 and 1.4385.
An alternative scenario suggests an immediate recovery above 1.4245 followed by a breakout above 1.4292.
The main medium-term priority remains buying after the correction is complete, although the intraday move may extend lower.
USDCAD forecast scenario
Trading scenario: SELL
- Price at the time of writing: 1.4219
- Entry price: 1.4214
- Stop loss: 1.4254
- Take profit: 1.4167
- Risk-to-reward ratio: 1:1.18
The trade idea is valid until 8:00 on 10 October 2026 (server time, UTC+3).
XAUUSD forecast
Gold continues to trade under the conflicting influence of monetary and geopolitical factors. On the one hand, heightened tensions in the Middle East support investor interest in safe-haven assets. On the other hand, high US government bond yields and the relatively strong dollar limit the appeal of the non-interest-bearing precious metal.
Market participants are primarily focused on the US Federal Reserve's monetary policy. The minutes of its latest meeting confirmed the regulator's concerns about inflation risks. Fed officials have left open the possibility of further interest rate increases if consumer prices continue to rise steadily. These expectations weigh on gold by increasing the opportunity cost of holding the metal.
Rising oil prices remain a significant factor. Higher energy costs fuel concerns about another acceleration in inflation while increasing the likelihood of restrictive financial conditions remaining in place. For gold, this creates a mixed fundamental picture: inflation risks support safe-haven demand, but rising real bond yields limit the upside potential.
US bond yields have fluctuated significantly in recent trading sessions. A decline in the yield on 10-year Treasuries following a long-term government debt auction temporarily improved conditions for a gold recovery. However, there has yet to be a sustained shift in expectations for Fed policy.
Long-term gold purchases by central banks and investor interest in diversifying reserves provide additional market support. Nevertheless, XAUUSD remains sensitive to movements in the dollar and US interest rates in the short term. A further corrective decline remains possible in the next session.
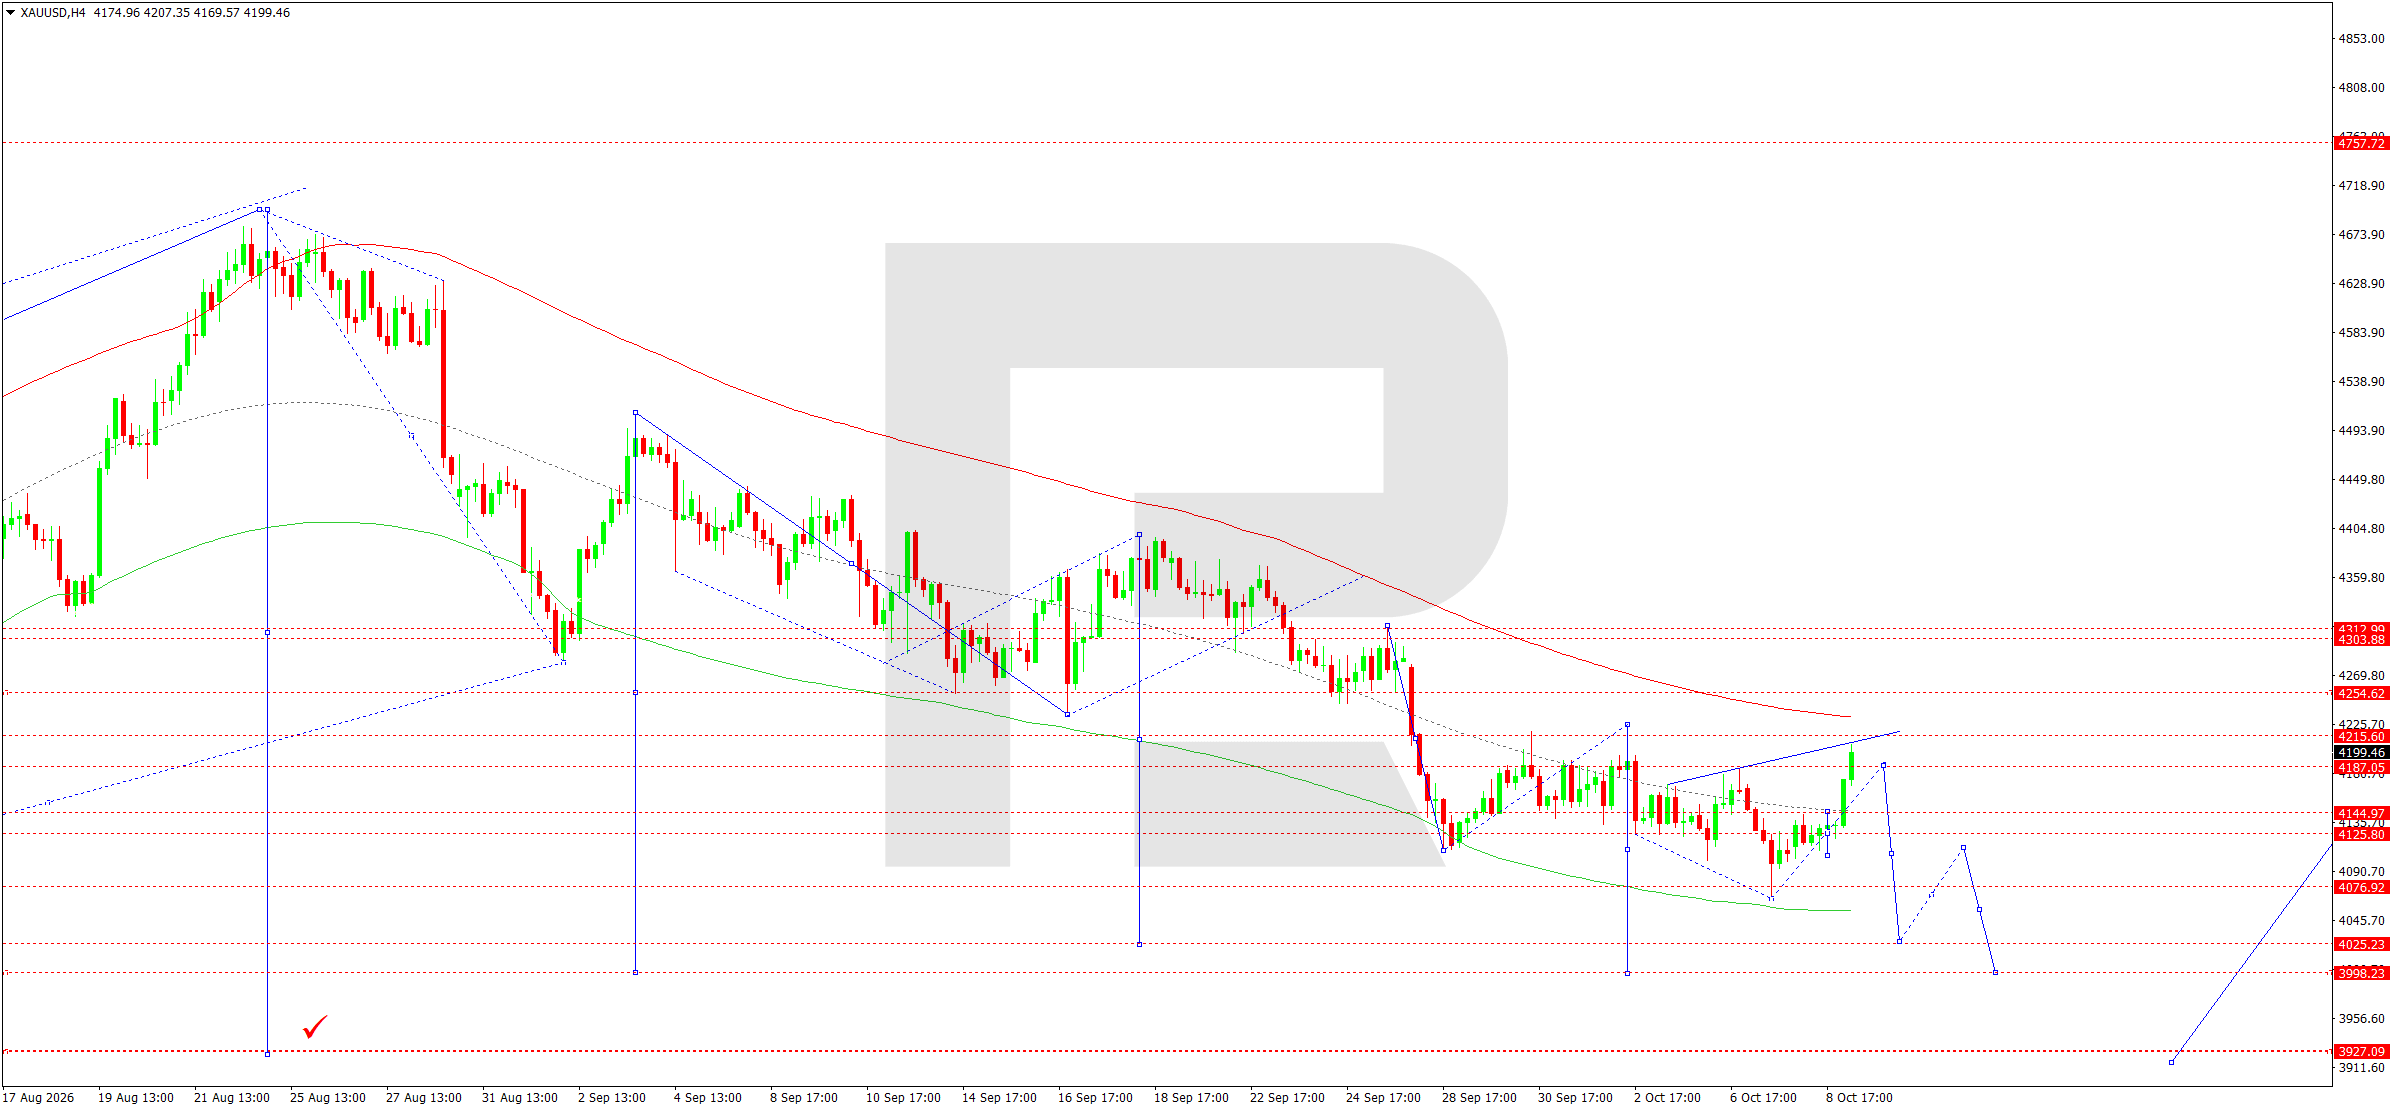
On the H4 chart, XAUUSD staged a corrective recovery towards 4,207 following its previous decline. The subsequent move brought prices to support at 4,190. Today, 9 October 2026, the market is expected to form a narrow consolidation range near this level before resuming the downward wave.
The main technical reference point is support at 4,145. A breakout below it would open the way for a further decline towards 4,126 and then 4,077. A continuation of the impulse would target the 4,025 area, with a potential test of the psychological 4,000 level.
The Elliott wave structure indicates that the downtrend remains intact following the completion of the corrective phase.
The wave matrix, with its pivot centre at 4,215, defines the main resistance area. As long as prices remain below this level, sellers retain the technical advantage.
The descending channel remains in place on the four-hour chart, while the red line of the price Envelope limits recovery from above. The lower Envelope boundary lies around 4,027–4,000 and corresponds to the main longer-term target.
An alternative scenario suggests a sustained move above 4,215 followed by a recovery towards 4,255. However, this would require a confirmed resistance breakout and a change in the short-term wave structure. Until such signals appear, selling on corrective rallies remains preferable.
XAUUSD forecast scenario
Trading scenario: SELL
- Price at the time of writing: 4,190
- Entry price: 4,185
- Stop loss: 4,235
- Take profit: 4,025
- Risk-to-reward ratio: 1:3.20
The trade idea is valid until 8:00 on 10 October 2026 (server time, UTC+3).
US 500 forecast
The US stock market remains highly volatile amid rising energy costs, changing government bond yields, and revised expectations for the Federal Reserve's monetary policy. The main uncertainty is the possibility of interest rates remaining high in an environment of persistent inflationary pressure.
At the close of trading on 8 October, the S&P 500 fell by approximately 0.5%, while the technology-heavy Nasdaq lost around 1.3%. Technology share sales and concerns about the sustainability of corporate earnings weighed on the market. Meanwhile, the industrial Dow Jones posted a slight gain, indicating mixed market sentiment.
The oil market presents another source of risk. Brent prices rising above 100 USD per barrel have heightened concerns about production costs and consumer inflation. Geopolitical tensions in the Middle East continue to create uncertainty over the stability of energy supplies.
Meanwhile, the yield on 10-year US Treasury bonds has fluctuated sharply. After rising towards 5.35%, yields declined, partially supporting interest in equities. This trend is particularly important for the stock market because borrowing costs directly affect valuations of future corporate earnings.
The US labour market remains relatively resilient. Recent jobless claims data do not indicate a sharp deterioration in economic activity. This supports expectations for continued economic growth while limiting the likelihood of rapid Fed policy easing.
In the short term, the market retains the potential for a technical recovery following the correction. However, the sustainability of an upward move will depend on stabilising bond yields and easing geopolitical tensions.
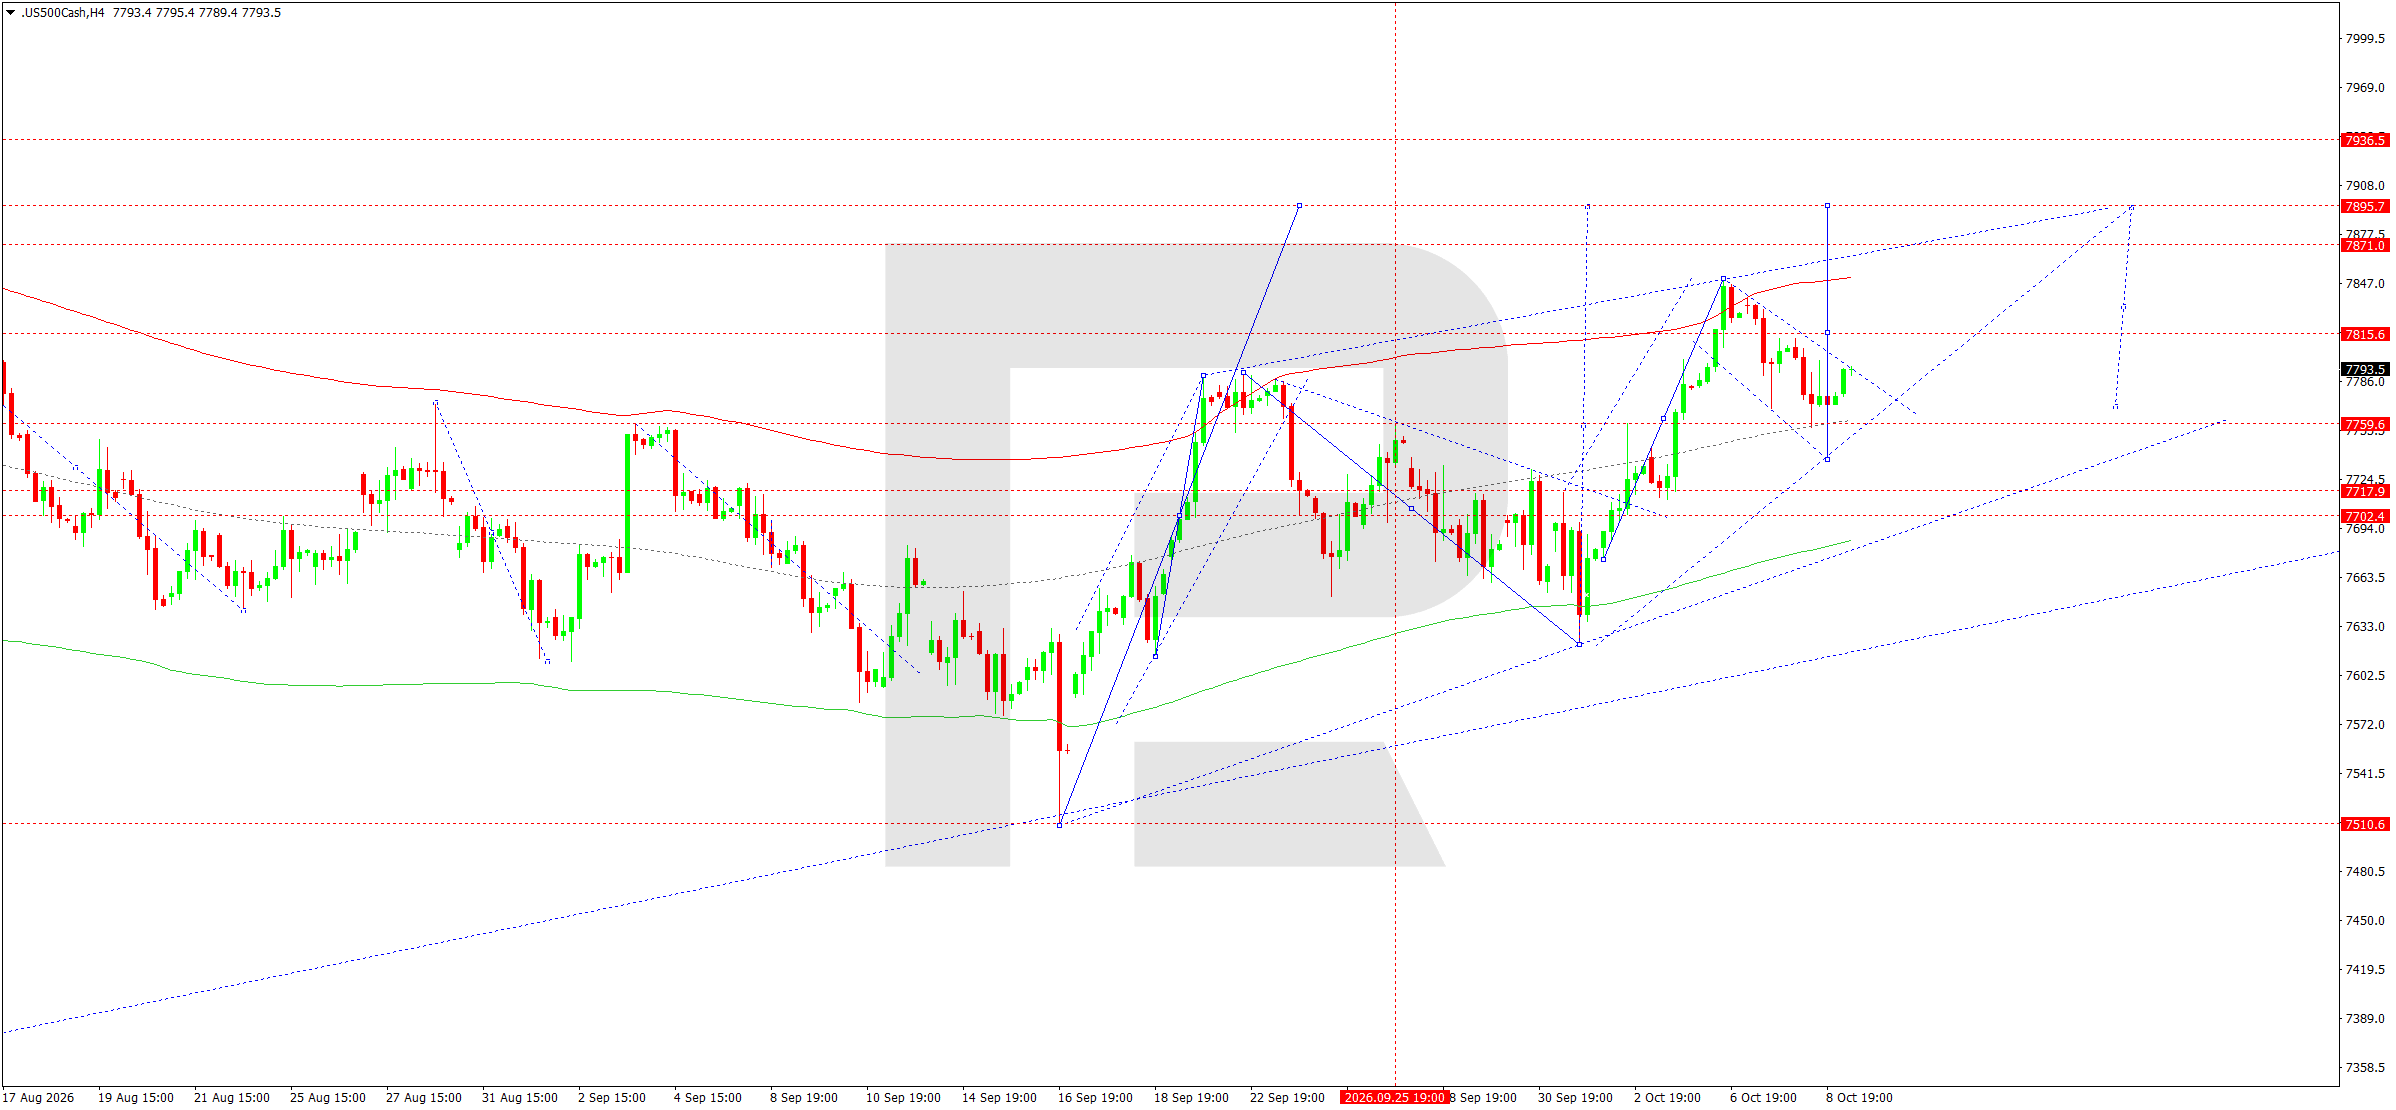
On the H4 chart, US 500 completed a corrective wave with a decline towards 7,739, before recovering to resistance at 7,790. Today, 9 October 2026, a narrow consolidation range is expected to form below this level. A breakout above resistance at 7,790 would create conditions for a further rise towards 7,815.
The Elliott wave structure allows for a new impulse wave following the completion of the correction. The upward wave matrix, with its pivot centre at 7,717, defines a key support area. As long as the price remains above it, the technical picture remains predominantly favourable for buyers.
The ascending channel remains intact on the four-hour chart. The market previously advanced to the upper boundary of the price Envelope near 7,885 before correcting towards its centre line around 7,740. Holding this support would lay the groundwork for another recovery.
The nearest upside targets are 7,815 and 7,871. A breakout above the latter resistance would open the way for further growth towards 7,895. Intermediate corrections may involve a retest of 7,759.
An alternative scenario suggests a sustained move below 7,739. In this case, a decline towards 7,717 and then 7,702 would become likely. However, as long as the Envelope centre line holds, the bullish scenario remains the priority, with expectations of new local highs.
US 500 forecast scenario
Trading scenario: BUY
- Price at the time of writing: 7,795
- Entry price: 7,800
- Stop loss: 7,750
- Take profit: 7,895
- Risk-to-reward ratio: 1:1.90
The trade idea is valid until 8:00 on 10 October 2026 (server time, UTC+3).
BTCUSD forecast
The cryptocurrency market remains highly sensitive to changes in global liquidity, movements in the US dollar, and interest rate expectations. The main factor weighing on Bitcoin is the Federal Reserve's relatively restrictive monetary policy. Persistently high government bond yields reduce the appeal of risk assets and raise investors' required returns on cryptocurrencies.
In early October, Bitcoin underwent a corrective decline after attempts to consolidate near local highs. Selling coincided with deteriorating sentiment in the US stock market, particularly in the technology sector. This correlation reflects cryptocurrencies' continued dependence on overall investor risk appetite.
Geopolitical tensions in the Middle East are another influence. Rising oil prices strengthen inflation expectations and could increase the likelihood of restrictive financial conditions remaining in place. This creates a mixed picture for Bitcoin. On the one hand, digital assets may be viewed as a means of diversifying capital. On the other hand, investors often reduce exposure to the most volatile instruments during periods of shrinking liquidity.
Capital flows into exchange-traded cryptocurrency funds, institutional activity, and changes in futures market open interest remain important. Increased demand from long-term investors could limit the depth of the correction, while deleveraging may intensify short-term price fluctuations.
In the next trading session, key factors will be the direction of US bond yields, the resilience of stock indices, and dollar liquidity conditions. A stabilisation in the external backdrop could allow Bitcoin to recover from its previous decline, although risks of a retest of local lows remain.
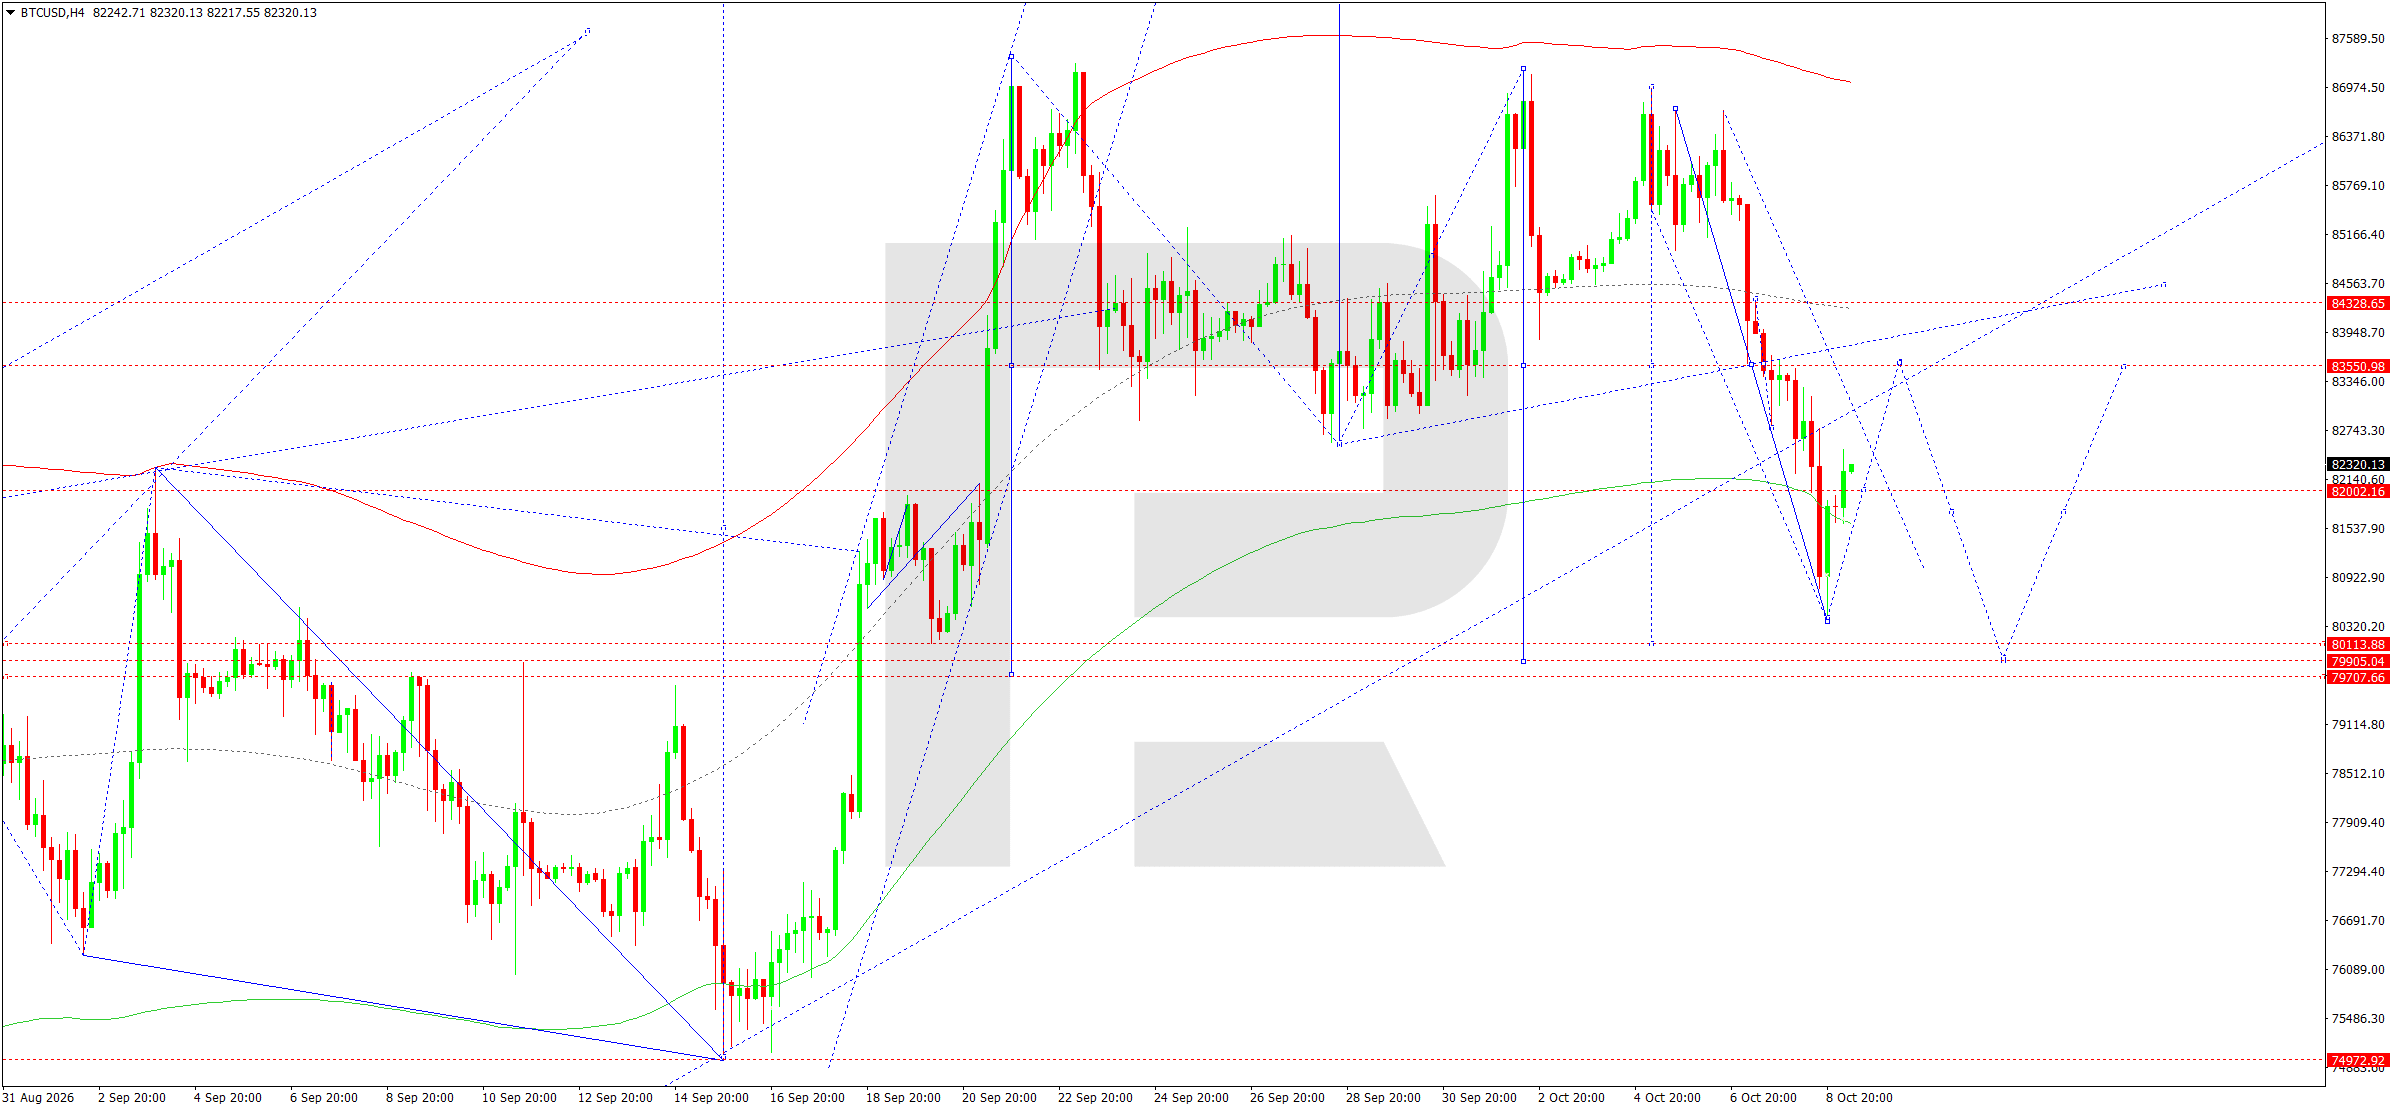
On the H4 chart, BTCUSD formed a downward corrective structure, reaching the 80,433 area. After testing this support, the market began to recover, creating conditions for another upward leg. Today, 9 October 2026, a further rise towards resistance at 83,551 is possible.
The Elliott wave structure allows for the completion of the local correction and the beginning of a new impulse. The upward wave matrix, with its pivot centre at 85,323, defines an important resistance area. A breakout above it would confirm an improvement in the medium-term technical picture.
On the four-hour chart, the local bearish structure continues to conflict with the broader bullish configuration. The lower boundary of the price Envelope lies near 80,433. Holding this area would allow the current correction to be viewed as an intermediate stage of recovery.
The initial target is 83,551. After testing this level, another decline towards 79,892 is possible. Holding that support level would create conditions for the next upward impulse towards 85,323 and then 88,065.
An alternative scenario suggests a breakout below 79,892. This would increase the probability of a deeper correction towards 79,095 and 79,076. As long as the price holds above the 80,433 area, buying remains preferable, targeting a recovery towards the nearest resistance.
BTCUSD forecast scenario
Trading scenario: BUY
- Price at the time of writing: 82,575
- Entry price: 82,580
- Stop loss: 80,380
- Take profit: 88,065
- Risk-to-reward ratio: 1:2.49
The trade idea is valid until 8:00 on 10 October 2026 (server time, UTC+3).
Editors’ picks
 EURUSD forecast 2026–2027: technical analysis, price levels & predictions
The EURUSD outlook for 2026 and 2027: key levels on the daily chart, three trading scenarios and the policy gap between the Fed and the ECB that drives the pair.
 Gold (XAUUSD) forecast 2026: technical analysis, price levels & predictions
Where gold could trade in 2026: key levels, three trading scenarios with entry triggers and the forecasts from J.P. Morgan, Deutsche Bank and Goldman Sachs.
Forecasts presented in this section only reflect the author’s private opinion and should not be considered as guidance for trading. RoboForex bears no responsibility for trading results based on trading recommendations described in these analytical reviews.