
Daily technical analysis and forecast for 12 October 2026
Daily technical analysis and forecast for EURUSD, USDJPY, GBPUSD, AUDUSD, USDCAD, XAUUSD, US 500, and BTCUSD for 12 October 2026.
Each scenario on this page reflects the market structure on the H4 chart as of 10:00 UTC+3 on 12 October 2026. The assessment considers the current H4 chart structure, key support and resistance levels, the direction of the medium-term movement, and the prevailing fundamental backdrop.
EURUSD forecast
At the start of the trading week, EURUSD movements are determined by the balance of interest rate expectations in the US and eurozone. Key factors for the euro remain the economic growth outlook, persistent consumer inflation, and future decisions by the European Central Bank. Slowing business activity could limit the euro's recovery by increasing the likelihood of accommodative monetary conditions remaining in place.
The US dollar continues to depend on expectations for Federal Reserve policy. Changes in Treasury yields, assessments of inflation risks, and labour market prospects directly affect the attractiveness of the US currency. Rising US government bond yields could support the dollar and increase pressure on EURUSD.
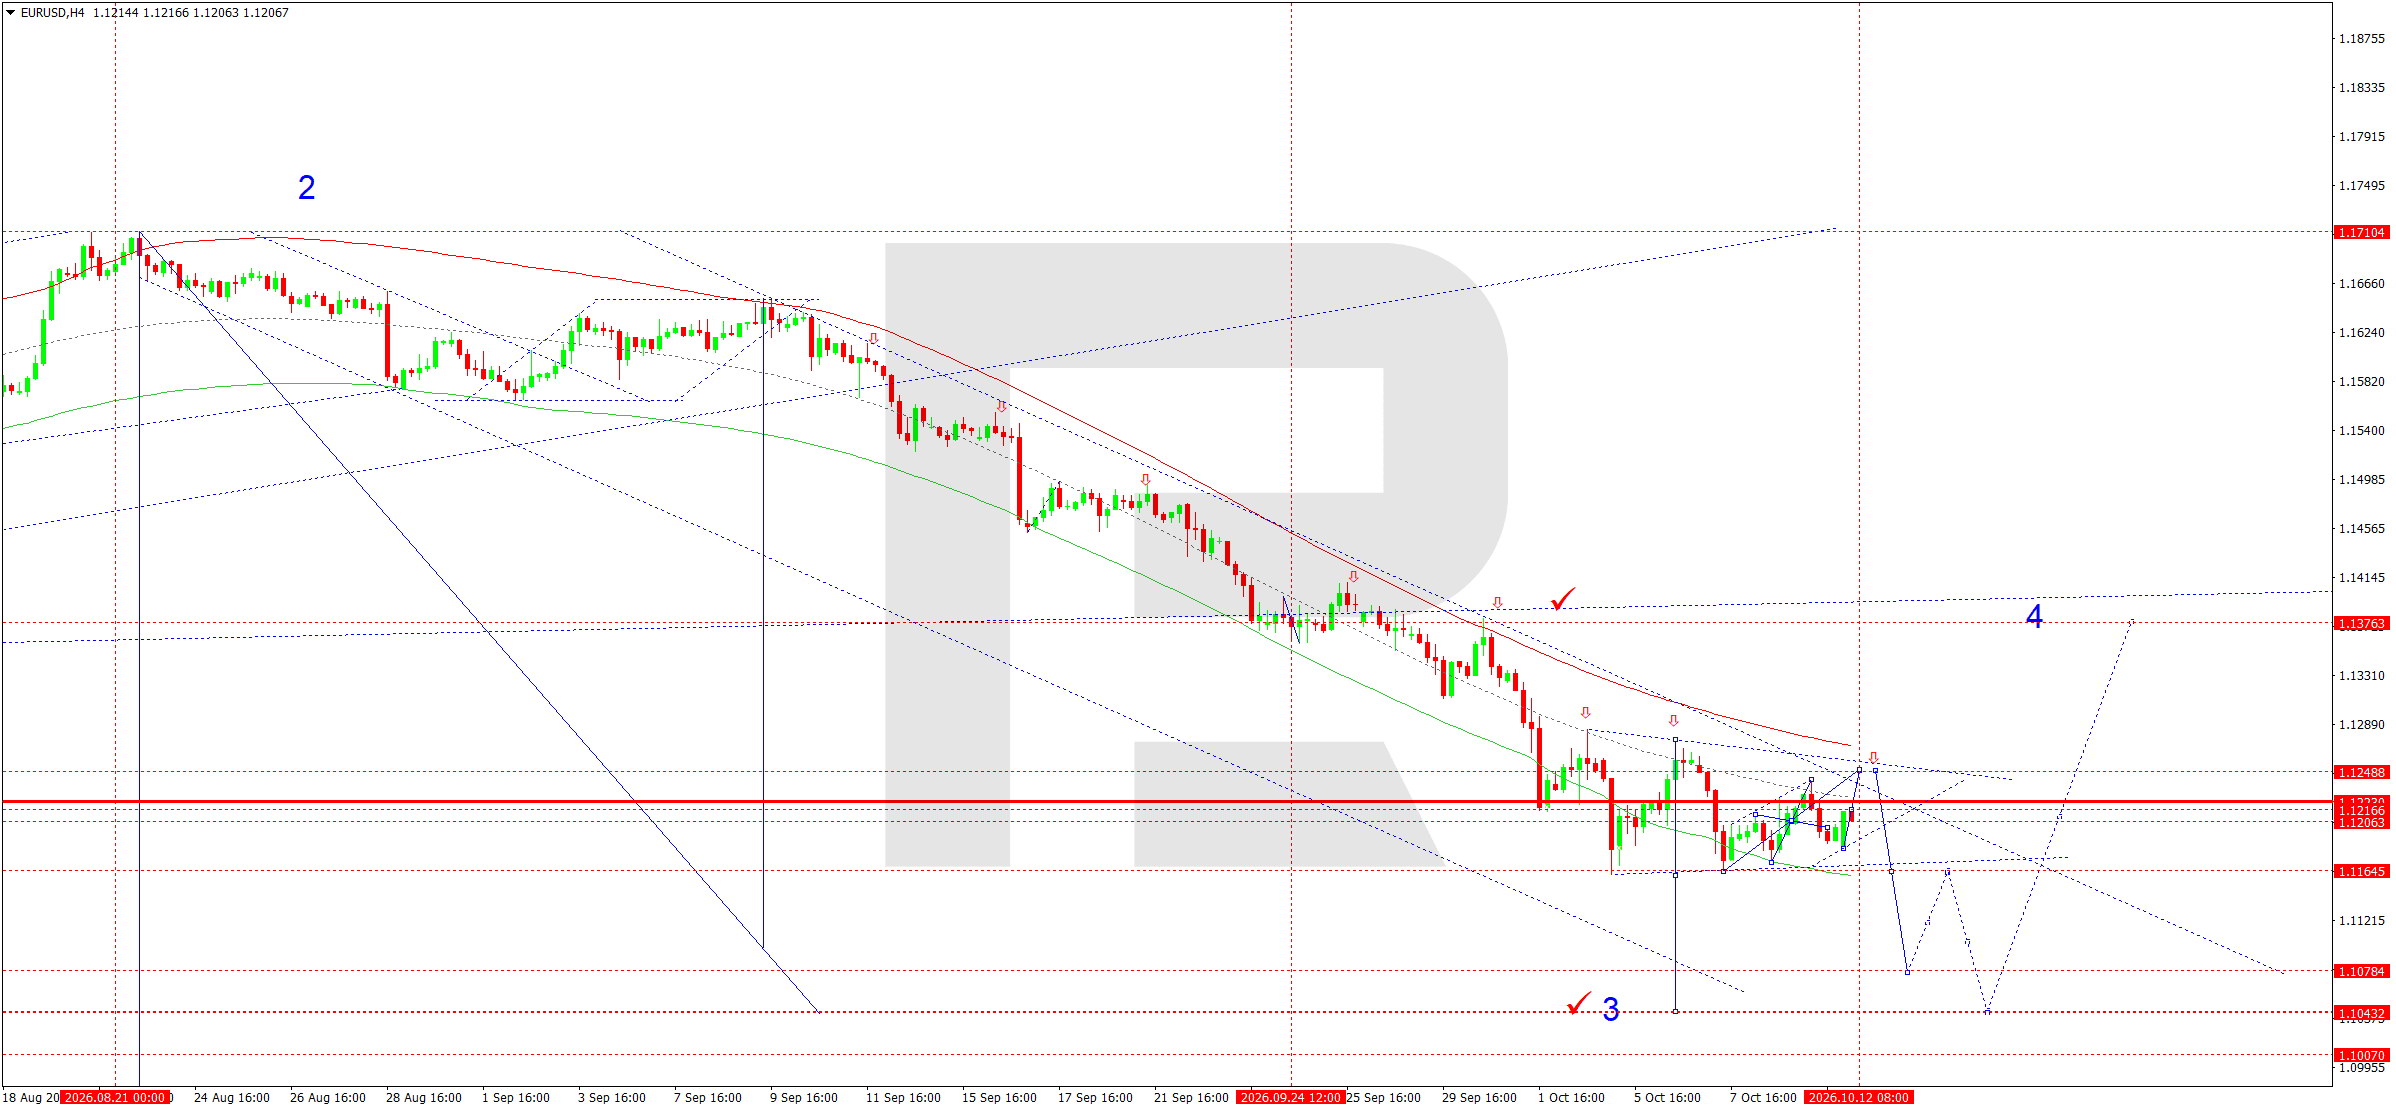
On the H4 chart, EURUSD maintains a downward structure. After falling to 1.1183, the market staged a corrective rise towards 1.1216. Today, consolidation around 1.1207 is expected, with a possible retest of resistance at 1.1222.
A breakout above this level would allow the correction to extend towards 1.1248. However, as long as the price remains within the descending channel, sellers hold the upper hand. A subsequent decline would target 1.1164, with a breakout below this level opening the way towards 1.1111. The longer-term target remains 1.1050.
The downward wave matrix places its pivot centre at 1.1222. This level is a key reference point for assessing the next direction. The Price Envelope limits the correction's potential, with its upper boundary at 1.1244, while the lower boundary passes through 1.1161.
Consolidation below 1.1190 would increase the likelihood of continued downward momentum. The main scenario suggests the completion of the local correction and renewed selling.
EURUSD forecast scenario
Trading scenario: SELL
- Price at the time of writing: 1.1206
- Entry price: 1.1201
- Stop loss: 1.1249
- Take profit: 1.1111
- Risk-to-reward ratio: 1:1.88
The trade idea is valid until 8:00 AM on 13 October 2026 (server time, UTC+3).
USDJPY forecast
The fundamental backdrop for USDJPY is shaped by the persistent yield differential between US and Japanese government bonds. The US dollar is supported by relatively high interest rates and cautious expectations for further Fed decisions. The upcoming release of US inflation data could substantially change short-term currency market movements.
For the Japanese yen, the Bank of Japan's policy remains a crucial factor. Market participants are assessing the outlook for monetary policy normalisation, persistent domestic inflation, and wage trends. Possible policy tightening by the BoJ could limit further dollar strength.
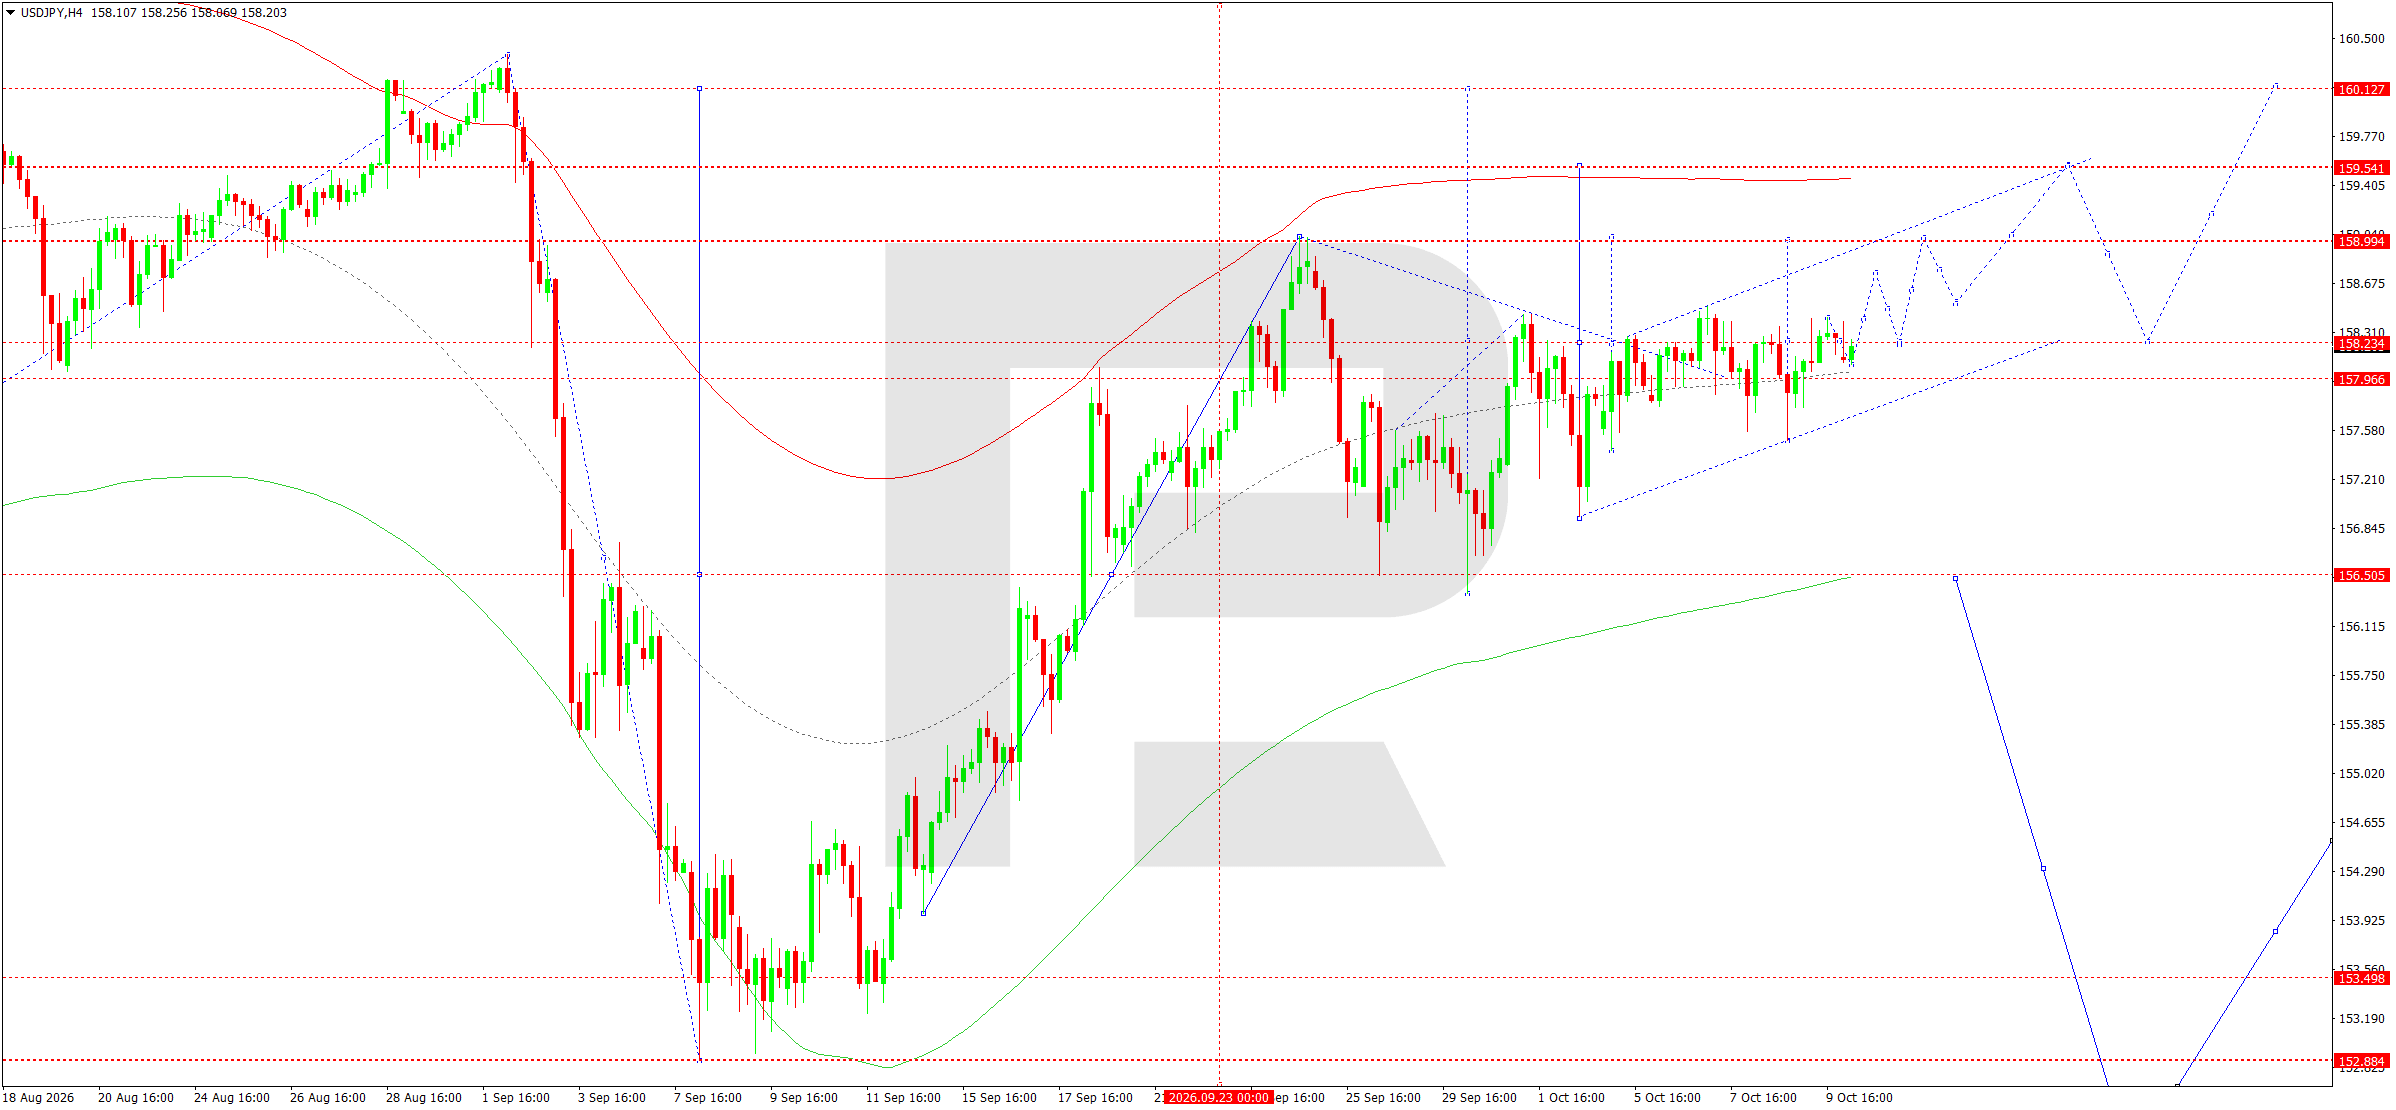
On the H4 chart, USDJPY has formed an upward structure following its recovery from September lows. The market broke above the 158.23 resistance level and continues to develop an upward wave, with the main near-term target at 158.99.
Today, 12 October, consolidation above 158.23 is expected, followed by a continued upward move. Consolidation above 158.99 would create conditions for reaching 159.50. If positive momentum persists, the next target could be 160.13.
The upward wave matrix places its pivot centre at 158.23. This level remains key support for the current structure. The Price Envelope suggests a move towards its upper boundary at 159.50, while its central area lies near 158.00.
A fall below 158.00 would signal easing buying pressure and open the way for a correction towards 157.97 and 156.50.
The Elliott wave structure suggests continued upward momentum following local consolidation. As long as the price holds above the matrix centre, buyers retain the advantage. Growth towards the nearest resistance levels remains the preferred scenario.
USDJPY forecast scenario
Trading scenario: BUY
- Price at the time of writing: 158.33
- Entry price: 158.38
- Stop loss: 157.95
- Take profit: 159.50
- Risk-to-reward ratio: 1:2.60
The trade idea is valid until 8:00 AM on 13 October 2026 (server time, UTC+3).
GBPUSD forecast
The British pound is starting the trading week amid changing interest rate expectations and continued uncertainty over the UK economic outlook. Inflationary pressure, consumer demand, wage trends, and the resilience of business activity remain important for the currency market.
The Bank of England's monetary policy continues to determine the pound’s medium-term outlook. Persistently elevated inflation limits the scope for easing interest rate conditions, although weak economic growth could increase pressure on the British currency. Investors are closely assessing the balance between the need to contain prices and the risks of an economic slowdown.
The US dollar is supported by high US government bond yields. The upcoming release of US inflation data is making market participants more cautious. More persistent inflationary pressure could strengthen the dollar against the pound.
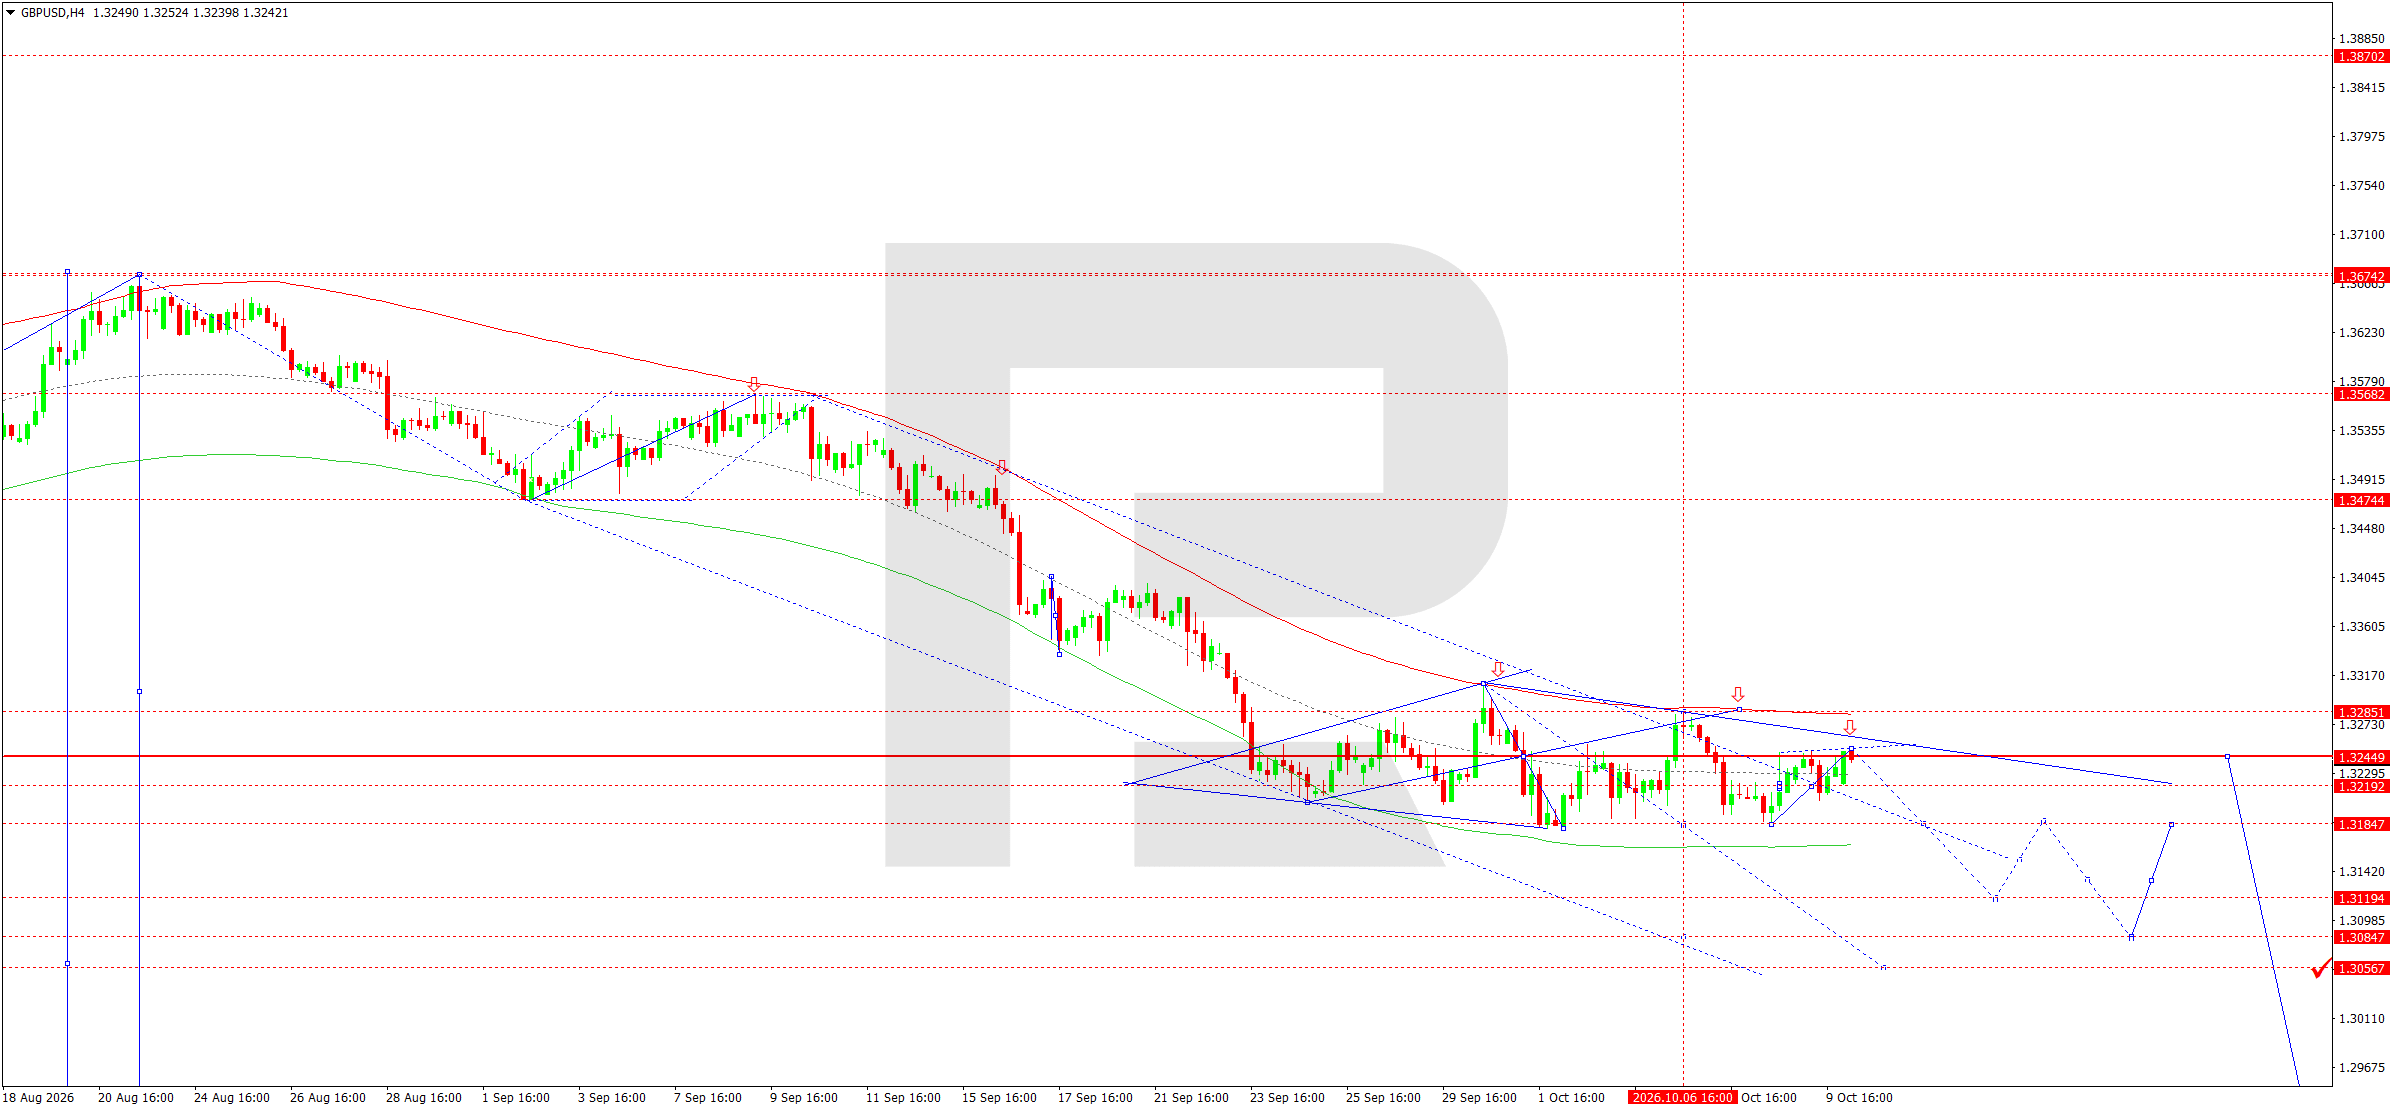
On the H4 chart, GBPUSD remains in a downtrend. After reaching a local low at 1.3188, the market formed a corrective wave towards 1.3249, where it encountered resistance from the descending structure.
Today, a renewed decline is expected, initially targeting 1.3181. A breakout below this level would open the way towards 1.3119 and then 1.3061.
The downward wave matrix places its pivot centre at 1.3249. As long as prices stay below this level, sellers retain the advantage. The Elliott wave structure suggests the corrective move may be coming to an end and another downward impulse may be forming.
The Price Envelope defines the nearest downside support at 1.3181 and its lower boundary near 1.3088. The longer-term target is 1.3055.
A recovery above 1.3285 would weaken the current scenario and create conditions for a deeper correction. Selling remains the main preference for today's session.
GBPUSD forecast scenario
Trading scenario: SELL
- Price at the time of writing: 1.3245
- Entry price: 1.3240
- Stop loss: 1.3286
- Take profit: 1.3119
- Risk-to-reward ratio: 1:2.63
The trade idea is valid until 8:00 AM on 13 October 2026 (server time, UTC+3).
AUDUSD forecast
Australian dollar movements reflect a combination of domestic monetary policy, the outlook for China's economy, and overall investor appetite for risk assets. Chinese industrial production figures are particularly important for Australia, as Chinese demand has a significant impact on its commodity exports.
The Reserve Bank of Australia continues to consider inflation risks, employment conditions, and consumer activity when setting interest rate policy. Persistent inflation could limit the scope for rate cuts, while slowing economic activity poses additional risks to the national currency.
On the US side, the main factor remains expectations for future Fed decisions. High US government bond yields support the dollar and limit a recovery in AUDUSD. The upcoming release of US inflation data could increase volatility in the pair.
Commodity market conditions are also significant. Fluctuations in iron ore, copper, and energy prices affect Australia's export outlook. When geopolitical tensions intensify, investors typically reduce positions in risk-sensitive currencies.
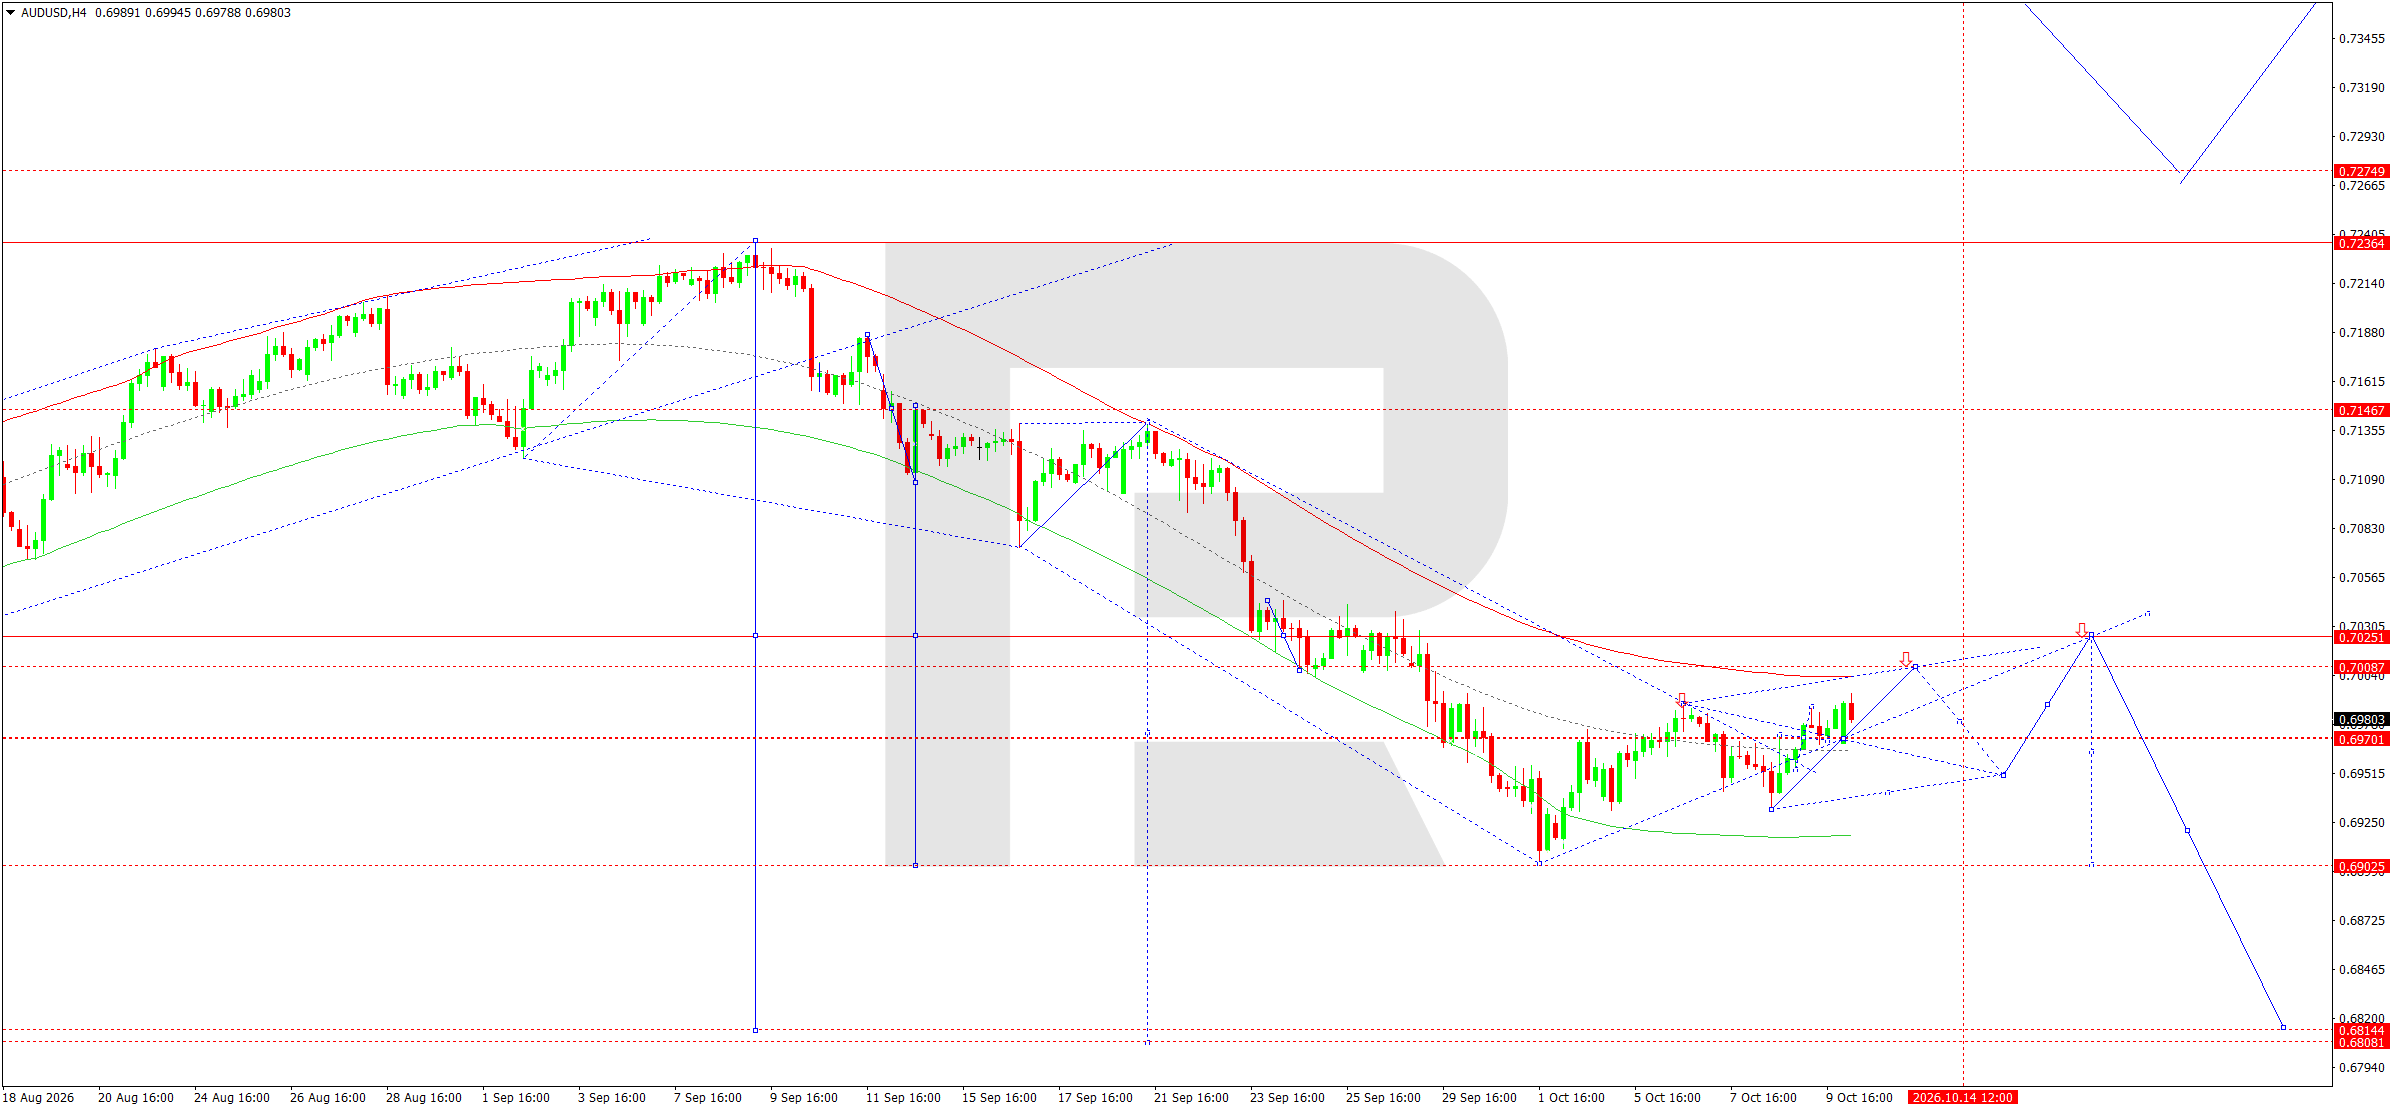
On the H4 chart, AUDUSD continues to develop a downward wave structure. After reaching a low at 0.6925, the market began a corrective recovery and is consolidating around 0.6970.
Today, the correction is expected to continue towards 0.7007. This area coincides with resistance from the descending channel and the upper boundary of the Price Envelope.
The downward wave matrix places its pivot centre at 0.7025. As long as prices remain below this level, the main direction is downward.
Once the correction is complete, a move towards 0.6950 is expected. A breakout below the support level would create conditions for a retest of the 0.6903 level and a subsequent decline towards 0.6810.
The Elliott wave structure indicates that another downward momentum is likely to form after the corrective move. A breakout above 0.7025 would invalidate the near-term bearish scenario and increase the likelihood of a more prolonged recovery.
The preferred option remains to sell in anticipation of a resumption of the main downtrend.
AUDUSD forecast scenario
Trading scenario: SELL
- Price at the time of writing: 0.6981
- Entry price: 0.6976
- Stop loss: 0.7026
- Take profit: 0.6903
- Risk-to-reward ratio: 1:1.46
The trade idea is valid until 8:00 AM on 13 October 2026 (server time, UTC+3).
USDCAD forecast
The Canadian dollar is starting the trading week under the influence of oil prices, interest rate expectations, and the state of the US economy. The energy market remains Canada's most important external factor, as oil exports account for a significant share of the country's foreign trade receipts.
In early October, the oil market continues to experience heightened volatility amid geopolitical tensions in the Middle East. Falling oil prices could limit Canadian dollar strength, while a recovery in energy prices would create conditions for supporting the currency.
Bank of Canada monetary policy is shaped by the inflation outlook, domestic demand, and employment. Housing market conditions and the resilience of consumer spending are also significant factors. Slowing economic activity could increase expectations for a more accommodative interest rate policy.
The US dollar is supported by relatively high US government bond yields. Market participants are awaiting US inflation data, which could alter expectations for further Fed action.
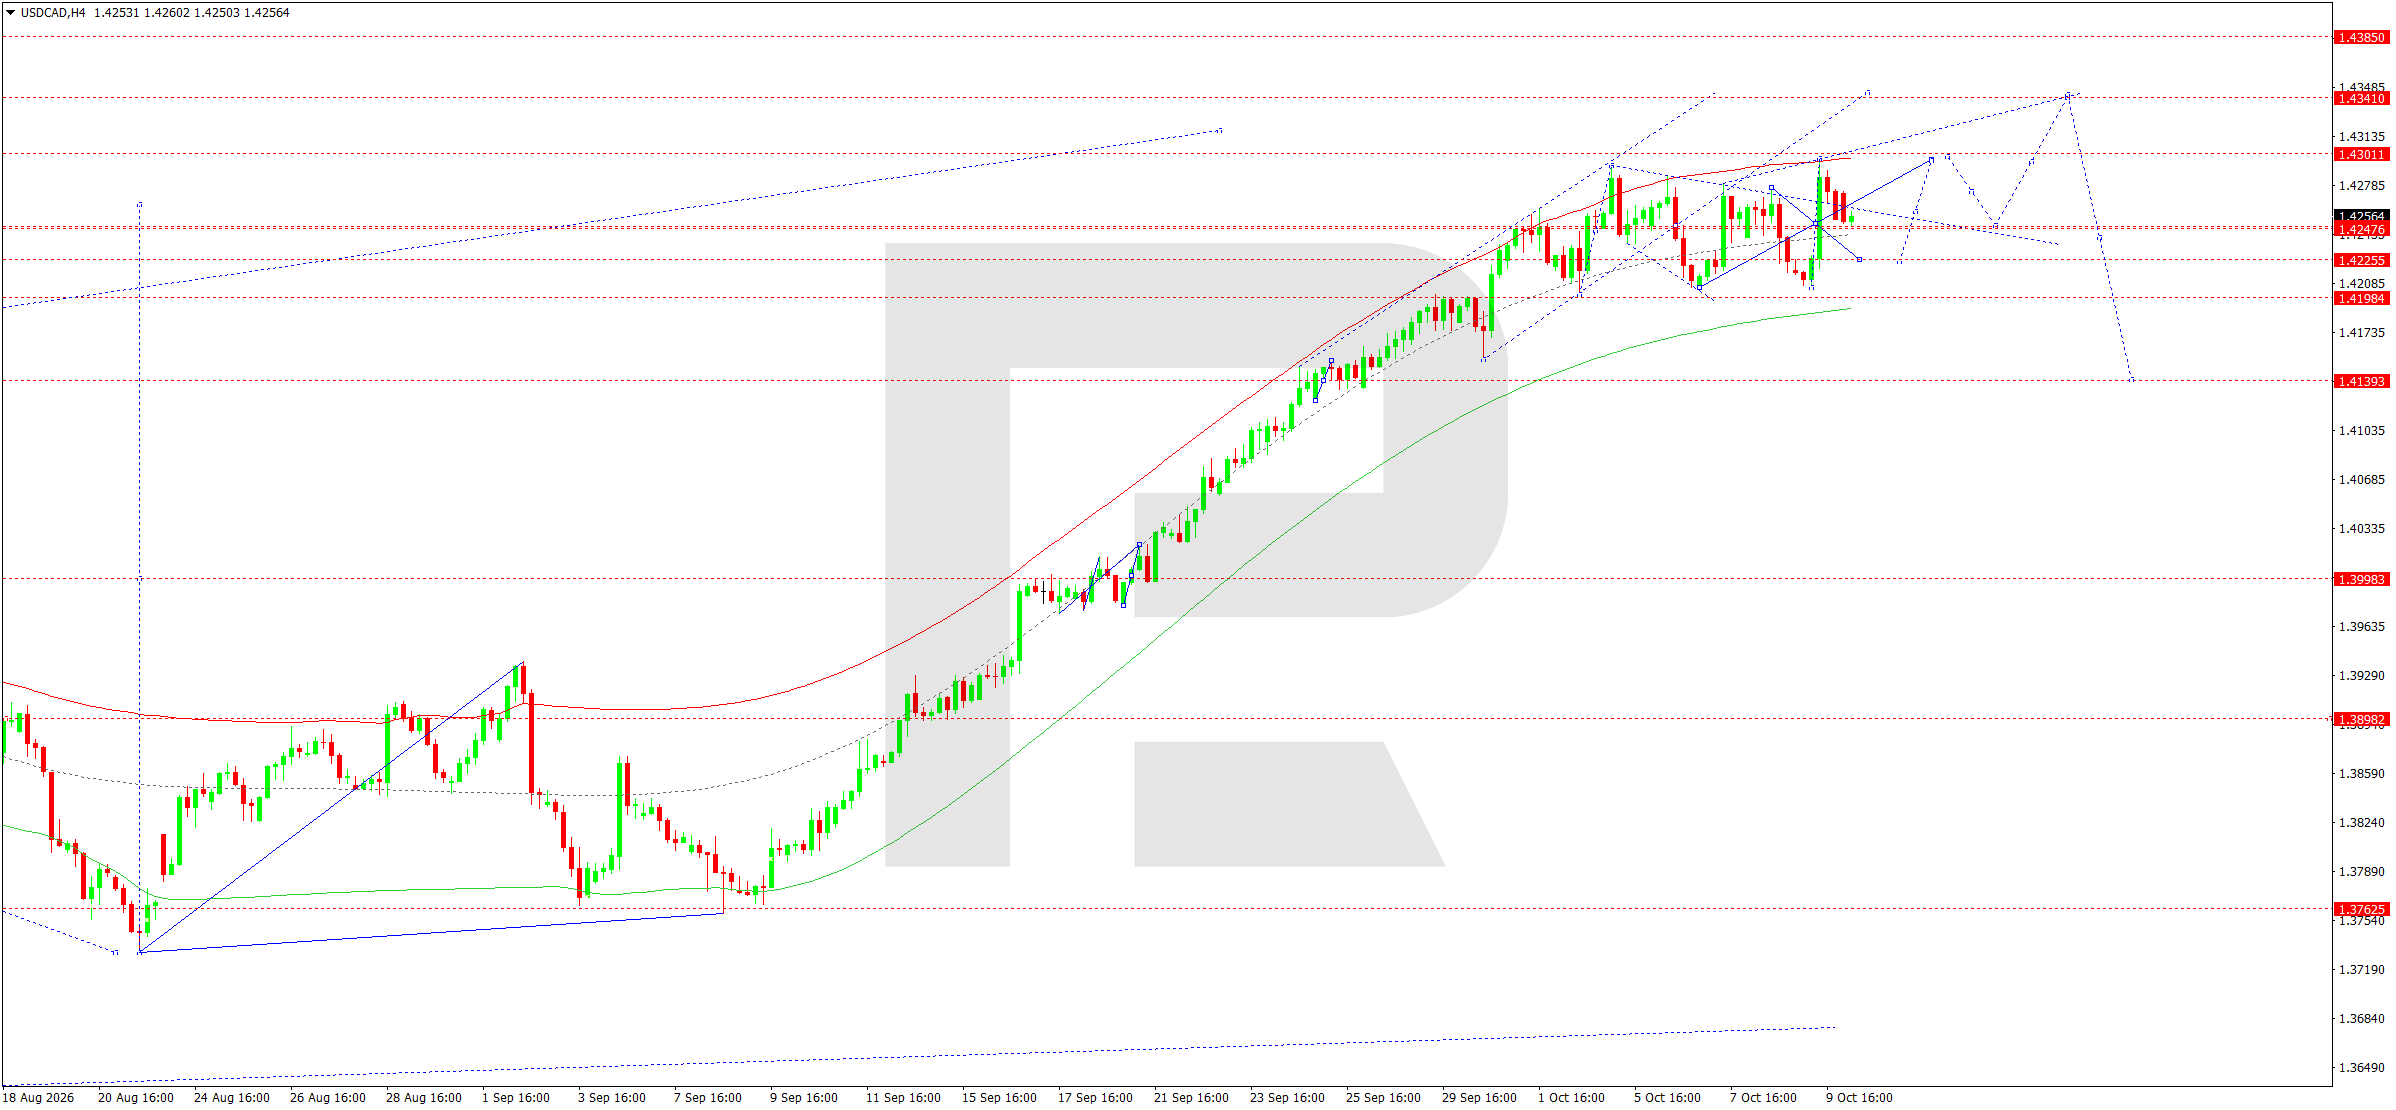
On the H4 chart, USDCAD maintains an upward structure. After reaching the 1.4295 resistance level, the market corrected towards 1.4251 and is forming a narrow consolidation range.
Today, sideways trading is expected, with a possible decline towards 1.4222. This level is considered the nearest support and a potential area for the correction to end.
The upward wave matrix places its pivot centre at 1.4141. As long as prices remain above it, the main trend is upward.
The Price Envelope limits the corrective move at its centre line at 1.4222, while its upper boundary lies near 1.4300. Following the correction, further growth towards 1.4301 and 1.4340 is expected.
The Elliott wave structure suggests another upward impulse following local consolidation. A breakout below 1.4198 would weaken the current scenario.
Buying in anticipation of a renewed upward movement remains the preferred strategy.
USDCAD forecast scenario
Trading scenario: BUY
- Price at the time of writing: 1.4240
- Entry price: 1.4245
- Stop loss: 1.4197
- Take profit: 1.4340
- Risk-to-reward ratio: 1:1.98
The trade idea is valid until 8:00 AM on 13 October 2026 (server time, UTC+3).
XAUUSD forecast
Gold is starting the trading week amid persistent geopolitical uncertainty and heightened sensitivity to US interest rates. The main factors remain the dollar's performance, US government bond yields, and expectations for further Fed monetary policy.
On Friday, gold found support from a weaker US dollar and a modest decline in bond yields. However, relatively high interest rates continue to limit the precious metal's potential for sustained growth.
Oil market conditions are another influence. High energy prices strengthen inflation expectations, which could support demand for gold as a safe-haven asset. At the same time, a greater likelihood of tighter Fed policy could have the opposite effect.
The key event of the week will be the release of US inflation data. Higher figures could strengthen the dollar and increase pressure on gold. Slowing inflation, by contrast, would create conditions for a recovery in prices.
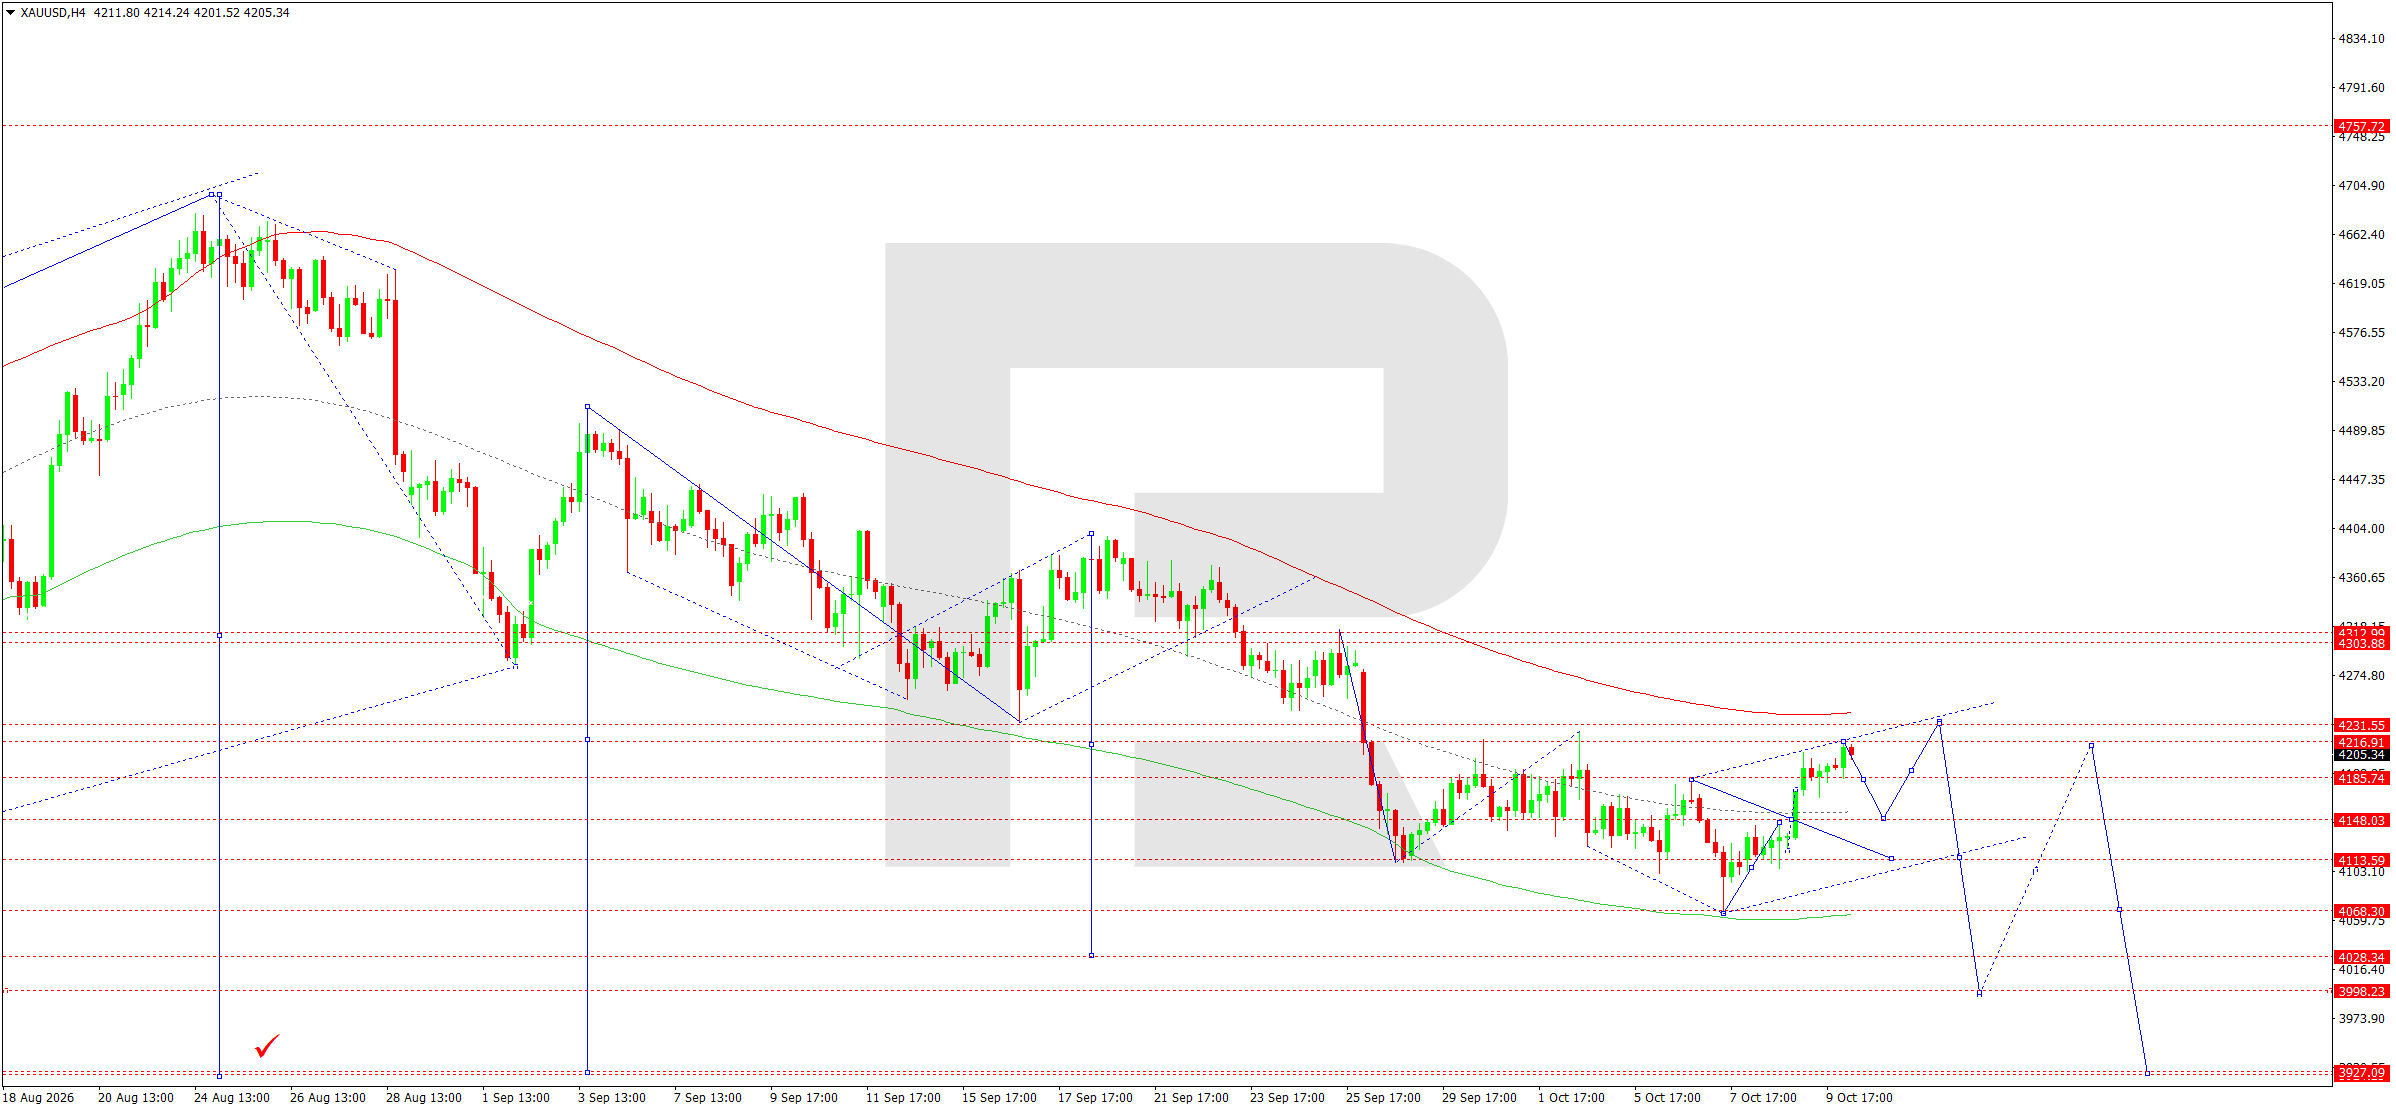
On the H4 chart, XAUUSD retains a downward structure. After forming a local high at 4,216, the market corrected towards 4,196 and continues to trade within a descending channel.
Today, a decline towards 4,148 is possible, followed by consolidation. If this support holds, a corrective rise towards 4,216 and 4,232 could follow.
The downward wave matrix places its pivot centre at 4,215. This level acts as key resistance for the current structure.
The Price Envelope suggests a subsequent decline towards 4,113 and 4,068. A breakout below these support levels would make 4,028 and 4,000 the next targets.
The Elliott wave structure suggests a local correction may be coming to an end, paving the way for another downward impulse.
Consolidation above 4,232 would weaken the main scenario and create conditions for a more prolonged recovery.
Sellers retain the advantage. The main forecast suggests a decline once the corrective move is complete.
XAUUSD forecast scenario
Trading scenario: SELL
- Price at the time of writing: 4,185
- Entry price: 4,180
- Stop loss: 4,233
- Take profit: 4,068
- Risk-to-reward ratio: 1:2.11
The trade idea is valid until 8:00 AM on 13 October 2026 (server time, UTC+3).
US 500 forecast
The US stock market is starting the trading week ahead of inflation data and a new round of corporate earnings releases. For the US 500 index, government bond yields, interest rate prospects, and the resilience of earnings at major US companies remain the key factors.
The stock market recovered over the previous week despite ongoing inflation risks and high borrowing costs. Expectations of corporate earnings growth, particularly in the technology sector, are supporting equities.
However, high US bond yields increase competition between debt instruments and equities. Companies with high valuation multiples remain particularly sensitive to changing interest rate expectations.
Energy prices are another influence. Rising oil prices could increase inflationary pressure and worsen the outlook for consumer demand. Falling oil prices, by contrast, may support investor interest in risk assets.
This week, market participants will focus on US inflation and quarterly results from major financial and technology companies. Fundamental conditions suggest that the upward move could continue; however, the risk of corrections remains due to the market's heightened sensitivity to interest rates.
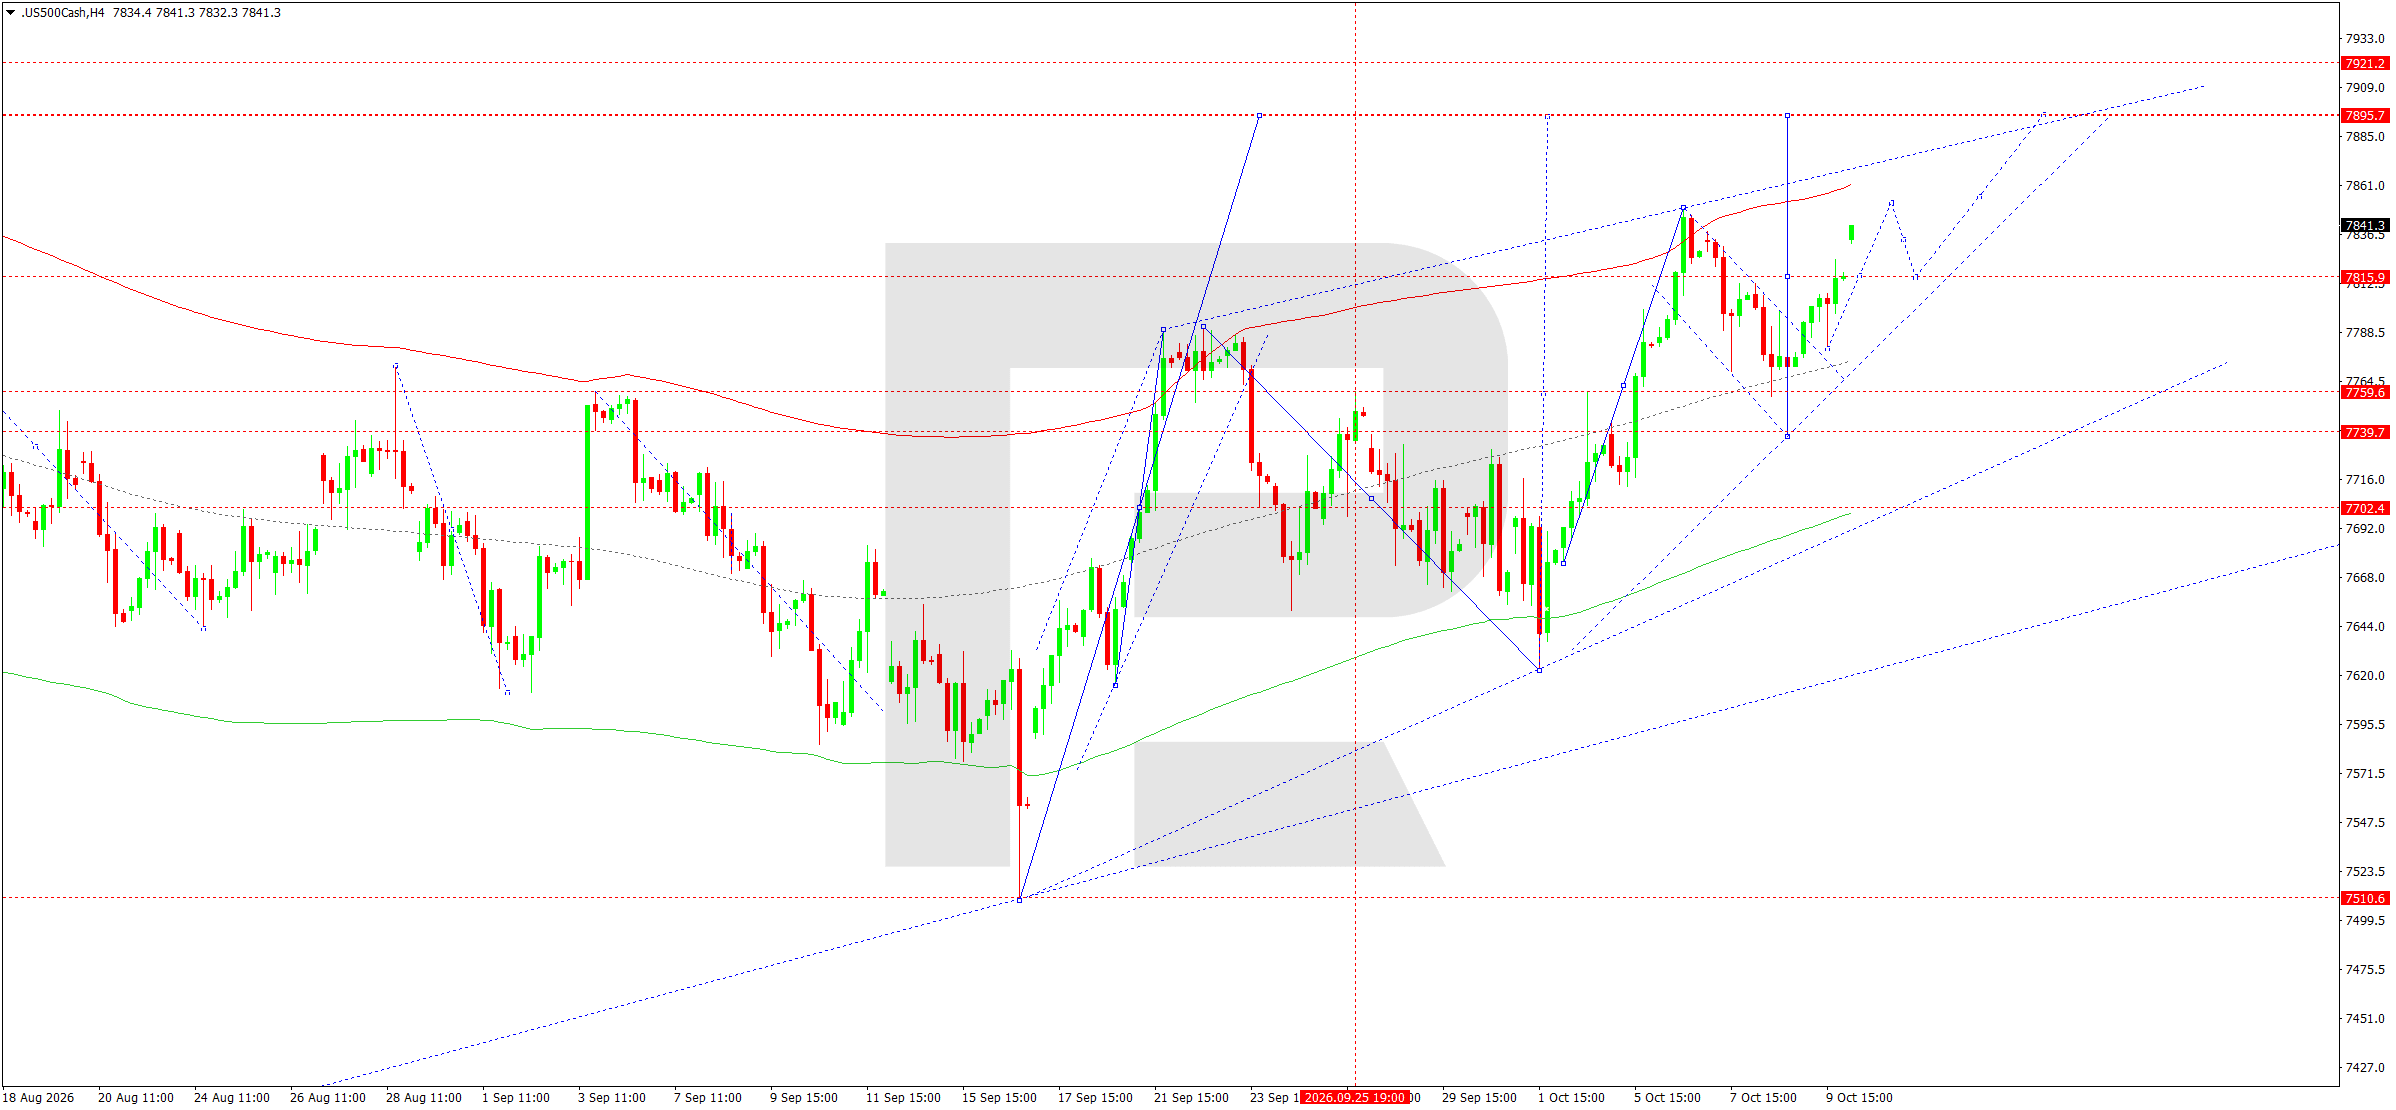
On the H4 chart, the US 500 has formed an upward structure after completing a correction towards 7,780. The market recovered towards 7,842 and entered local consolidation.
Today, further growth is expected, with the nearest target at 7,852. Consolidation above this resistance level would create conditions for a move towards 7,895.
The upward wave matrix places its pivot centre at 7,760. This level remains key support for the current trend.
The Price Envelope suggests a move towards its upper boundary at 7,895. After reaching local targets, a correction towards 7,816 is possible, or towards the centre line at 7,770 if selling intensifies.
The Elliott wave structure suggests continued upward momentum following brief consolidation.
A breakout below 7,816 would weaken the near-term bullish scenario. As long as the market holds above this support, buyers retain the advantage.
US 500 forecast scenario
Trading scenario: BUY
- Price at the time of writing: 7,834
- Entry price: 7,839
- Stop loss: 7,799
- Take profit: 7,895
- Risk-to-reward ratio: 1:1.40
The trade idea is valid until 8:00 AM on 13 October 2026 (server time, UTC+3).
BTCUSD forecast
The Bitcoin market is starting the trading week amid continued dependence on global risk appetite, US dollar movements, and expectations for Fed interest rate policy.
US government bond yields remain the most important factor. High interest rates increase the appeal of dollar-denominated instruments and could limit capital inflows into high-risk assets.
Energy market conditions are another influence. Rising oil prices strengthen inflation risks and increase the likelihood of restrictive monetary conditions remaining in place. Lower energy prices, by contrast, could support investor interest in cryptocurrencies.
The upcoming release of US inflation data could significantly affect Bitcoin's short-term direction. Higher inflation could increase pressure on the market, while favourable data would create conditions for demand to recover.
The fundamental backdrop remains mixed. Despite a local improvement in market sentiment, cryptocurrencies' high sensitivity to dollar liquidity suggests continued elevated volatility.
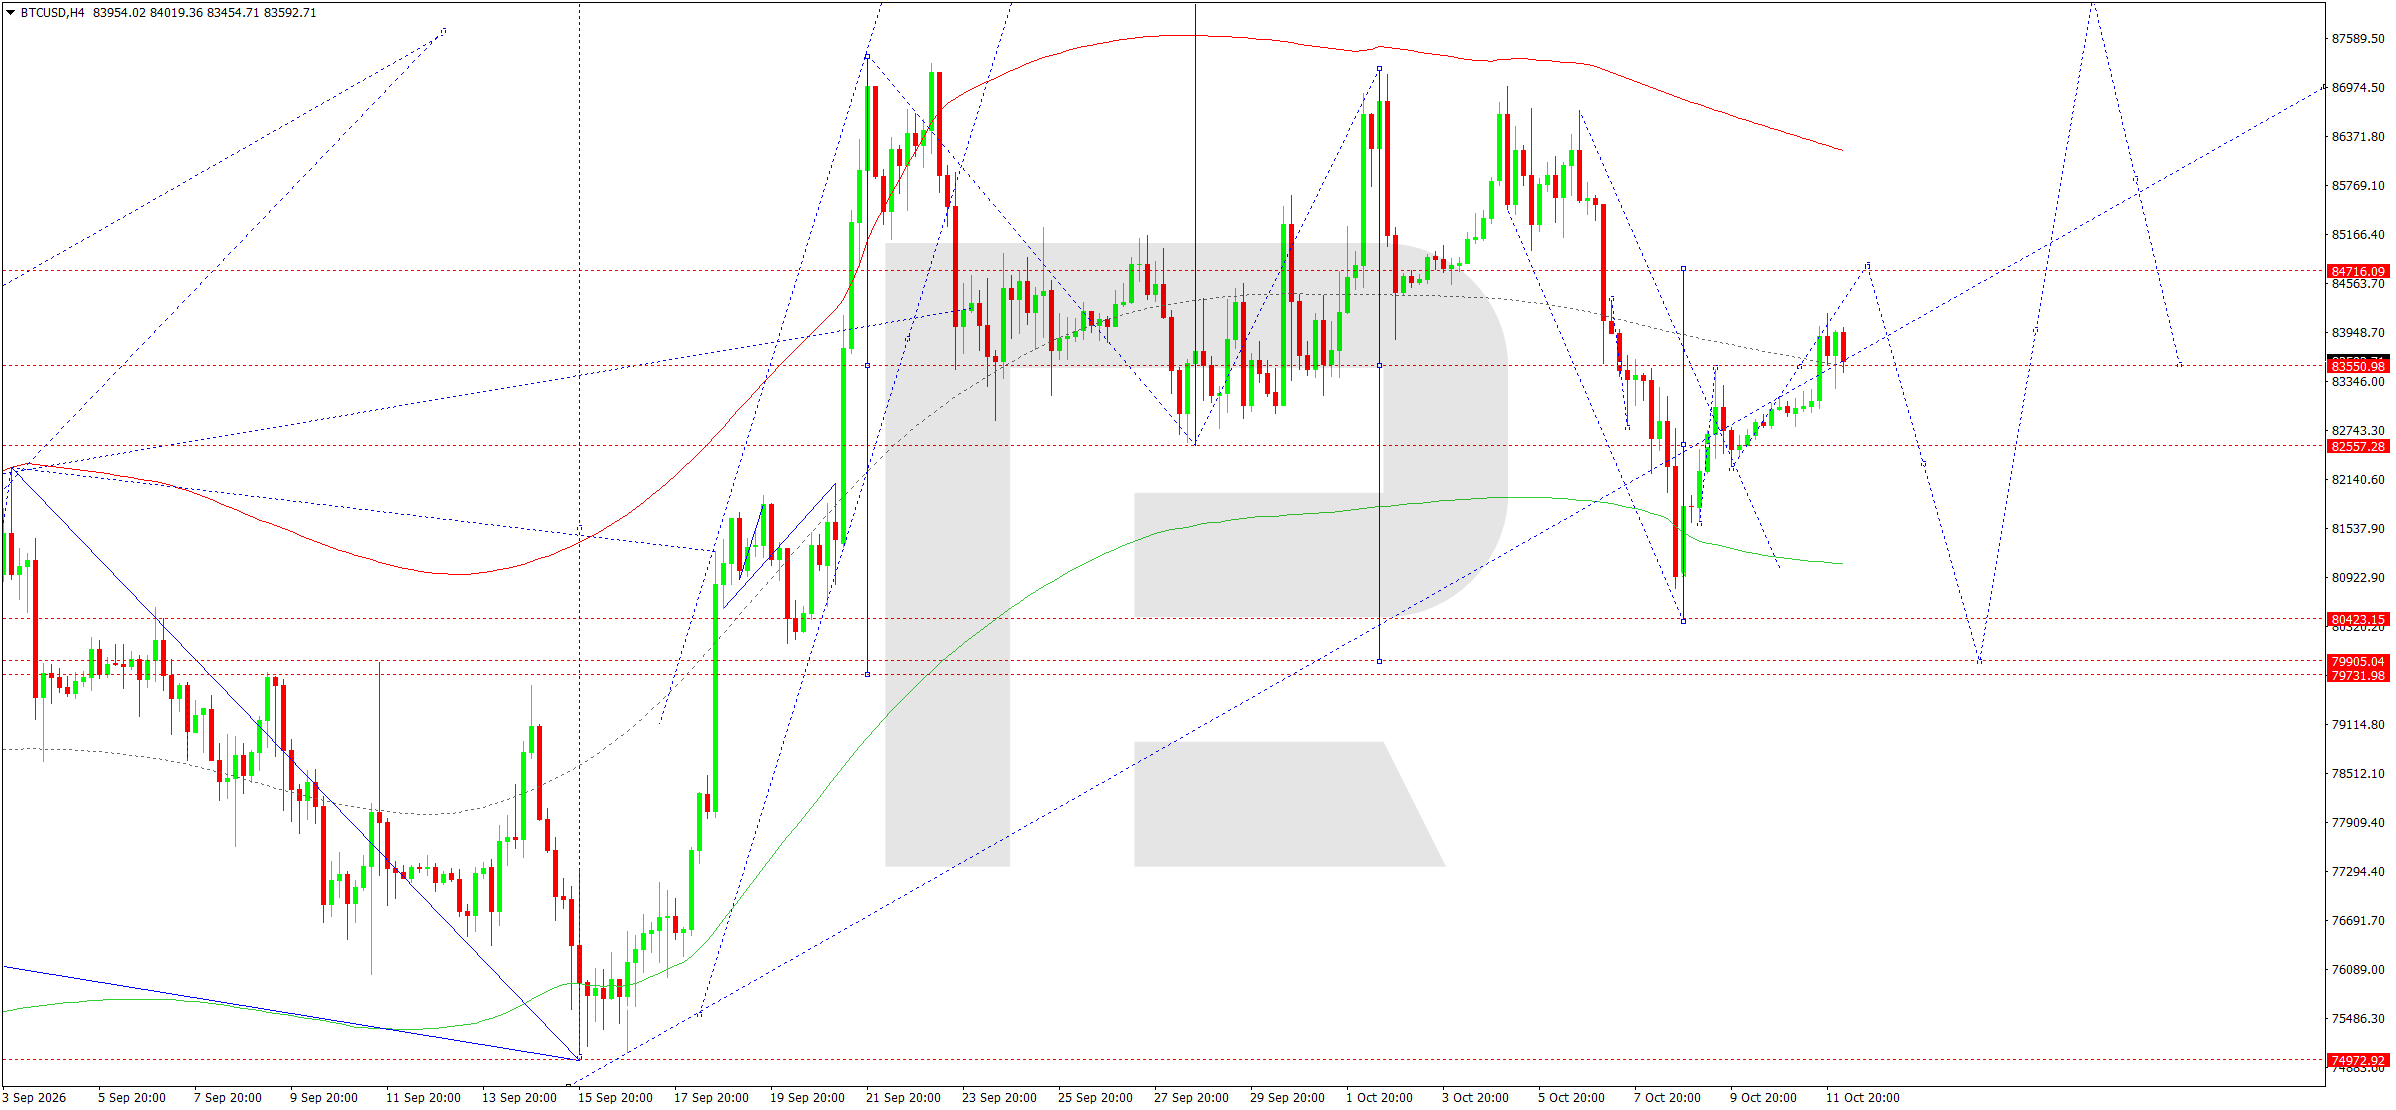
On the H4 chart, BTCUSD has completed a corrective decline and recovered towards 83,550. The current structure suggests further growth towards the nearest resistance level at 84,715.
Today, an upward corrective move is expected, followed by a decline towards 83,550. This level is viewed as a key area for determining the next direction.
The upward wave matrix places its pivot centre at 83,550. As long as prices hold above it, a continued recovery remains likely.
The Price Envelope limits the nearest move at its upper boundary at 84,716. After testing it, a correction towards 82,557 is possible.
The Elliott wave structure allows for the completion of the local correction and the formation of the next upward impulse.
Consolidation above 84,716 would open the way for further growth towards 86,000 and 88,065. Conversely, a breakout below the 82,557 support level would increase the likelihood of a decline towards 80,423.
The main scenario suggests a continued recovery following a possible short-term correction.
BTCUSD forecast scenario
Trading scenario: BUY
- Price at the time of writing: 83,996
- Entry price: 84,001
- Stop loss: 82,550
- Take profit: 88,065
- Risk-to-reward ratio: 1:2.80
The trade idea is valid until 8:00 AM on 13 October 2026 (server time, UTC+3).
Editors’ picks
 EURUSD forecast 2026–2027: technical analysis, price levels & predictions
The EURUSD outlook for 2026 and 2027: key levels on the daily chart, three trading scenarios and the policy gap between the Fed and the ECB that drives the pair.
 Gold (XAUUSD) forecast 2026: technical analysis, price levels & predictions
Where gold could trade in 2026: key levels, three trading scenarios with entry triggers and the forecasts from J.P. Morgan, Deutsche Bank and Goldman Sachs.
Forecasts presented in this section only reflect the author’s private opinion and should not be considered as guidance for trading. RoboForex bears no responsibility for trading results based on trading recommendations described in these analytical reviews.