
Daily technical analysis and forecast for 20 October 2026
Daily technical analysis and forecast for EURUSD, USDJPY, GBPUSD, AUDUSD, USDCAD, XAUUSD, US 500, and BTCUSD for 20 October 2026.
Each scenario on this page reflects the market structure on the H4 chart as of 10:00 UTC+3 on 20 October 2026. The assessment considers the current H4 chart structure, key support and resistance levels, the direction of the medium-term movement, and the prevailing fundamental backdrop.
EURUSD forecast
On Tuesday, 20 October, EURUSD movements are determined by the balance of expectations regarding monetary policy from the European Central Bank and the Federal Reserve. The euro remains sensitive to the eurozone's growth outlook, inflation trends, and industrial sector conditions. Weak business activity could limit the European currency's recovery, especially if demand for the US dollar remains firm.
On the US side, the main factors remain Treasury yields, expectations of changes to Fed interest rates, and consumer activity indicators. Rising US government bond yields traditionally strengthen the dollar, while falling yields can create conditions for a corrective rise in EURUSD.
Global risk appetite is another influence. Heightened geopolitical uncertainty and investor caution could sustain demand for safe-haven dollar assets. Without a marked improvement in Europe's macroeconomic outlook, the fundamental balance of risks for EURUSD remains tilted towards sellers. Nevertheless, changes in Fed policy expectations could prompt a short-term recovery in the pair.
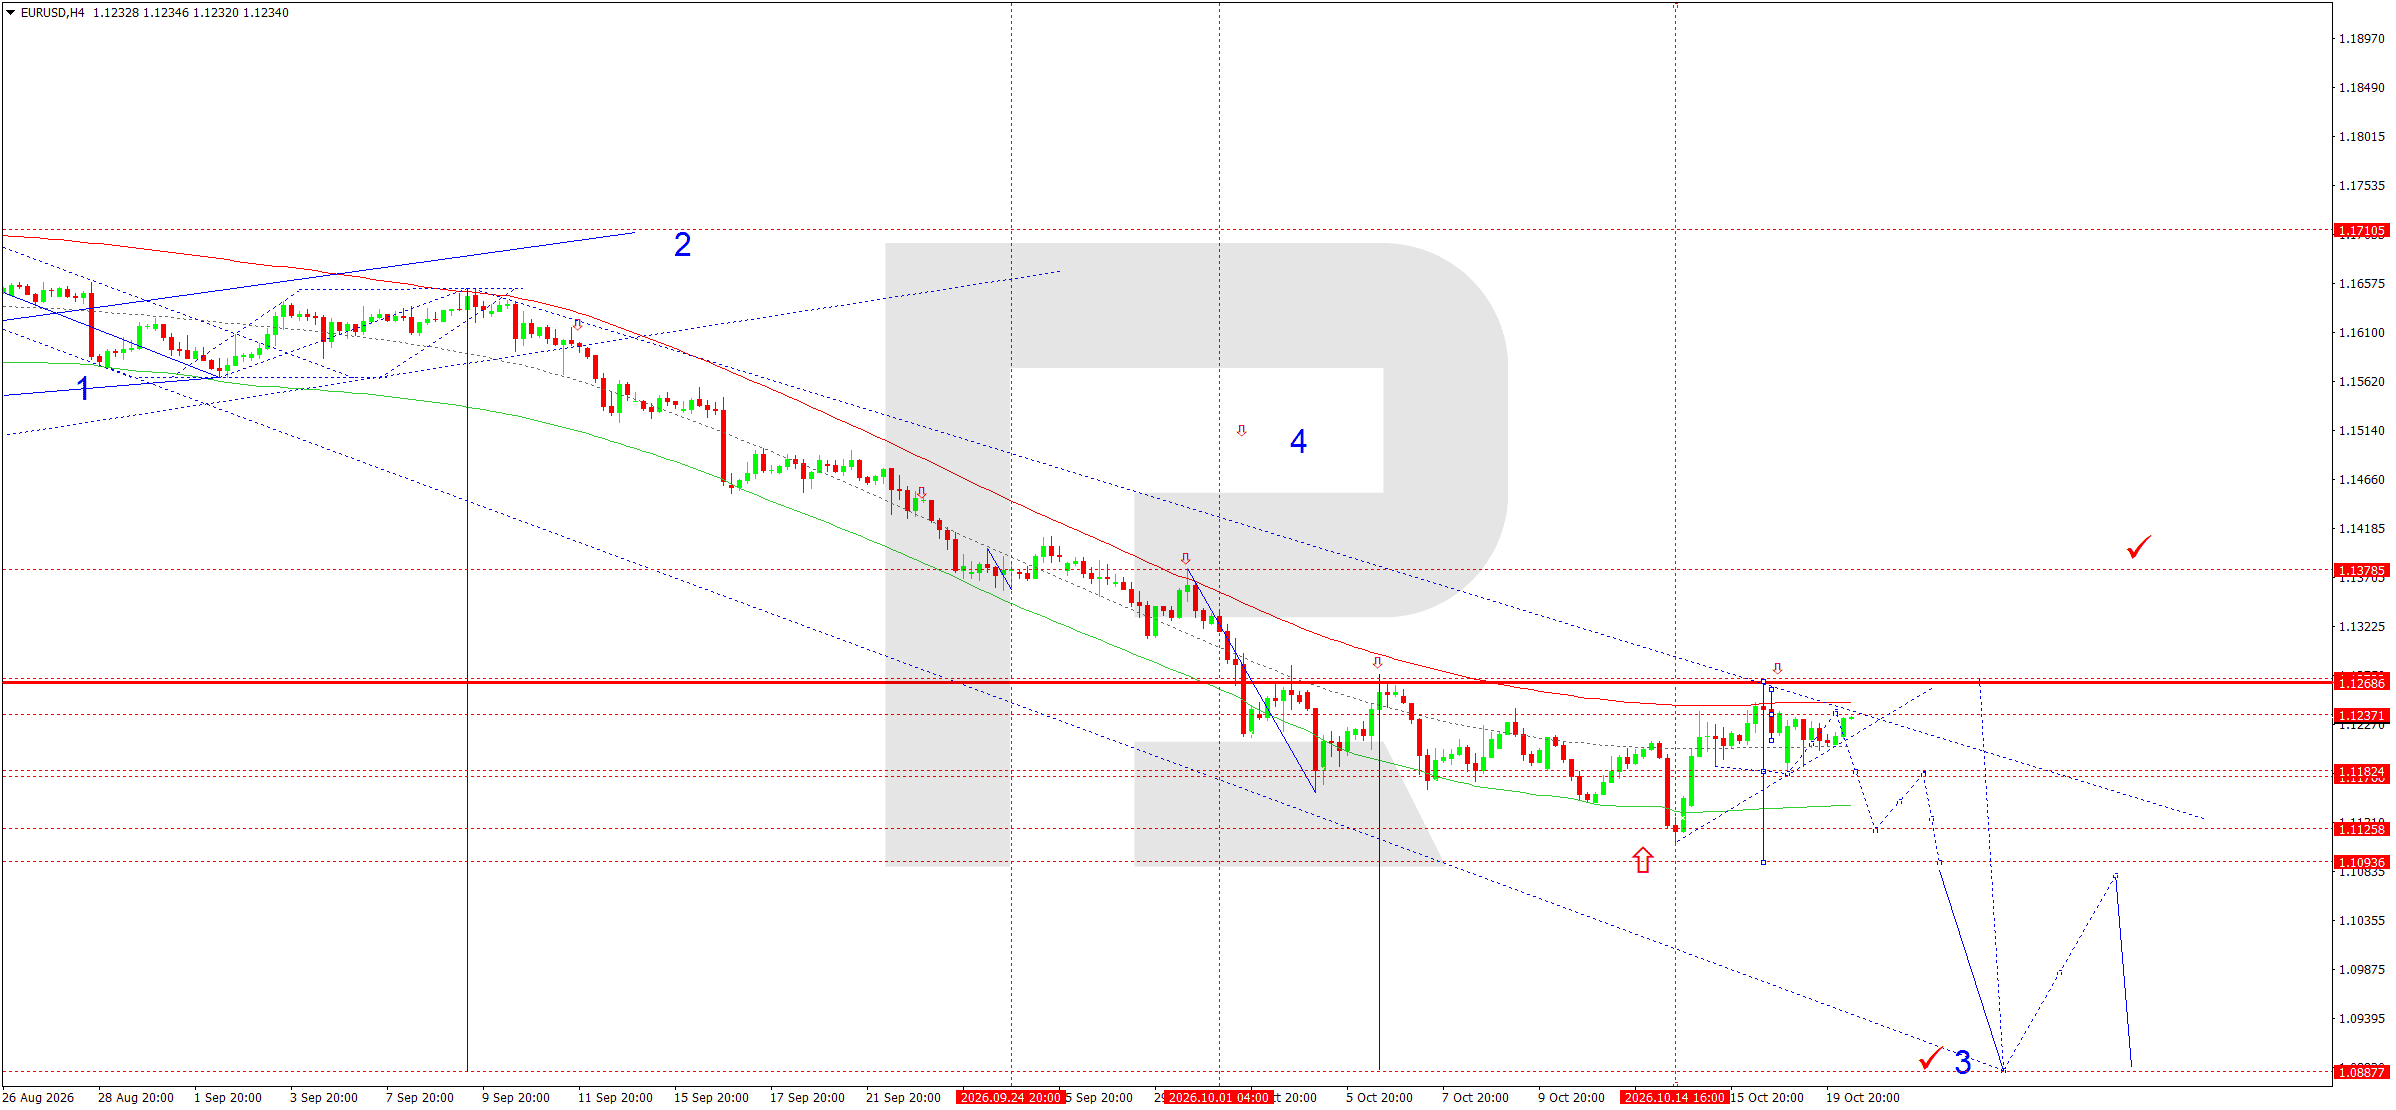
On the H4 chart, EURUSD completed another downward wave around 1.1187 before staging a corrective rise to 1.1237. The current structure features consolidation below resistance at 1.1266. This level is the pivot of the downward wave matrix and defines the medium-term balance between buyers and sellers.
The Elliott wave structure allows for a corrective fourth wave before the main decline continues. Prices remaining below 1.1266 support the bearish scenario.
The nearest significant support level lies around 1.1180. A breakout below it would open the door for a move towards 1.1114 and then the lower boundary of the Price Envelope at 1.1088.
If the downward momentum strengthens, the next strategic target will be the 1.0888 area.
An alternative scenario suggests consolidation above 1.1266 and a correction towards 1.1379. Until such a signal emerges, selling into local rallies remains the priority.
EURUSD forecast scenario
Trading scenario: SELL
- Price at the time of writing: 1.1230
- Entry price: 1.1225
- Stop loss: 1.1270
- Take profit: 1.1088
- Risk-to-reward ratio: 1:3.04
The trade idea is valid until 8:00 AM on 21 October 2026 (server time, UTC+3).
USDJPY forecast
USDJPY movements are driven by differences between the monetary policies of the Fed and the Bank of Japan. The main factor remains the yield differential between US and Japanese government bonds. A substantial interest rate differential sustains investor interest in dollar-denominated assets, while a narrowing gap could strengthen the Japanese yen.
Inflation data, wage trends, and BOJ signals regarding further monetary policy normalisation are significant for the Japanese currency. Persistent inflationary pressure could strengthen expectations of a more restrictive stance, creating conditions for yen appreciation.
The US side of the fundamental picture is linked to expectations for the Fed's policy rate and movements in US Treasury yields. Higher yields could support a USDJPY recovery.
Another factor is the possibility of currency intervention by the Japanese authorities during sharp exchange rate movements. Consequently, an approach towards 160.00 could be accompanied by heightened volatility and buyer caution. In the short term, fundamental conditions allow demand for the dollar to persist, although the risks of a correction in the Japanese currency remain considerable.
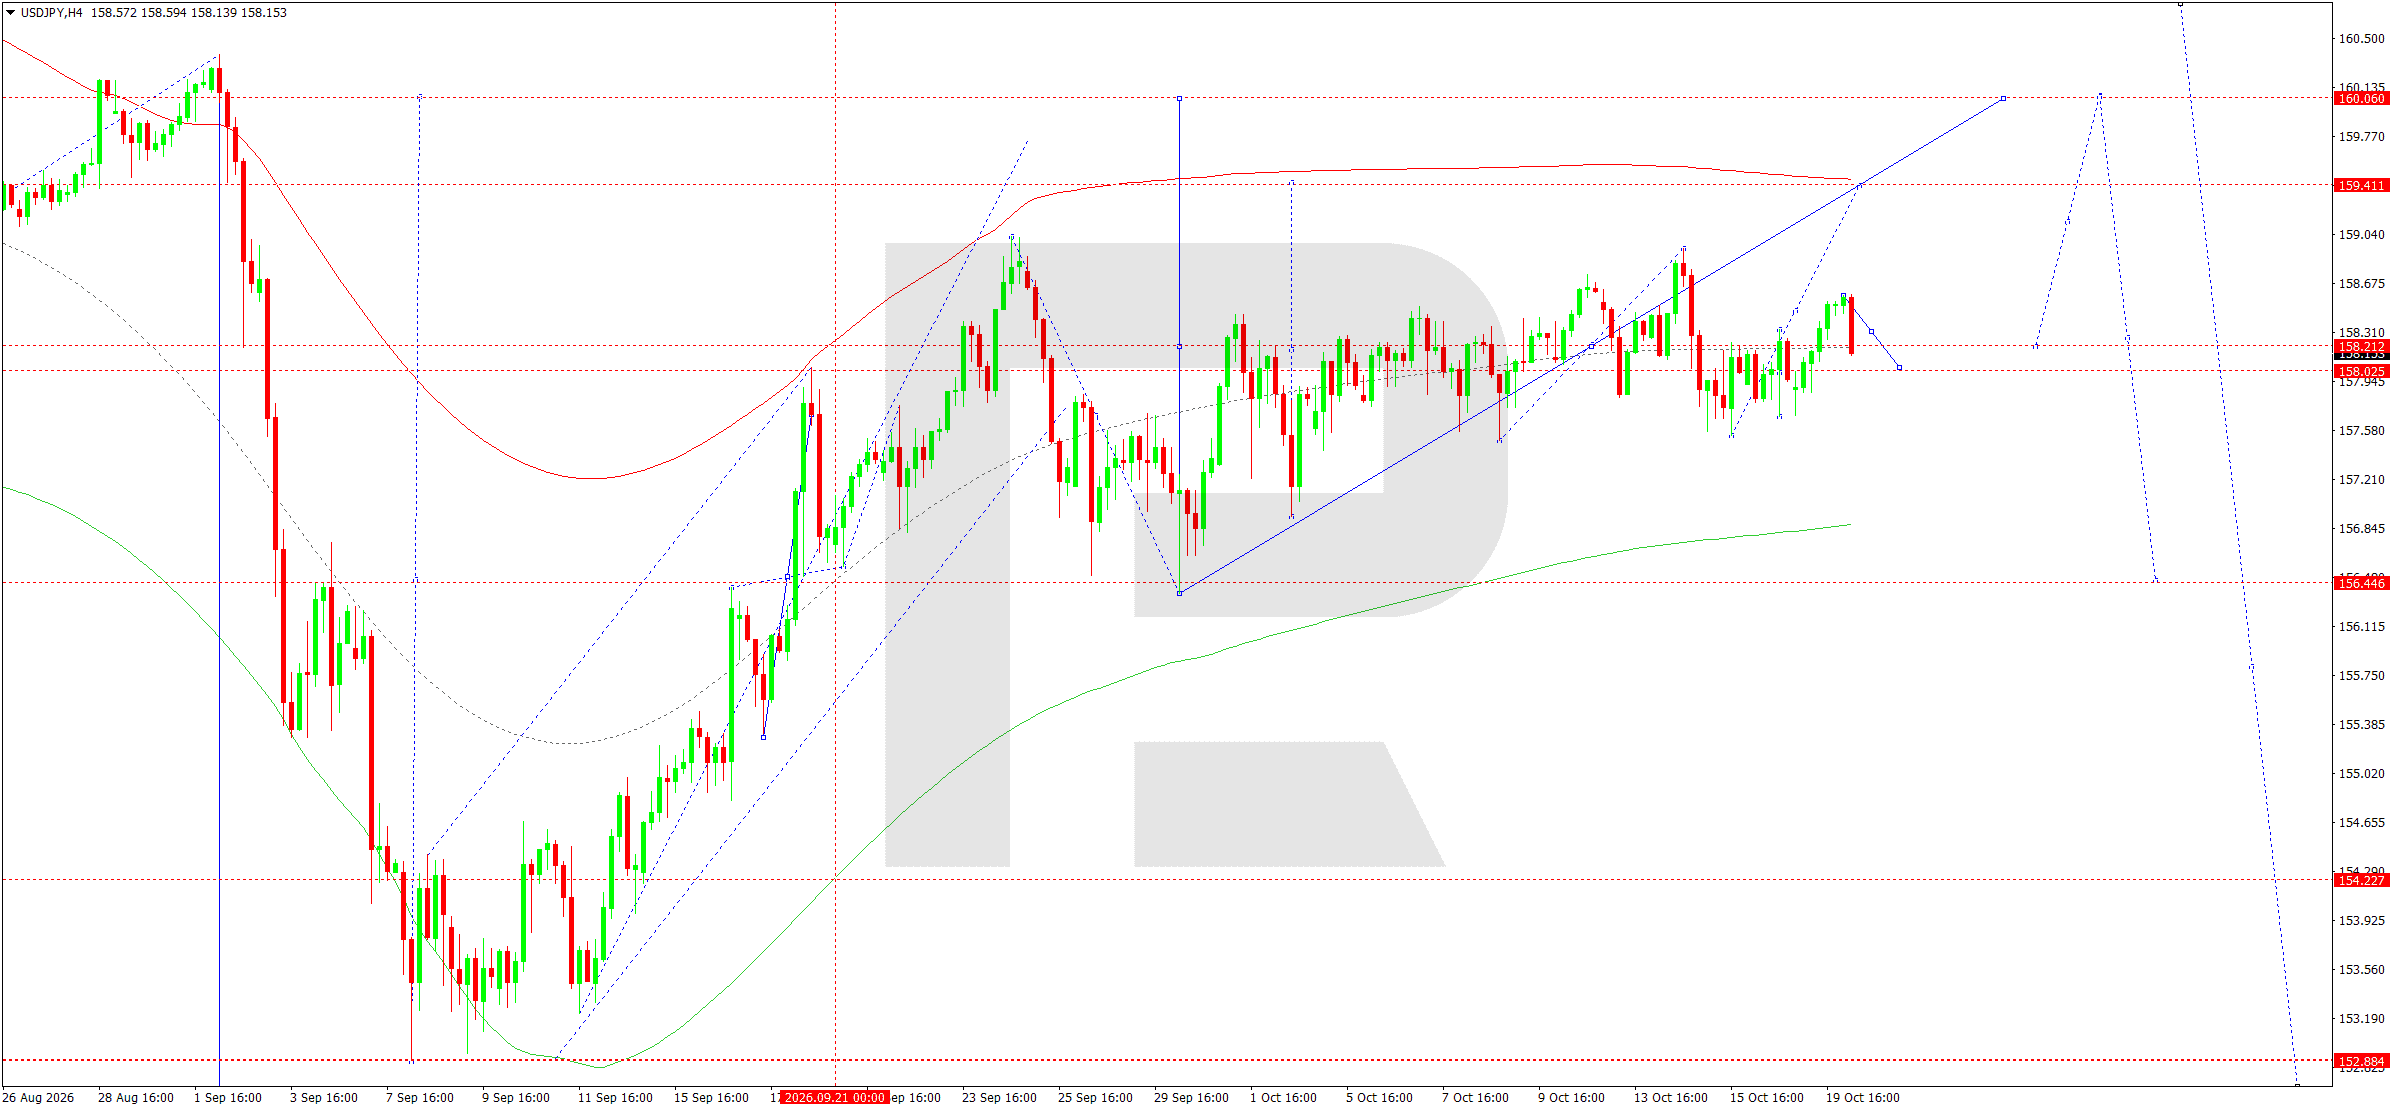
On the H4 chart, USDJPY formed an upward impulse to 158.58 before correcting towards 158.06. The current structure features a narrow consolidation range around the Price Envelope's central line at 158.21.
The key level of the upward wave matrix is 158.00. As long as prices remain above it, the main scenario suggests a renewed rise once the corrective structure is complete.
Within the Elliott wave model, the current decline is viewed as a corrective leg of a broader upward sequence. An initial retest of the 158.00 level is possible, after which growth towards 159.41 and 159.54 is expected.
A breakout above resistance at 159.54 would open the way towards the upper boundary of the Price Envelope at 160.06. Consolidation above this mark would confirm continuation of the uptrend.
AN alternative scenario involves a breakout below 158.00, followed by a decline towards 156.50. The price reaction at the matrix's central level therefore remains decisive for retaining a bullish position.
USDJPY forecast scenario
Trading scenario: BUY
- Price at the time of writing: 158.06
- Entry price: 158.11
- Stop loss: 157.50
- Take profit: 160.06
- Risk-to-reward ratio: 1:3.20
The trade idea is valid until 8:00 AM on 21 October 2026 (server time, UTC+3).
GBPUSD forecast
The fundamental backdrop for sterling reflects a combination of expectations regarding Bank of England monetary policy, the state of the UK economy, and US dollar movements. Expectations that relatively restrictive monetary conditions will remain in place in the UK support the pound, as inflation risks continue to influence the central bank's decisions.
A crucial factor is the preparation of the UK budget scheduled for 28 October. Investors are assessing the outlook for tax policy, public expenditure, and the financial system's stability. Uncertainty surrounding budget decisions could heighten volatility in the pound.
On the US side, inflation indicators and Treasury yields remain influential. September's US consumer price data increased concerns about how long interest rates will stay high. This limits the scope for sustained dollar weakness.
At the start of this week, the pound showed relative resilience amid political tensions in continental Europe. Nevertheless, fundamental support for sterling does not rule out a corrective decline. Further GBPUSD movements will depend on changing interest rate expectations and overall investor risk sentiment.
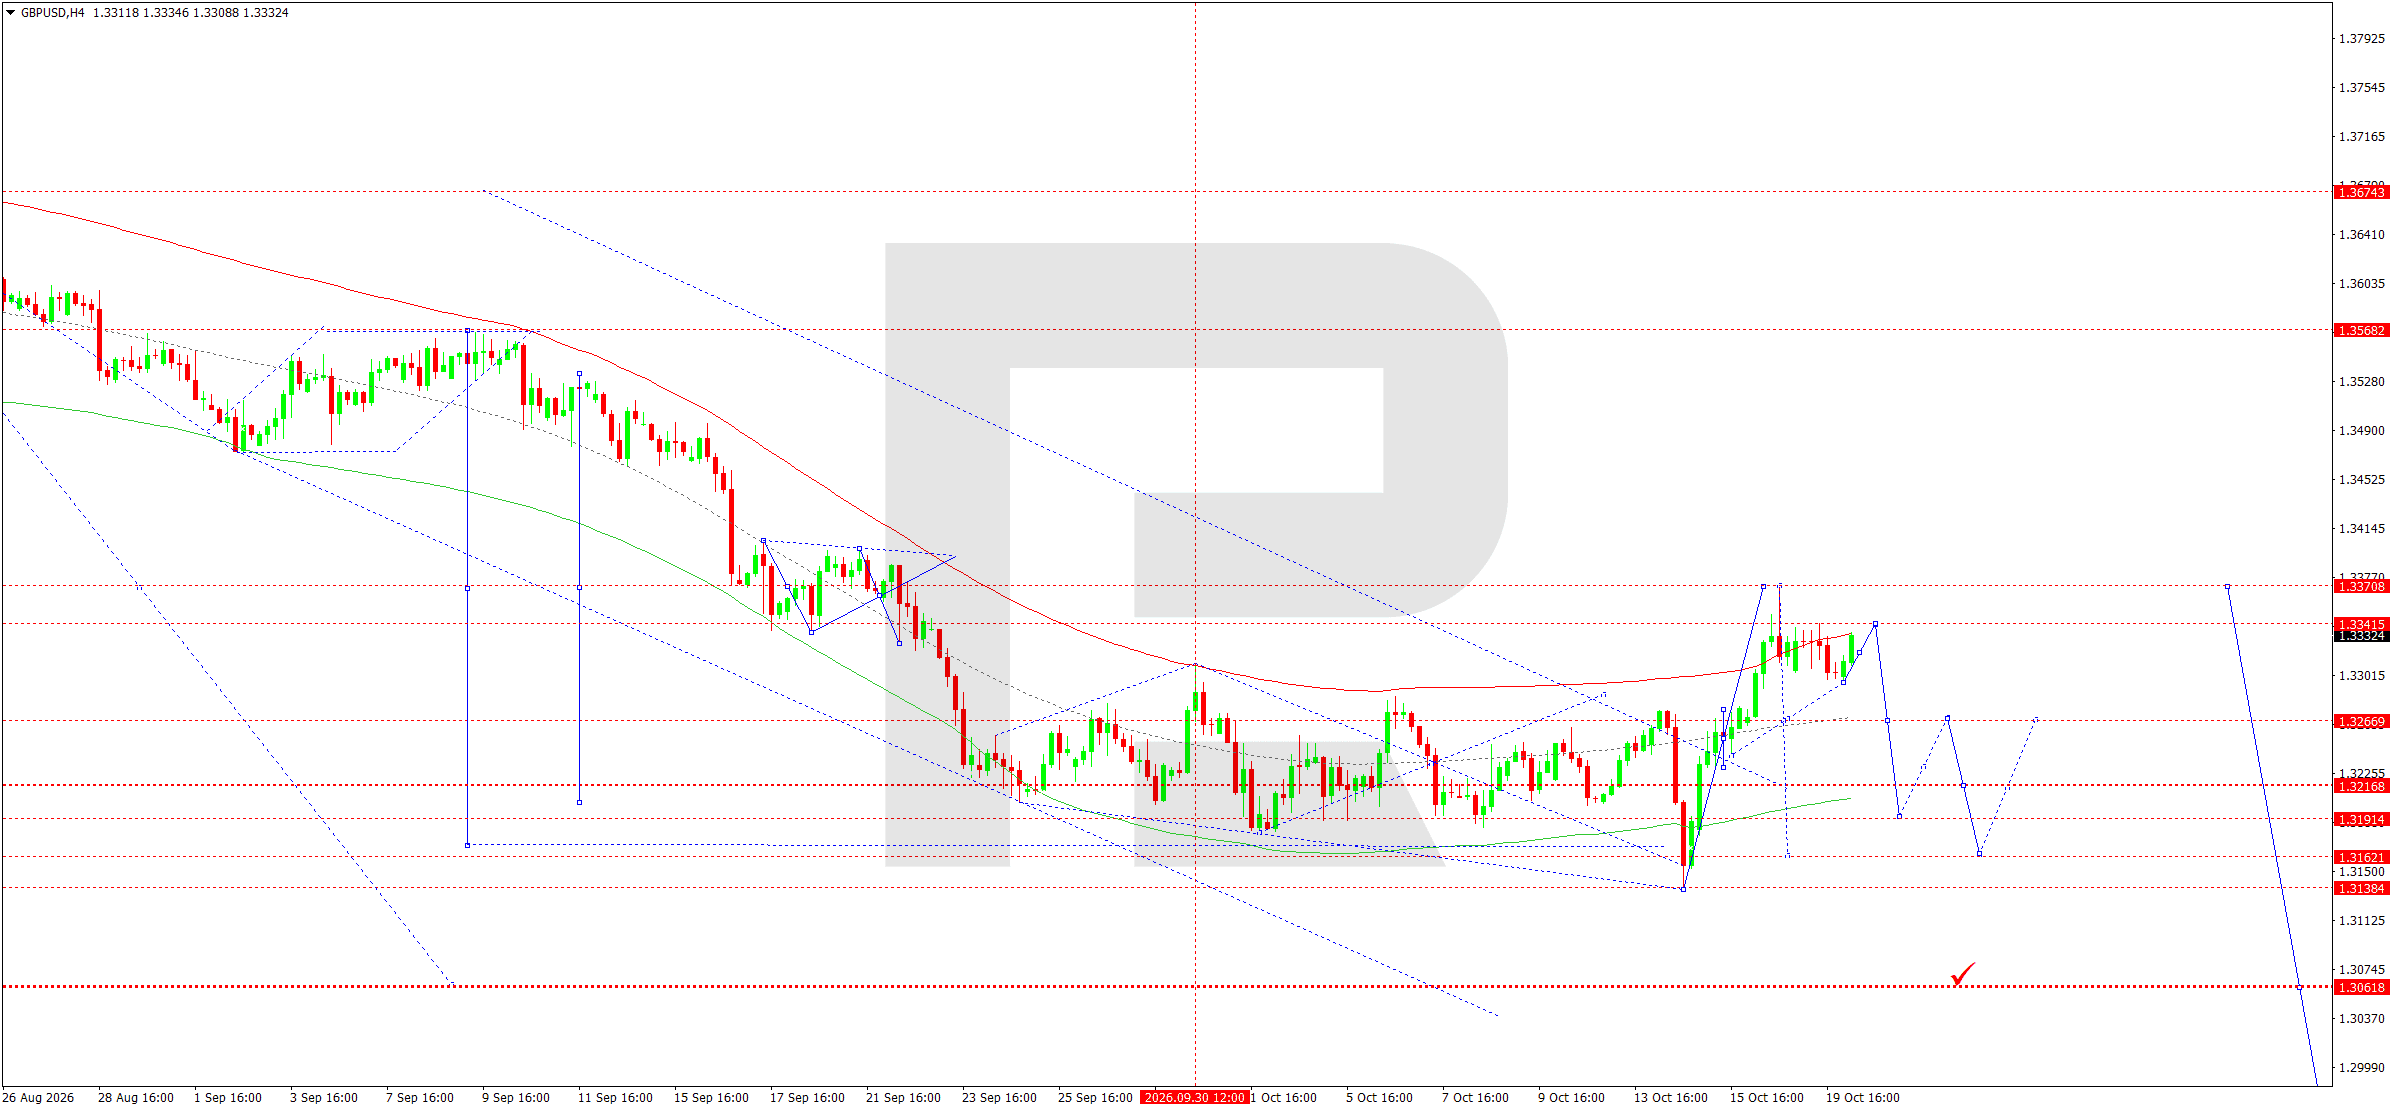
On the H4 chart, GBPUSD declined to 1.3304 before recovering towards 1.3355. The current structure features a corrective wave within a broader downtrend.
A key resistance level is located at 1.3370, coinciding with the matrix pivot and the upper boundary of the Price Envelope. Prices remaining below this level support the scenario in which the upward correction ends.
The Elliott wave structure allows for a final corrective move before another downward impulse develops. The initial downside target is 1.3267, followed by a test of 1.3216.
A breakout below support at 1.3216 would open the door for a move towards 1.3131. If selling pressure intensifies, the next strategic target will be the 1.3050 area.
An alternative scenario suggests consolidation above 1.3370, in which case the corrective rise could continue. However, the current H4 configuration favours sellers, especially if a reversal pattern forms immediately below resistance.
GBPUSD forecast scenario
Trading scenario: SELL
- Price at the time of writing: 1.3353
- Entry price: 1.3348
- Stop loss: 1.3385
- Take profit: 1.3216
- Risk-to-reward ratio: 1:3.57
The trade idea is valid until 8:00 AM on 21 October 2026 (server time, UTC+3).
AUDUSD forecast
Australian dollar movements are driven by expectations regarding Reserve Bank of Australia monetary policy, the state of the Chinese economy, and changes in global risk appetite. The Australian currency remains highly sensitive to the outlook for China's industrial demand, as China is one of the country's key trading partners.
Market participants are focusing on the minutes of the RBA's September meeting, published on 13 October, as well as remarks by central bank official Christopher Kent on 19 October. Investors are assessing the outlook for future interest rate decisions in light of Australia's labour market and inflation.
Weakness in some employment indicators reduces the likelihood of additional monetary tightening. At the same time, elevated US government bond yields support the US dollar and limit AUDUSD's recovery potential.
Improved sentiment across global equity markets offers some support for the Australian currency. However, persistent geopolitical risks, high energy costs, and uncertainty about Chinese demand create a mixed fundamental backdrop. Thus, short-term AUDUSD gains should still largely be viewed as corrective.
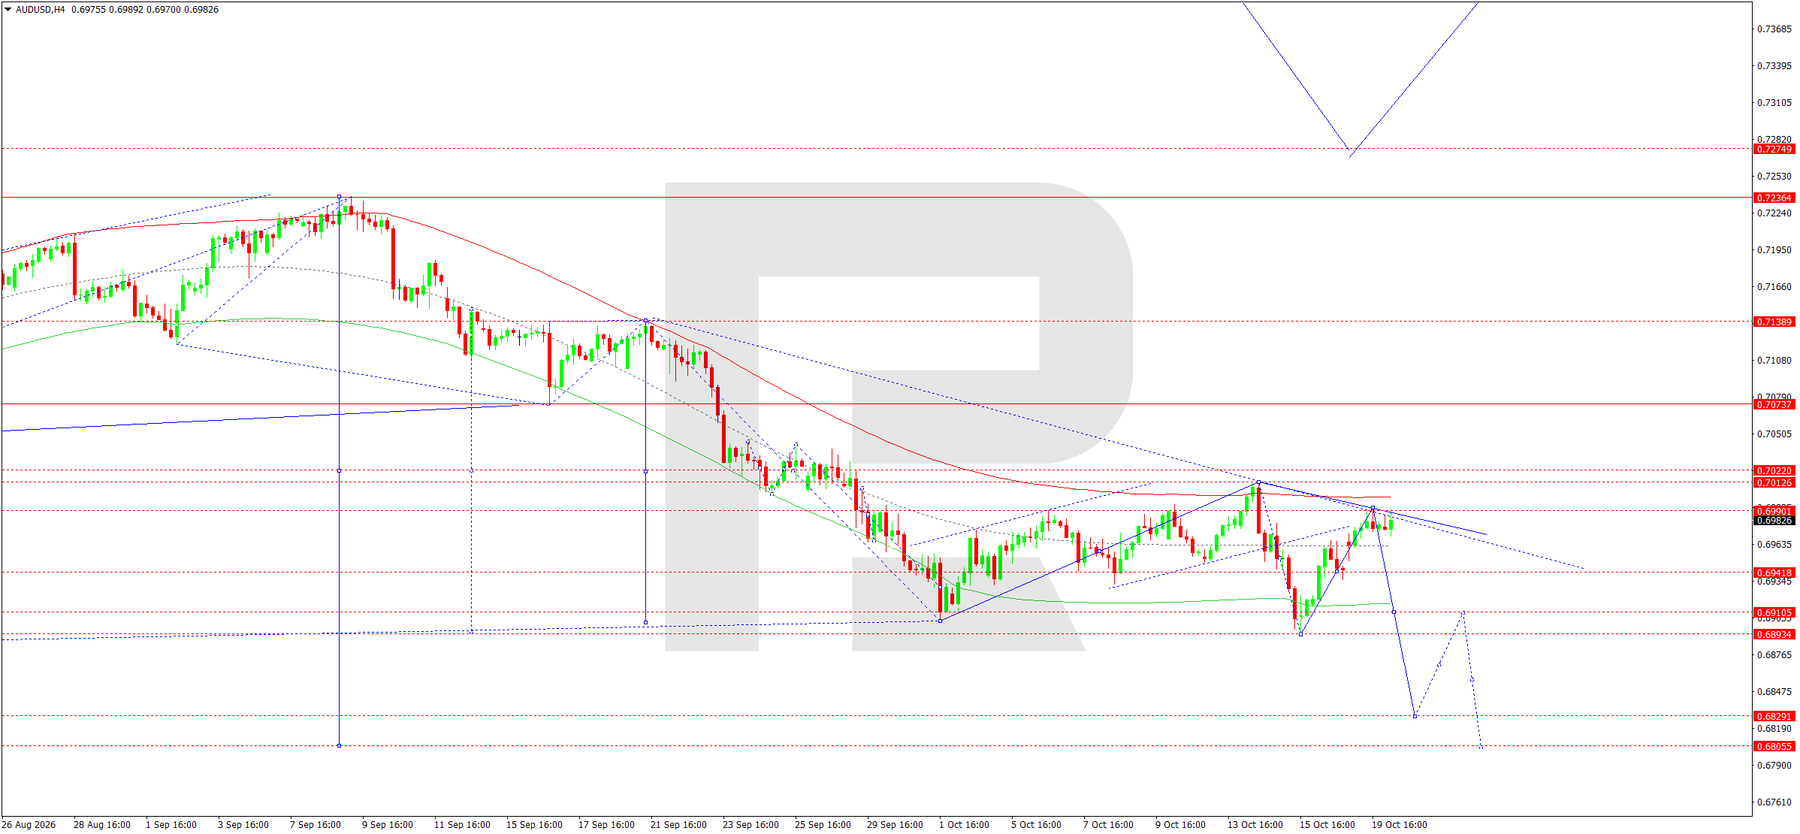
On the H4 chart, AUDUSD formed a downward wave towards 0.6896 before recovering towards 0.6992. The current structure features corrective movement within the prevailing downtrend.
The matrix's key level is 0.7022. It defines the central resistance area, which must be overcome to change the current technical balance.
The Elliott wave structure suggests the local correction could end around 0.6992–0.7013. This area coincides with descending channel resistance and a zone of increased seller activity.
Once the recovery ends, another downward wave towards 0.6942 and 0.6909 is expected. A breakout below the latter level would open the way towards 0.6890 and then 0.6829.
An alternative scenario suggests consolidation above 0.7022, allowing the corrective rise to extend towards 0.7074.
The main scenario for 20 October remains the formation of a reversal pattern below resistance at 0.7022, followed by a renewed decline. Selling remains the priority once the end of the correction is confirmed.
AUDUSD forecast scenario
Trading scenario: SELL
- Price at the time of writing: 0.6992
- Entry price: 0.6987
- Stop loss: 0.7027
- Take profit: 0.6890
- Risk-to-reward ratio: 1:2.43
The trade idea is valid until 8:00 AM on 21 October 2026 (server time, UTC+3).
USDCAD forecast
USDCAD's fundamental movements are determined by differences between Fed and Bank of Canada monetary policy and by conditions in the oil market. The Canadian dollar is traditionally sensitive to changes in oil prices, as the energy sector plays a significant role in the country's economy.
Data released on 19 October showed Canadian annual inflation accelerating to 3.1% in September from 3.0% previously. However, the figure was slightly below market expectations of 3.2%. Higher petrol prices pushed up headline inflation, while some core components showed more moderate changes.
This inflation pattern presents mixed conditions for the BoC. The central bank must consider both price pressures and the economic growth outlook. Higher oil prices could bolster the Canadian dollar, but continued uncertainty about global demand limits the durability of this effect.
The US dollar benefits from high government bond yields and expectations that the Fed will maintain restrictive policy. In the short term, the fundamental balance allows for corrective Canadian dollar strength but leaves open the possibility of a subsequent recovery in USDCAD.
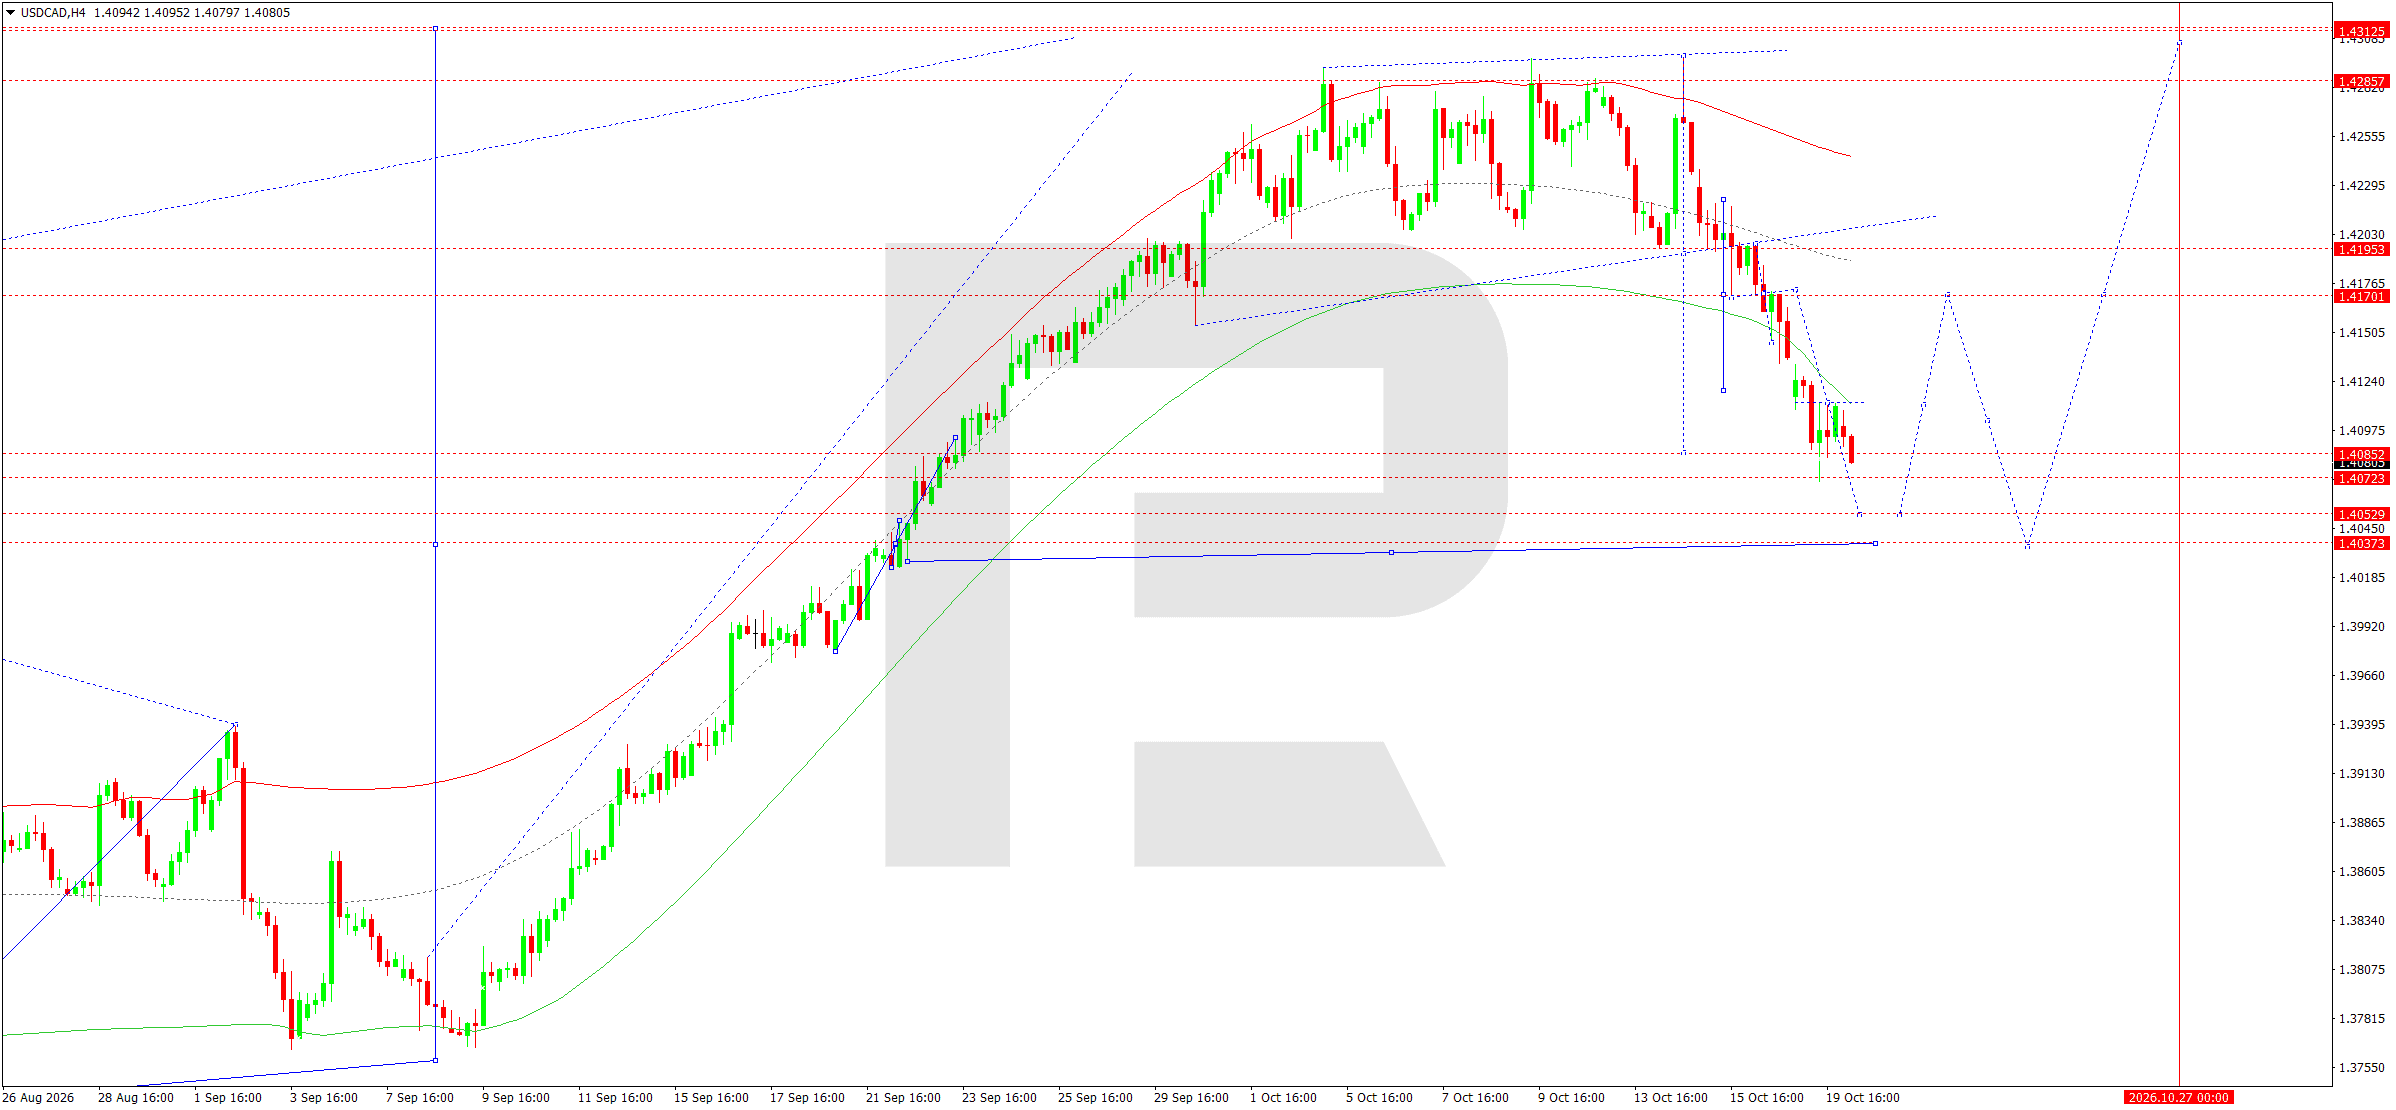
On the H4 chart, USDCAD completed an upward wave near 1.4297 before forming a downward correction towards 1.4072. The current structure features a sustained decline below the central levels of the Price Envelope.
The matrix's key level is 1.4195. A breakout below it confirmed weakening demand from buyers and paved the way for a corrective wave.
The Elliott wave structure allows the decline to continue towards 1.4052. This level is regarded as the nearest target and a potential area for the current downward impulse to end.
If the 1.4052 level is broken, the next support will be 1.4037. A reversal pattern could form here, initiating a recovery towards 1.4170 and 1.4195.
Thus, the priority for 20 October remains completion of the downward wave, followed by a search for conditions supporting corrective growth. Until a confirmed reversal forms, short-term selling remains preferable.
USDCAD forecast scenario
Trading scenario: SELL
- Price at the time of writing: 1.4078
- Entry price: 1.4073
- Stop loss: 1.4105
- Take profit: 1.4037
- Risk-to-reward ratio: 1:1.13
The trade idea is valid until 8:00 AM on 21 October 2026 (server time, UTC+3).
XAUUSD forecast
Gold's fundamental backdrop on 20 October is shaped by US dollar movements, US Treasury yields, and continuing geopolitical tensions. The main constraint on a recovery in the precious metal is high government bond yields, which increase the opportunity cost of holding gold.
Previously released US inflation figures strengthened expectations that the Fed would maintain restrictive monetary policy. September's core inflation rate stood at 2.6% year-on-year, supporting US bond yields and putting pressure on the precious metal.
At the same time, safe-haven demand persists amid geopolitical uncertainty in the Middle East and political risks in Europe. High oil prices heighten inflation concerns but do not always provide sustained support for gold, as they can raise interest rate expectations.
At the start of the week, gold faced pressure from a stronger dollar and rising yields. Nevertheless, safe-haven demand limits the depth of individual downward impulses. The fundamental picture remains mixed, but sellers retain the short-term advantage until signs of a sustained decline in US yields emerge.
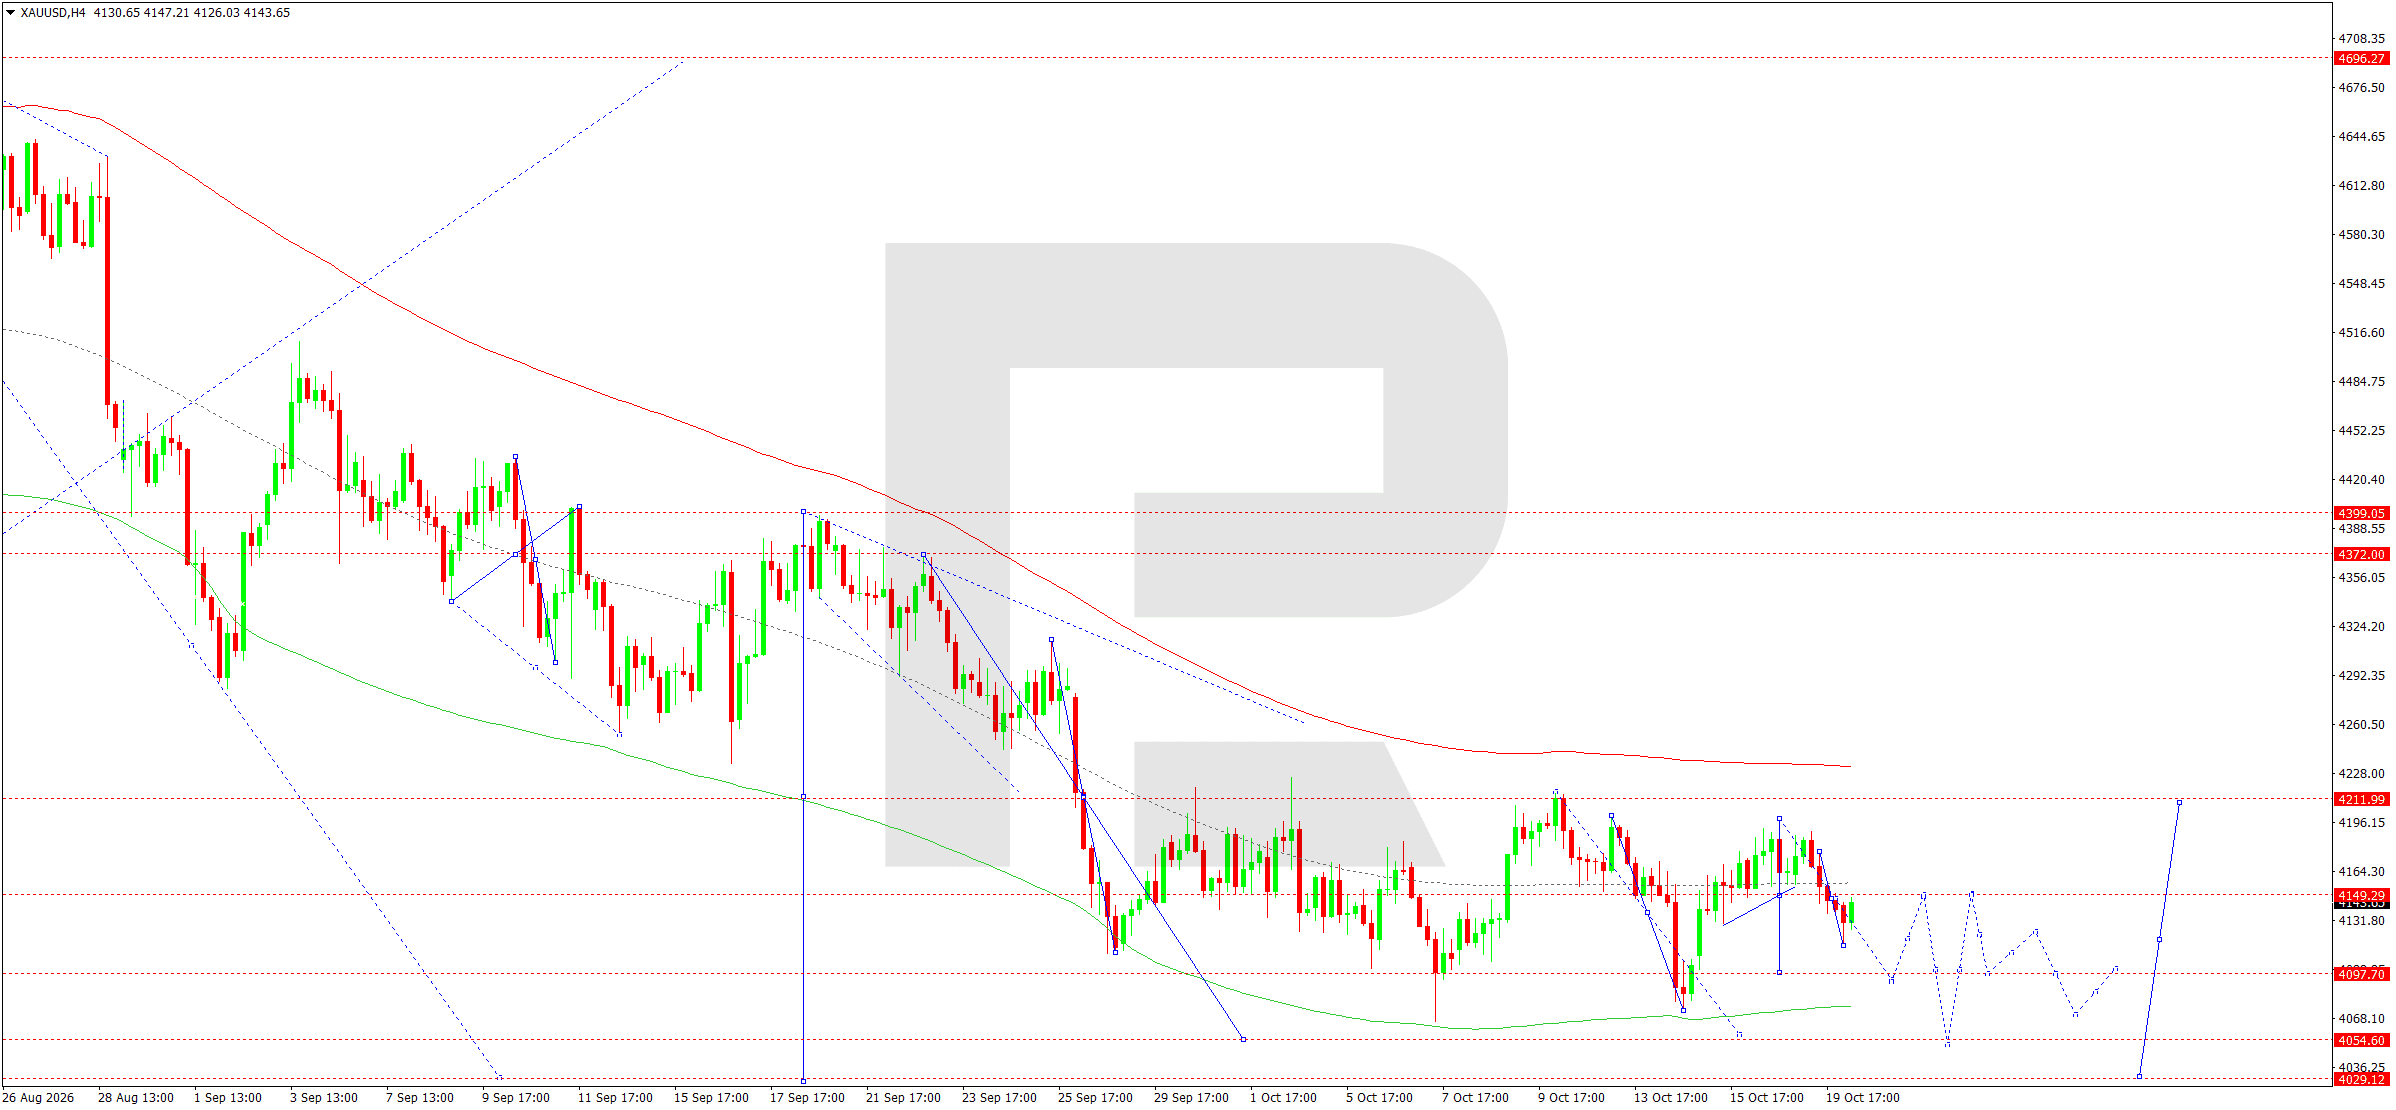
On the H4 chart, XAUUSD formed a downward wave towards 4,115 before recovering to the 4,141 area. The current structure features a narrow consolidation below resistance at 4,149.
The downward wave matrix's key level is 4,222. It marks the main resistance and remains relevant to the medium-term market structure.
The Elliott wave model allows for a local correction towards 4,147–4,166, after which the downward move is expected to resume.
The central line of the Price Envelope lies around 4,166. A test of this level could end the corrective phase. The initial target of the subsequent decline is 4,097.
A breakout below support at 4,097 would create conditions for the wave to continue towards 4,055. If selling pressure intensifies, the next target will be 4,029.
An alternative scenario suggests consolidation above 4,166, followed by a further recovery towards 4,186 and 4,222.
For 20 October, selling after the corrective rise ends remains preferable.
XAUUSD forecast scenario
Trading scenario: SELL
- Price at the time of writing: 4,131
- Entry price: 4,126
- Stop loss: 4,167
- Take profit: 4,055
- Risk-to-reward ratio: 1:1.73
The trade idea is valid until 8:00 AM on 21 October 2026 (server time, UTC+3).
US 500 forecast
The US stock market continues to be influenced by inflation expectations, government bond yields, and corporate earnings. Investors are focusing on the outlook for Fed monetary policy and the resilience of financial results from the largest technology companies.
US inflation data released on 14 October exceeded expectations, increasing concerns about further interest rate hikes. Rising Treasury yields raise corporate financing costs and weigh on equity valuations, particularly in the technology sector.
At the start of this week, however, US indices recovered thanks to increased demand for shares in companies associated with artificial intelligence. Nevertheless, gains were largely concentrated in one sector, while broader market performance remained uneven.
Additional risks include high oil prices, geopolitical tensions and rising debt burdens associated with financing artificial intelligence infrastructure. These factors could limit the sustainability of the recovery.
The fundamental backdrop suggests the index could see short-term corrective gains, but there remains a high probability that sellers will return near significant technical resistance levels. Corporate outlooks and changes in US bond yields will be key drivers of subsequent movements.
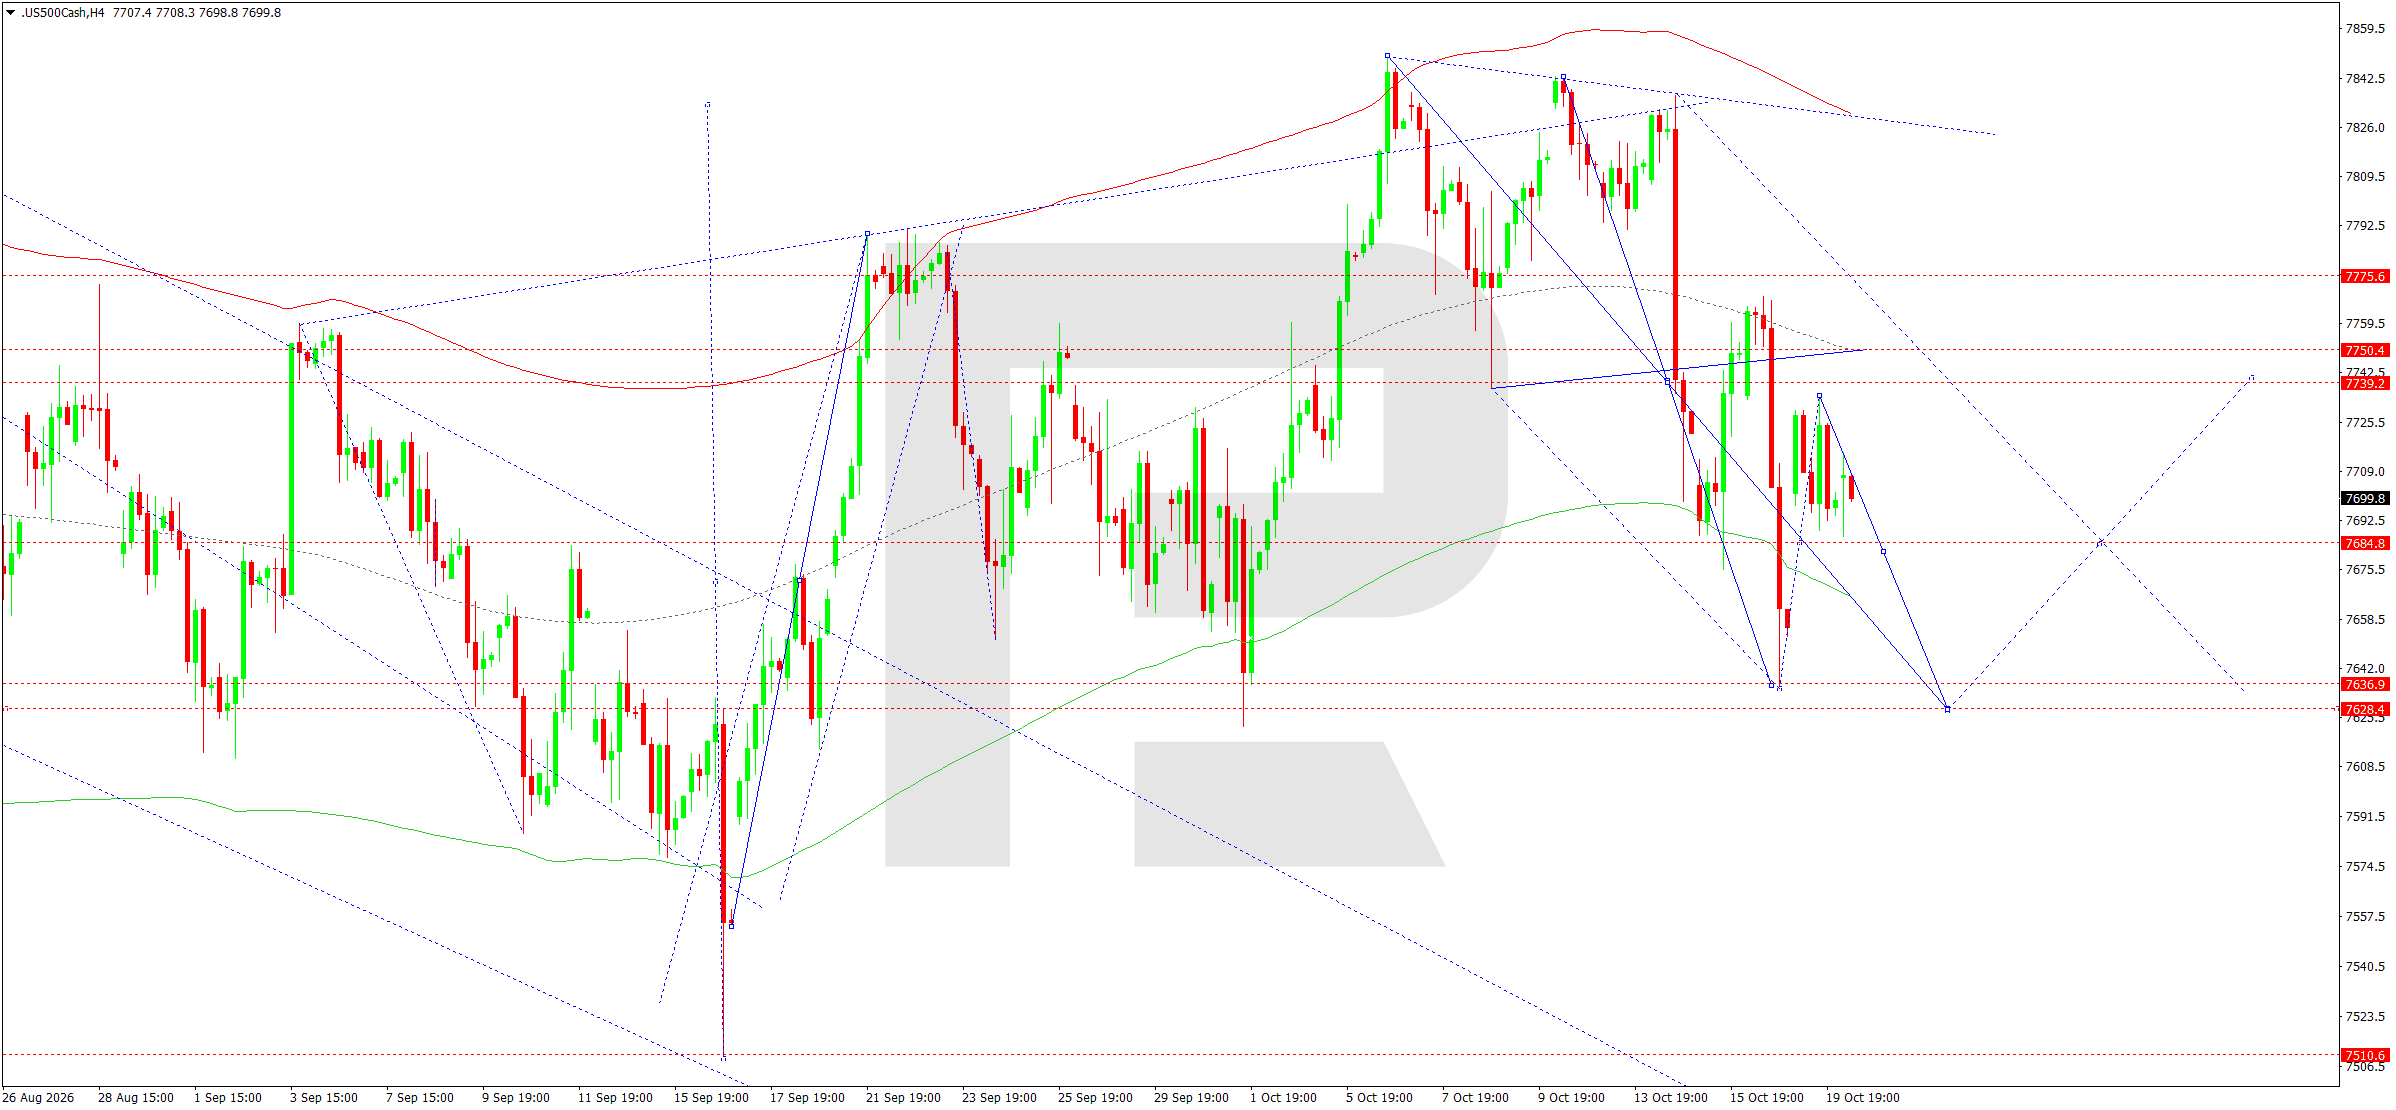
On the H4 chart, the US 500 index formed a downward wave from the 7,845 area to support at 7,687. After reaching this level, the market began to form a local consolidation range.
The matrix's key level is 7,737. It is considered the pivot of the current downward structure and the main resistance area.
The Elliott wave model allows for a short-term correction towards 7,737, followed by a renewed decline.
The central line of the Price Envelope lies around 7,737, while the nearest support is located at 7,685. A breakout below this level would open the way towards 7,637 and 7,628.
If the downward impulse intensifies further, the next target will be the 7,511 area.
An alternative scenario suggests consolidation above 7,737, allowing a recovery towards 7,750 and 7,776.
For 20 October, the main scenario remains a continued decline after the local correction ends. Sellers retain the advantage while the index trades below the matrix's central level.
US 500 forecast scenario
Trading scenario: SELL
- Price at the time of writing: 7,710
- Entry price: 7,705
- Stop loss: 7,745
- Take profit: 7,628
- Risk-to-reward ratio: 1:1.93
The trade idea is valid until 8:00 AM on 21 October 2026 (server time, UTC+3).
BTCUSD forecast
Bitcoin movements are determined by changes in global risk appetite, expectations regarding Fed monetary policy, and liquidity conditions in financial markets. The cryptocurrency sector remains sensitive to US government bond yields and technology share performance.
Elevated interest rates increase the appeal of fixed-income instruments, limiting capital inflows into more volatile assets. September's US inflation figures increased uncertainty about the Fed's future policy, creating additional obstacles to a sustained Bitcoin recovery.
Institutional demand, including investment flows through exchange-traded cryptocurrency funds, remains a significant factor. However, short-term price movements may be driven not only by fundamentals but also by liquidations of positions in the derivatives market.
At the start of the week, Bitcoin showed a limited recovery amid improved sentiment in the technology sector, but rising US bond yields constrained the upward impulse.
Geopolitical uncertainty and stock index fluctuations continue to increase cryptocurrency volatility. In the short term, the fundamental backdrop remains mixed, and the durability of the recovery will depend on changes in dollar liquidity and renewed demand from large investors.
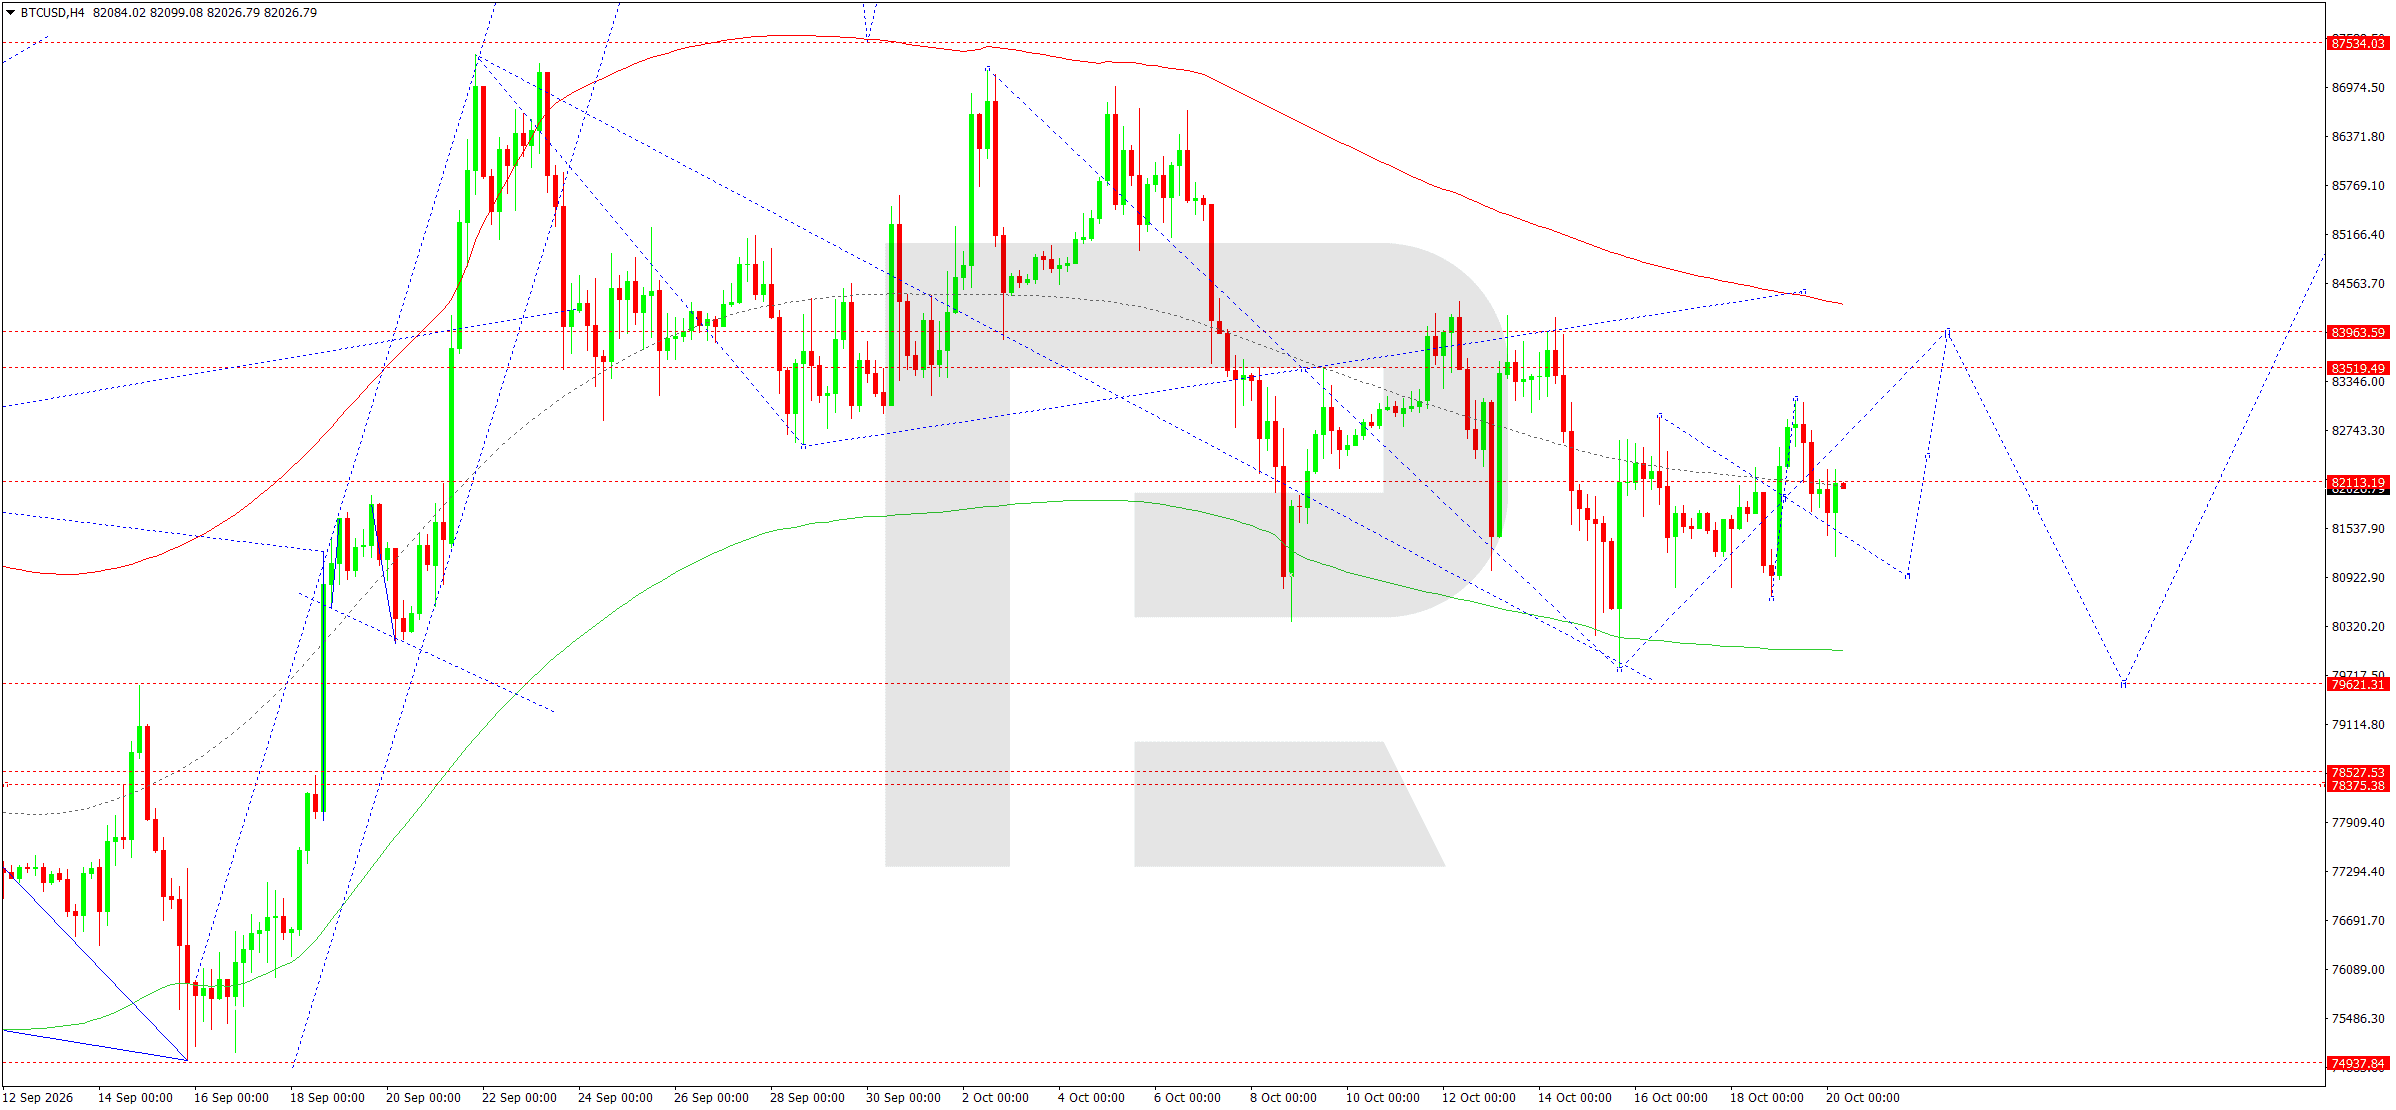
On the H4 chart, BTCUSD formed a corrective structure following a decline from the 87,000 area. Current movements feature a consolidation range near 82,113.
The downward wave matrix's key level is 83,505. It defines the central resistance area and remains important for assessing the next direction of the market.
The Elliott wave structure suggests continued corrective growth towards 83,519 and 83,963. The latter level coincides with the upper area of the current corrective range.
Once the recovery ends, another downward wave is expected to form, initially targeting 80,923.
A breakout below this support would open the way towards the lower boundary of the Price Envelope at 79,621. If selling pressure intensifies, subsequent targets will be 78,528 and 78,375.
An alternative scenario suggests consolidation above 83,963, creating conditions for a recovery towards 84,564.
For 20 October, selling once the corrective structure ends remains preferable. The main bearish scenario remains valid while prices stay below key resistance at 83,963.
BTCUSD forecast scenario
Trading scenario: SELL
- Price at the time of writing: 81,791
- Entry price: 81,786
- Stop loss: 82,750
- Take profit: 79,621
- Risk-to-reward ratio: 1:2.25
The trade idea is valid until 8:00 AM on 21 October 2026 (server time, UTC+3).
Editors’ picks


EURUSD forecast 2026–2027: technical analysis, price levels & predictions
The EURUSD outlook for 2026 and 2027: key levels on the daily chart, three trading scenarios and the policy gap between the Fed and the ECB that drives the pair.

Gold (XAUUSD) forecast 2026: technical analysis, price levels & predictions
Where gold could trade in 2026: key levels, three trading scenarios with entry triggers and the forecasts from J.P. Morgan, Deutsche Bank and Goldman Sachs.
Forecasts presented in this section only reflect the author’s private opinion and should not be considered as guidance for trading. RoboForex bears no responsibility for trading results based on trading recommendations described in these analytical reviews.