
Daily technical analysis and forecast for 21 October 2026
Daily technical analysis and forecast for EURUSD, USDJPY, GBPUSD, AUDUSD, USDCAD, XAUUSD, US 500, and BTCUSD for 21 October 2026.
Each scenario on this page reflects the market structure on the H4 chart as of 10:00 UTC+3 on 21 October 2026. The assessment considers the current H4 chart structure, key support and resistance levels, the direction of the medium-term movement, and the prevailing fundamental backdrop.
EURUSD forecast
EURUSD movements are shaped by expectations regarding the European Central Bank and the Federal Reserve’s monetary policies. The main factor is the assessment of interest rate prospects in light of inflation, labour market conditions, and business activity. The resilience of the US economy could support US Treasury yields and strengthen the dollar, limiting a recovery in the European currency.
Industrial production figures, Purchasing Managers' Indices (PMIs), and conditions in the eurozone's largest economies are also significant for the euro. Weakness in manufacturing increases the risk of slower economic growth and could encourage investors to remain cautious about the European currency.
Market participants are also assessing geopolitical risks, changes in energy prices, and overall demand for safe-haven assets. During periods of heightened uncertainty, the dollar may receive additional support from its status as a reserve currency. At the same time, lower US bond yields could create conditions for short-term corrections in EURUSD.
In the current trading session, the fundamental balance suggests heightened sensitivity to US economic data and changes in expectations about the Fed's future decisions.
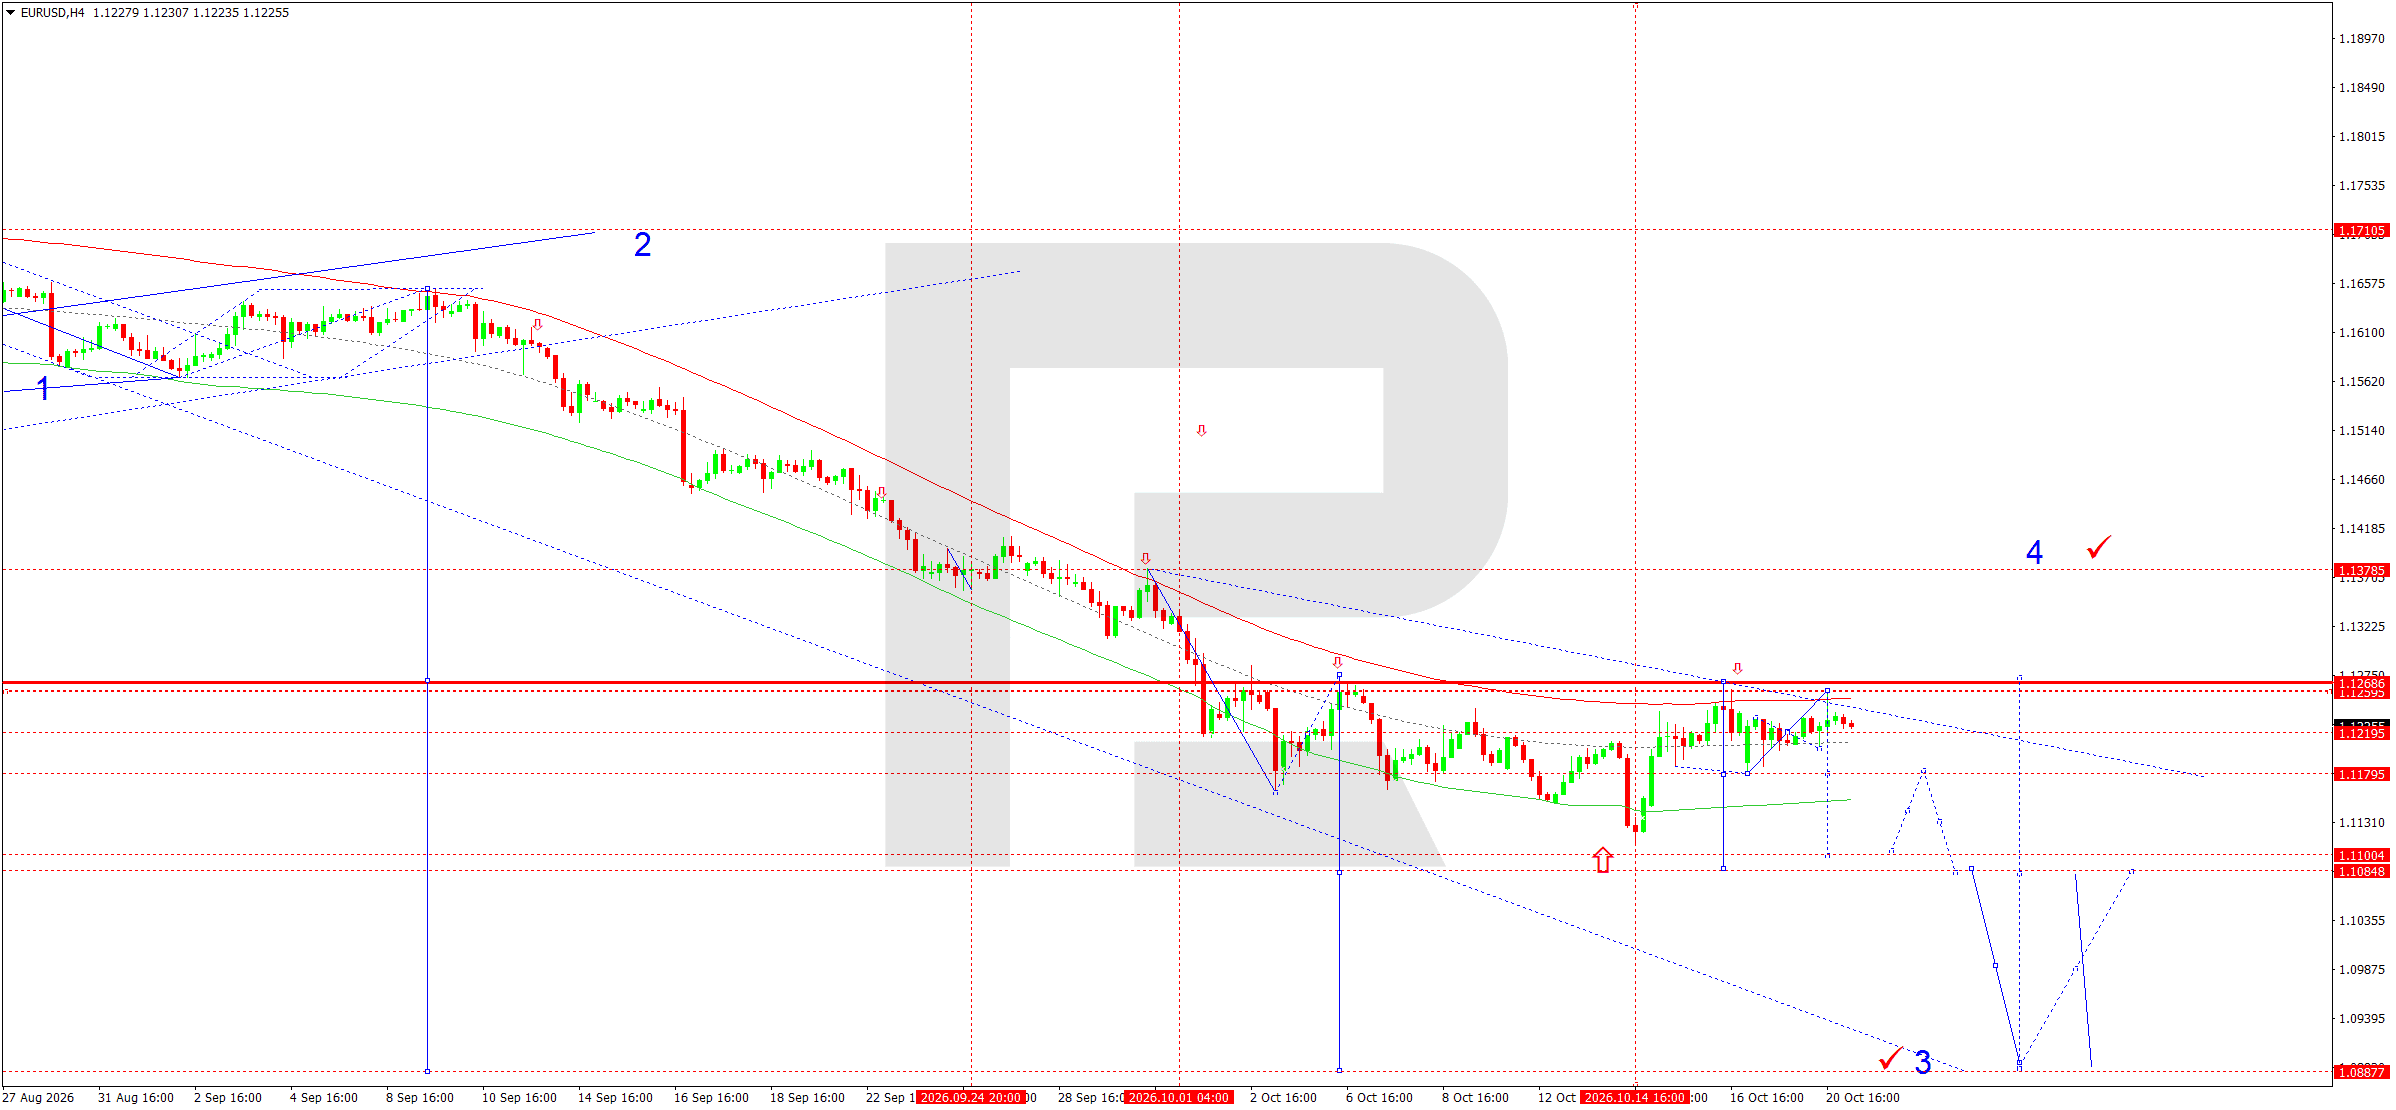
On the H4 chart, EURUSD completed a downward impulse around 1.1217 after breaking below 1.1222. A broad consolidation range is now forming, which is viewed as a potential continuation pattern within the downtrend.
The key resistance is the matrix pivot at 1.1266. As long as the price remains below this mark, sellers retain the advantage. A confirmed breakout below 1.1180 would open the way towards 1.1100 and then the lower boundary of the Price Envelope at 1.1085.
The Elliott wave structure suggests another downward impulse after the local correction ends. If selling pressure persists, a more distant target will be the 1.0800 area.
An alternative scenario involves a recovery above 1.1266 followed by a test of 1.1379.
EURUSD forecast scenario
USDJPY forecast
USDJPY remains dependent on the interest rate differential between the US and Japan. The monetary policies of the Bank of Japan and the Fed remain the decisive factors in the instrument's medium-term movements. Higher US government bond yields traditionally support the dollar against the yen, while a narrowing interest rate differential could strengthen the Japanese currency.
Market participants are paying particular attention to Japanese inflation data, wage trends and the resilience of domestic consumer demand. These indicators influence expectations regarding further normalisation of BOJ monetary conditions. For the dollar, US employment figures, inflation expectations and changes in ten-year Treasury yields are important.
The possibility of currency intervention by the Japanese authorities during sharp exchange rate fluctuations remains another factor. As USDJPY approaches psychologically significant price levels, the market may become more sensitive to official statements.
Global risk appetite also influences the pair. Reduced investor interest in risk assets could stimulate demand for the yen. If financial conditions remain favourable, the US currency may retain its advantage.
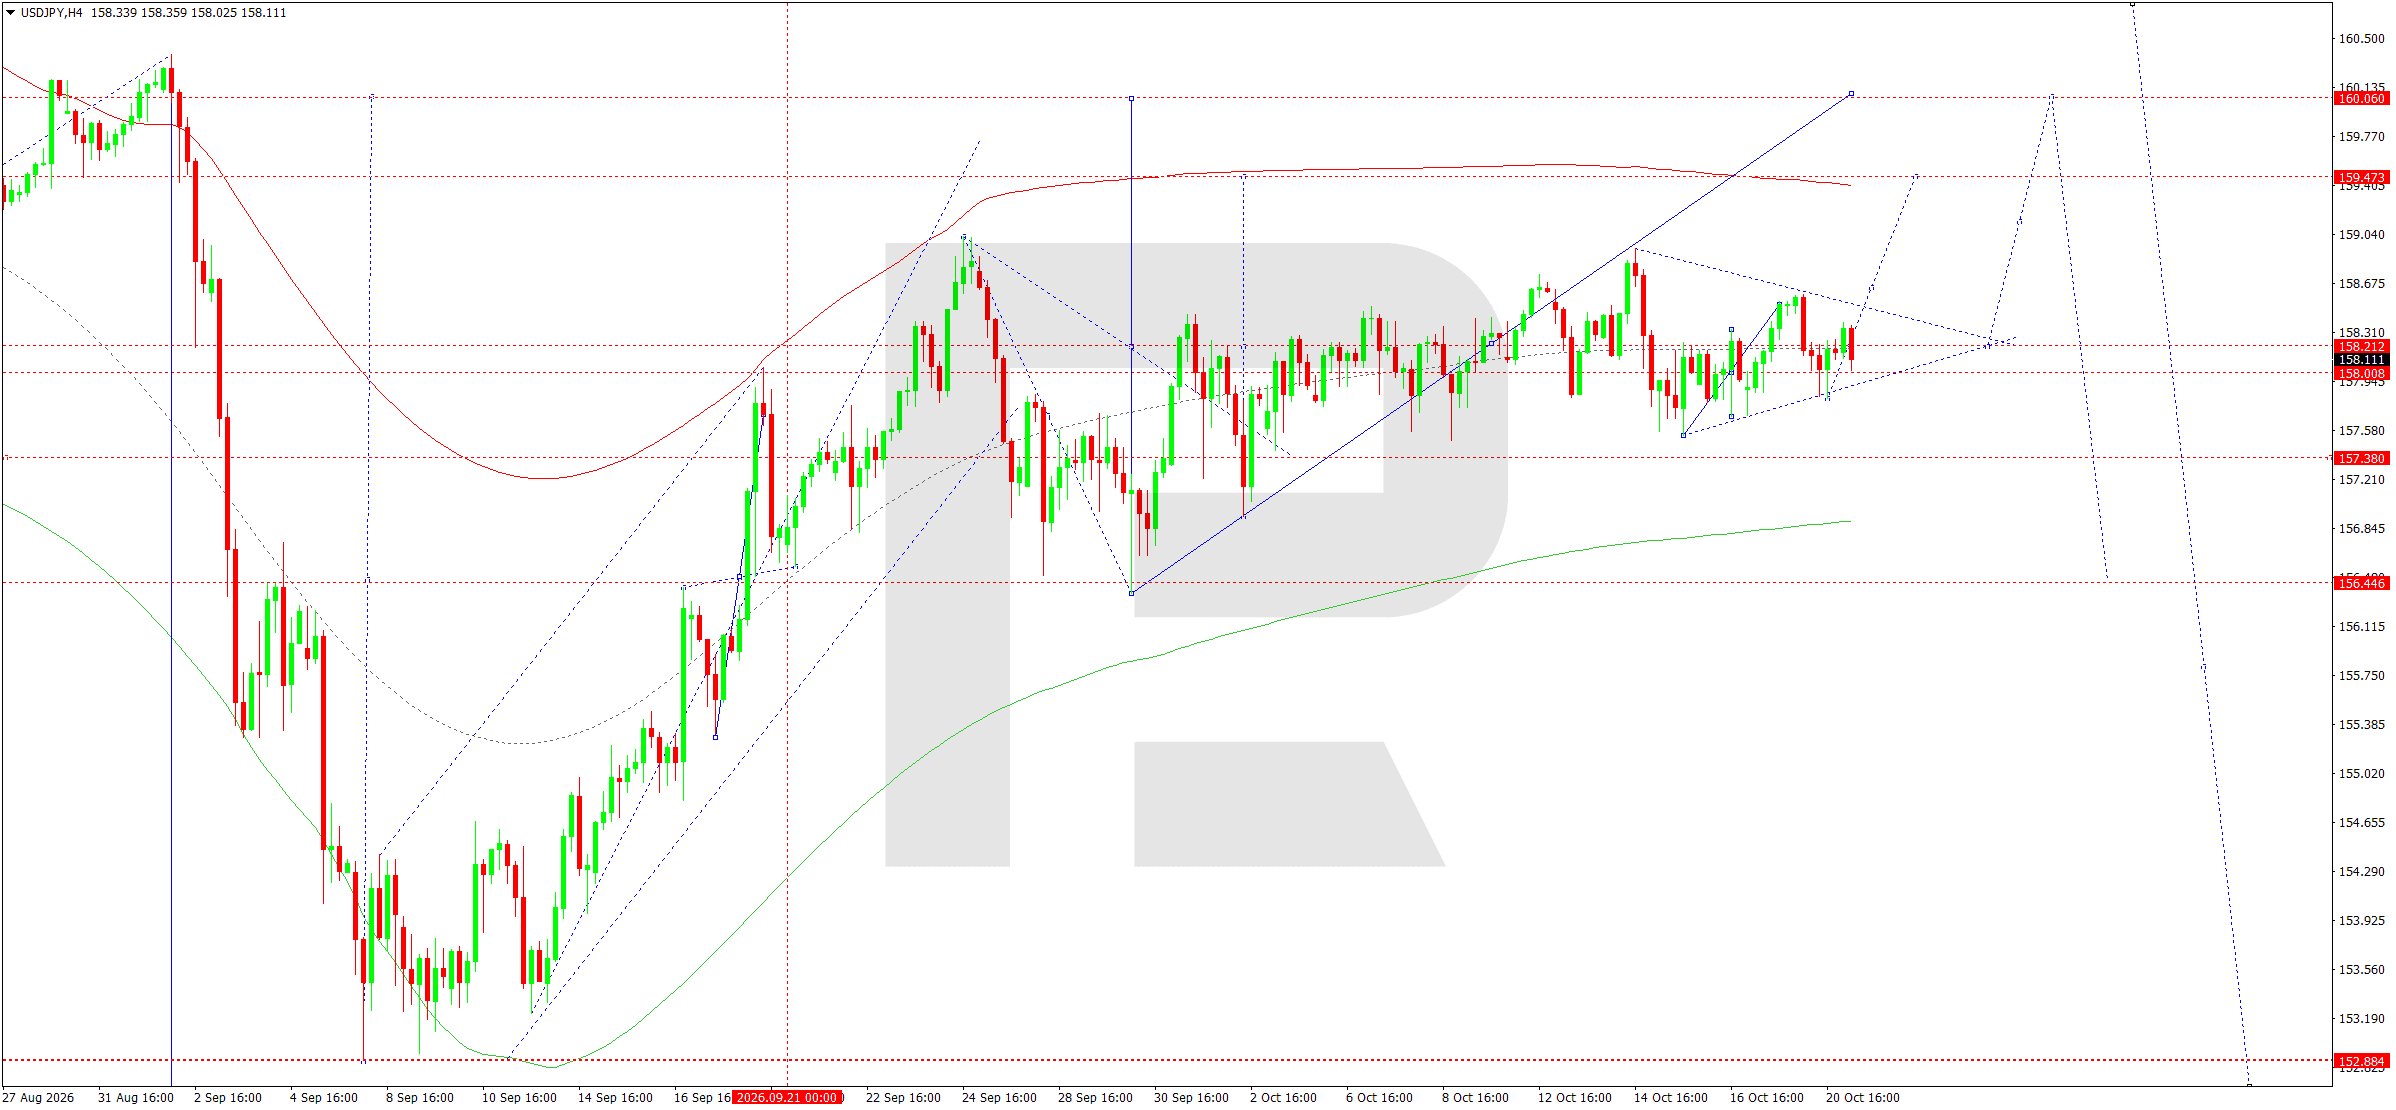
On the H4 chart, USDJPY formed an upward wave towards 158.58 before correcting to 157.83. It is currently consolidating above local support, creating conditions for further growth.
The matrix pivot is at 158.00. Holding this level confirms that the bullish structure remains intact. The central line of the Price Envelope runs through 158.21, providing the nearest reference point for further price movement.
Consolidation above 158.21 would allow growth to continue towards 159.47–159.54. A breakout above this area would open the possibility of reaching the upper boundary of the Envelope at 160.06. After the upward impulse ends, a correction towards 158.28 is possible.
The Elliott wave structure is consistent with a scenario of continued growth after a local correction. A decline below 157.83 would weaken buyers and increase the likelihood of a move towards 157.36.
USDJPY forecast scenario
GBPUSD forecast
Sterling remains sensitive to UK inflation figures and expectations regarding Bank of England monetary policy. Data released on 21 October showed annual inflation accelerating to 3.5% in September, strengthening the case for maintaining restrictive financial conditions. At the same time, public borrowing figures limit market participants' optimism about the sustainability of the UK's public finances.
The forthcoming UK Budget on 28 October is another significant factor. Investors are assessing public spending plans, tax policy, and movements in UK government bond yields. Higher debt servicing costs could increase uncertainty about sterling's prospects.
A major external factor remains the strength of the US dollar amid high Treasury yields. Persistent inflationary pressure linked to expensive energy limits the scope for rapid policy easing by leading central banks.
In the short term, the fundamental backdrop remains mixed. Higher UK inflation supports sterling through interest rate expectations, but a strong dollar and fiscal risks could limit GBPUSD gains.
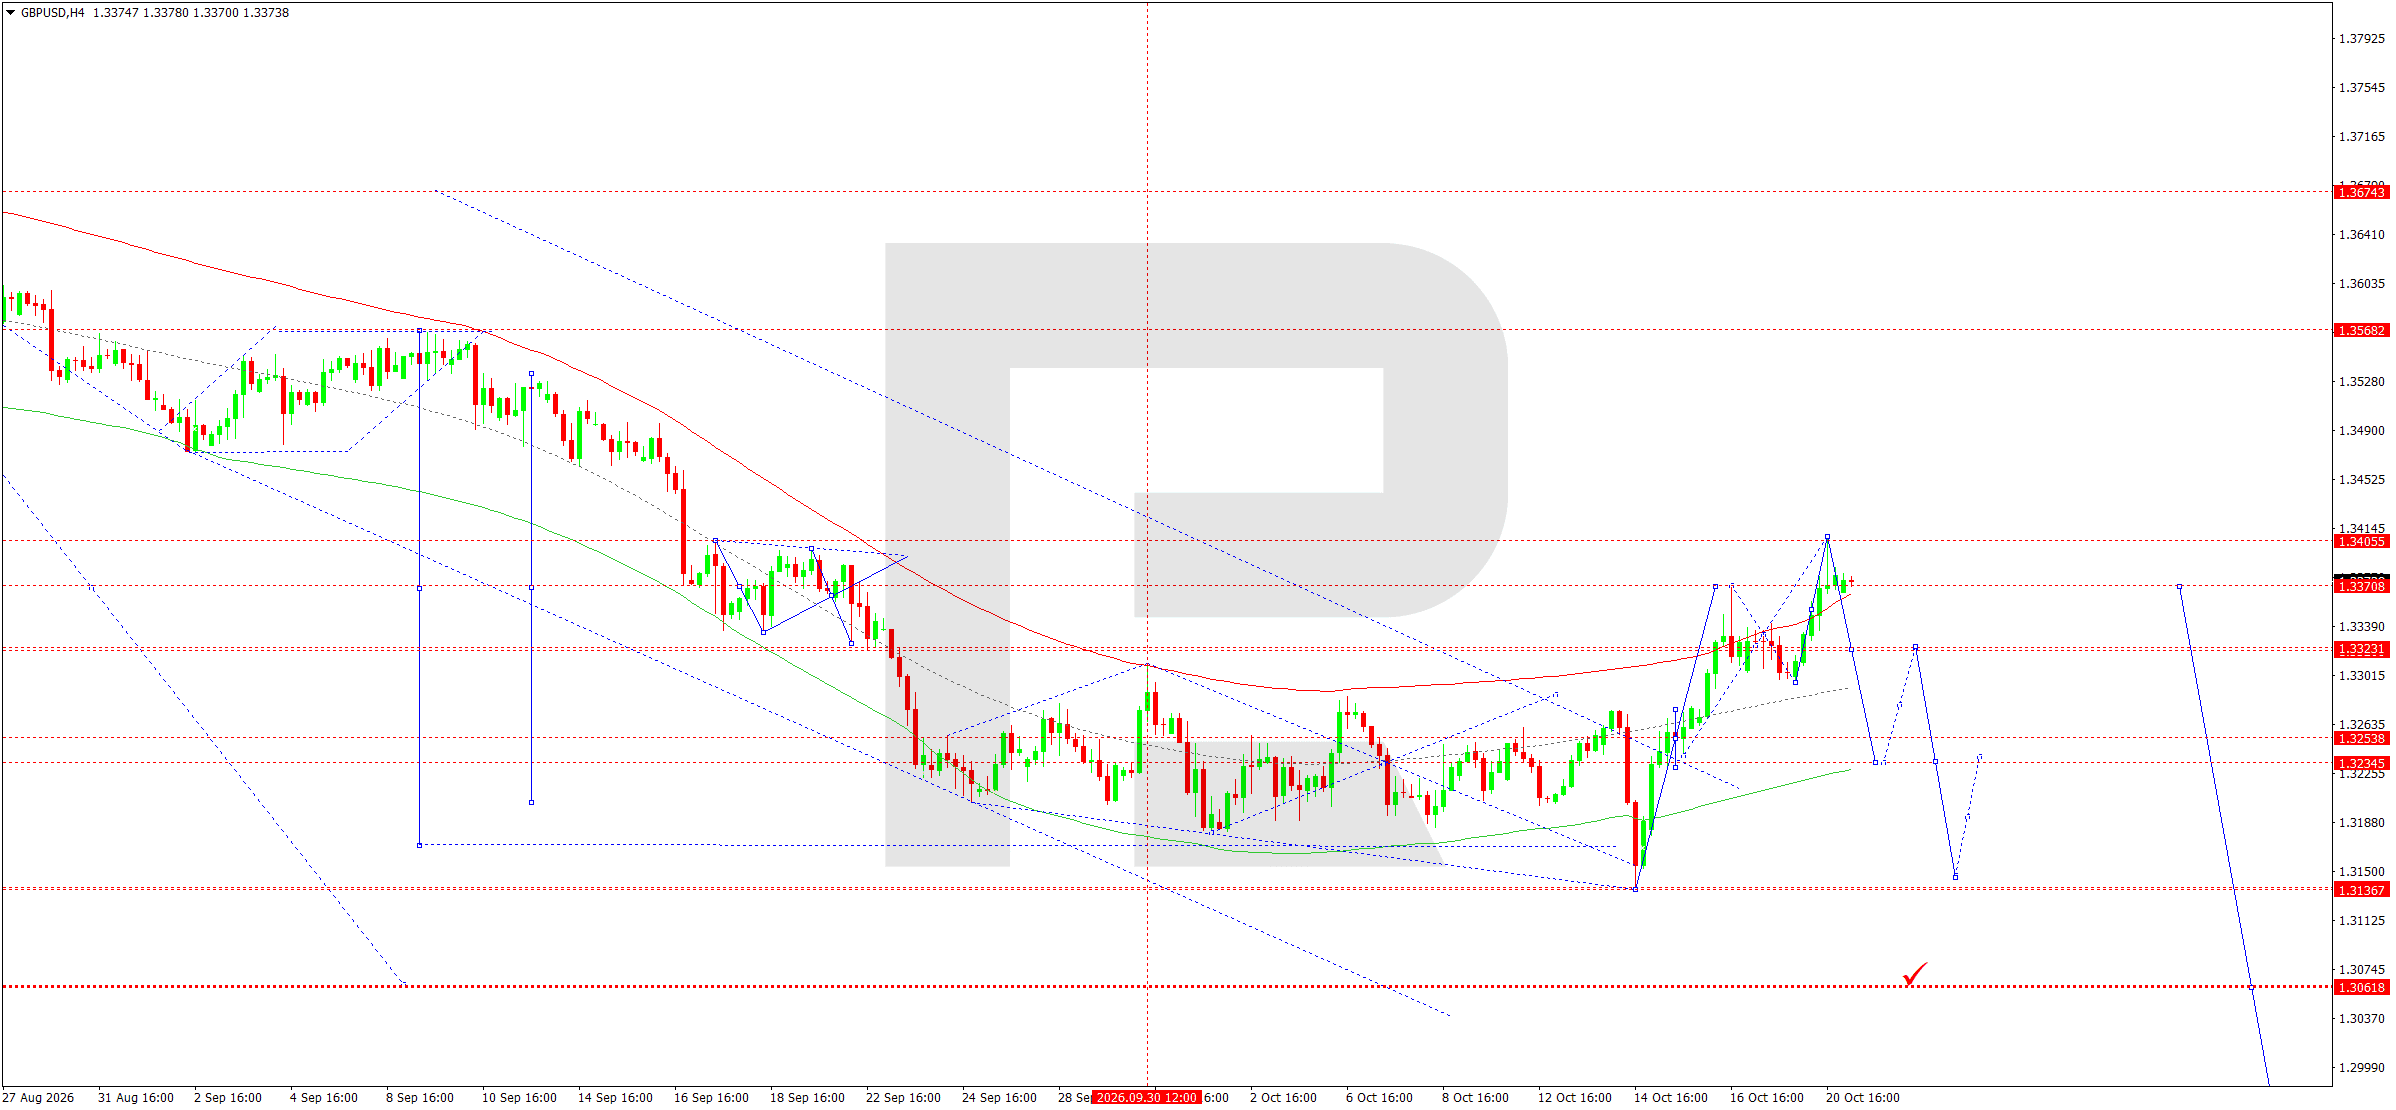
On the H4 chart, GBPUSD formed a corrective upward wave after reaching a local low. The price recovered towards 1.3405, corresponding to the upper boundary of the Price Envelope, before entering consolidation near 1.3370.
The matrix pivot is at 1.3370. This level defines the immediate balance between buyers and sellers. As long as the price remains below resistance at 1.3405, the preferred scenario is the formation of another downward wave.
The Elliott wave structure allows for the corrective recovery to end, followed by a downward impulse. The initial targets are 1.3323 and 1.3258. A breakout below the latter level would open the way towards 1.3137 and then 1.3062.
Consolidation above 1.3405 would signal a weakening bearish scenario and open the door for a more prolonged upward correction. Today's focus is on the price reaction around 1.3370.
GBPUSD forecast scenario
AUDUSD forecast
The Australian dollar is influenced by global demand for risk assets, commodity market movements and expectations regarding Reserve Bank of Australia policy. Inflation remains particularly important in determining the outlook for interest rates and the appeal of Australian assets to international investors.
Conditions in the Chinese economy are another factor, as China remains Australia's most important trading partner. Published third-quarter Chinese GDP growth figures indicate that economic activity is holding up, although the sustainability of domestic demand remains in question. Changes in demand for iron ore and other export commodities could directly affect the Australian dollar.
International markets remain uncertain amid high oil prices and geopolitical tensions in the Middle East. Rising energy costs increase inflation risks and could constrain demand for currencies sensitive to the global economic cycle.
On the other hand, lower US bond yields and recovering equity indices create conditions for short-term AUDUSD gains. However, if demand for the US dollar returns, the fundamental advantage could shift back to sellers of the Australian currency.
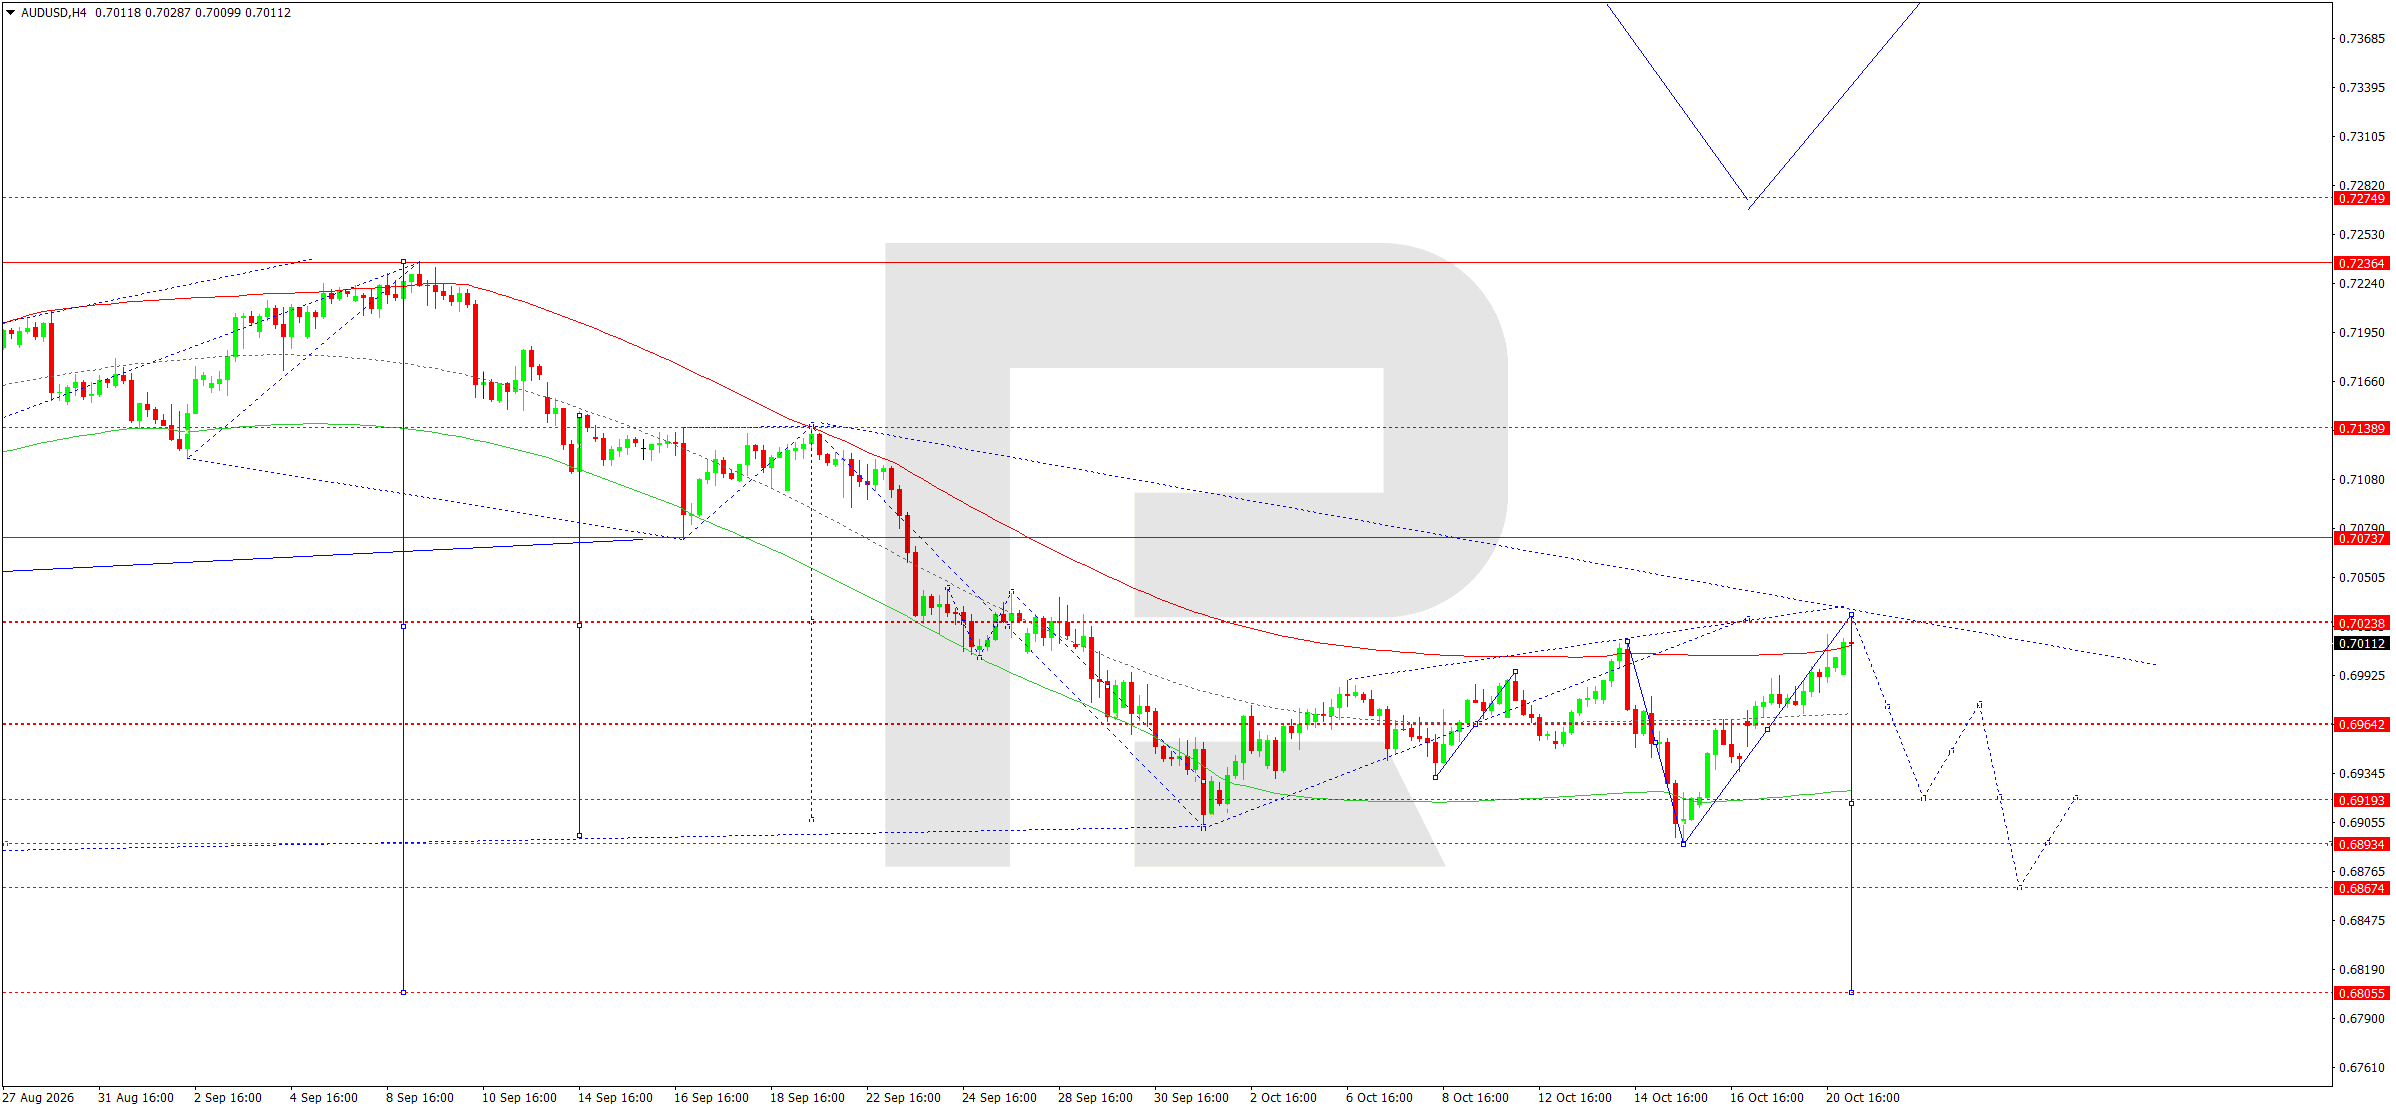
On the H4 chart, AUDUSD completed a corrective rise towards resistance at 0.7023. Consolidation formed near this level and is viewed as a potential area where the upward move could end.
The main market structure remains bearish. The matrix pivot is at 0.7023, coinciding with the upper boundary of the local Price Envelope. Buyers' failure to consolidate above this resistance level confirms the likelihood of another downward impulse.
The Elliott wave structure allows for the corrective phase to end and the main downtrend to resume. The initial target is support at 0.6954, followed by a test of the 0.6919 level.
A breakout below the lower boundary of the Envelope would open the door for a further decline towards 0.6893 and 0.6867. An alternative scenario involves consolidation above 0.7023 followed by a recovery towards 0.7074.
For the current session, selling remains preferable once resistance is confirmed.
AUDUSD forecast scenario
USDCAD forecast
The Canadian dollar is receiving support from changing expectations regarding Bank of Canada monetary policy. The latest inflation figures have increased the likelihood of another interest rate hike, as higher energy costs continue to put pressure on consumer prices.
Market estimates published on 20 October suggested an approximately 82% probability of the BoC raising rates by a quarter of a percentage point at its next meeting. At the same time, market participants are factoring in weaker employment indicators and deteriorating confidence among Canadian businesses following complications in trade negotiations with the US.
The oil market remains a significant factor. Canada's economy is sensitive to energy exports, so high oil prices could support its currency. However, sharp changes in oil prices increase short-term USDCAD volatility.
For the US dollar, Treasury yields and expectations about the Fed's next decisions remain decisive. Falling US yields could help strengthen the Canadian dollar.
As a result, the fundamental backdrop allows for a corrective recovery in USDCAD after a prolonged decline, although medium-term risks for the pair remain if expectations of tighter BoC policy increase.
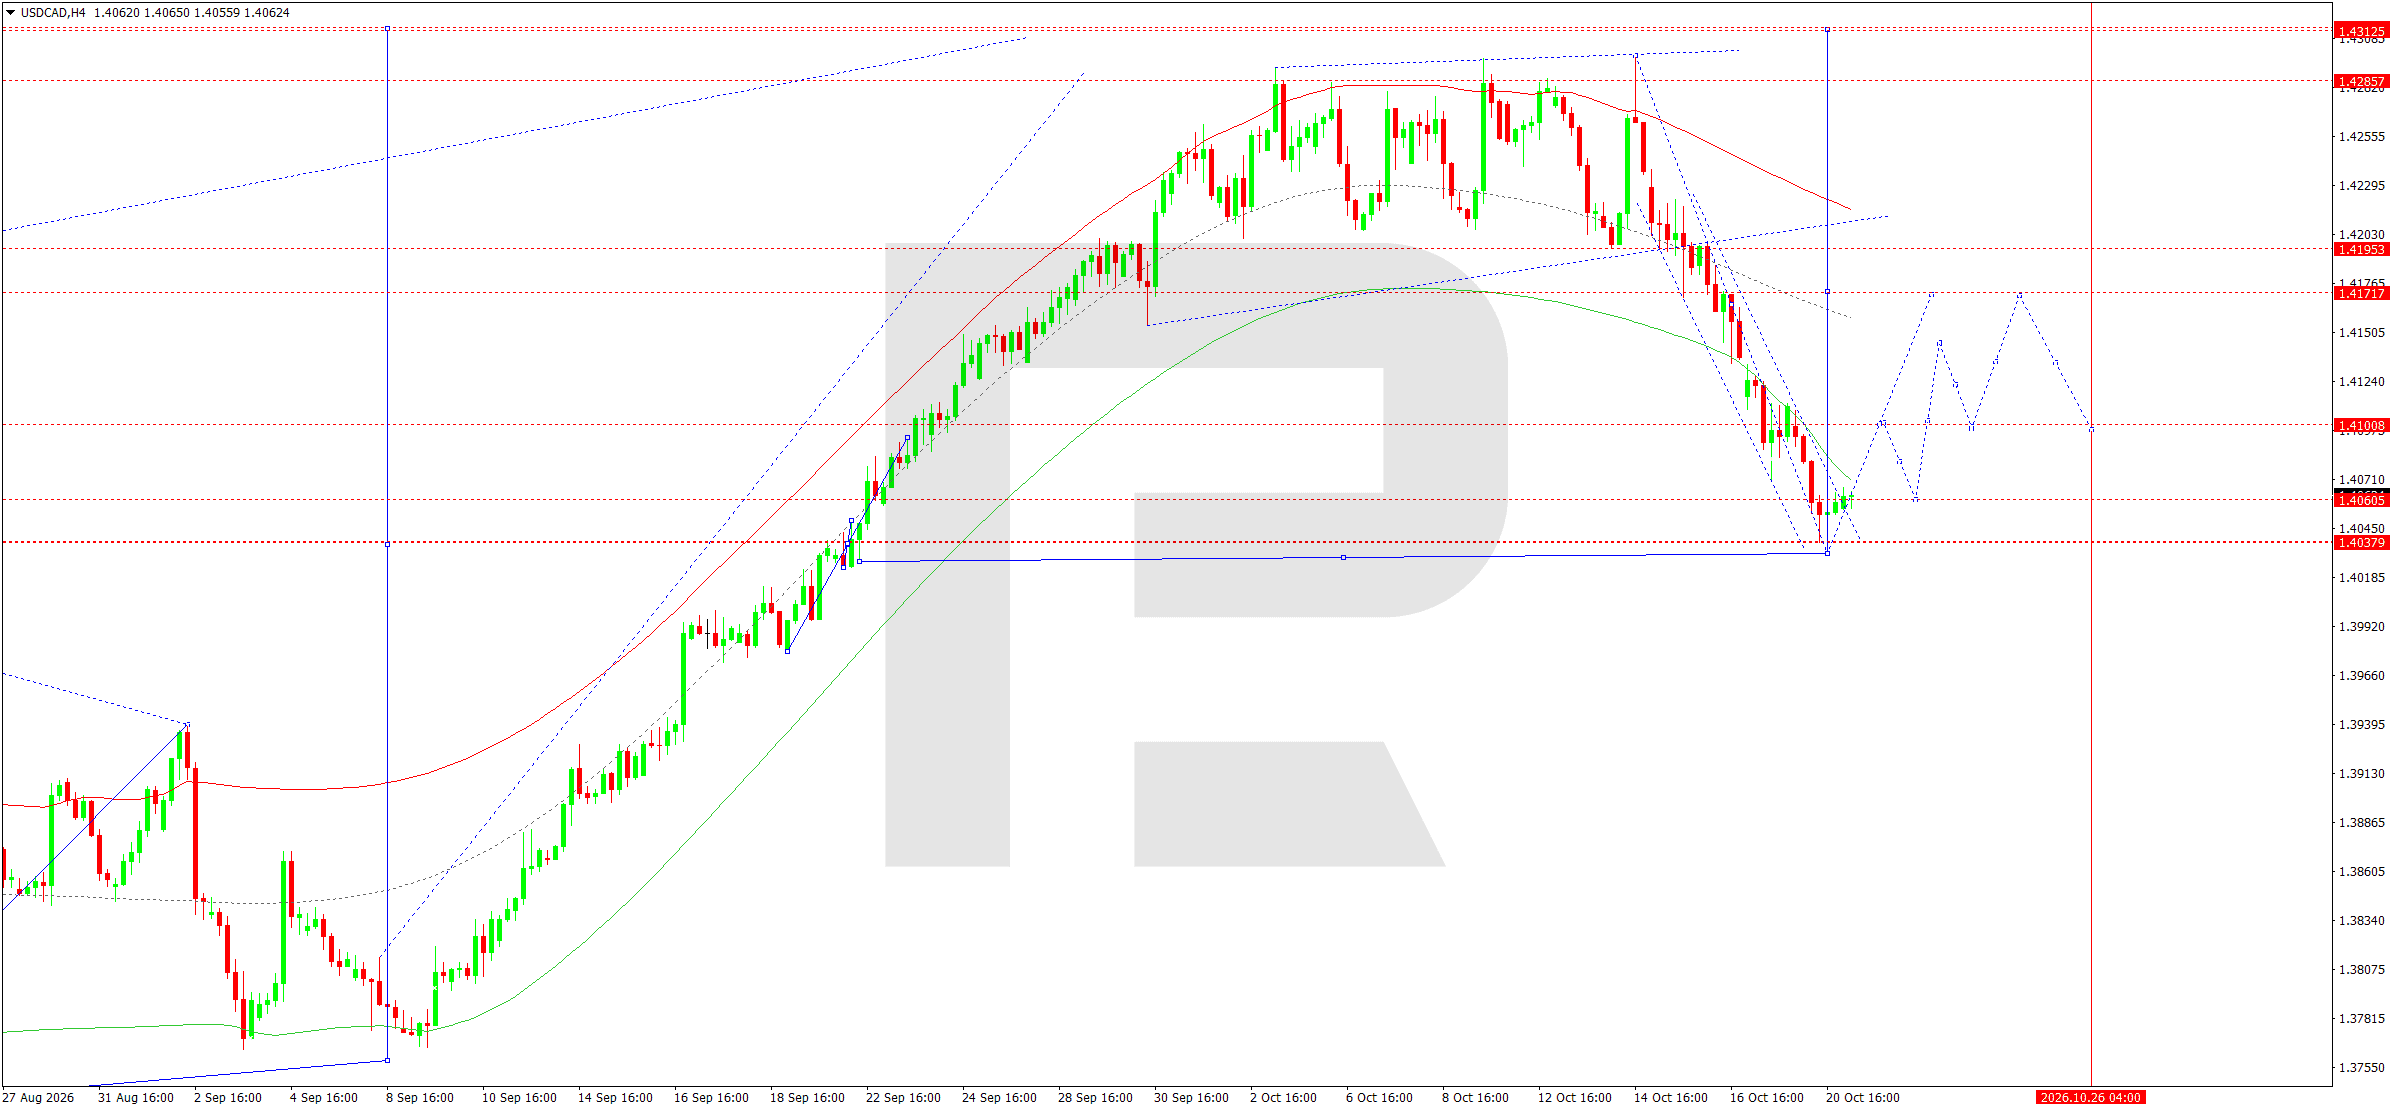
On the H4 chart, USDCAD formed a downward impulse from the 1.4286 area to the lower boundary of the Price Envelope at 1.4037. After reaching support, the market attempted a recovery, forming a local upward impulse towards 1.4067.
The matrix pivot is at 1.4171. It defines the main target for the corrective movement and also represents significant resistance within the downward wave structure.
Today, a narrow consolidation range is expected to form near 1.4067. Another decline towards 1.4040 cannot be ruled out before growth resumes.
The Elliott wave structure allows for a corrective upward phase. The initial target is 1.4101, followed by 1.4171. A breakout above this resistance would open the possibility of a recovery towards 1.4195.
Consolidation below 1.4037 would invalidate the immediate bullish scenario and increase the likelihood of further declines.
USDCAD forecast scenario
XAUUSD forecast
The gold market remains under the influence of geopolitical tensions, high energy prices, and expectations regarding the Fed's future monetary policy. Investors are focusing on the forthcoming US central bank meeting on 27–28 October and the outlook for interest rate changes.
Trading data from 20 October showed gold declining amid heightened inflation concerns. Rising oil prices reinforce expectations that restrictive monetary conditions will remain in place, putting pressure on the precious metal through high US government bond yields.
Another factor is a stronger dollar. As gold is priced in the US currency, dollar appreciation reduces the purchasing power of international market participants. At the same time, safe-haven demand persists amid the conflict in the Middle East and uncertainty surrounding the global economic outlook.
Central banks' interest in diversifying international reserves continues to support gold. However, in the short term, real interest rates and dollar movements could have a greater influence than safe-haven demand.
Thus, the fundamental backdrop allows for continued heightened volatility and a further corrective decline unless investment demand recovers sustainably.
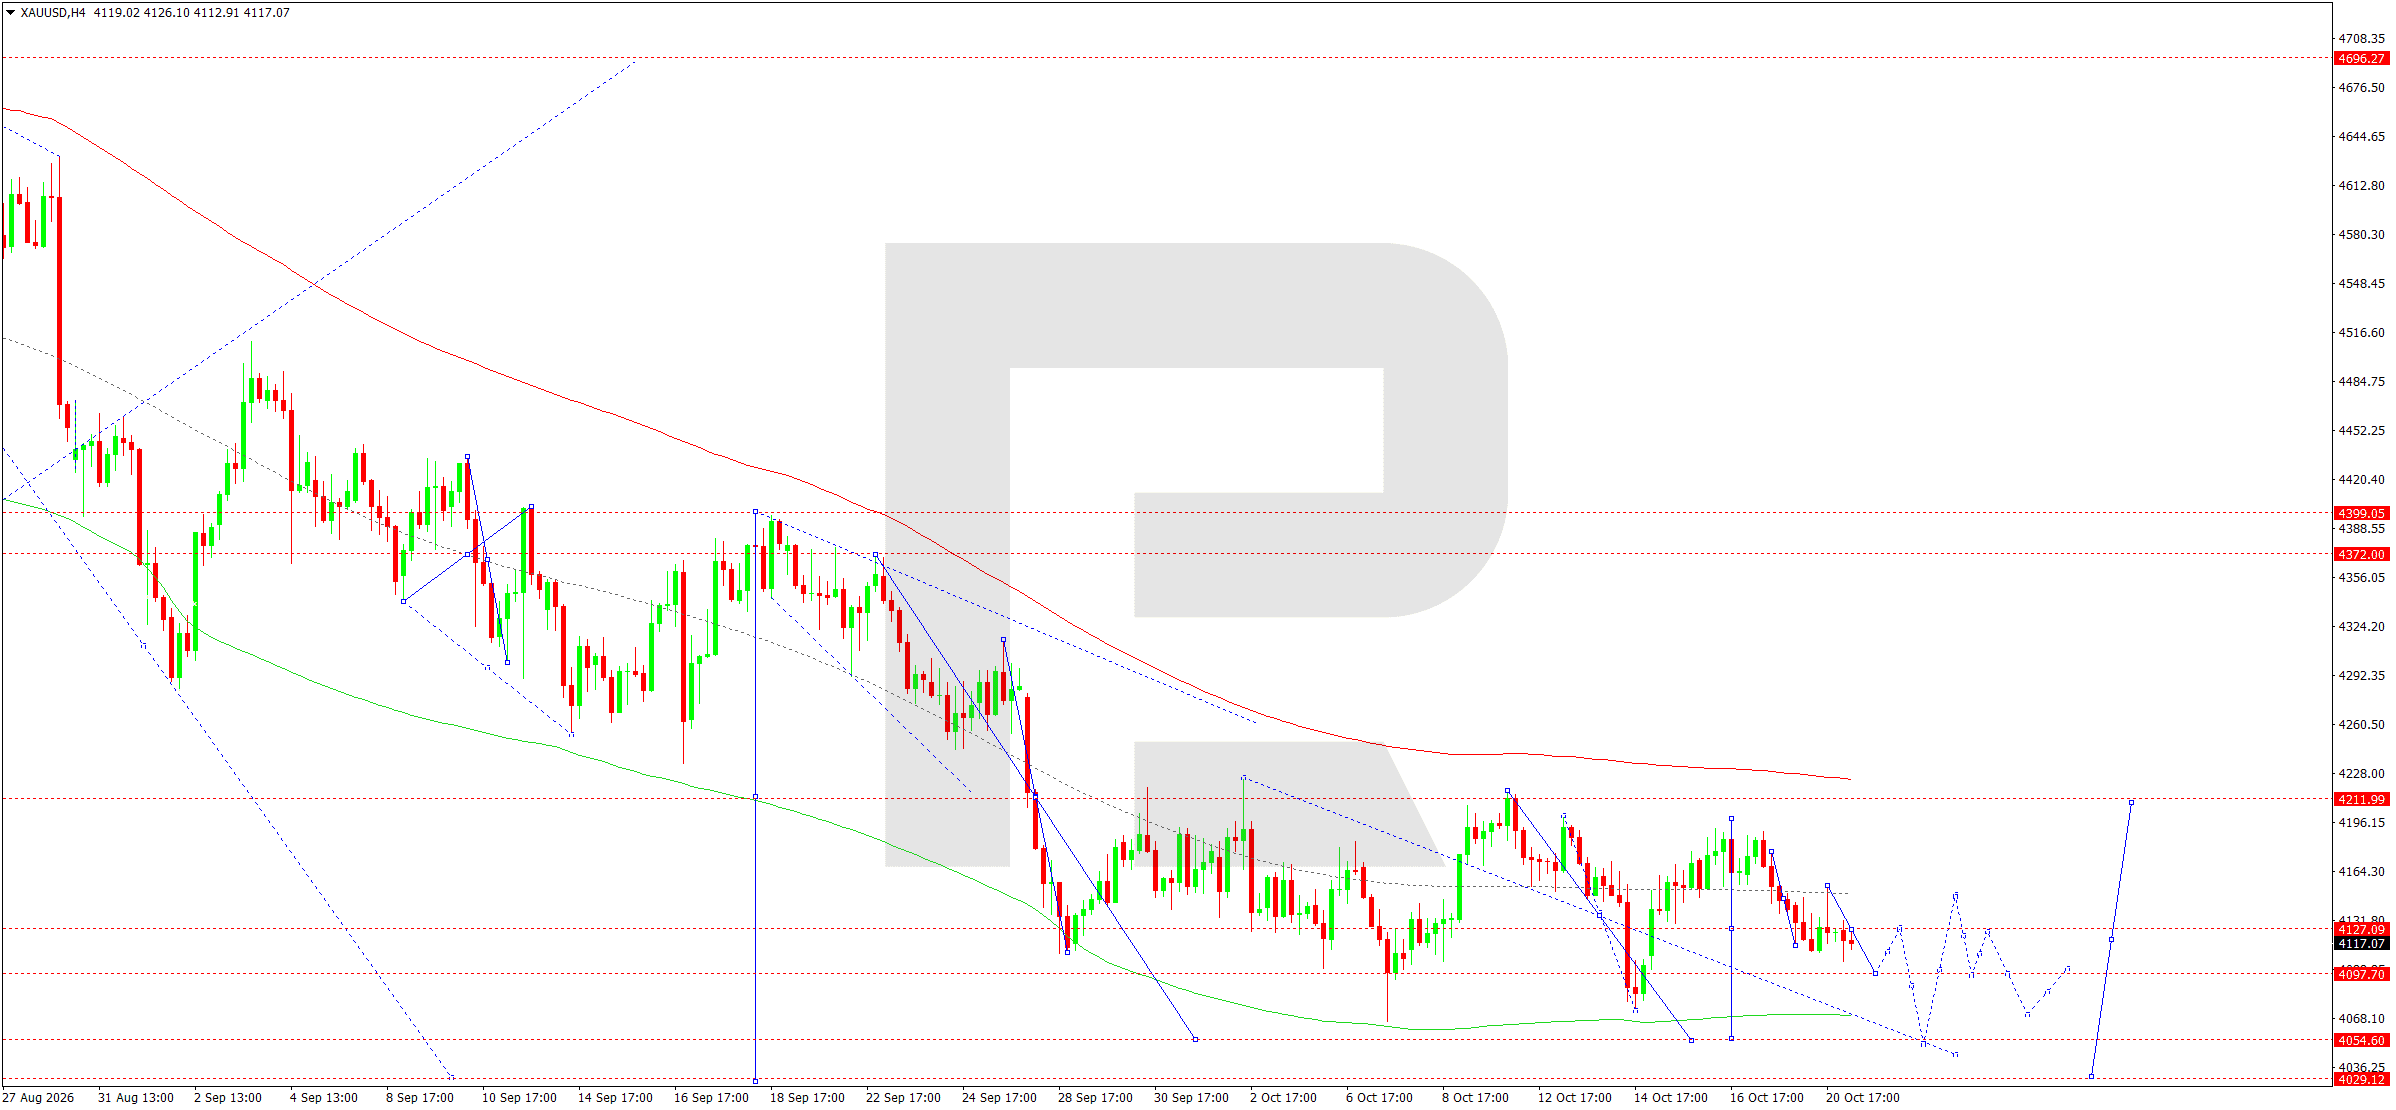
On the H4 chart, XAUUSD formed a downward wave with successive lower local lows. After reaching the 4,105 area, the market entered a narrow consolidation while selling pressure persisted.
The matrix pivot is at 4,211. This level defines the main resistance and confirms the prevailing downtrend while prices remain below it.
Gold is currently trading near the central line of the local Price Envelope. A short-term correction towards 4,127 is possible, after which the decline is expected to resume.
The Elliott wave structure allows for a final downward impulse with an initial target at 4,098. A breakout below this support level would open the way towards the lower boundary of the Envelope at 4,055.
If selling intensifies, the next target will be 4,029.
Consolidation above 4,127 would pave the way for a recovery towards 4,211 and require a reassessment of the immediate scenario.
XAUUSD forecast scenario
US 500 forecast
The US stock market remains sensitive to changes in interest rates, corporate earnings, and energy prices. Investors are focusing on the Fed's policy outlook, as high government bond yields increase the cost of capital and put pressure on equity valuations.
Trading on 20 October saw US stock indices recover following a decline in oil prices. The S&P 500 closed the session approximately 0.3% higher, supported by corporate results and improved sentiment in certain sectors.
Lower oil prices eased concerns about a further acceleration in inflation. At the same time, a decline in long-term Treasury yields created more favourable conditions for the stock market.
However, geopolitical tensions in the Middle East maintain the risk of renewed increases in energy prices. This could put fresh pressure on equities through inflation expectations and the possibility of a longer period of high interest rates.
Quarterly earnings reports from major technology companies are also significant. Investors are assessing the resilience of corporate profits, AI development spending, and potential returns on large-scale capital investment.
As a result, the fundamental picture remains mixed, suggesting further short-term corrective movements while sensitivity to macroeconomic news remains high.
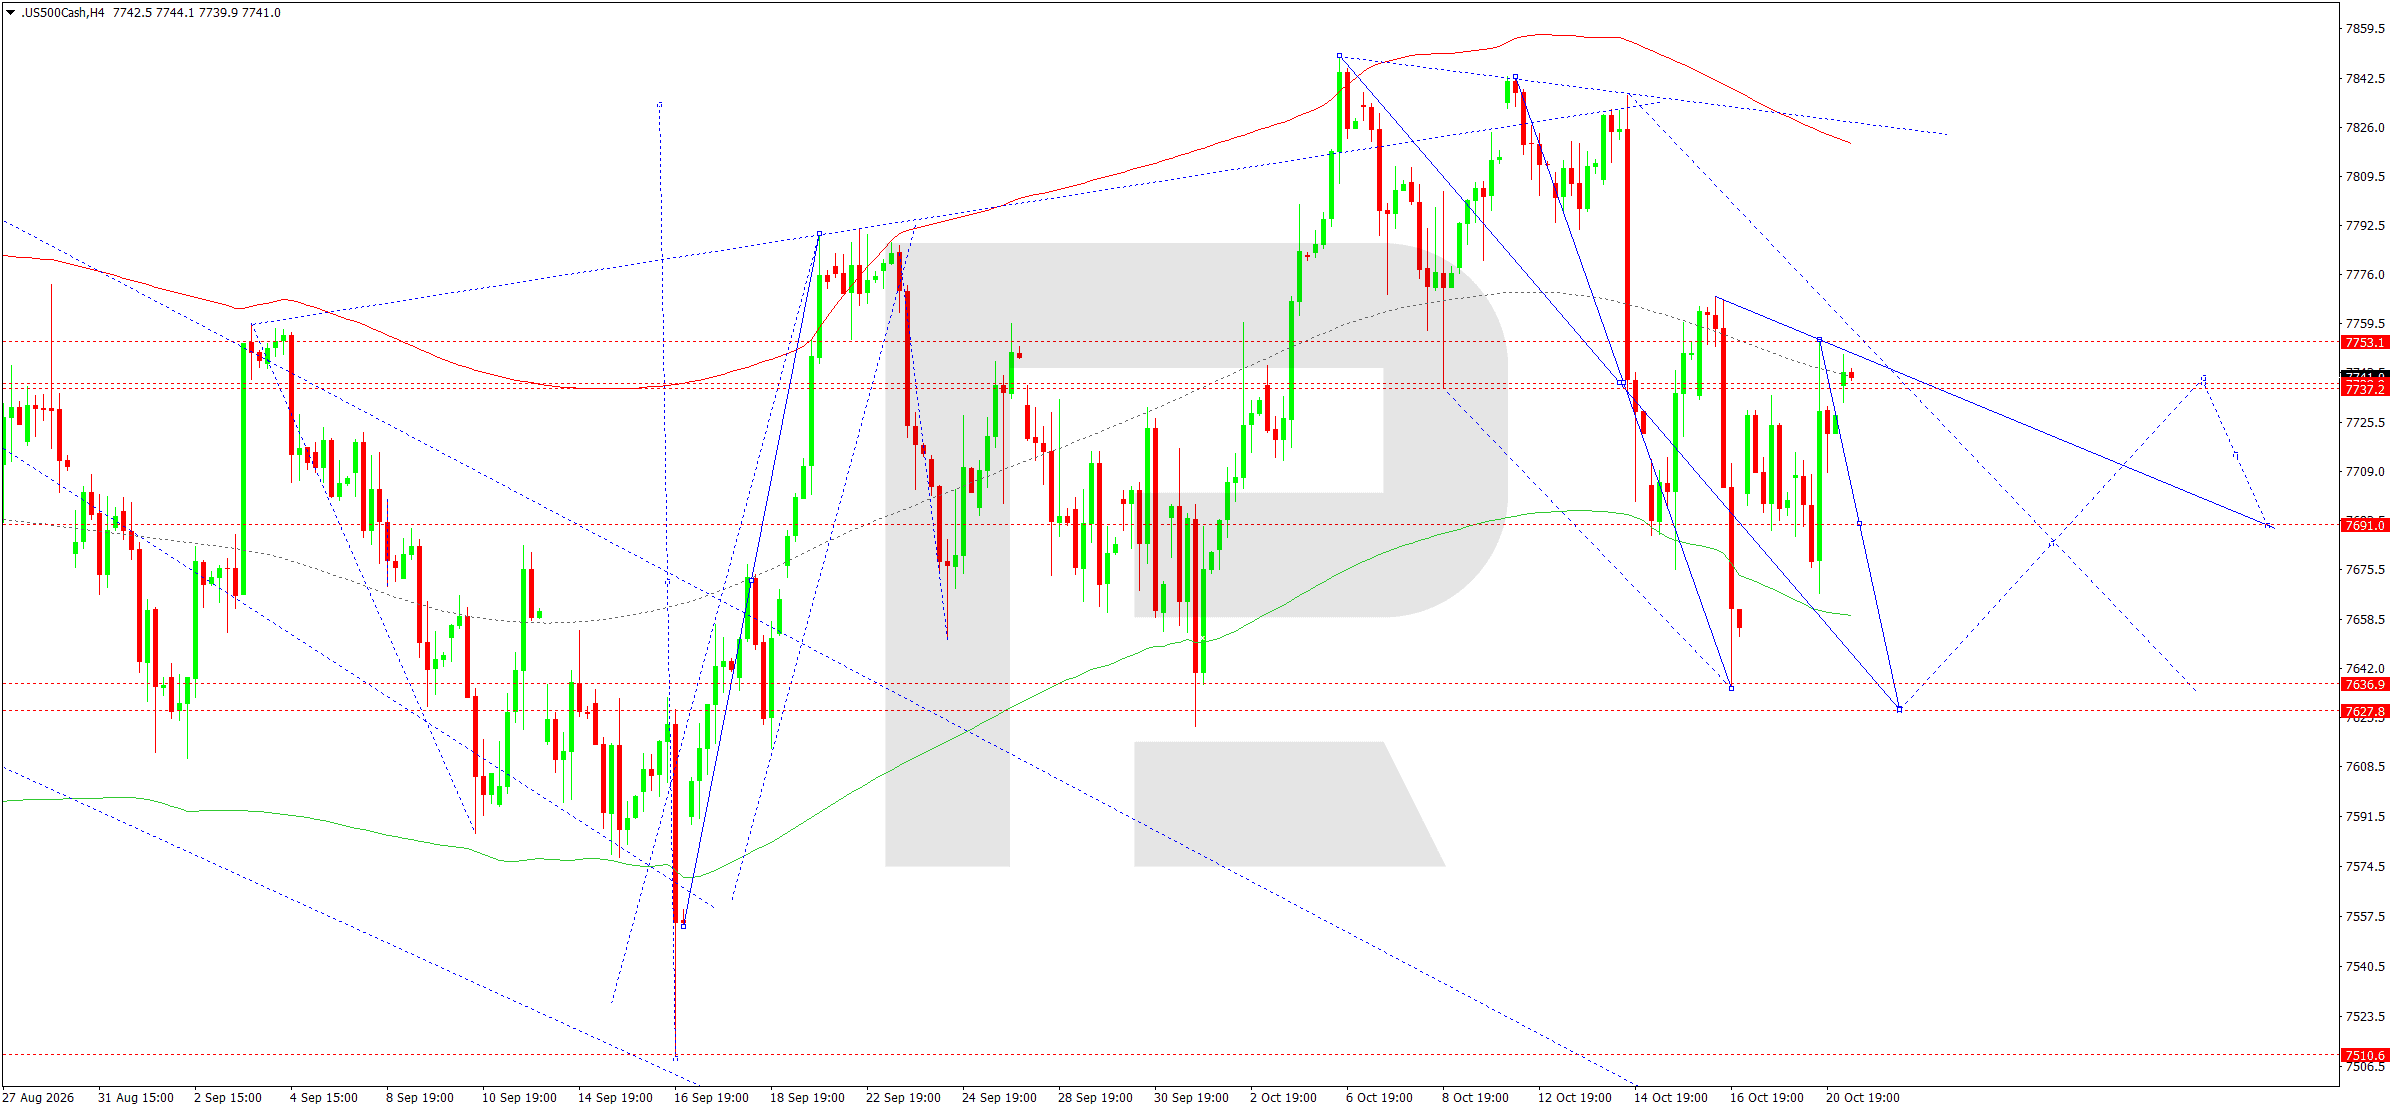
On the H4 chart, the US 500 formed a downward wave from the 7,845 area before reaching local support at 7,708. The market then entered a period of consolidation and recovery towards the nearest resistance levels.
The matrix pivot is at 7,737. It is regarded as a key reference point for determining the subsequent price structure.
The Elliott wave model allows for a corrective upward move towards 7,747, where the central line of the Price Envelope lies. Reaching this level could bring the local recovery to an end.
The main scenario remains a subsequent decline towards 7,691 and then 7,637–7,628, corresponding to the lower boundary of the calculated Envelope.
Consolidation above 7,753 would weaken the bearish scenario and create conditions for a more prolonged upward correction. Until then, selling after the recovery ends remains preferable.
US 500 forecast scenario
BTCUSD forecast
The Bitcoin market remains highly sensitive to global liquidity, US dollar movements, and changing investor risk appetite. The main macroeconomic factor is expectations regarding future Fed decisions and the outlook for US government bond yields.
High interest rates increase the appeal of fixed-income instruments and could limit capital inflows into cryptocurrencies. Conversely, lower bond yields and a recovery in US equity indices create more favourable conditions for Bitcoin demand.
Geopolitical risks and changes in oil prices also have an influence. Higher energy prices increase inflation expectations and may contribute to the continuation of restrictive monetary policy, limiting investor interest in highly volatile assets.
Institutional demand, including capital flows through exchange-traded investment products, remains an important factor within the cryptocurrency market. Sustained inflows could support prices, while reductions in investment positions increase the likelihood of a corrective move.
For the current trading session, the fundamental backdrop suggests continued heightened volatility. Bitcoin's direction will depend on changes in dollar liquidity, US bond yields and overall stock market performance.
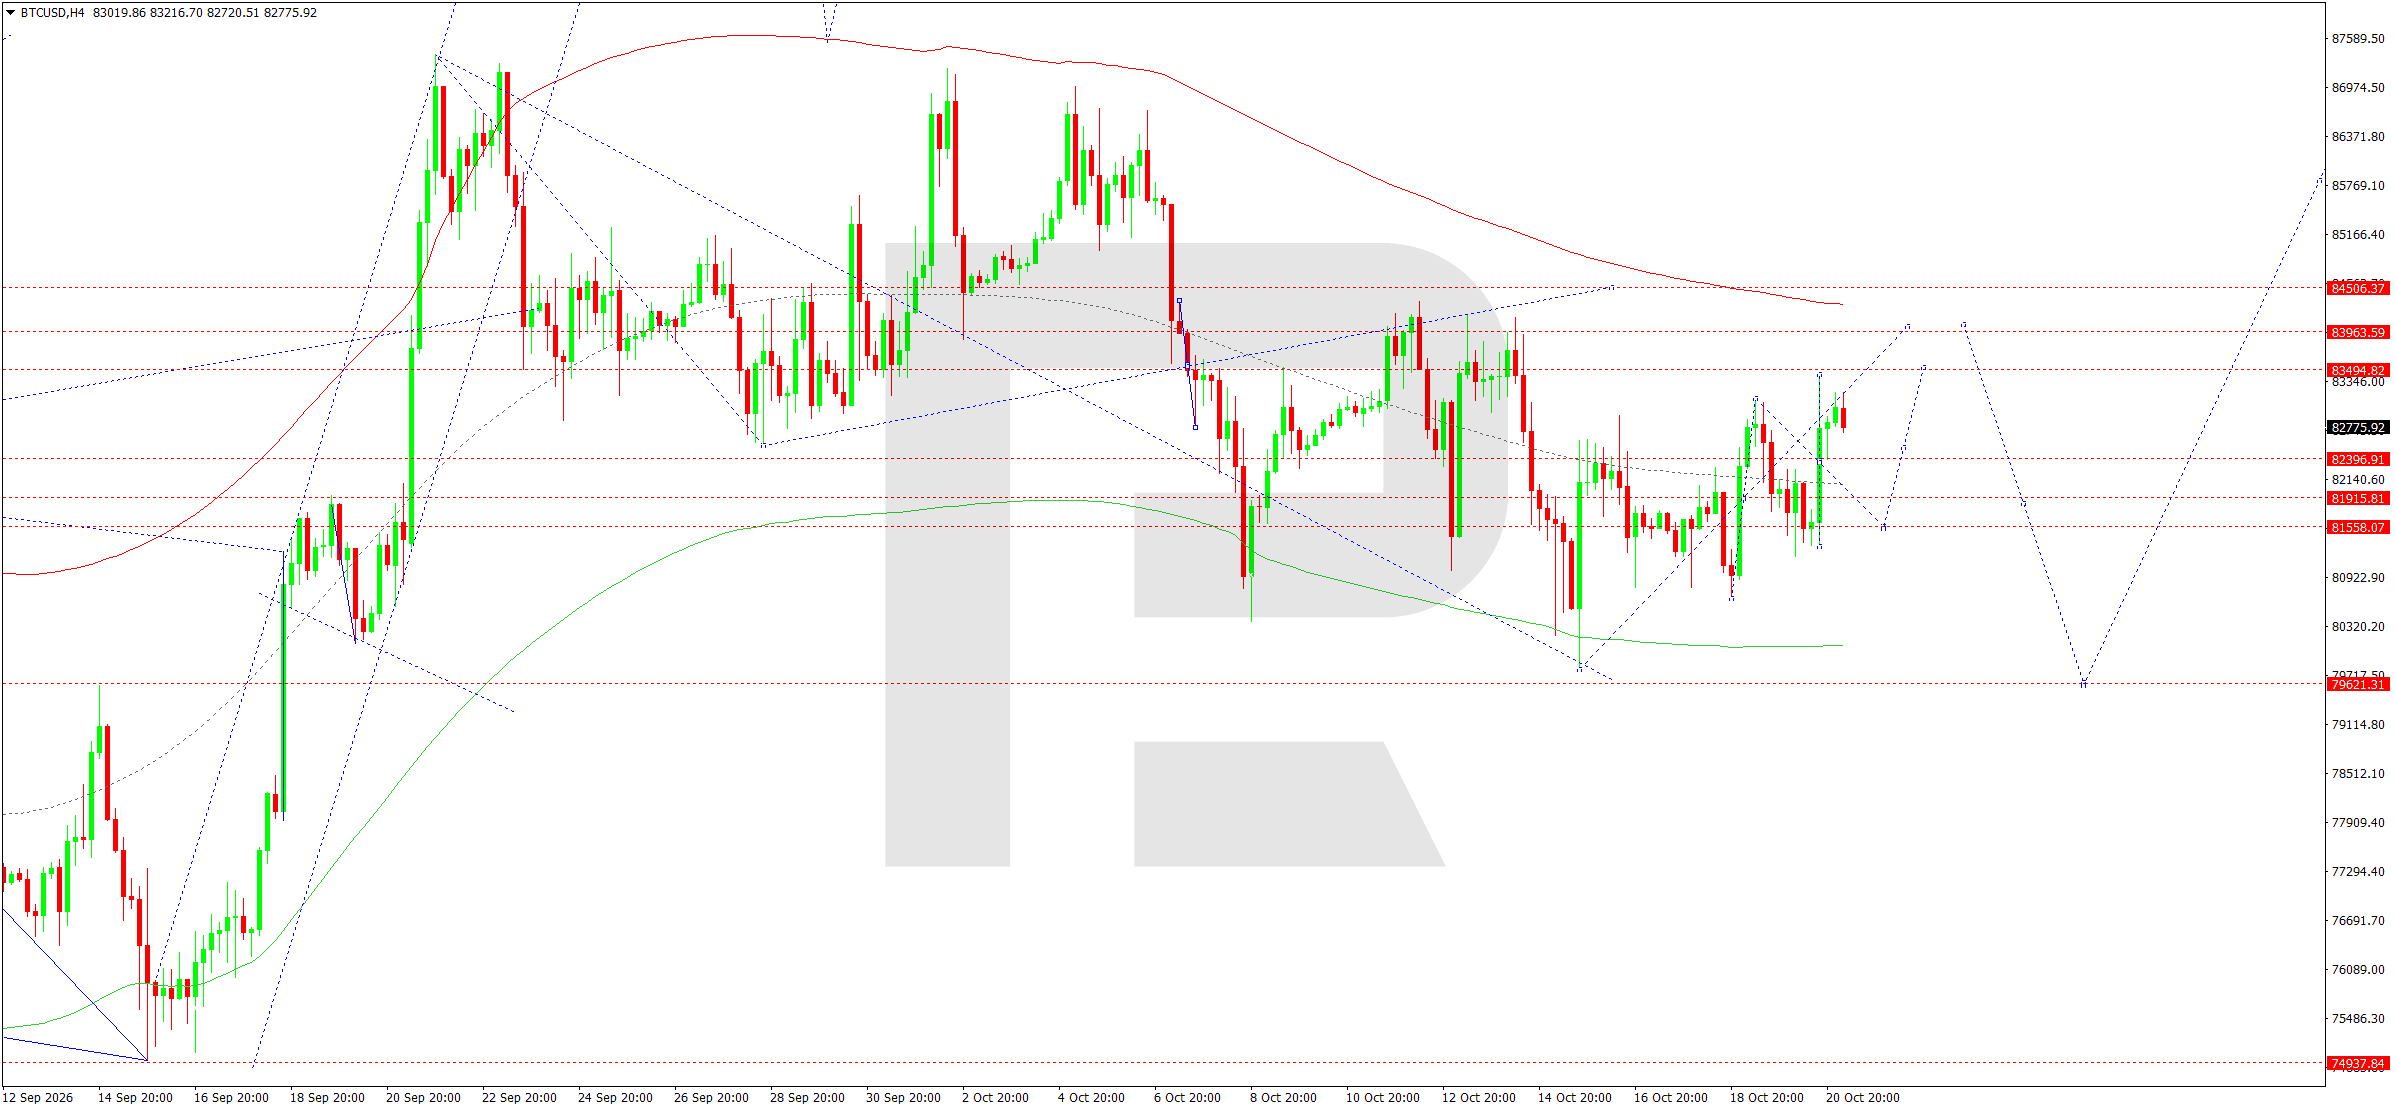
On the H4 chart, BTCUSD continues to form a corrective structure after completing the previous downward impulse. The price recovered to the 82,932 area, retaining the potential for further gains towards the nearest resistance levels.
The matrix pivot is at 83,505. This level defines the main resistance and serves as a reference point for the end of the current corrective wave.
Within the Elliott wave structure, a continued recovery towards 83,494 followed by a test of 83,963 is possible. This area corresponds to the upper boundary of the local Price Envelope and is viewed as a potential area for renewed selling.
Once the correction ends, another downward wave is expected, initially targeting 82,396 and 81,558.
A breakout below these support levels would open the way towards 79,621, corresponding to the lower boundary of the calculated range.
Consolidation above 84,506 would weaken the main bearish scenario and open the way for a more prolonged recovery.
BTCUSD forecast scenario
Editors’ picks


EURUSD forecast 2026–2027: technical analysis, price levels & predictions
The EURUSD outlook for 2026 and 2027: key levels on the daily chart, three trading scenarios and the policy gap between the Fed and the ECB that drives the pair.

Gold (XAUUSD) forecast 2026: technical analysis, price levels & predictions
Where gold could trade in 2026: key levels, three trading scenarios with entry triggers and the forecasts from J.P. Morgan, Deutsche Bank and Goldman Sachs.
Forecasts presented in this section only reflect the author’s private opinion and should not be considered as guidance for trading. RoboForex bears no responsibility for trading results based on trading recommendations described in these analytical reviews.