
Daily technical analysis and forecast for 23 October 2026
Daily technical analysis and forecast for EURUSD, USDJPY, GBPUSD, AUDUSD, USDCAD, XAUUSD, US 500, and BTCUSD for 23 October 2026.
Each scenario on this page reflects the market structure on the H4 chart as of 10:00 UTC+3 on 23 October 2026. The assessment considers the current H4 chart structure, key support and resistance levels, the direction of the medium-term movement, and the prevailing fundamental backdrop.
EURUSD forecast
The fundamental backdrop for EURUSD is shaped by the resilience of the US dollar, inflation risks, and expectations of central bank decisions. The US Federal Reserve approaches its 27–28 October meeting amid heightened inflationary pressure linked to expensive energy. Rising oil prices constrain the scope for monetary easing and support US government bond yields.
The European Central Bank is also assessing the consequences of the energy crisis for inflation and economic activity in the eurozone. High imported energy costs weaken the outlook for industry and consumer demand. Flash PMIs for Germany, France, and the eurozone, scheduled for release on 23 October, are another significant factor.
Τhe combination of weak business activity and resilient US yields remains unfavourable for the euro. Better European data could trigger a local correction, but a sustained appreciation would require a change in interest rate expectations. Until then, the fundamental balance predominantly favours the dollar.
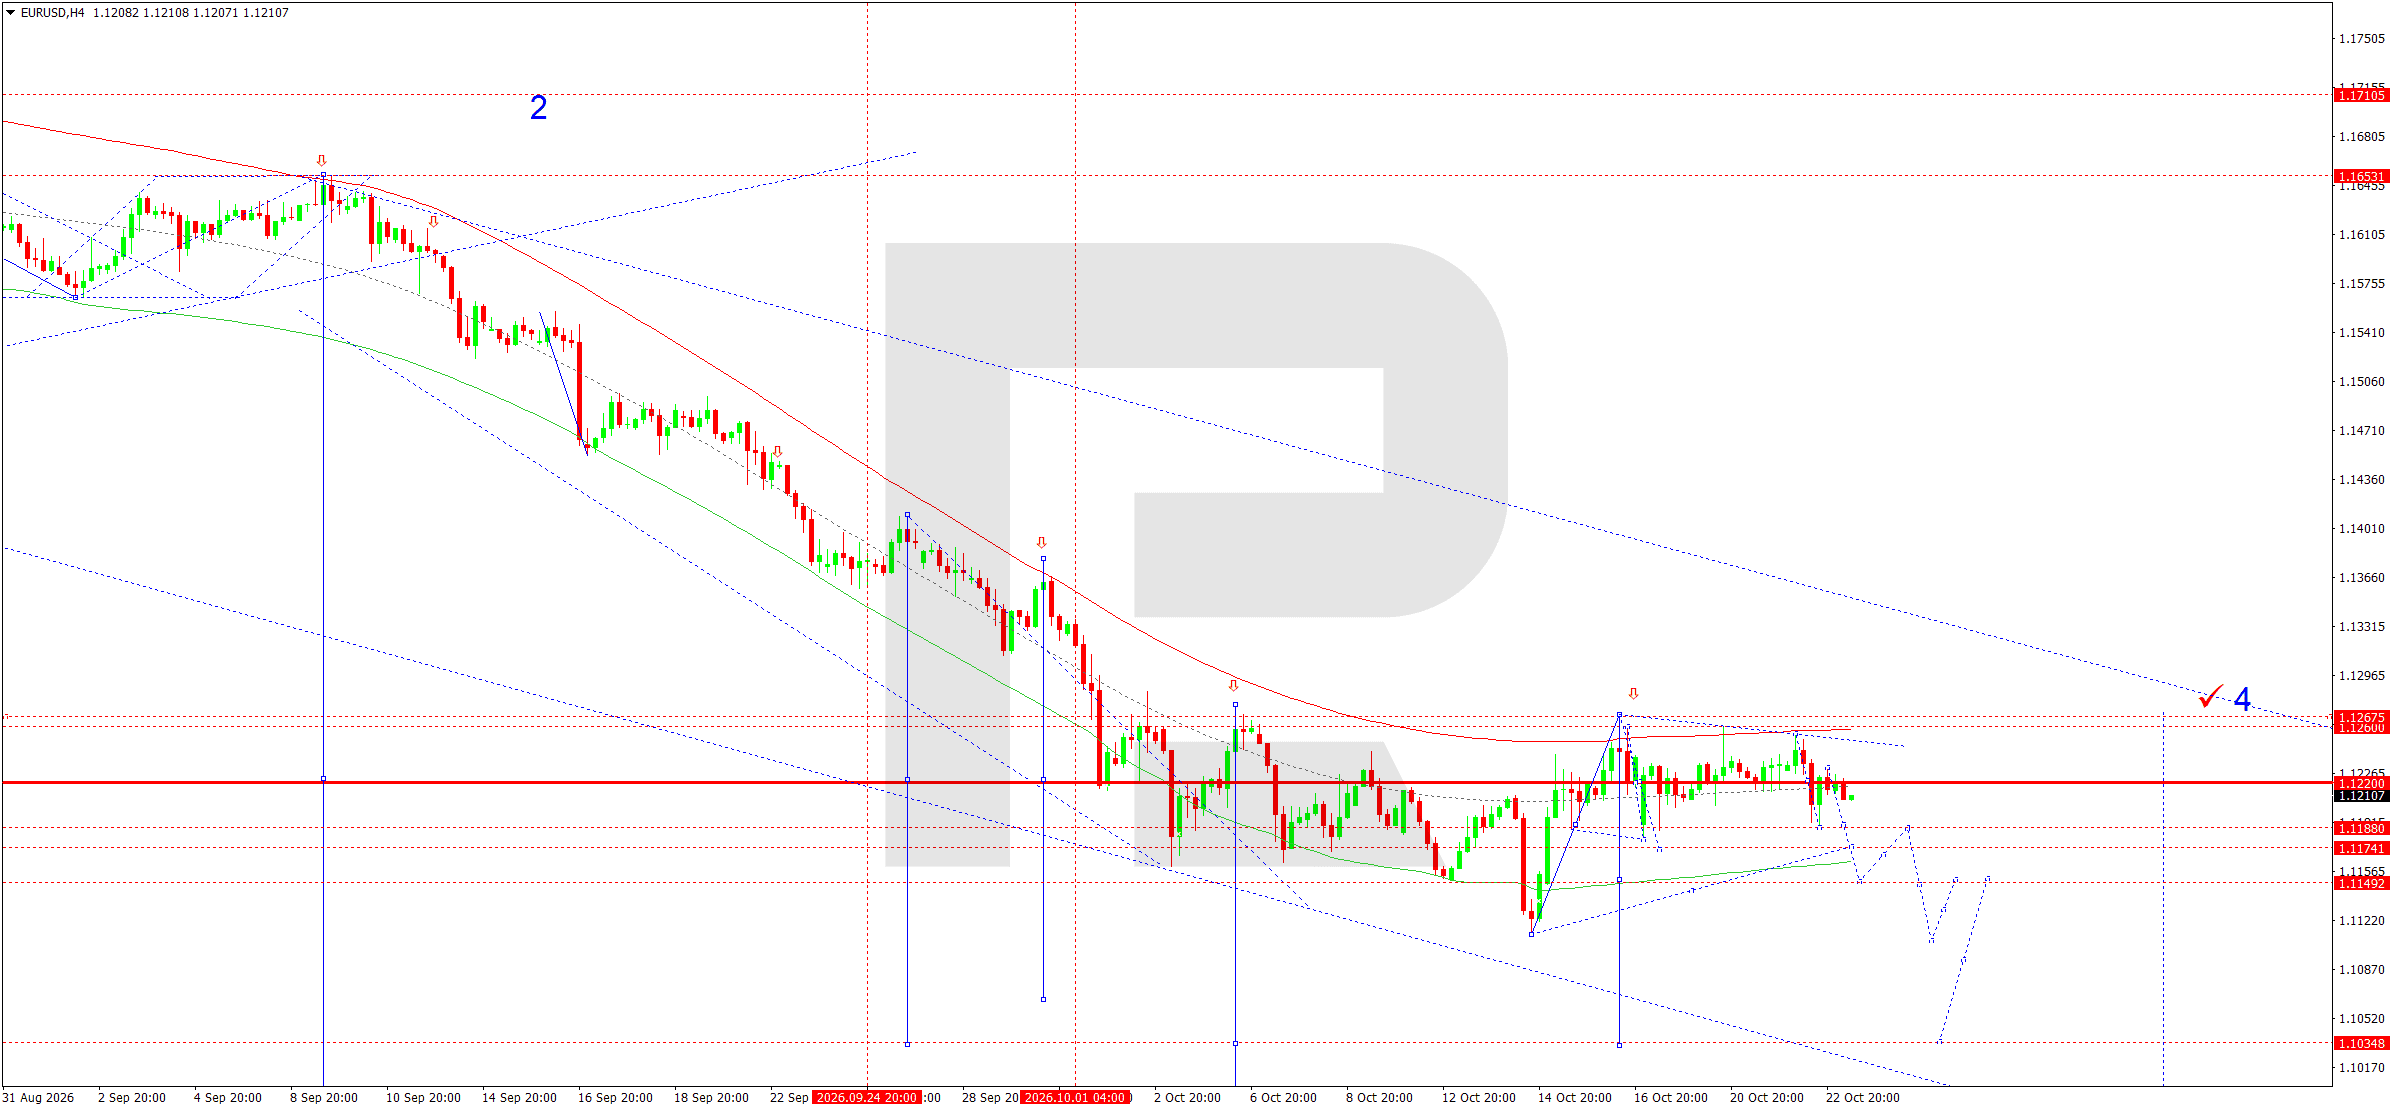
On the H4 chart, EURUSD declined to 1.1188 before correcting to 1.1230. A broad consolidation range is currently forming around 1.1222 and is regarded as a continuation pattern within the downtrend.
The Elliott wave structure and downward matrix confirm the significance of 1.1222 as the pivot. Consolidation below 1.1200 would open the way towards 1.1150, followed by 1.1100 and 1.1085.
The lower boundary of the Price Envelope is located around 1.1085. A breakout below it would create conditions for a further decline towards 1.0800 over a longer horizon.
An alternative scenario suggests a recovery above 1.1267, weakening short-term selling pressure. As long as prices remain below that resistance, the downward wave remains the priority. The next trading session may see increased volatility following the release of business activity indices.
A succession of new local lows while the price remains below the matrix's central line would provide the main confirmation for selling.
EURUSD forecast scenario
USDJPY forecast
USDJPY movements are determined by the relative yields of US and Japanese bonds, expectations of central bank decisions, and changes in demand for safe-haven assets. The Fed remains focused on the inflationary consequences of high energy prices. Resilient US yields support the dollar, while growing geopolitical uncertainty favours the Japanese yen.
The Bank of Japan is preparing for its 29–30 October meeting. Published Japanese inflation data and flash PMIs could change expectations regarding further monetary policy normalisation. Rising domestic inflation risks increase the likelihood of a more restrictive stance.
Oil prices are another influence. Japan relies on energy imports, so higher oil prices raise economic costs and complicate the inflation outlook. At the same time, falling global equity indices could support demand for the yen.
In the short term, the fundamental backdrop is mixed: US yields limit downside in USDJPY, while expectations of tighter Japanese policy and safe-haven demand create conditions for a correction.
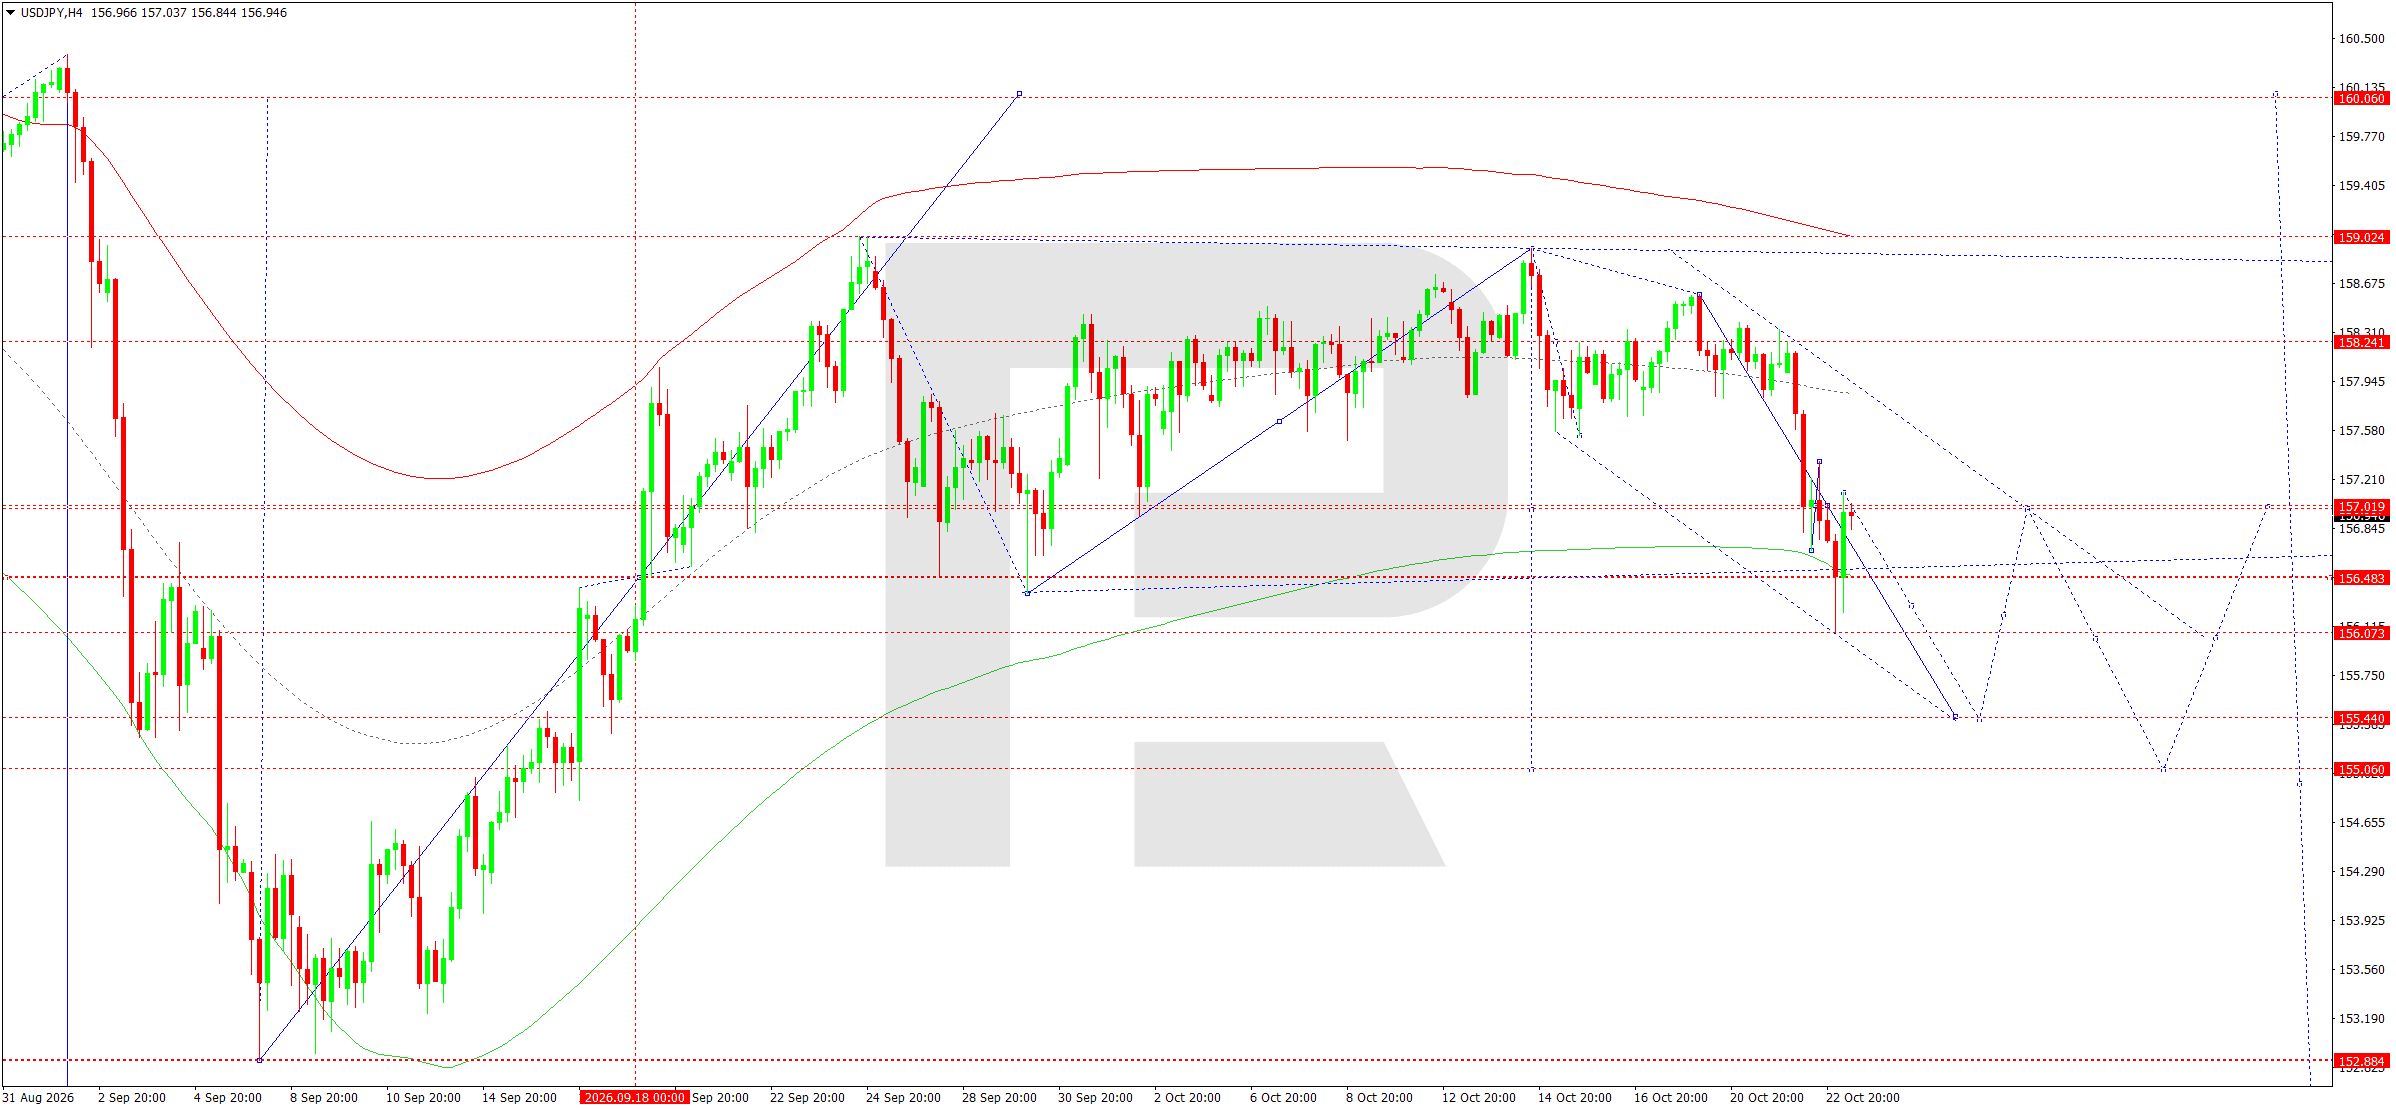
On the H4 chart, USDJPY completed an upward wave and formed a consolidation range below resistance at 157.10. The subsequent decline indicates weakening buying activity and the likelihood of a further correction.
The upward wave matrix places its pivot around 157.02. After prices moved below the central line of the Price Envelope, its lower boundary at 155.44 became the main reference point.
Intermediate support levels are 156.48 and 156.07. Breakouts below these levels would confirm a decline towards 155.44, with a test of 155.06 possible if selling pressure intensifies.
Once the corrective wave ends, a recovery towards 157.66 is possible. Consolidation above that resistance would open the way towards 159.02 and the Envelope's upper boundary at 160.06.
For the current session, a decline is preferred. A sustained return above 157.10 would signal a change in the short-term scenario. Until then, any recovery is primarily considered a correction within the emerging downward structure.
Further confirmation would come from a succession of lower highs on the shorter hourly timeframe.
USDJPY forecast scenario
GBPUSD forecast
Sterling remains sensitive to inflation indicators, monetary policy and US dollar movements. The Bank of England is assessing the impact of rising energy prices on consumer inflation, wages, and domestic demand.
Accelerating UK inflation supports expectations that restrictive monetary conditions will persist. However, high borrowing costs also constrain economic activity, creating conflicting drivers for the national currency.
Key events on 23 October include the publication of UK retail sales and flash PMIs. Weakening consumer demand or business activity could increase pressure on sterling, especially if US yields remain resilient.
On the US side, Fed policy expectations, inflation trends, and government bond yields remain key factors. Heightened geopolitical uncertainty provides additional support for safe-haven demand for the dollar.
Thus, the fundamental backdrop suggests short-term attempts by sterling to strengthen, but a sustained recovery requires positive economic signals. Without them, limited gains followed by a renewed decline remain the preferred scenario.
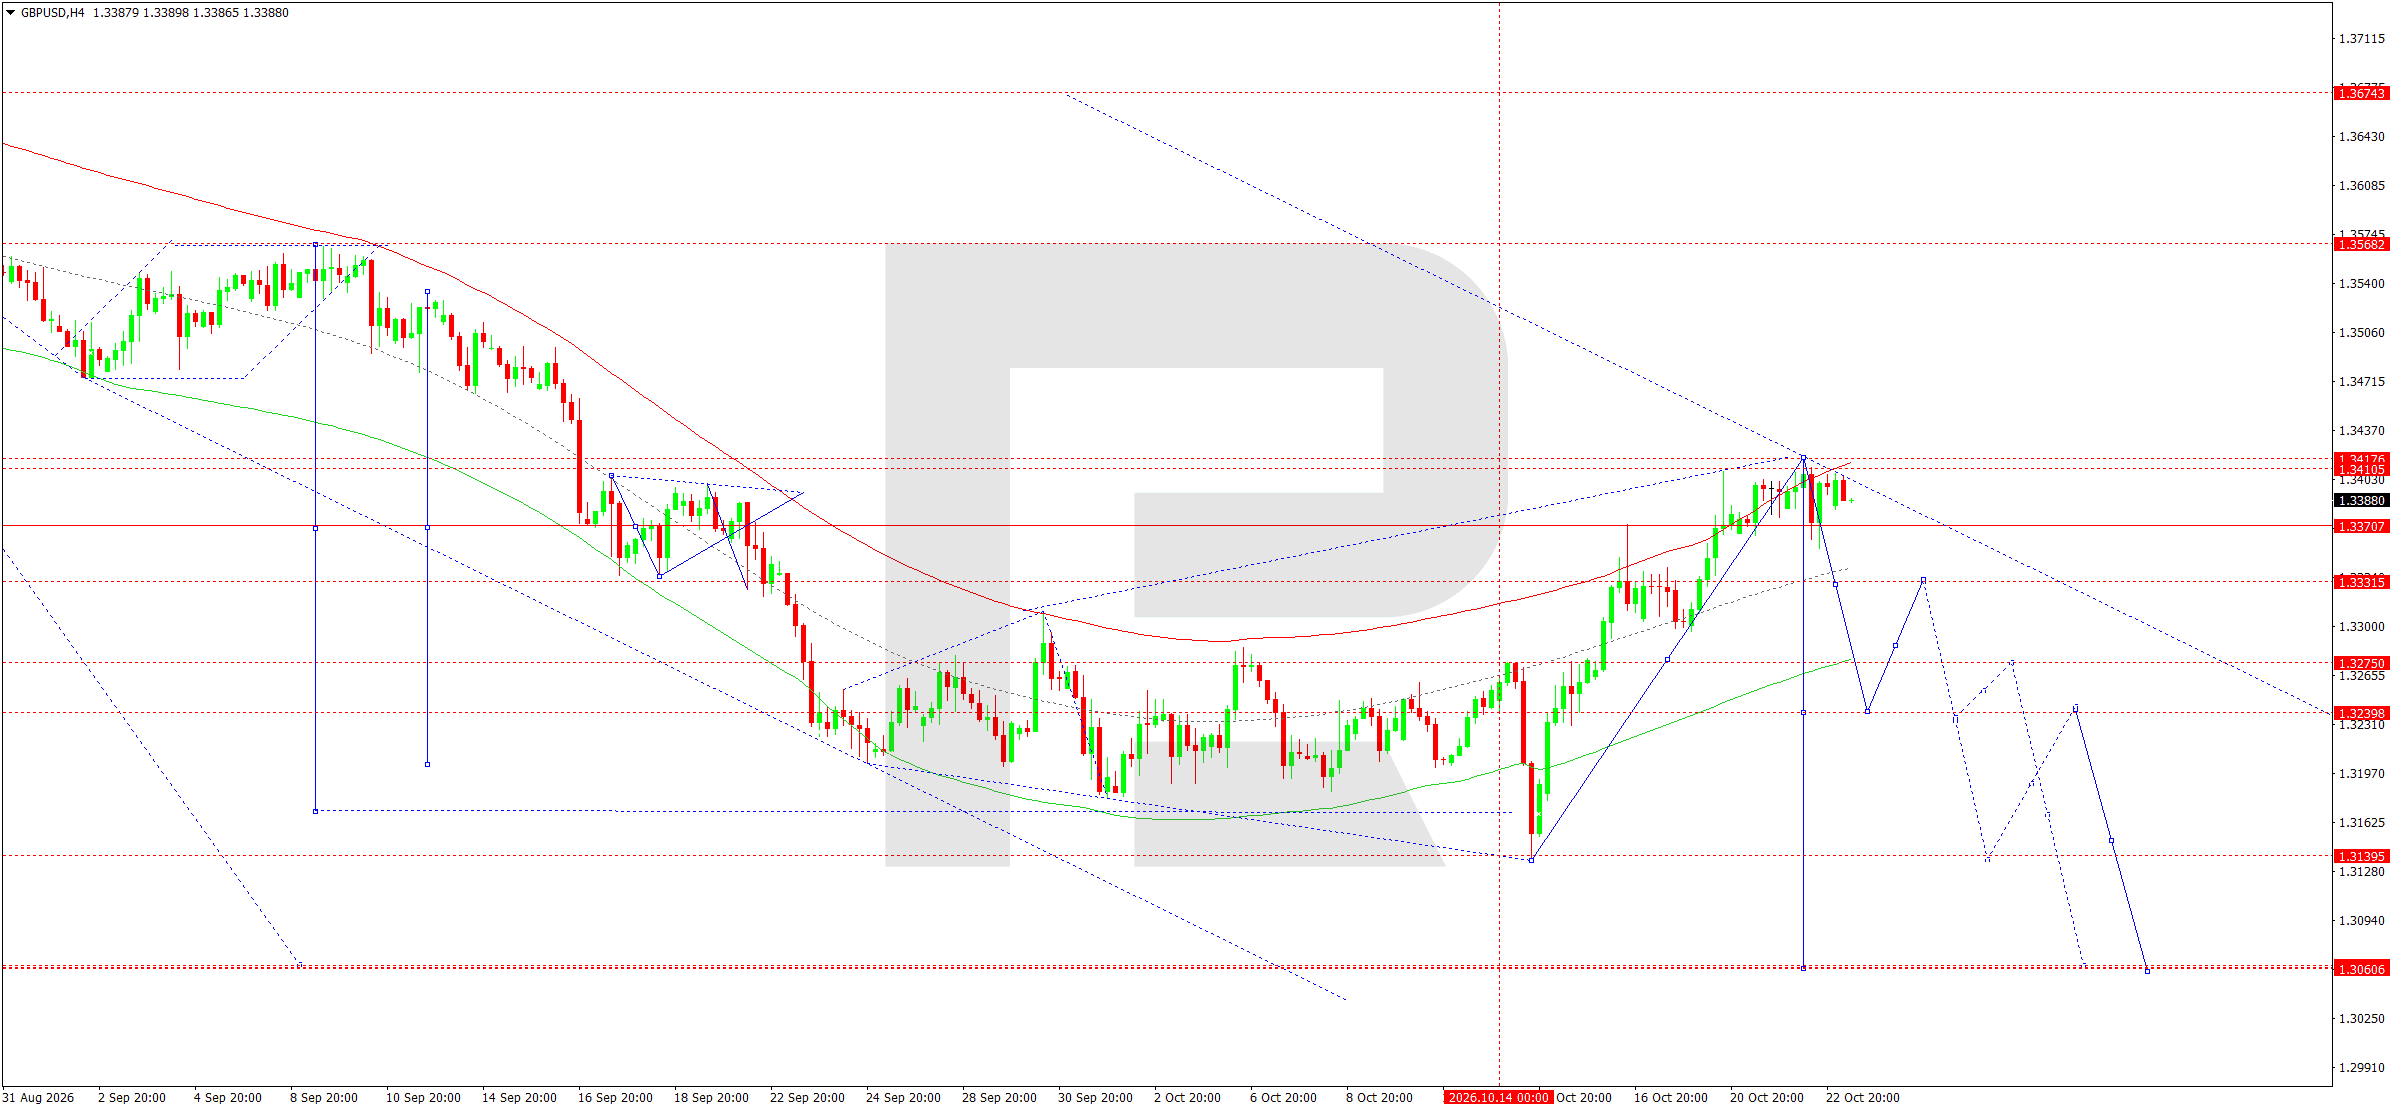
On the H4 chart, GBPUSD declined to 1.3354 before recovering towards 1.3405. Local consolidation is forming near the high reached, indicating that the corrective wave may be nearing completion.
The downward matrix places its pivot at 1.3370. The upper boundary of the Price Envelope lies around 1.3407, where selling resistance remains.
As long as the price remains below 1.3417, the main scenario is a decline towards 1.3331 followed by a move towards 1.3275. A breakout below support at 1.3238 would create conditions for the wave to extend towards 1.3139 and 1.3060.
The Elliott wave structure allows for another downward impulse after the current correction ends. A return above 1.3417 would weaken this scenario and create conditions for a more extensive recovery.
For the upcoming session, selling after confirmation of a reversal from the Envelope's upper boundary remains preferable. The key signal would be consolidation below the matrix pivot at 1.3370, followed by a directional move towards the nearest support levels.
GBPUSD forecast scenario
AUDUSD forecast
The Australian dollar is influenced by monetary policy expectations, the state of China's economy, and changes in global risk appetite. The Reserve Bank of Australia continues to assess inflation risks and the resilience of domestic economic activity.
Higher energy costs increase uncertainty about future inflation and interest rates. Meanwhile, weakening global equity markets reduce the appeal of currencies sensitive to the economic cycle, including the Australian dollar.
Flash Australian PMIs for October, reflecting conditions in manufacturing and services, are important. Chinese demand for commodities is another factor, as changes in China's industrial activity directly affect the outlook for Australian exports.
High US government bond yields and expectations that the Fed will maintain restrictive policy support the dollar. If investor sentiment deteriorates further, the US currency could gain an additional advantage.
The fundamental backdrop therefore remains mixed, but the short-term balance of risks is tilted towards AUDUSD weakness. A sustained recovery would require better business activity, stabilisation in commodity markets, and renewed demand for risk assets.
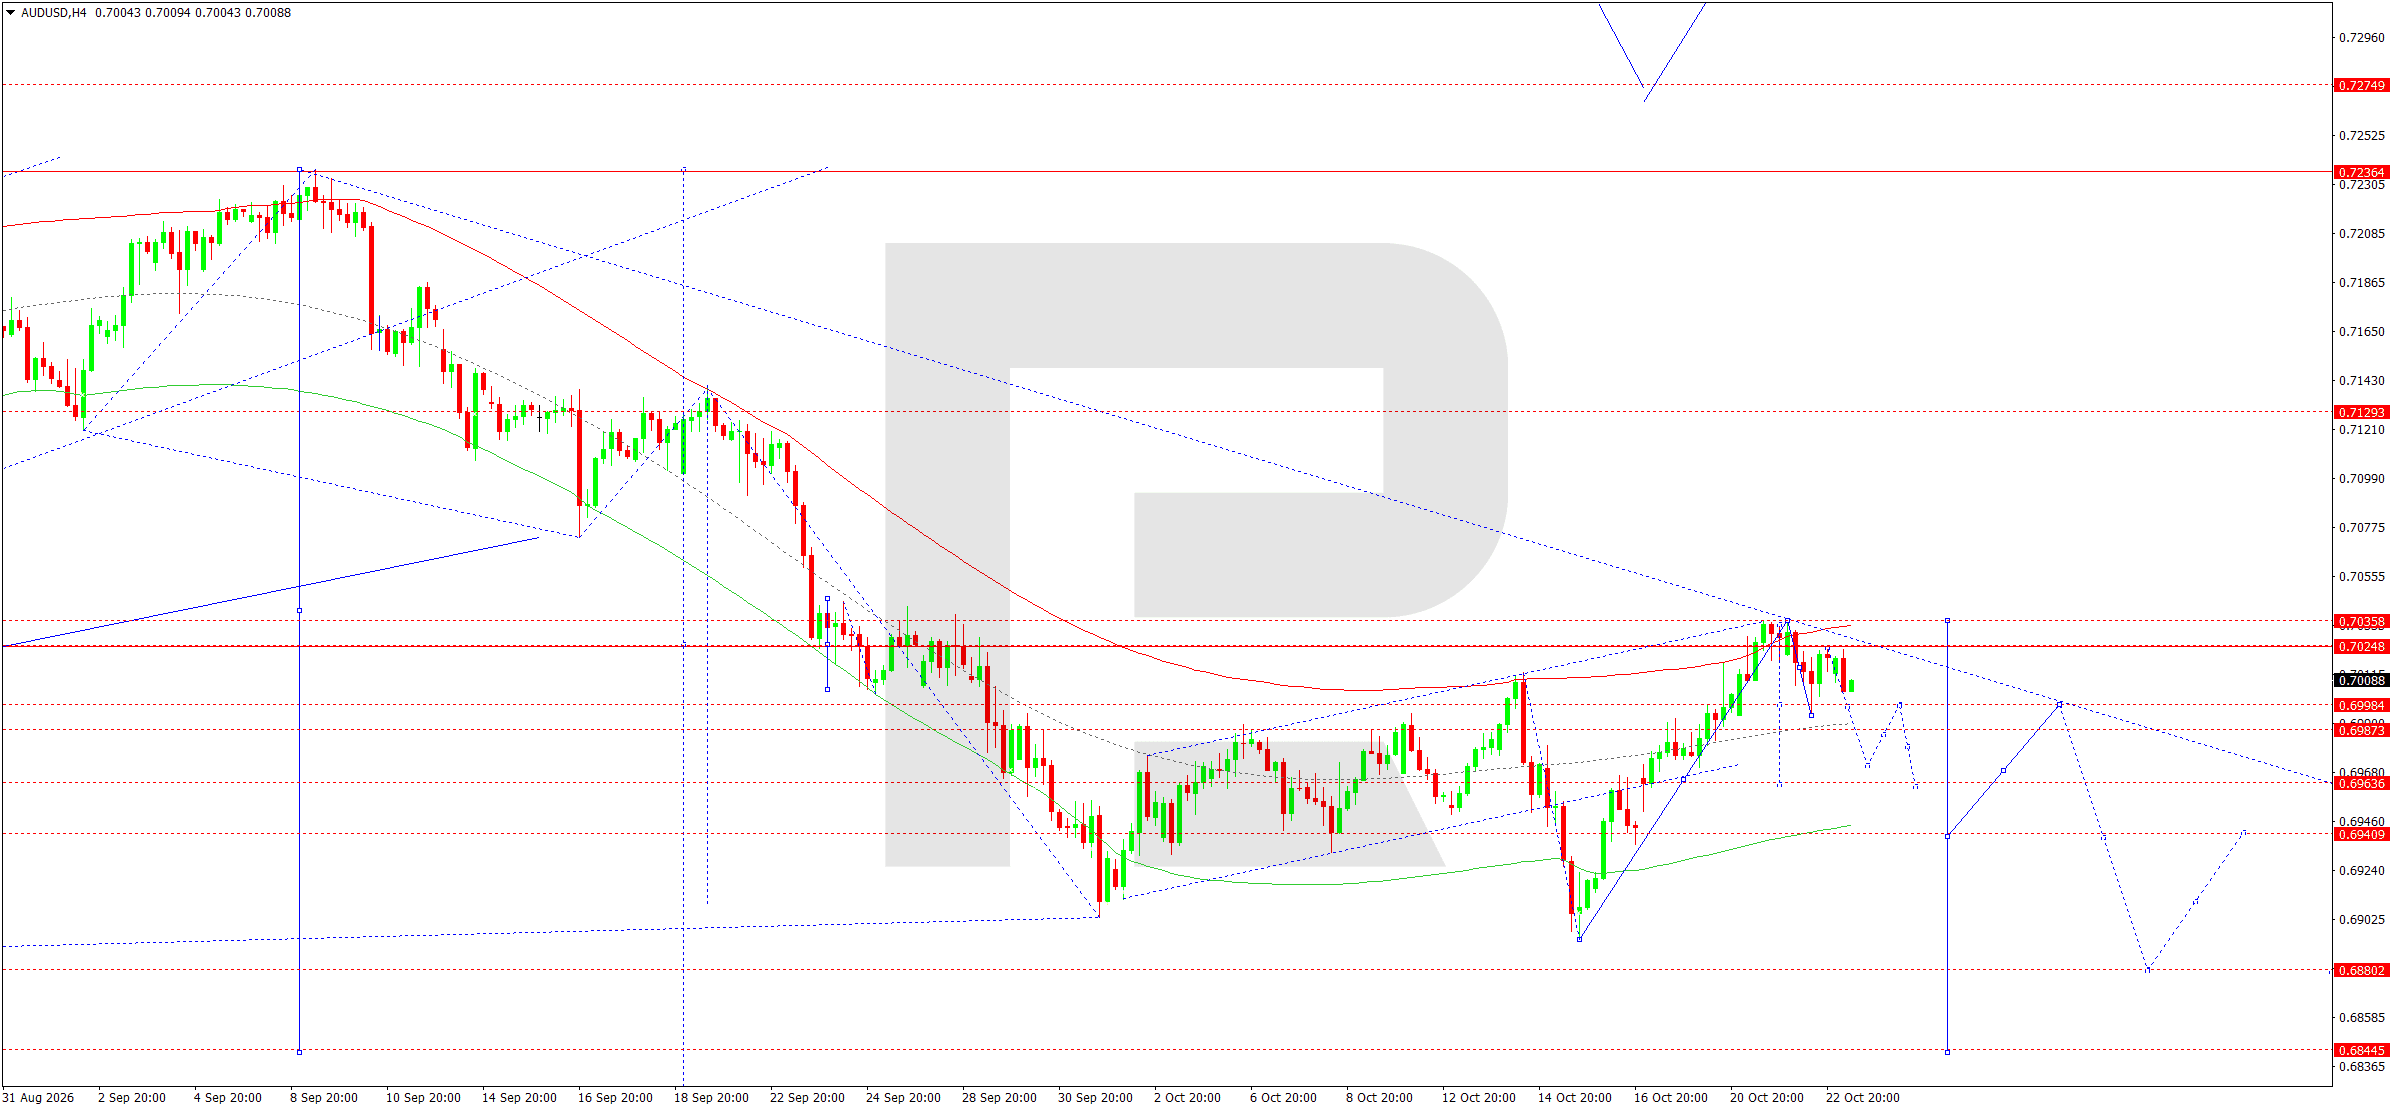
On the H4 chart, AUDUSD completed a recovery towards 0.7035 before forming a consolidation range around 0.7024. The subsequent decline indicates weakening upward momentum.
The downward wave matrix places its pivot at 0.7024. The upper boundary of the Price Envelope is near 0.7035 and serves as the main resistance.
Consolidation below 0.6998 would create conditions for a decline towards 0.6987 and 0.6964. The main target is the Envelope's lower boundary at 0.6940.
If a more prolonged downward wave develops, the next reference levels will be 0.6880 and 0.6845. The Elliott wave structure allows for the corrective move to continue after the local recovery ends.
An alternative scenario suggests consolidation above 0.7035 followed by a move towards 0.7129. However, selling remains preferable until that resistance is broken.
For the upcoming trading session, a downward move with intermediate pauses near the closest support levels is expected. Prices remaining below the matrix pivot and a succession of lower highs on the hourly chart would confirm the main scenario.
AUDUSD forecast scenario
USDCAD forecast
The Canadian dollar is influenced by oil market movements, differences between US and Canadian monetary policy, and the state of the North American economy. The Bank of Canada is keeping its key interest rate at 2.25%, with its next decision expected on 28 October.
Rising global oil prices traditionally improve Canada's export outlook. However, the current situation is complicated by geopolitical risks and elevated inflation expectations. High oil prices both support Canadian export revenues and increase inflationary pressure across the global economy.
Canadian inflation indicators, labour market conditions, and the outlook for trade relations with the US are also significant. Resilient US yields continue to support the dollar, limiting the Canadian currency's appreciation potential.
A significant signal from recent trading has been the decline in USDCAD, reflecting a local improvement in the Canadian dollar's position. However, further movement will depend on the sustainability of oil prices and expectations surrounding upcoming central bank decisions.
In the short term, the fundamental backdrop allows for a further decline in the pair, although the likelihood of a technical correction is gradually increasing.
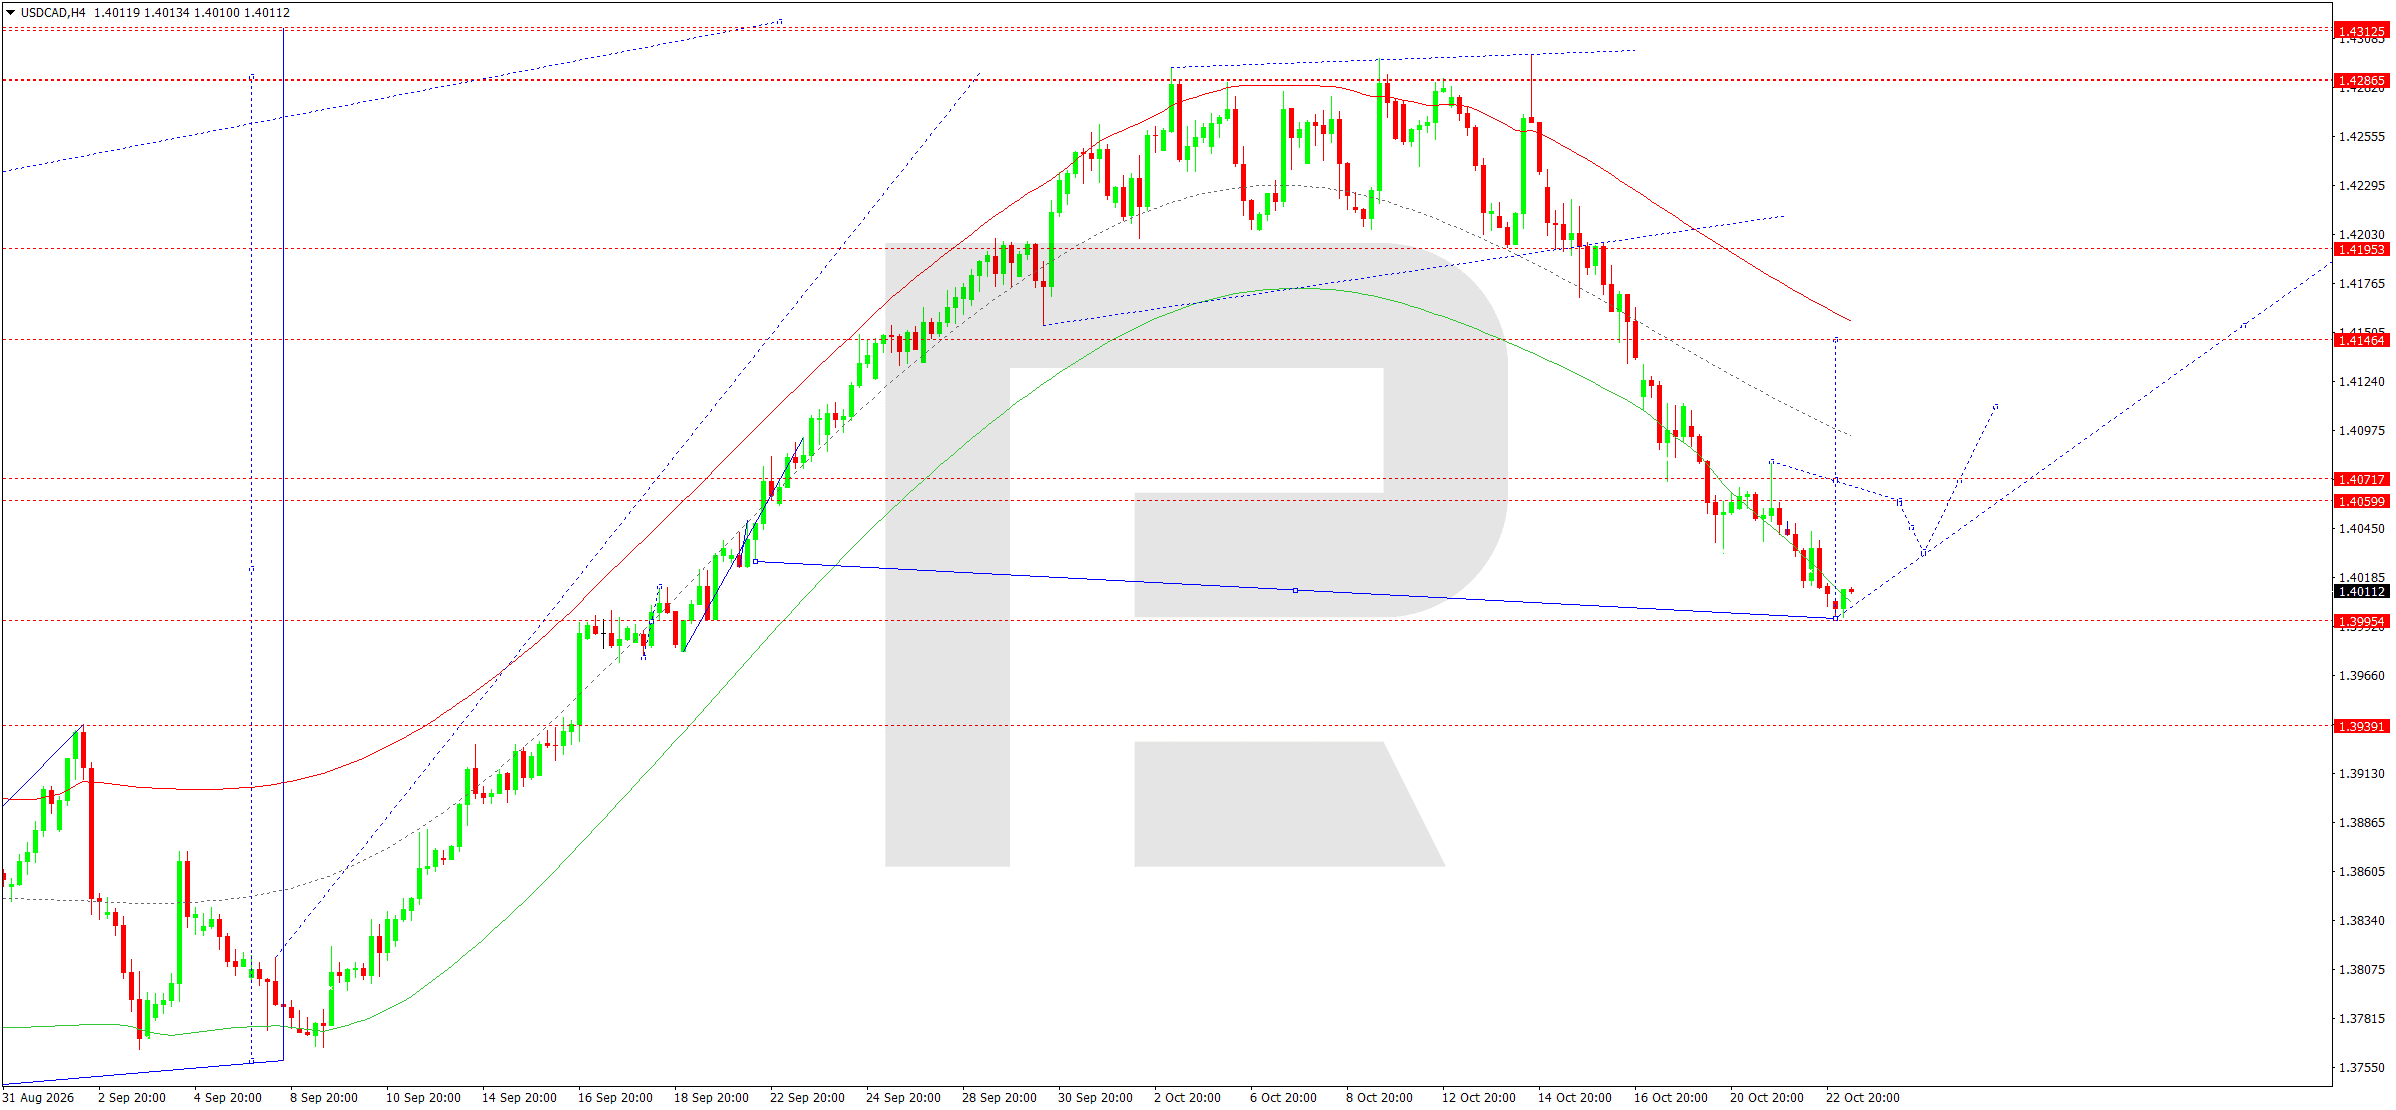
On the H4 chart, USDCAD formed an extended downward wave from the 1.4286 area and reached support at 1.3995. The current structure suggests that the market is approaching a potential area where the impulse could end.
The downward matrix identifies the key pivot area around 1.4072. Prices are below the Envelope's central line, confirming sellers' advantage.
A narrow consolidation range is expected near 1.3995. A downward breakout would open the way towards 1.3939, where another downward move may end.
After reaching that target, a corrective recovery towards 1.4059 and 1.4072 is possible. The next reference point would be the Price Envelope's upper boundary at 1.4141.
The Elliott wave structure allows for a final decline before a countertrend correction forms. As long as prices remain below 1.4072, the main direction is downwards.
For the upcoming session, selling is preferred, with limited potential to the nearest support.
An upward reversal would require confirmation through sustained consolidation above central resistance and the subsequent formation of a rising sequence of local lows.
USDCAD forecast scenario
XAUUSD forecast
The gold market remains highly volatile amid the energy crisis, inflation expectations, and changes in US government bond yields. Rising oil prices reinforce concerns about persistent inflation and limit the Fed's scope to ease monetary policy.
High interest rates increase the opportunity cost of holding gold, which pays no interest. At the same time, a stronger US dollar places additional pressure on the precious metal's price.
As of 23 October, gold has recorded a substantial weekly decline. Despite continuing geopolitical risks, investors are paying increased attention to the outlook for interest rates and real bond yields.
The forthcoming Fed meeting and US inflation releases could significantly alter market participants' short-term expectations. Conditions in the Middle East are another factor, as the risk of disruptions to energy supplies maintains heightened uncertainty.
Consequently, safe-haven demand for gold faces pressure from high yields. As long as monetary policy expectations remain restrictive, fundamental conditions suggest a further downward correction despite the possibility of brief recoveries.
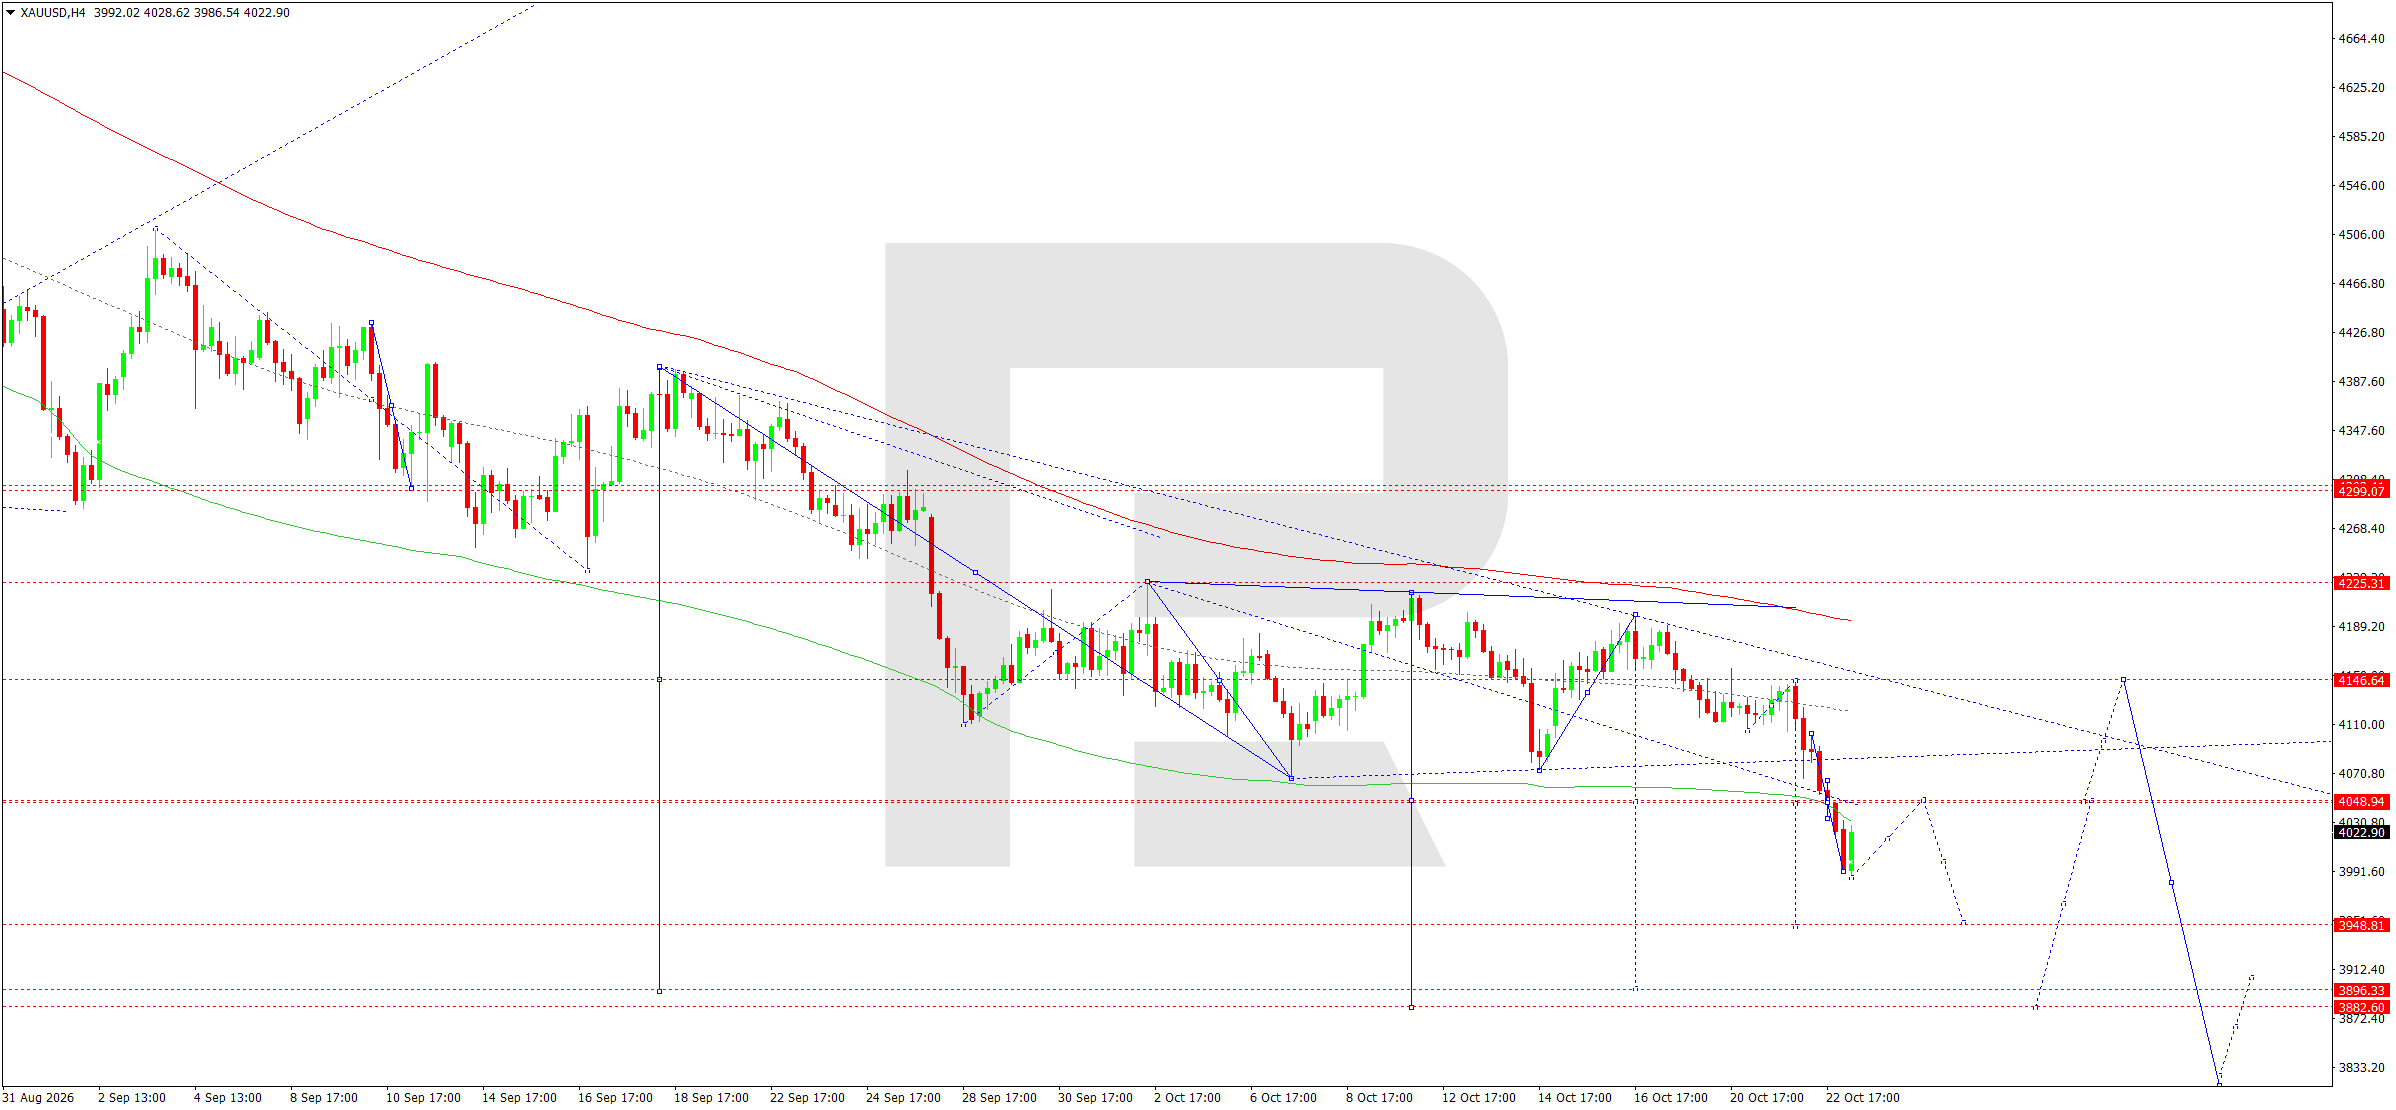
On the H4 chart, XAUUSD formed a sustained downward structure and reached a local low around 3,989. The subsequent recovery signals that narrow consolidation could develop following the impulsive decline.
The downward wave matrix places its pivot at 4,225. Prices are hovering substantially below this reference point, confirming that the main bearish trend remains intact.
In the near term, a corrective rise towards 4,048 is possible, where a significant boundary of the Price Envelope lies. This area is regarded as potential resistance ahead of renewed selling.
Once the recovery ends, a decline towards 3,948 is expected. A breakout below that support would create conditions for a continuation towards 3,896 and 3,883.
The Elliott wave structure allows for another downward impulse following a local correction. A return above 4,147 would weaken the short-term bearish scenario but would not change the main trend without a breakout above 4,225.
For the upcoming session, selling after the corrective recovery ends remains preferable. A reversal pattern below resistance at 4,048, followed by a new local low, would provide additional confirmation.
XAUUSD forecast scenario
US 500 forecast
The US stock market is under pressure from high interest rates, rising energy costs, and a reassessment of corporate earnings prospects. Following trading on 22 October, the S&P 500 declined by approximately 1.2%, with the technology sector experiencing the most significant losses.
Investors are revising expectations about the sustainability of growth among companies associated with artificial intelligence. High financing costs increase the requirements for future profitability and limit the appeal of stocks with elevated valuation multiples.
High oil prices remain another negative factor. Rising energy costs could weaken operating profit margins while increasing inflation expectations, complicating prospects for Fed policy easing.
Key events in the upcoming session include the US flash PMIs and the University of Michigan's final consumer sentiment reading. These releases will provide further insight into economic conditions and the outlook for consumer demand.
Nevertheless, resilience in some US market sectors reduces the likelihood of a one-sided decline. The fundamental balance suggests increased volatility and potential technical recoveries, although near-term risks are predominantly to the downside.
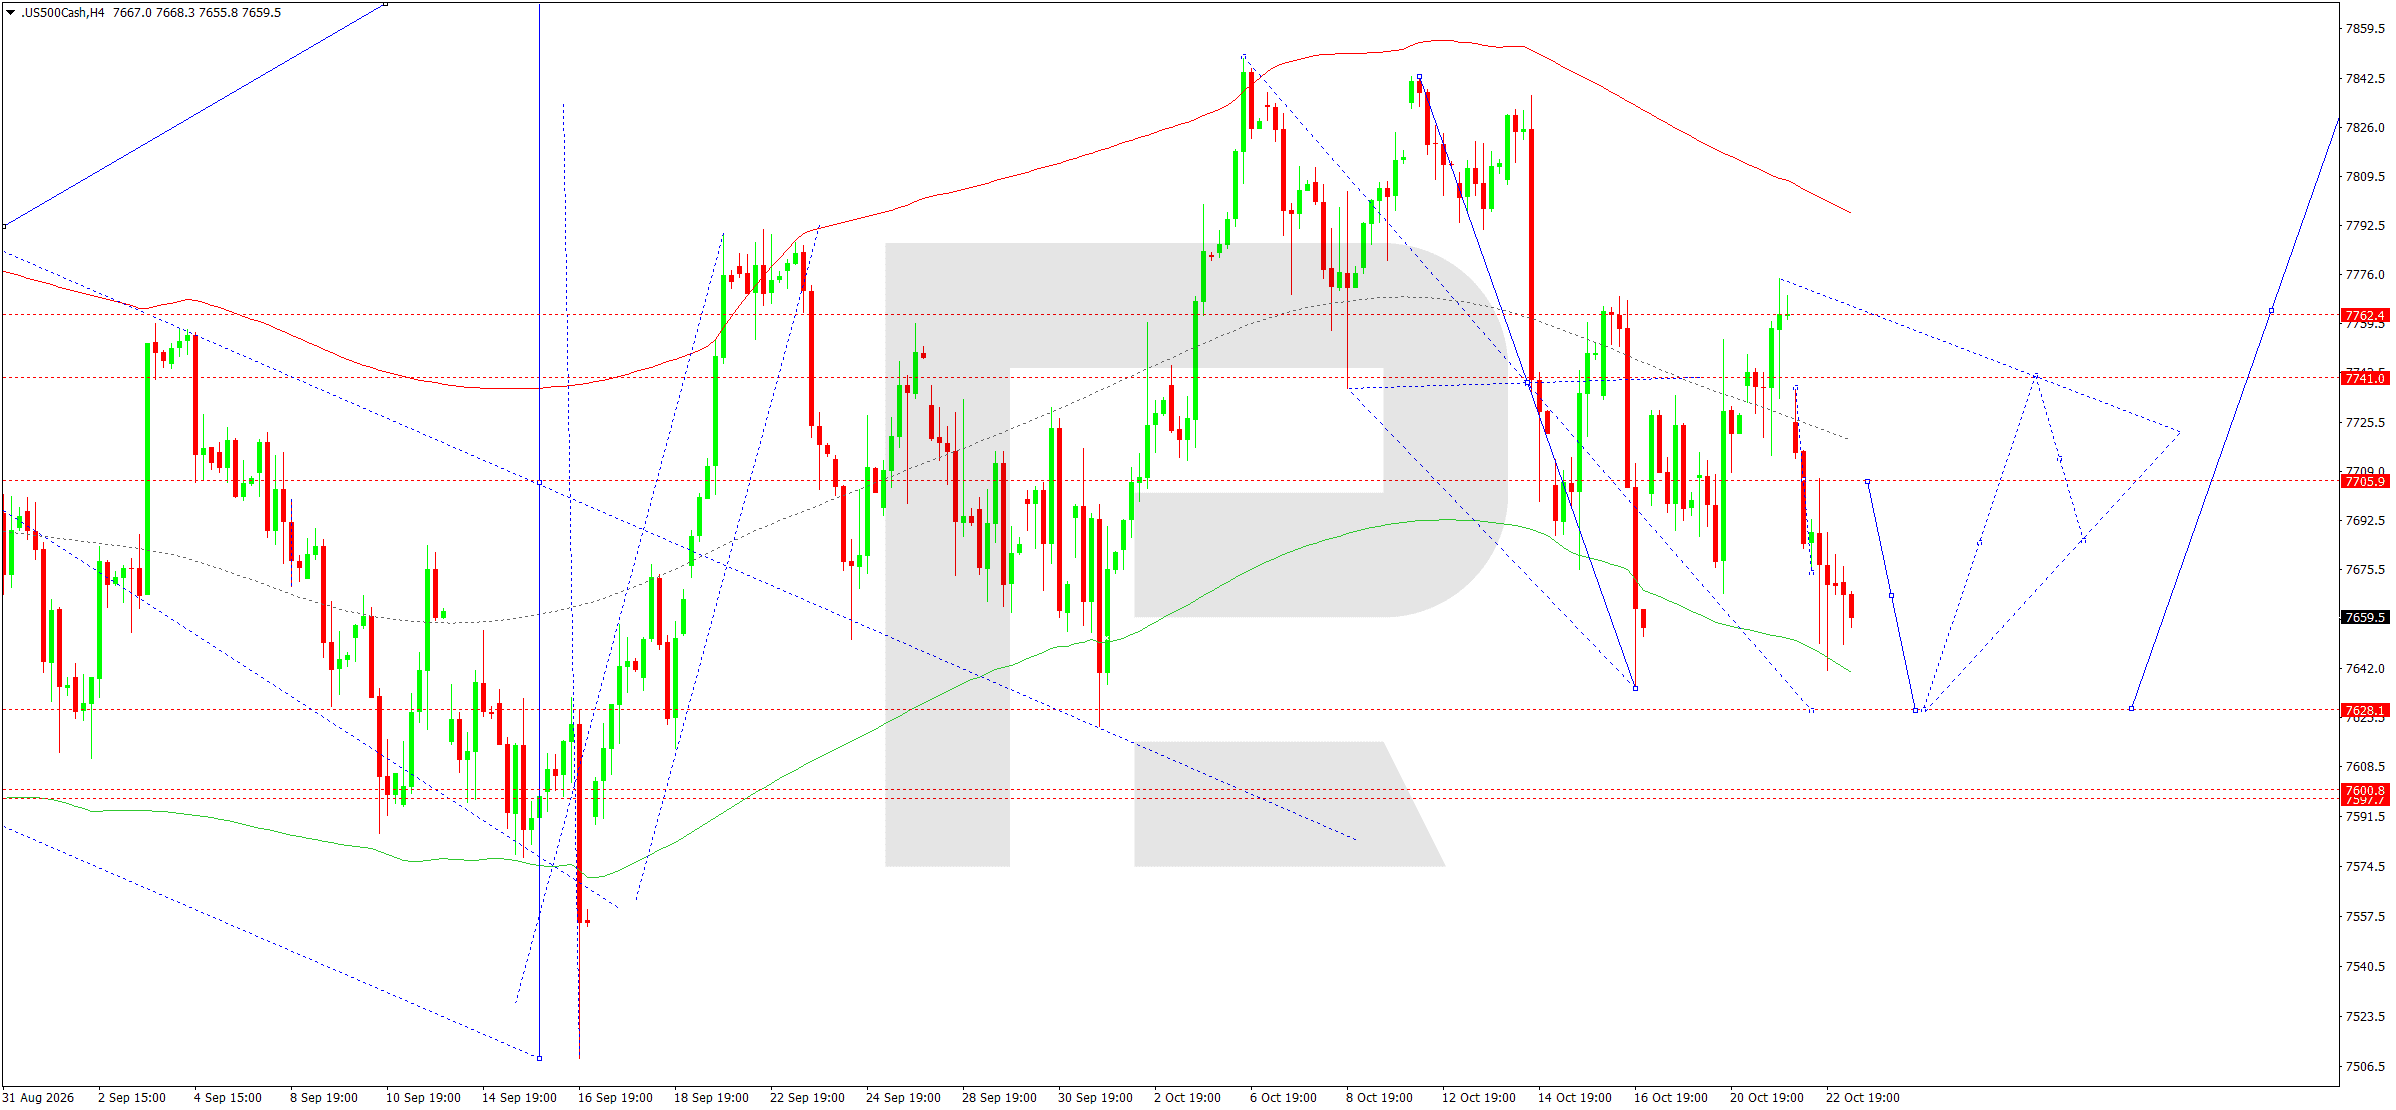
On the H4 chart, the US 500 completed an upward wave around 7,773 and formed a consolidation range below the resistance reached. The subsequent downward breakout confirmed the development of a corrective structure.
The downward matrix places its pivot around 7,739. After breaking below this level, the market began to form a downward impulse.
The nearest support level is located at 7,628. Reaching this mark would coincide with the lower boundary of the Price Envelope and could be accompanied by a slowdown in the decline.
If prices consolidate below 7,628, the next reference levels will be 7,601 and 7,598. However, the baseline scenario implies a corrective recovery after a test of the main support level.
Potential targets for the upward correction are 7,706 and 7,741, followed by 7,762. The Elliott wave structure allows for a countertrend wave after the current downward impulse ends.
For the upcoming session, selling remains preferable until prices reach the 7,628 level. A sustained return above 7,741 would signal weakening selling pressure and increase the likelihood of a recovery towards the upper boundaries of the current range.
US 500 forecast scenario
BTCUSD forecast
Bitcoin remains highly sensitive to global liquidity, monetary policy expectations and changes in investor risk appetite. The cryptocurrency market's recent decline comes amid rising oil prices and increasing concerns that US interest rates will remain high.
Higher energy costs increase inflation risks and limit the Fed's ability to shift towards easier monetary policy. For Bitcoin, this implies a potential reduction in demand for highly volatile assets.
A correction in the US technology sector adds further pressure. Declining stock indices are accompanied by reductions in risky positions, which may amplify cryptocurrency price fluctuations.
At the same time, medium-term interest in digital assets persists thanks to institutional participation and the development of investment infrastructure. However, these factors do not rule out short-term selling when liquidity conditions deteriorate.
Key upcoming events include the Fed meeting, US macroeconomic releases and further developments in the energy market. As long as investors fear that interest rates will remain elevated for an extended period, the fundamental backdrop allows for Bitcoin's corrective decline to continue, interrupted by periodic recoveries.
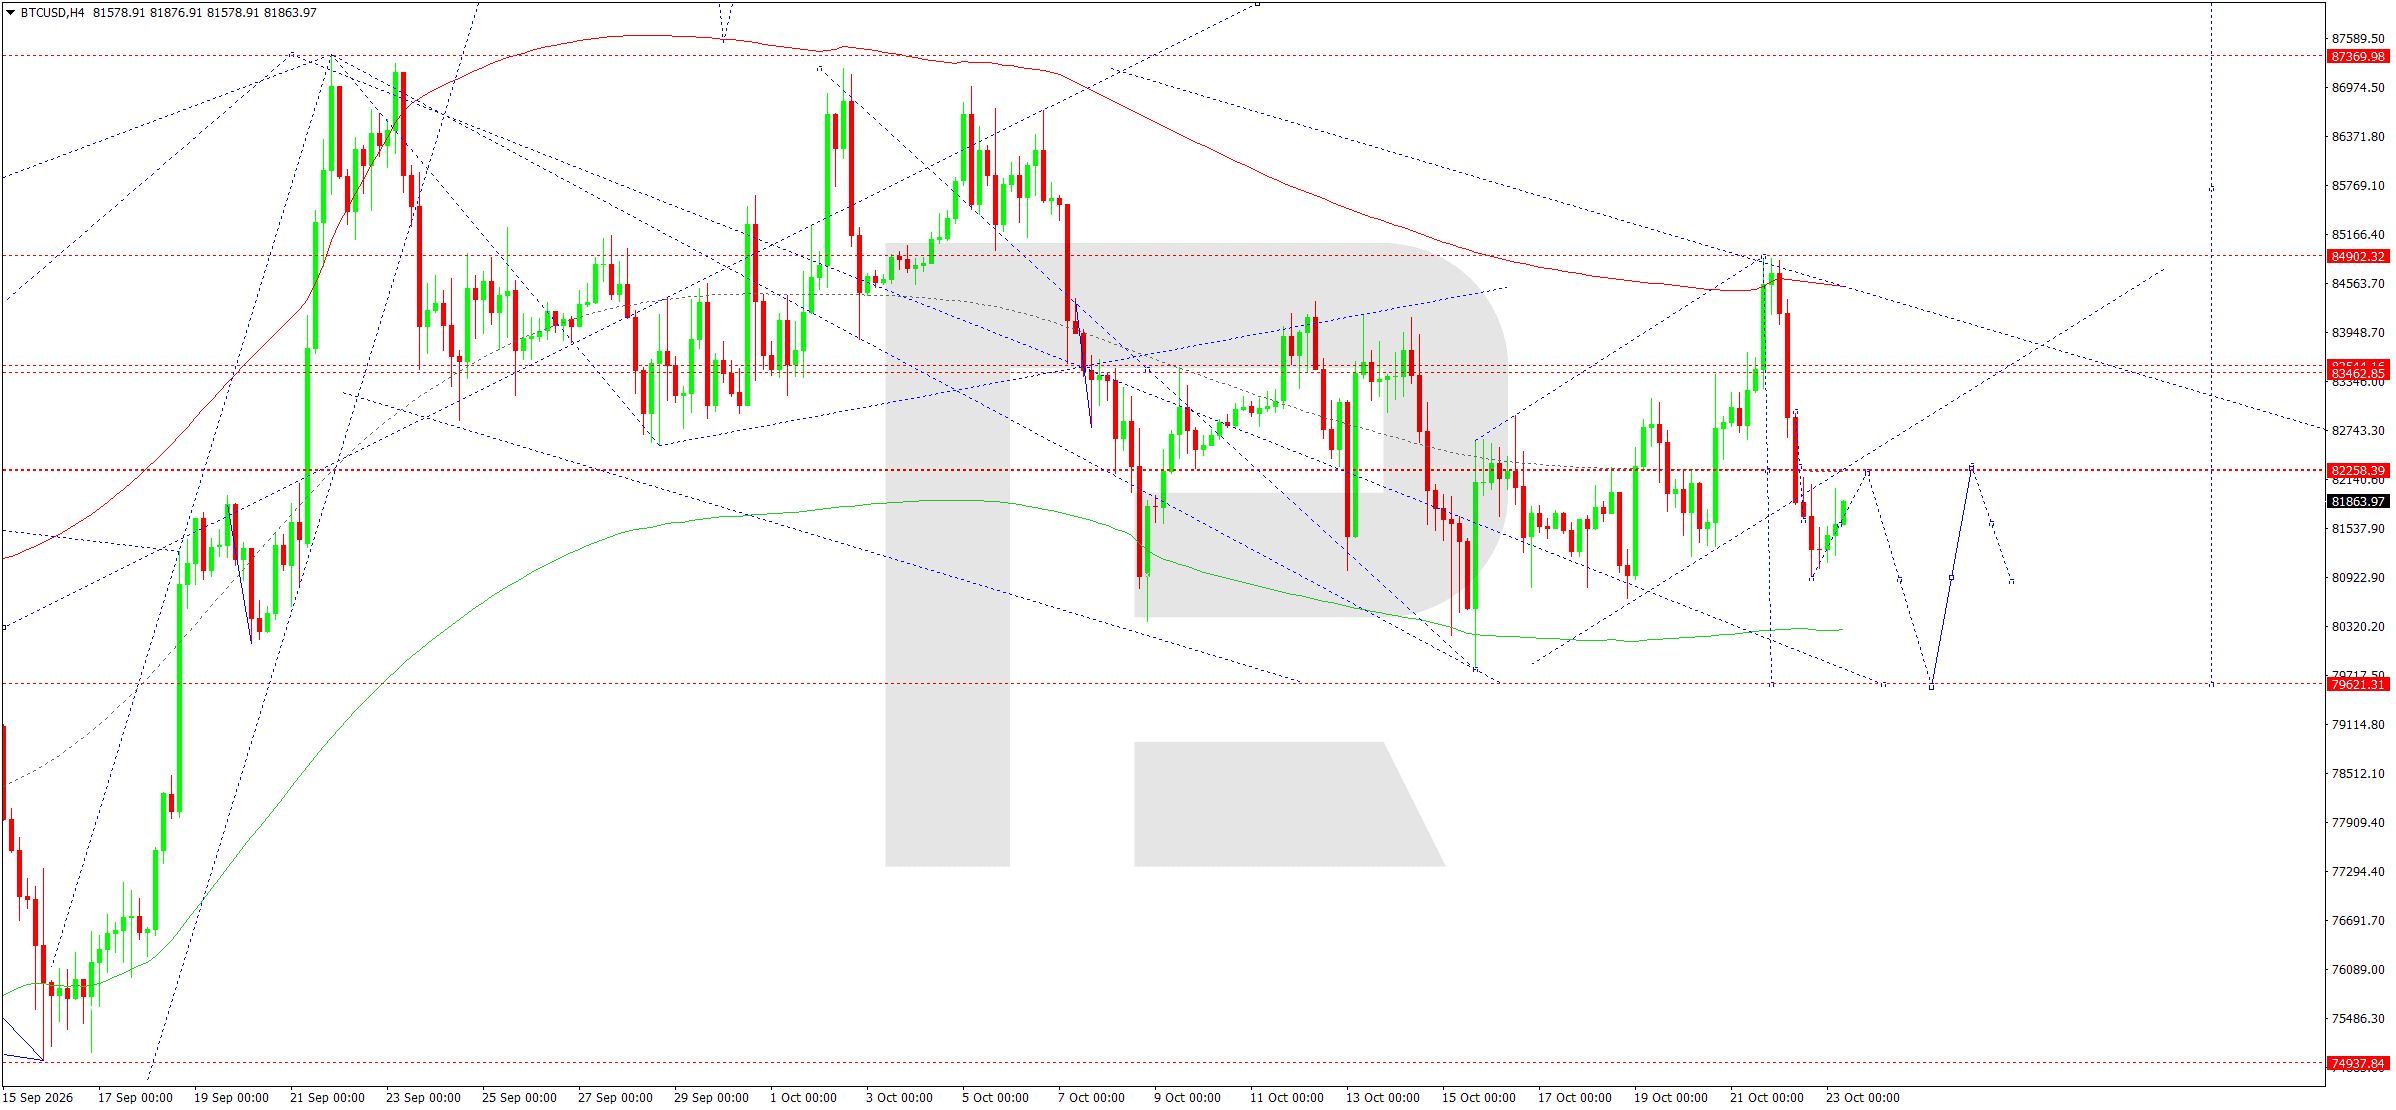
On the H4 chart, BTCUSD completed an upward wave around 84,902 before declining sharply. The current structure indicates a corrective move within a broader downward range.
The downward matrix places its pivot around 83,460. The price remains below this level, confirming sellers' advantage.
After forming local support, the market is attempting to recover towards 82,258. However, until the price consolidates above this resistance, any rise is considered corrective.
The main scenario remains a decline towards 79,621. A breakout below this support would create conditions for the downward wave to extend.
The Elliott wave structure allows for an additional corrective move before selling resumes. If the price recovers above 82,258, the next resistance levels will be 83,460 and the Price Envelope's upper boundary around 84,851.
For the upcoming session, downward movement with intermediate corrections remains preferable. The scenario would be confirmed by the recovery ending below resistance at 82,258 and the subsequent formation of another downward impulse.
Sustained consolidation above the matrix pivot at 83,460 would weaken the short-term bearish outlook and create conditions for another test of the current range's upper boundary.
BTCUSD forecast scenario
Editors’ picks


EURUSD forecast 2026–2027: technical analysis, price levels & predictions
The EURUSD outlook for 2026 and 2027: key levels on the daily chart, three trading scenarios and the policy gap between the Fed and the ECB that drives the pair.

Gold (XAUUSD) forecast 2026: technical analysis, price levels & predictions
Where gold could trade in 2026: key levels, three trading scenarios with entry triggers and the forecasts from J.P. Morgan, Deutsche Bank and Goldman Sachs.
Forecasts presented in this section only reflect the author’s private opinion and should not be considered as guidance for trading. RoboForex bears no responsibility for trading results based on trading recommendations described in these analytical reviews.