
Daily technical analysis and forecast for 27 October 2026
Daily technical analysis and forecast for EURUSD, USDJPY, GBPUSD, AUDUSD, USDCAD, XAUUSD, US 500, and BTCUSD for 27 October 2026.
Each scenario on this page reflects the market structure on the H4 chart as of 10:00 AM UTC+3 on 27 October 2026. The assessment considers the current H4 chart structure, key support and resistance levels, the direction of the medium-term movement, and the prevailing fundamental backdrop.
EURUSD forecast
The euro remains under pressure from the US dollar amid persistent differences in monetary policy expectations for the leading central banks. Market participants are preparing for the Federal Reserve's 28 October meeting, assessing the outlook for further interest rate changes and the persistence of inflationary pressures in the United States. High US government bond yields continue to support the appeal of dollar-denominated assets.
The forthcoming European Central Bank meeting on 29 October is another factor. Investors expect clarification of the regulator's stance on inflation, economic growth, and future interest rate decisions. Persistent uncertainty in the European economy limits the euro's recovery potential.
Particular attention is being paid to France's budget situation and the increase in risk premiums on government bonds. These circumstances are increasing caution among foreign exchange market participants.
During the trading day, EURUSD movements will depend on changes in US bond yields, the dollar index, and expectations concerning central bank decisions. Prevailing demand for safe-haven dollar assets could support a further decline in the pair. However, temporary price stabilisation is possible ahead of the week's most important events.
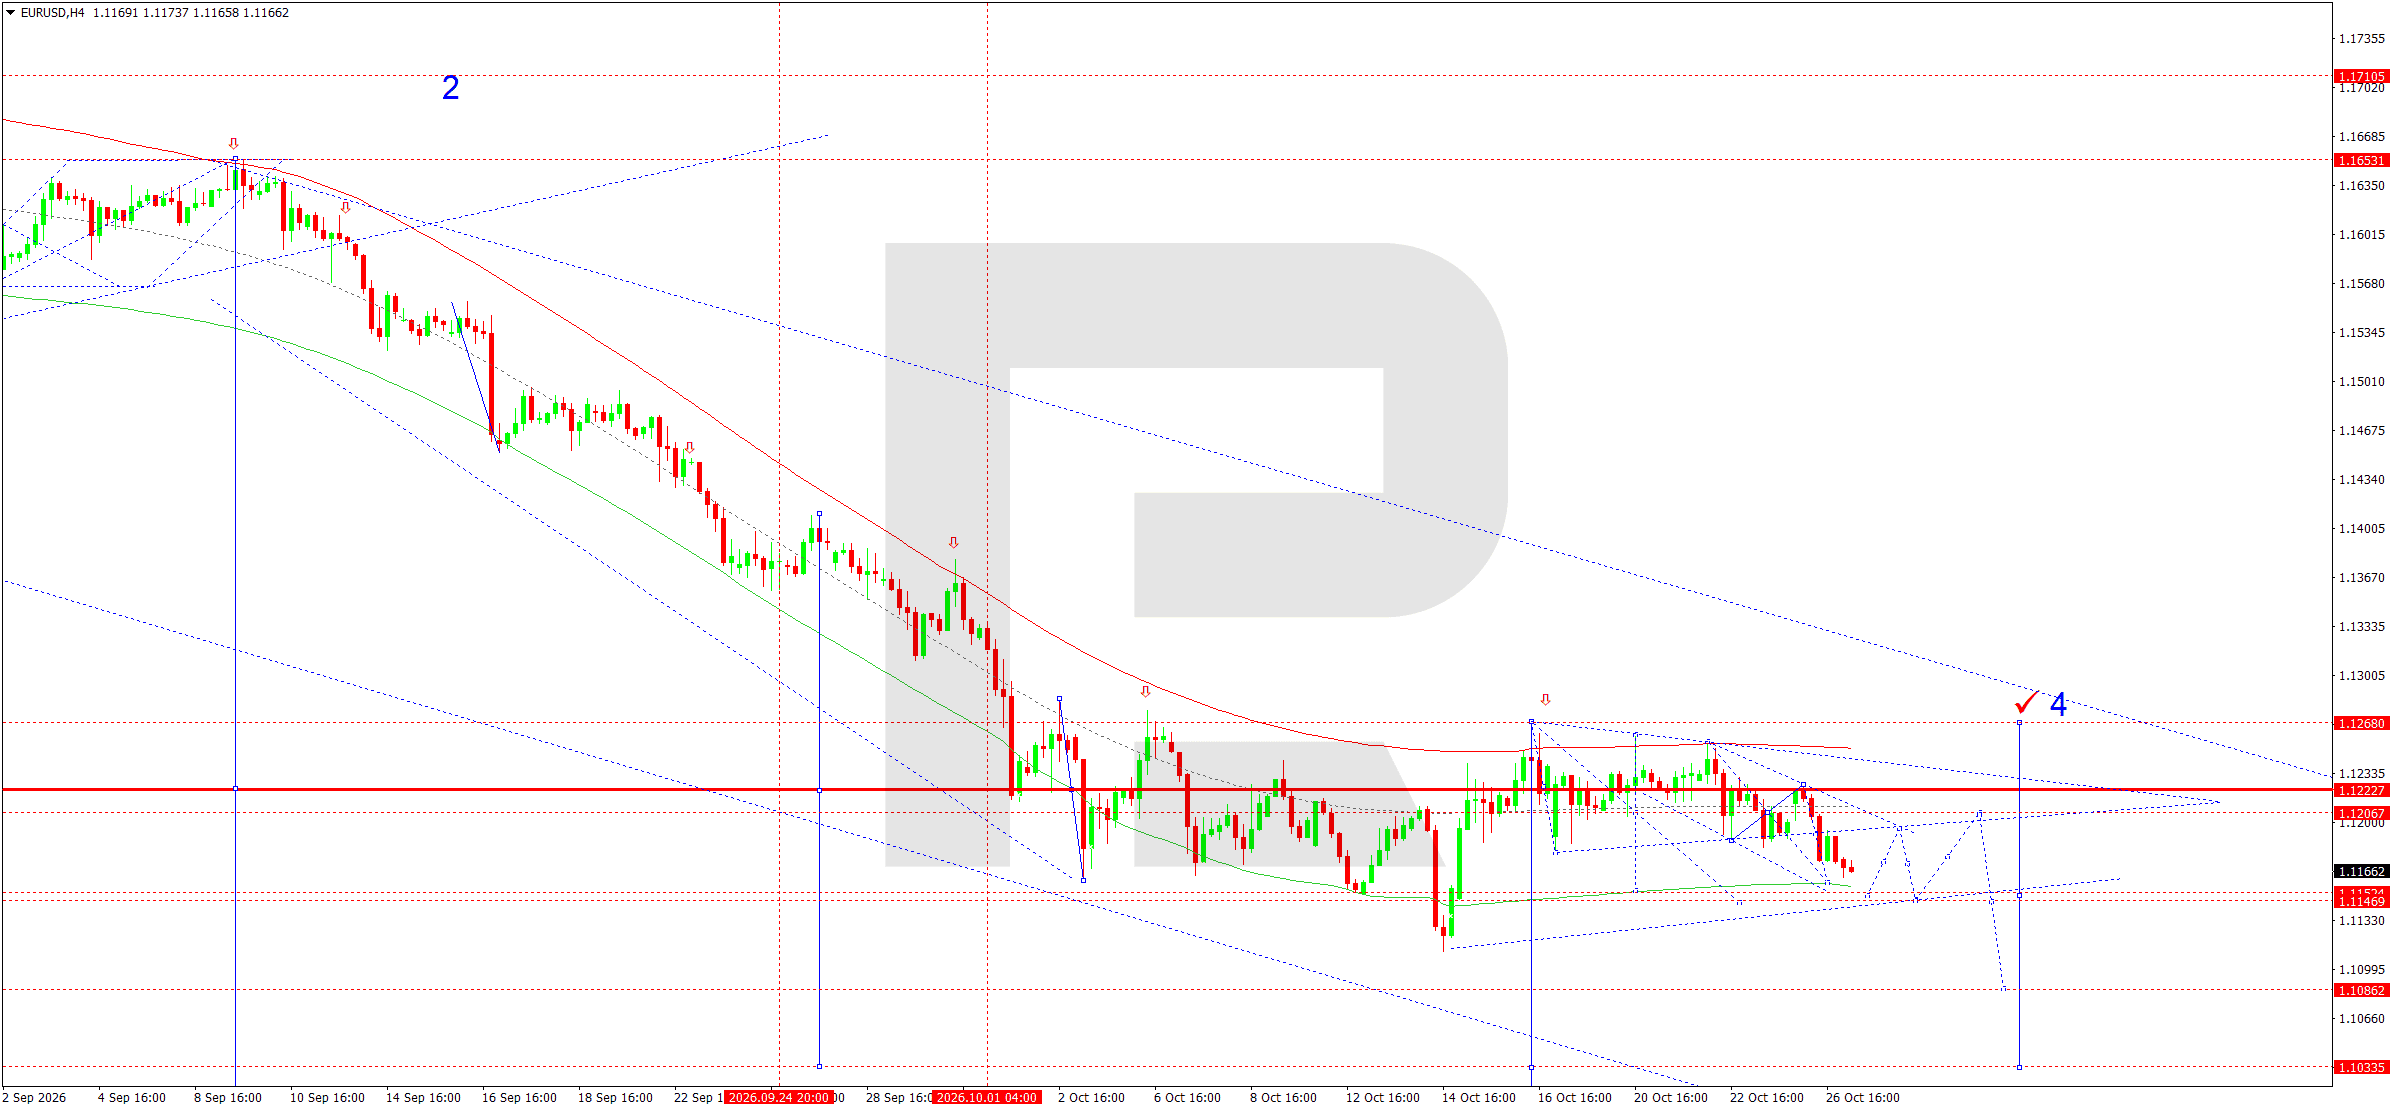
On the H4 chart, EURUSD completed a downward wave towards 1.1153. Today, 27 October, a compact consolidation range may form above this support. The main trend remains bearish, as the price is below the central line of the downward wave matrix.
The key pivot is 1.1222. The structure that has formed below this level is regarded as a continuation pattern within the downward movement. A breakout below 1.1150 would open the door for another downward wave towards 1.1086 and then 1.1035.
The Elliott wave structure suggests a final downward impulse. The Price Envelope also retains its negative slope. A possible corrective rise towards 1.1206–1.1222 is regarded as a technical retest of resistance.
The main forecast envisages further declines towards 1.1035. Sustained consolidation above 1.1222 would weaken this scenario.
EURUSD forecast scenario
USDJPY forecast
The Japanese yen continues to respond to changes in interest rate expectations in the US and Japan. Investors are focusing on the forthcoming decisions of the Fed and the Bank of Japan, which could significantly change the balance of demand for the dollar and the yen.
The US currency is supported by high yields on US government bonds. Persistently tight financial conditions increase the appeal of dollar-denominated instruments, particularly when overall risk appetite improves.
Meanwhile, the Japanese economy is showing signs of sustained inflationary pressure. Japan's services inflation stood at 3.7% year-on-year in September, supporting expectations of further policy tightening by the BoJ.
The Japanese central bank's forthcoming meeting on 30 October is especially important. Investors will assess not only the interest rate decision but also comments on further monetary policy normalisation.
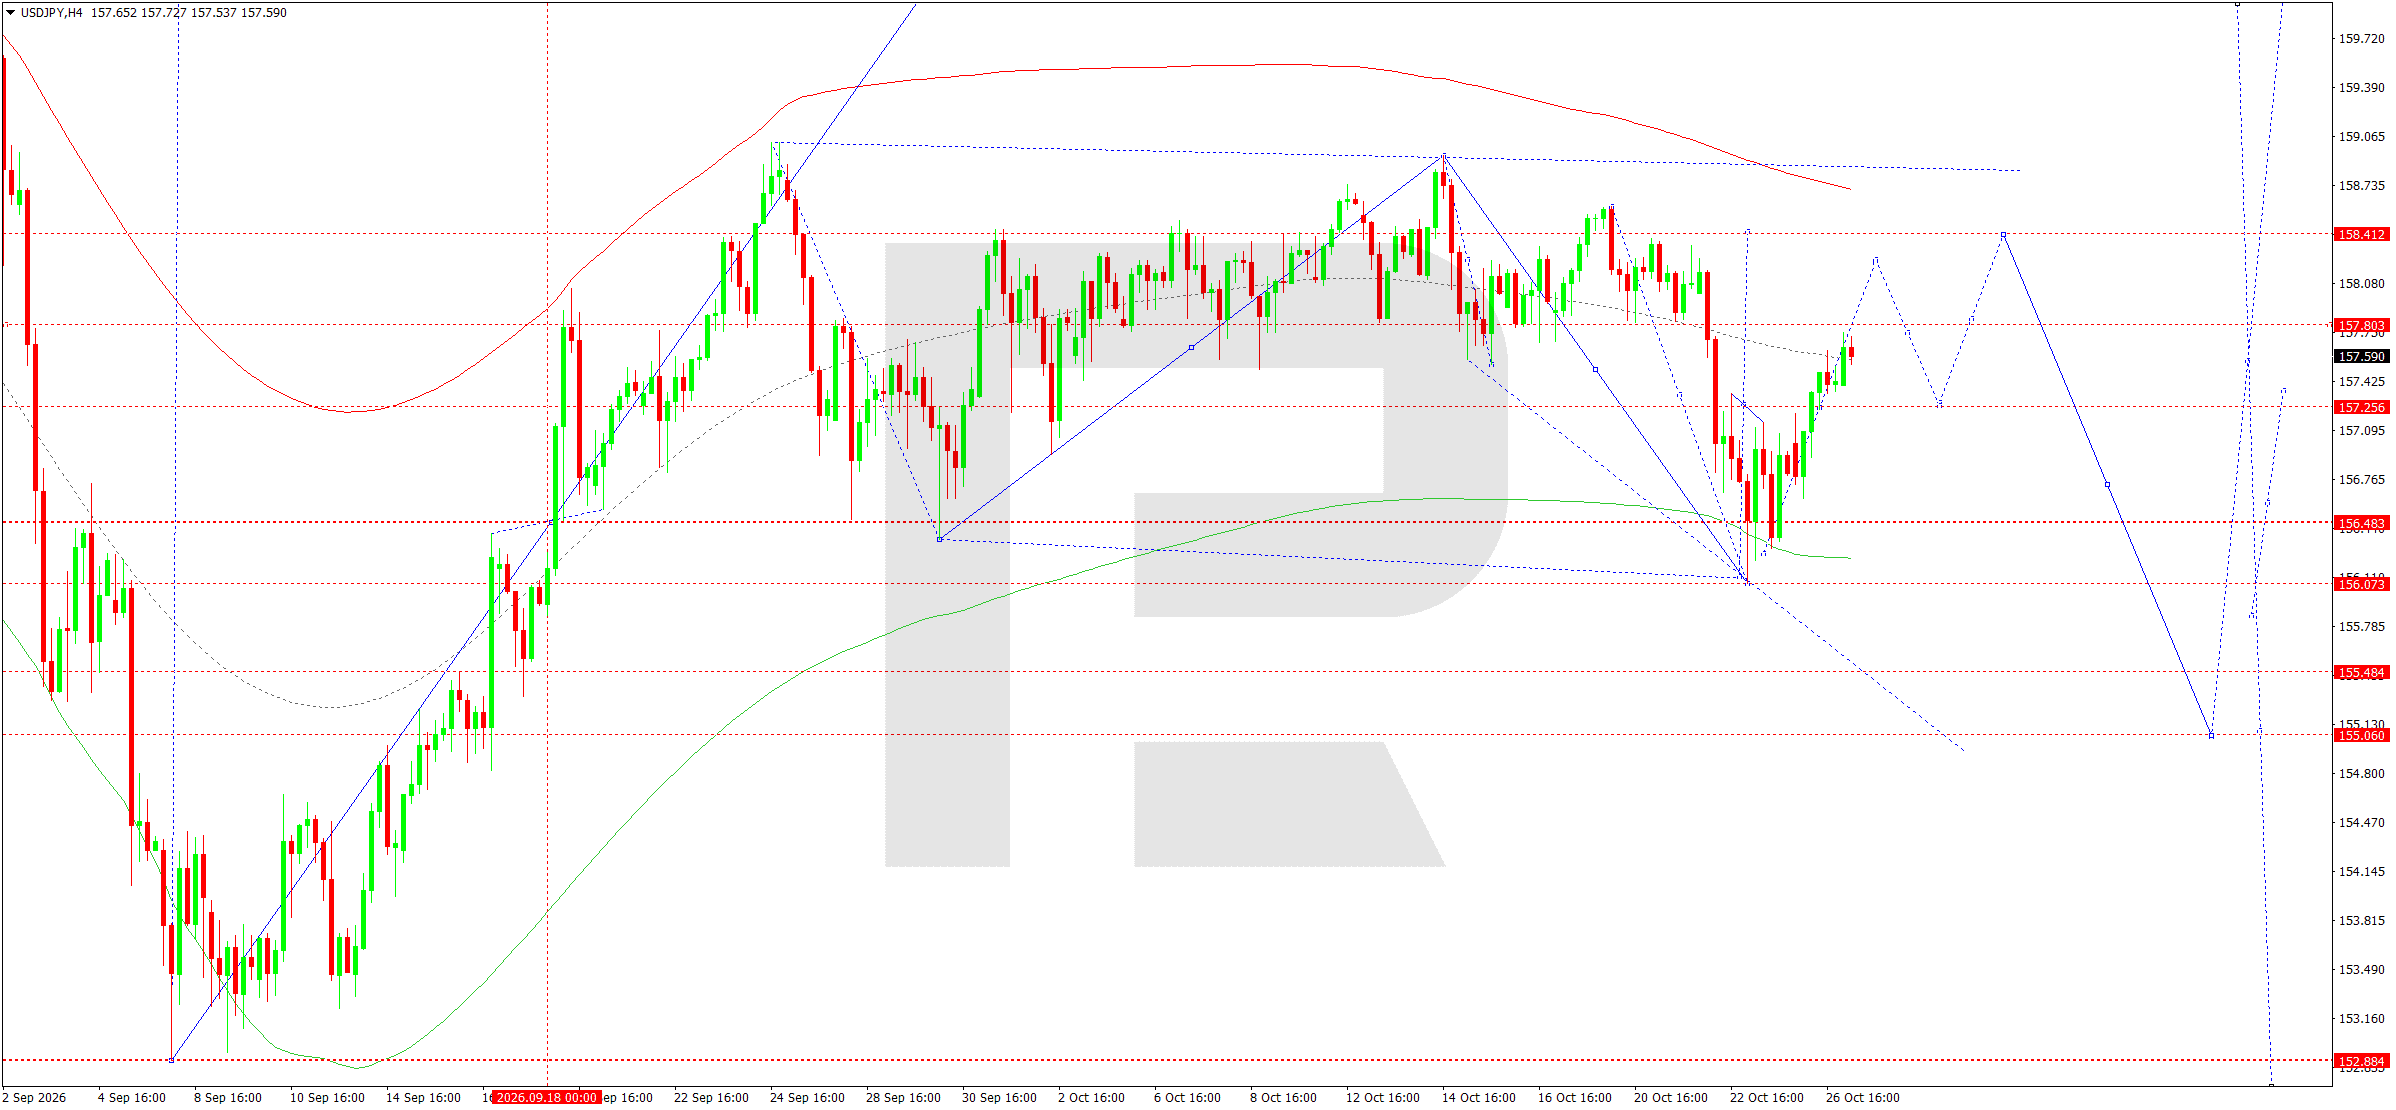
On the H4 chart, USDJPY completed a corrective decline towards the 156.07–156.48 area before forming a recovery wave towards 157.80.
Today, an upward movement towards an initial target of 158.41 is expected. The central line of the upward wave matrix around 157.20 is the main reference point.
The Elliott wave structure allows for the completion of the local correction and the formation of a new upward leg. The price has recovered above the lower boundary of the Price Envelope and is approaching its central area.
Breaking above resistance at 157.80 would open the way for growth towards 158.41. This level is the nearest technical target and a potential area for the current impulse to end.
After reaching 158.41, a corrective decline towards 157.20 is likely. The main intraday scenario therefore envisages an initial strengthening of the dollar followed by a return to the Envelope's central line.
A breakout below support at 157.20 would invalidate the short-term bullish scenario and increase the likelihood of another test of 156.48.
USDJPY forecast scenario
GBPUSD forecast
Sterling remains under pressure amid a stronger US dollar and persistent uncertainty over the outlook for the UK economy. Market participants are focusing on inflation risks, economic growth, and future decisions by the Bank of England.
Inflationary pressure in the UK remains an important monetary policy factor. Elevated energy costs limit the scope for inflation to return rapidly to target. At the same time, weak economic activity creates additional challenges for the regulator.
The presentation of the UK budget on 28 October is an important event. Investors will assess tax changes, public spending plans, and prospects for financing the budget deficit. Rising UK government bond yields amid fiscal risks could put additional pressure on sterling.
The Fed meeting is another factor. Persistently high yields on US assets support the dollar and limit the potential for a sustained GBPUSD recovery.
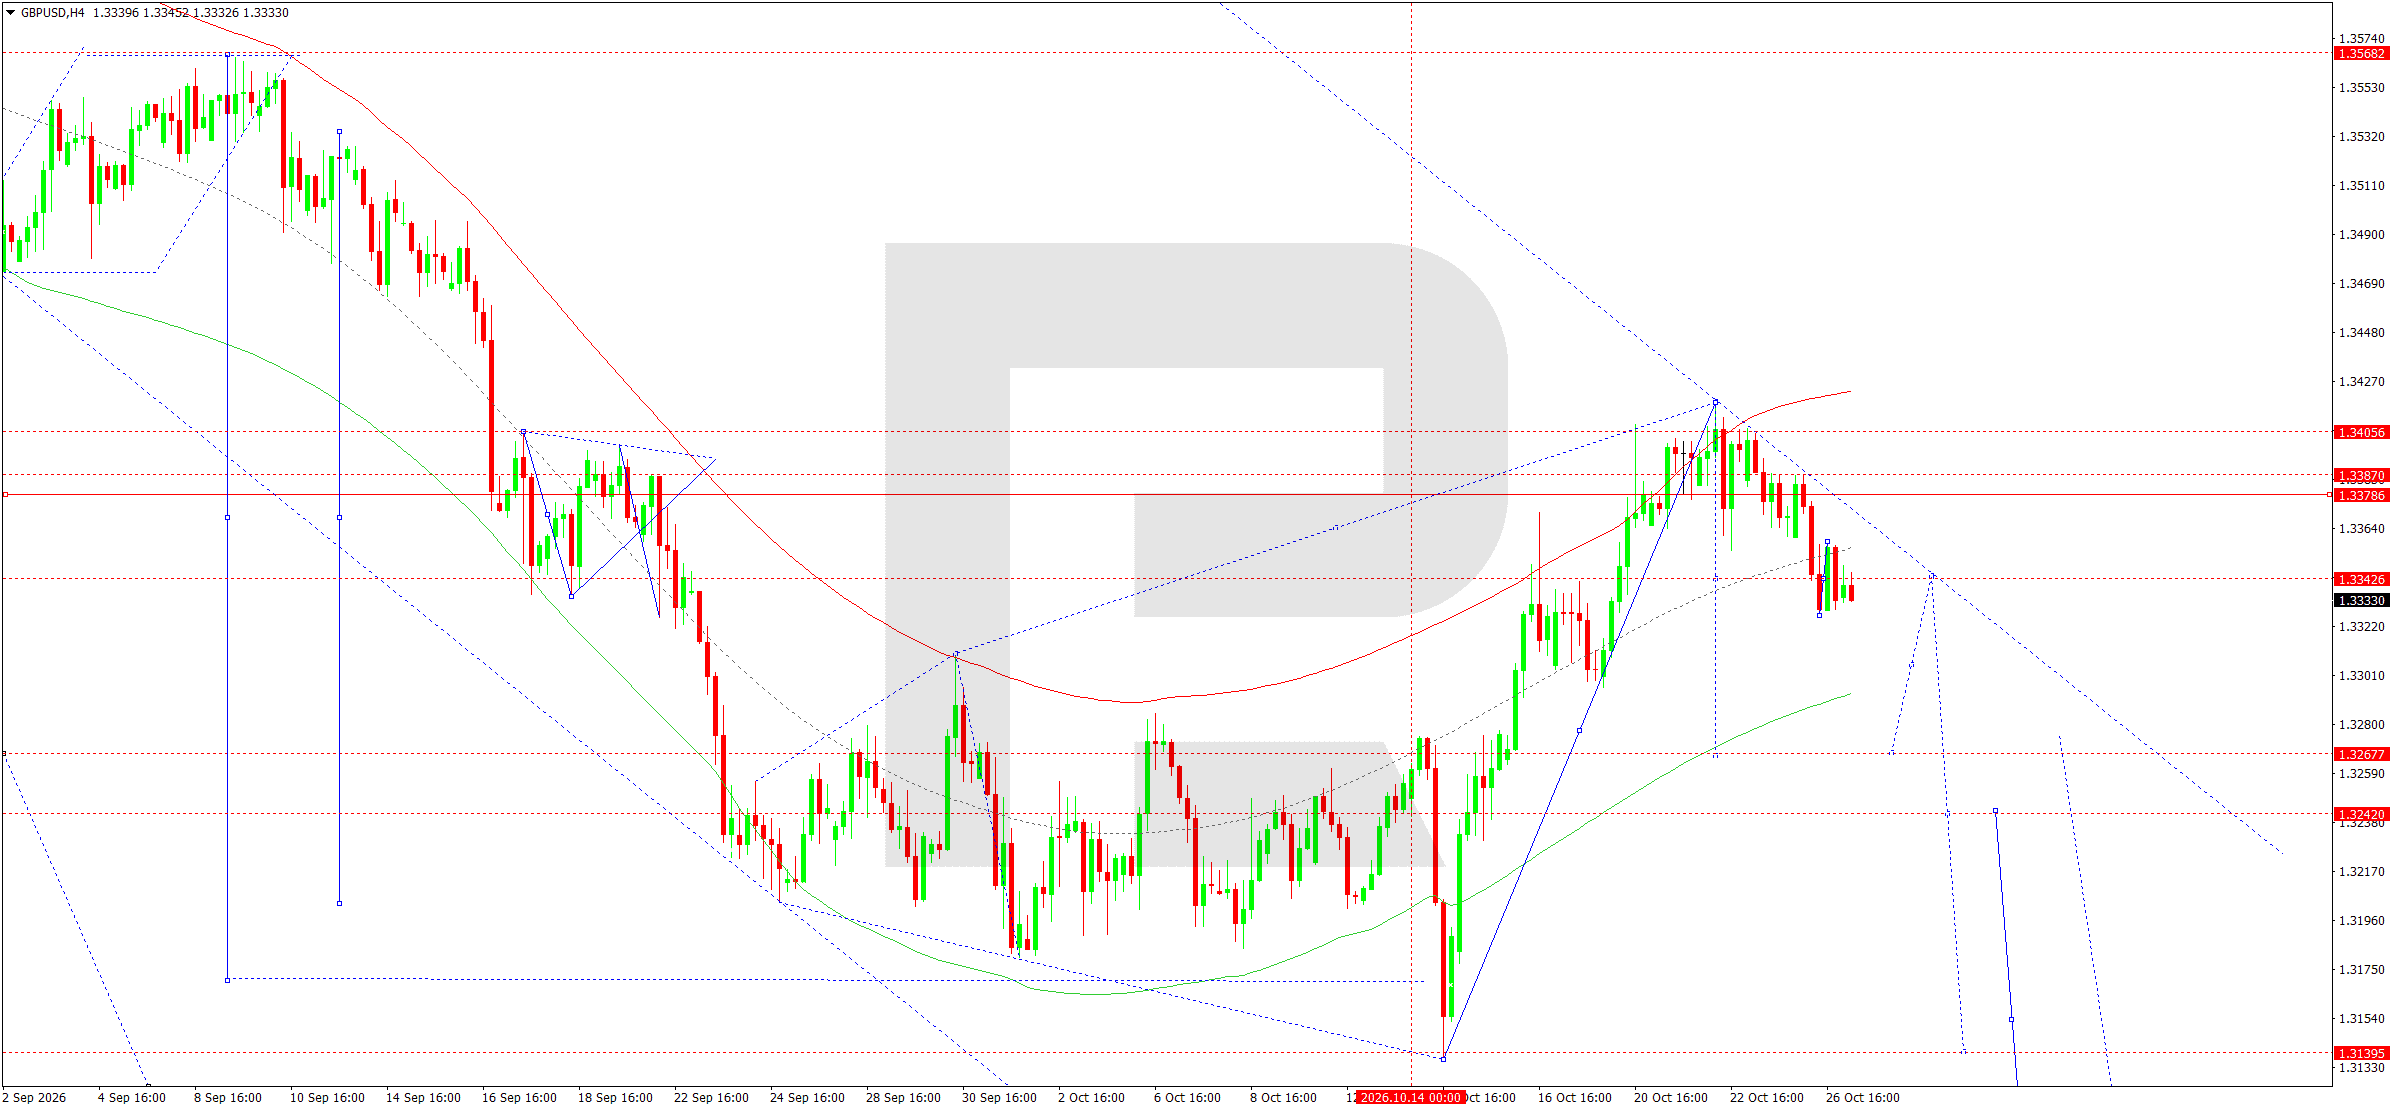
On the H4 chart, GBPUSD completed a recovery wave around 1.3406 before forming a downward movement towards the 1.3343 area.
Today, 27 October, a compact consolidation range is expected below 1.3343. The main trend remains bearish, with the price below resistance from the established downward channel.
The downward wave matrix, with its pivot in the 1.3343–1.3347 area, defines the immediate balance between buyers and sellers. Holding below this area supports the likelihood of further declines.
The Elliott wave structure allows for another downward impulse towards an initial target of 1.3277. Further selling pressure would open the way towards 1.3242 and then 1.3139.
The Price Envelope indicates that the local upward movement has ended and a correction is forming. The nearest resistance is at 1.3379, with more significant resistance at 1.3406.
The primary scenario envisages a decline towards 1.3277, with scope for a further move towards 1.3139. A return above 1.3406 would weaken the bearish structure.
GBPUSD forecast scenario
AUDUSD forecast
The Australian dollar remains dependent on US dollar movements, the state of China's economy, and changes in global demand for commodities. Amid heightened uncertainty, investors continue to assess the monetary policy outlook for the Reserve Bank of Australia.
The key event for the upcoming trading sessions is the release of Australian inflation data on 28 October. The figures will help clarify the likelihood of further monetary tightening. Persistent inflationary pressure could support the national currency, although weak economic activity limits its appreciation potential.
China's economic conditions are another influence. China remains Australia's most important trading partner, so changes in industrial demand, investment activity, and metal prices directly affect expectations in the foreign exchange market.
The US dollar is supported by relatively high yields on US government bonds. Ahead of the Fed's decision, investors remain cautious about buying higher-yielding currencies.
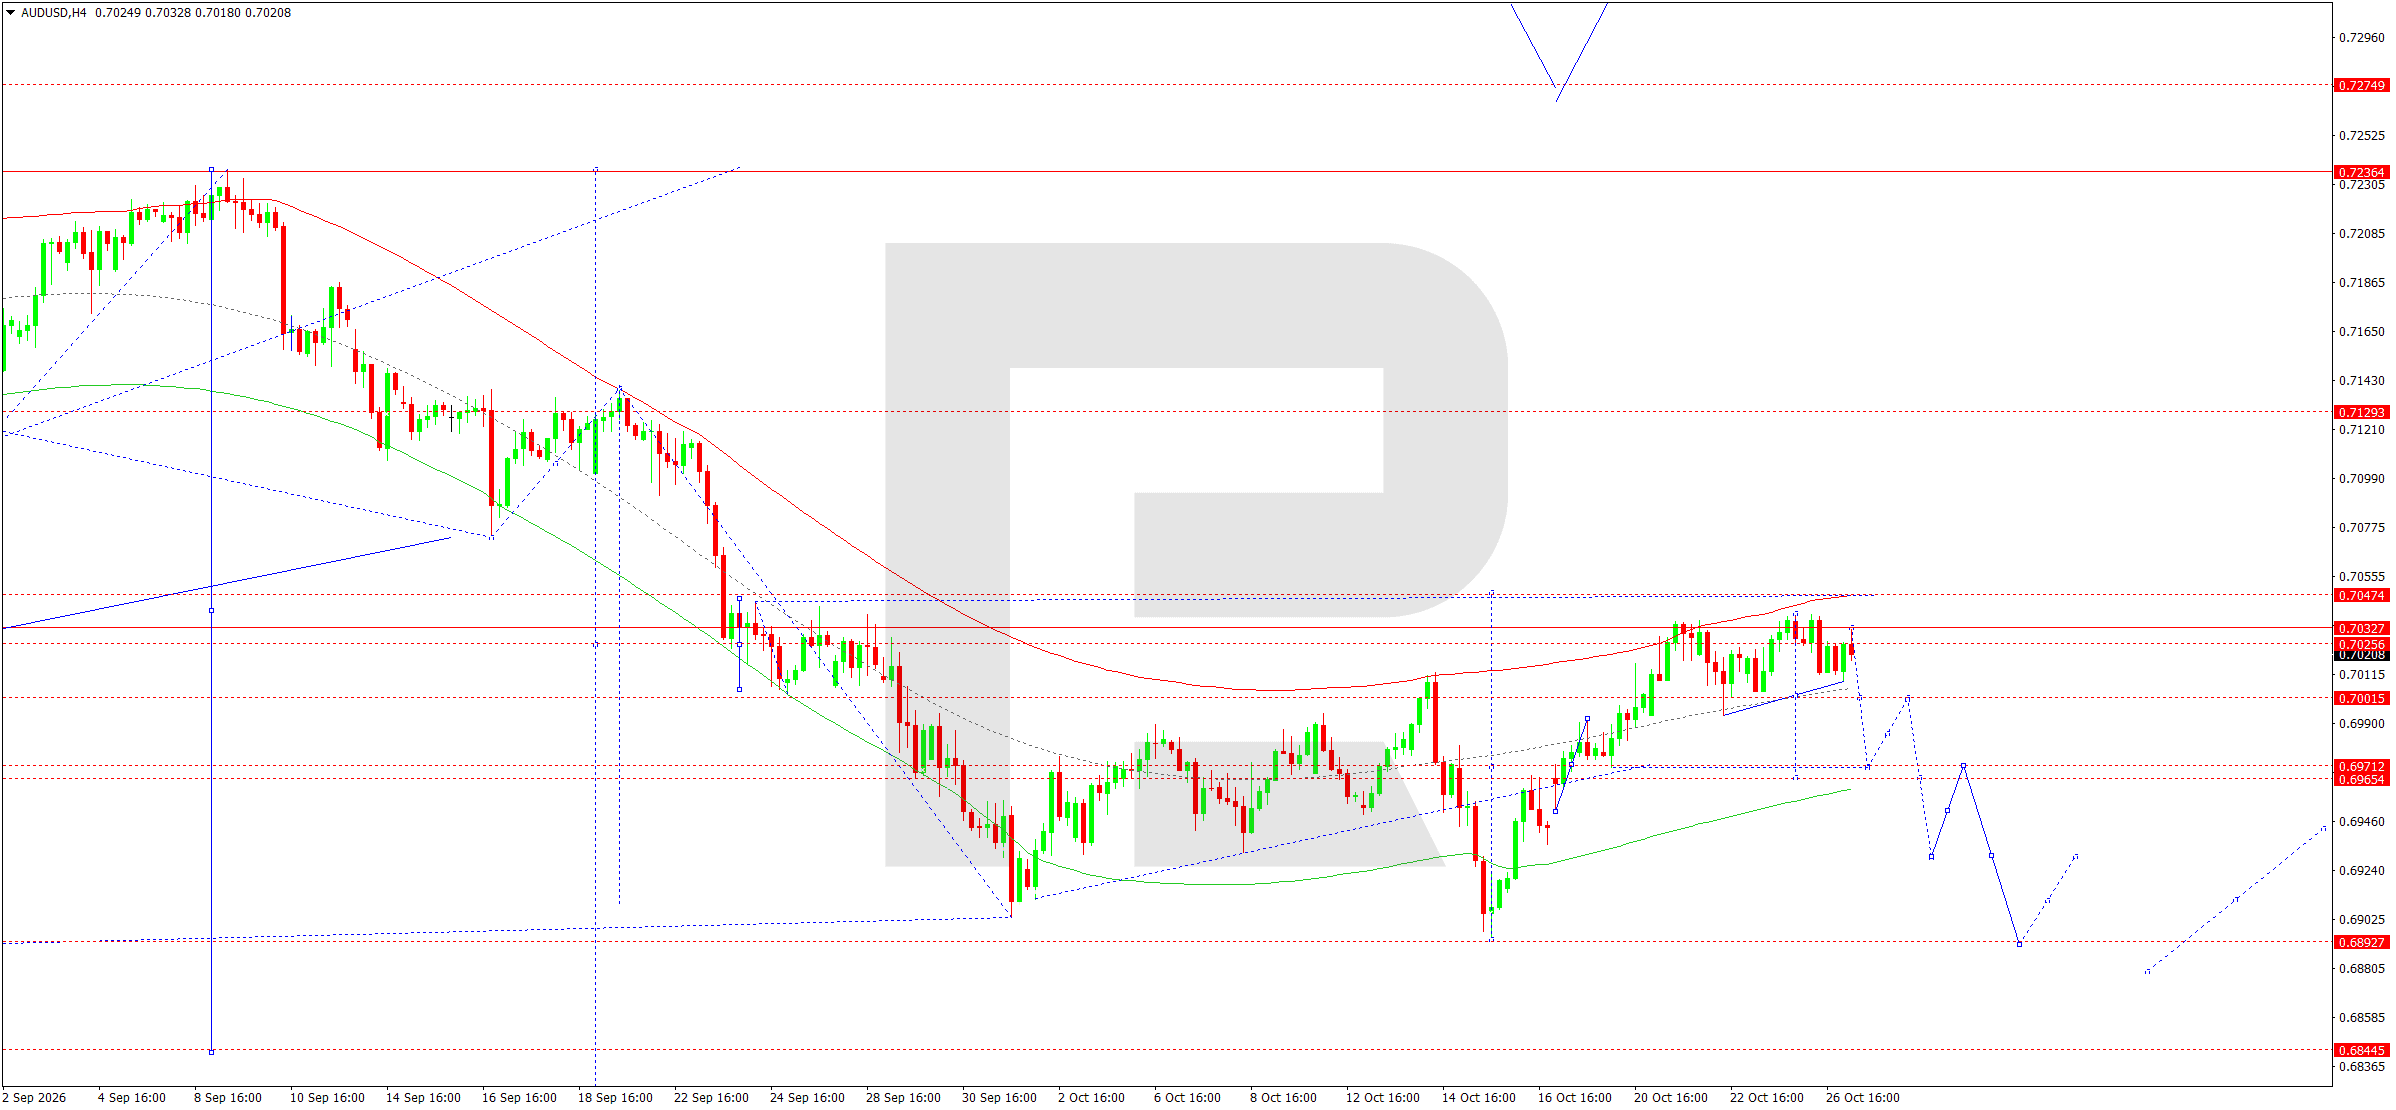
On the H4 chart, AUDUSD formed a recovery wave towards 0.7032 before consolidating around 0.7022.
Today, the current range could extend towards resistance at 0.7040–0.7047. This area coincides with the upper boundary of the local Price Envelope and is regarded as a potential end point for the corrective rise.
The downward wave matrix, with its pivot around 0.7024, remains a decisive reference point. Unless the price consolidates above 0.7047, continuation of the downtrend remains the prevailing scenario.
The Elliott wave structure allows for the corrective leg to end and a new downward impulse to begin. The initial target is support at 0.7001. A breakout below it would pave the way for a decline towards 0.6971 and then 0.6940.
The main technical target is around 0.6893, corresponding to the lower area of the broader price range.
The short-term recovery is therefore viewed as a correction within the bearish structure. Consolidation above 0.7047 would require a reassessment of the current forecast.
AUDUSD forecast scenario
USDCAD forecast
The Canadian dollar is influenced by expectations concerning the Bank of Canada's forthcoming decision and developments in the global oil market. The central bank is scheduled to meet on 28 October, and its decision could determine USDCAD's short-term direction.
Market participants are assessing the likelihood of an interest rate change amid persistent inflationary pressure and mixed economic activity. Comments on the future path of monetary policy, labour market conditions, and domestic demand prospects will be particularly important.
Relatively high oil prices could provide additional support for the Canadian dollar. However, reports of a possible easing of geopolitical tensions in the Middle East set the stage for a correction in energy prices.
The US dollar retains fundamental support from high government bond yields and expectations of a cautious Fed stance. Diverging monetary policy prospects in the US and Canada continue to determine medium-term currency flows.
Volatility could change sharply ahead of both central banks' decisions. Higher oil prices may provide further support for the Canadian dollar, while deteriorating global risk appetite could renew demand for the US currency.
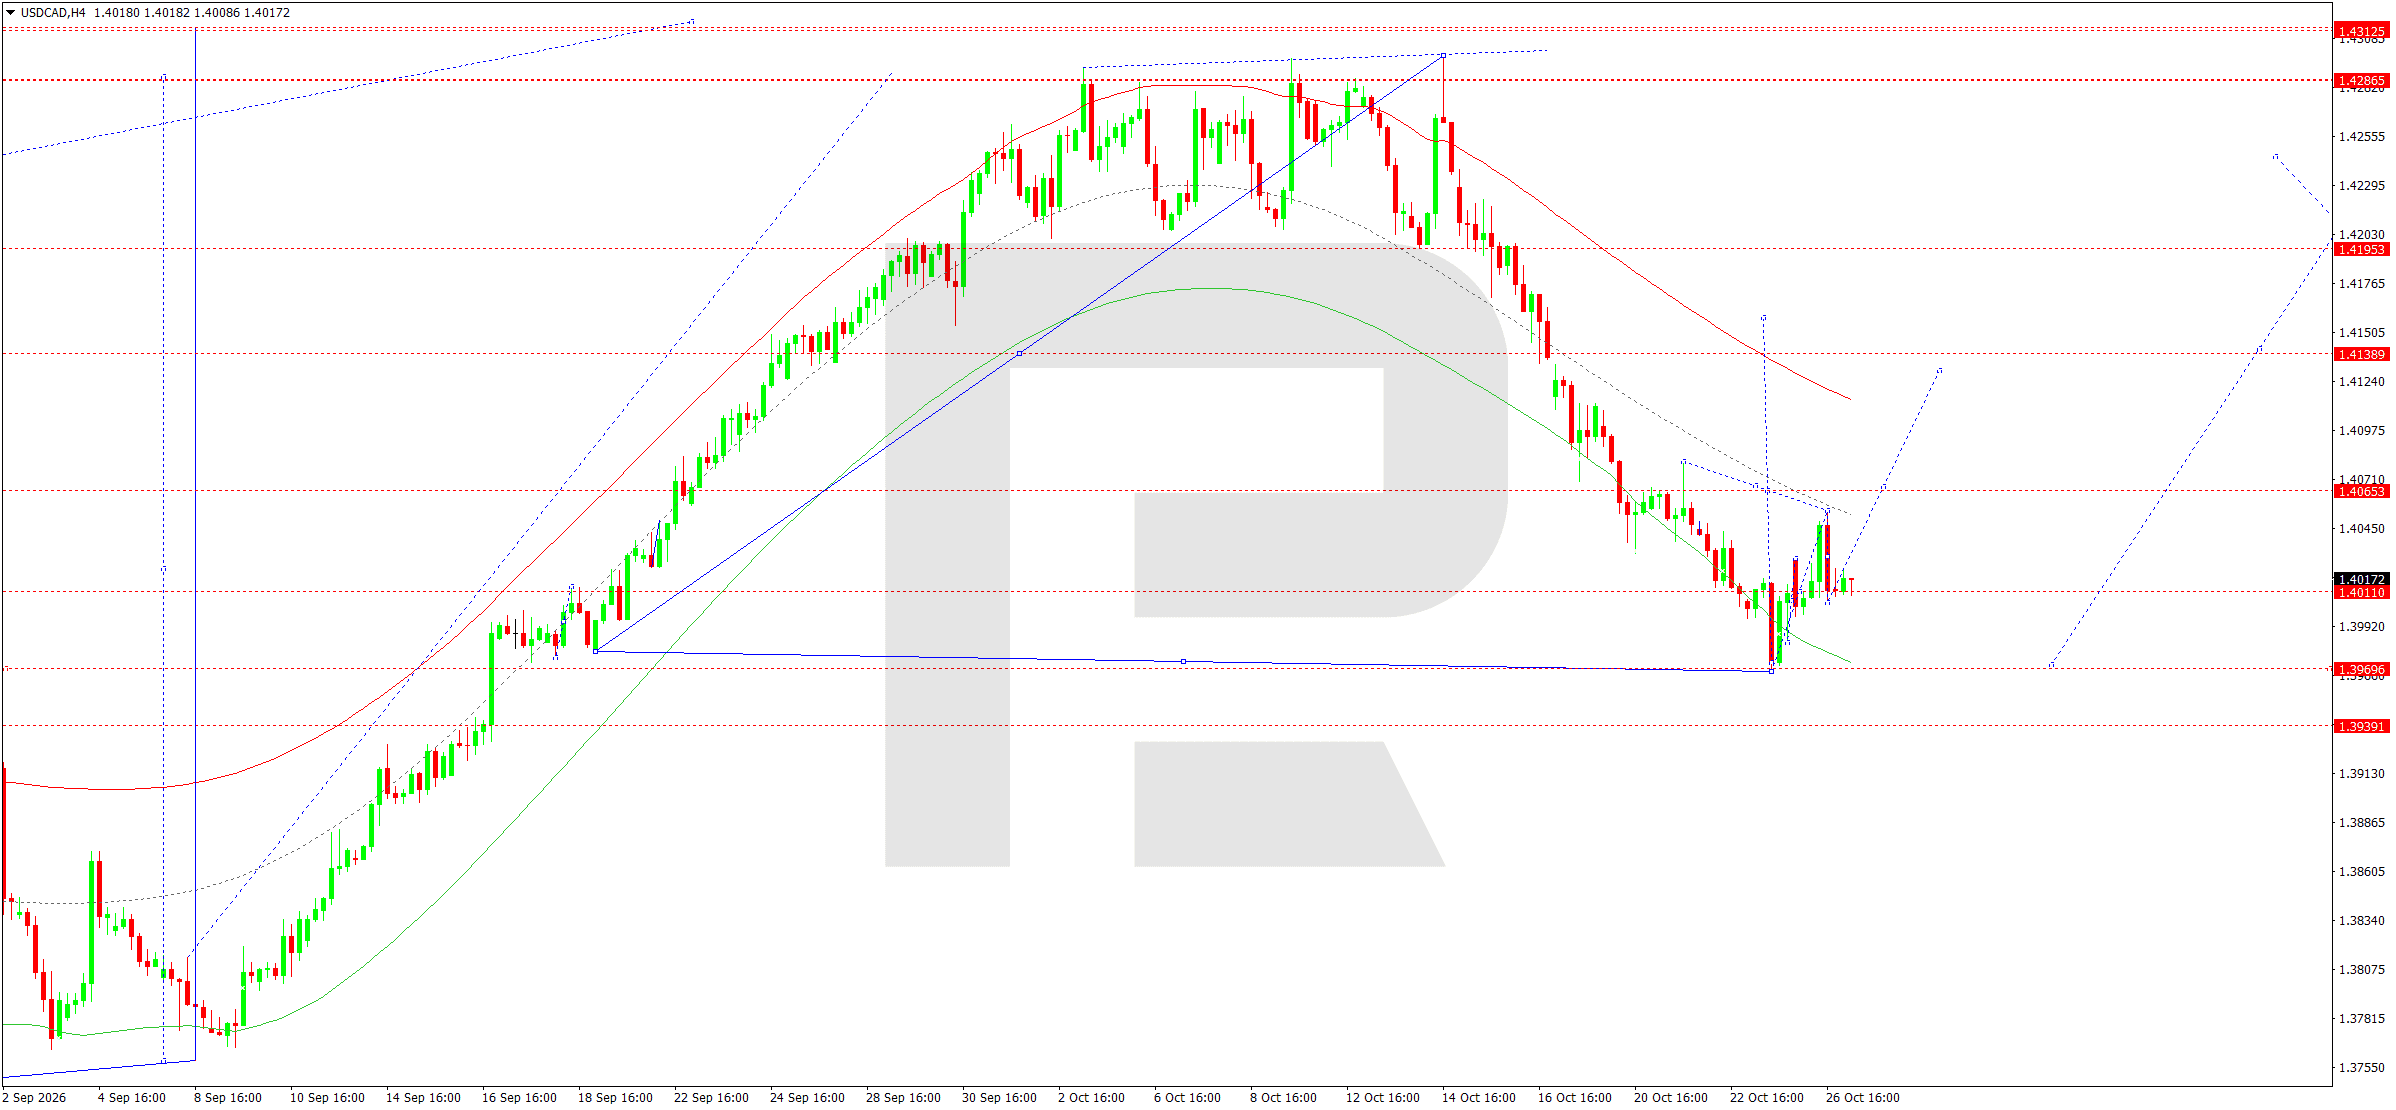
On the H4 chart, USDCAD formed a downward wave from the 1.4287 area to support at 1.3969. After reaching the lower boundary of the Price Envelope, a corrective recovery began.
Today, a consolidation range is expected around 1.4011. The local wave structure allows for a continued recovery after the downward impulse ends.
The downward wave matrix remains important. In the near term, 1.4065 is resistance; a breakout above it would open the way towards 1.4139.
The Price Envelope indicates a possible return from its lower boundary to the central line. Consolidation above 1.4065 would make the 1.4141 area the next technical target.
However, the overall medium-term trend remains bearish. The expected rise is therefore primarily regarded as a corrective movement.
A breakout below support at 1.3969 would invalidate the recovery scenario and open the door for a decline towards 1.3939 and then 1.3900.
The primary scenario suggests an upward correction towards 1.4139–1.4141, provided support at 1.3969 holds.
USDCAD forecast scenario
XAUUSD forecast
The gold market continues to be affected by the strengthening US dollar and persistently high yields on US government bonds. Investors are primarily focused on the forthcoming Fed meeting and the outlook for further changes in interest rates.
High yields on US debt instruments increase the opportunity cost of holding gold, which pays no interest. This limits the precious metal's recovery potential.
Geopolitical developments in the Middle East are another factor. Continuing risks of disruptions to energy supplies sustain safe-haven demand for gold. However, reports of a possible easing of tensions may temporarily reduce the appeal of defensive assets.
Investors are also awaiting US gross domestic product data and the Personal Consumption Expenditures (PCE) price index. These indicators will help clarify the inflation outlook and future Fed decisions.
Under current conditions, gold faces opposing influences. Geopolitical uncertainty supports long-term demand, while a stronger dollar and higher real interest rates put pressure on prices.
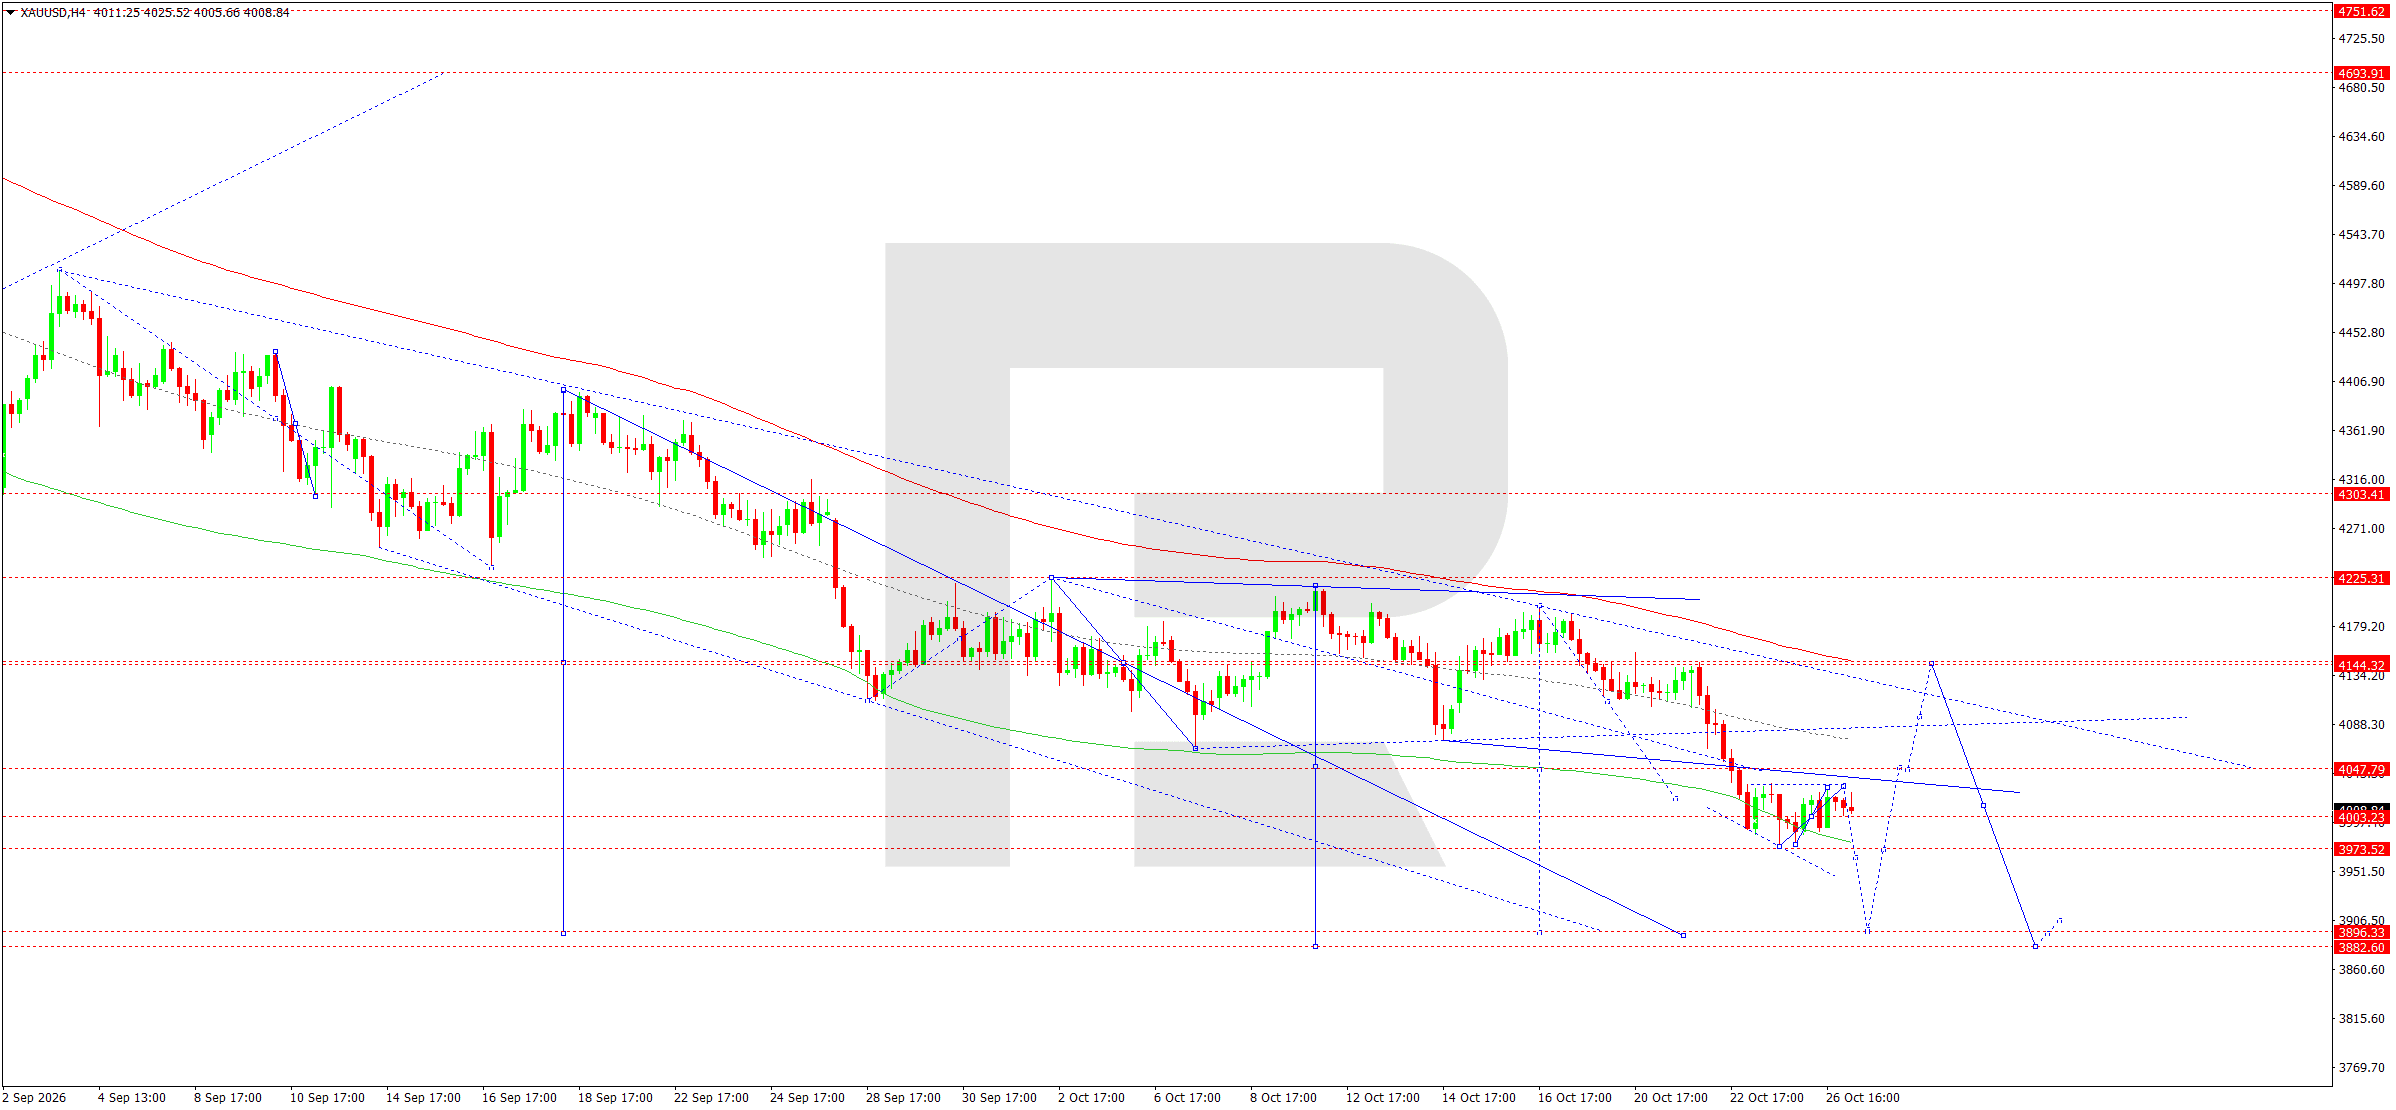
On the H4 chart, XAUUSD continues to develop a downward wave structure. After declining to the 3,974–3,975 area, a compact consolidation range formed around 4,003.
Today, 27 October, a local recovery towards 4,031–4,048 is possible, corresponding to resistance from the downward Price Envelope.
The downward wave matrix, with its pivot around 4,225, remains negatively oriented. Prices are significantly below the central level, confirming sellers' predominance.
The Elliott wave structure allows for an interim correction before the downward impulse continues. After the recovery towards 4,031–4,048 ends, a decline towards support at 3,974 is expected.
A breakout below this area would open the way for a move towards 3,896 and then 3,883. These levels are the main targets of the current downward structure.
A return above 4,048 would weaken the immediate selling signal, although a more substantial recovery would be needed to change the overall technical picture.
The primary scenario suggests the end of the local correction and further declines towards 3,896–3,883.
XAUUSD forecast scenario
US 500 forecast
The US stock market is in investors' focus ahead of the Fed meeting and the release of quarterly financial results from major technology corporations.
The main factor remains high yields on US government bonds, which put pressure on valuations of companies with high expected growth rates. Investors are closely monitoring interest rate prospects and potential changes in corporate financing costs.
Reports from major technology companies are another influence. Particular attention is being paid to artificial intelligence spending, cloud technology development, and companies' ability to grow earnings despite substantial capital investment.
At the start of the week, global stock markets saw renewed interest in technology assets. However, persistent inflation risks and uncertainty about future Fed policy limit the sustainability of the positive momentum.
Geopolitical developments and high energy prices also remain significant factors. Rising production costs could adversely affect corporate profitability.
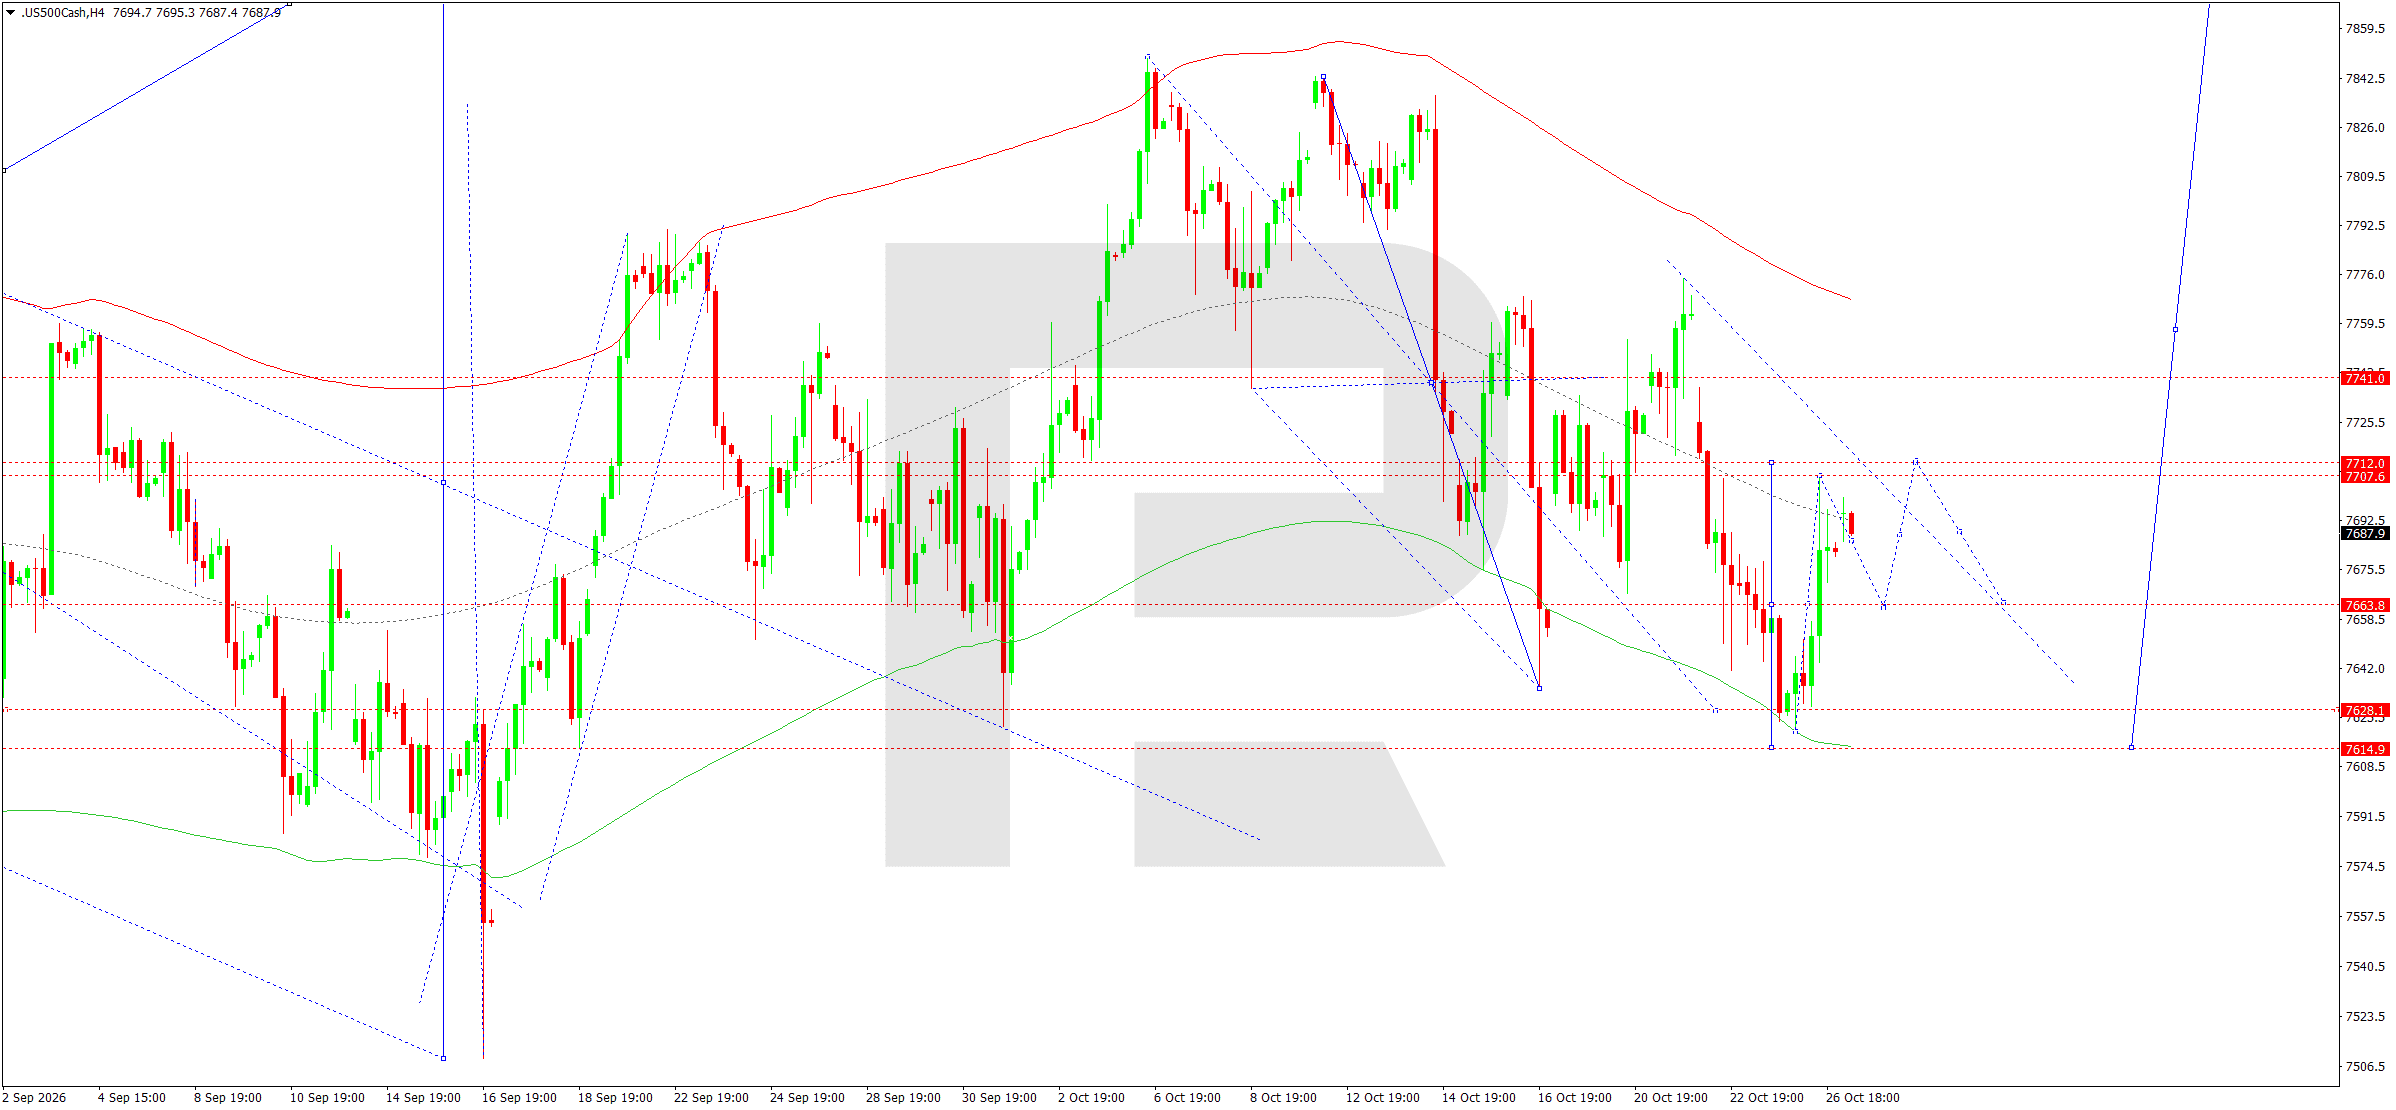
On the H4 chart, US 500 formed a downward wave from the 7,842 area to support at 7,615. A corrective recovery began after the price reached the lower boundary of the Price Envelope.
Today, 27 October, consolidation is expected in the 7,664–7,712 area. The main technical reference point is 7,741, corresponding to the matrix's central line.
The Elliott wave structure allows for the local downward impulse to end and a recovery wave to form. The nearest resistance lies at 7,708–7,712.
Consolidation above this area would set the stage for further growth towards 7,741. If buying strengthens, the next target will be the upper area of the Envelope around 7,760.
However, the medium-term structure still shows signs of a downward correction. The recovery is therefore regarded as a movement within a broader range.
A breakout below support at 7,664 would increase the likelihood of another decline towards 7,628 and 7,615.
The main intraday forecast envisages continued corrective growth towards 7,741, provided prices remain above the nearest support.
US 500 forecast scenario
BTCUSD forecast
Bitcoin remains highly sensitive to changes in global risk appetite and expectations for US monetary policy.
Cryptocurrency market participants are primarily focused on the Fed meeting. Relatively high interest rates and yields on US government bonds limit the appeal of higher-risk assets, including cryptocurrencies.
The US stock market is another factor. A recovery in demand for technology stocks could improve investor sentiment and support interest in digital assets.
However, persistent uncertainty about inflation and economic growth prospects encourages cautious positioning. Investors are assessing the likelihood of further tightening of financial conditions and a possible reduction in liquidity.
A broad trading range is likely to persist ahead of the Fed's decision. Improving market sentiment would create conditions for a price recovery, while a stronger dollar could trigger a retest of nearby support levels.
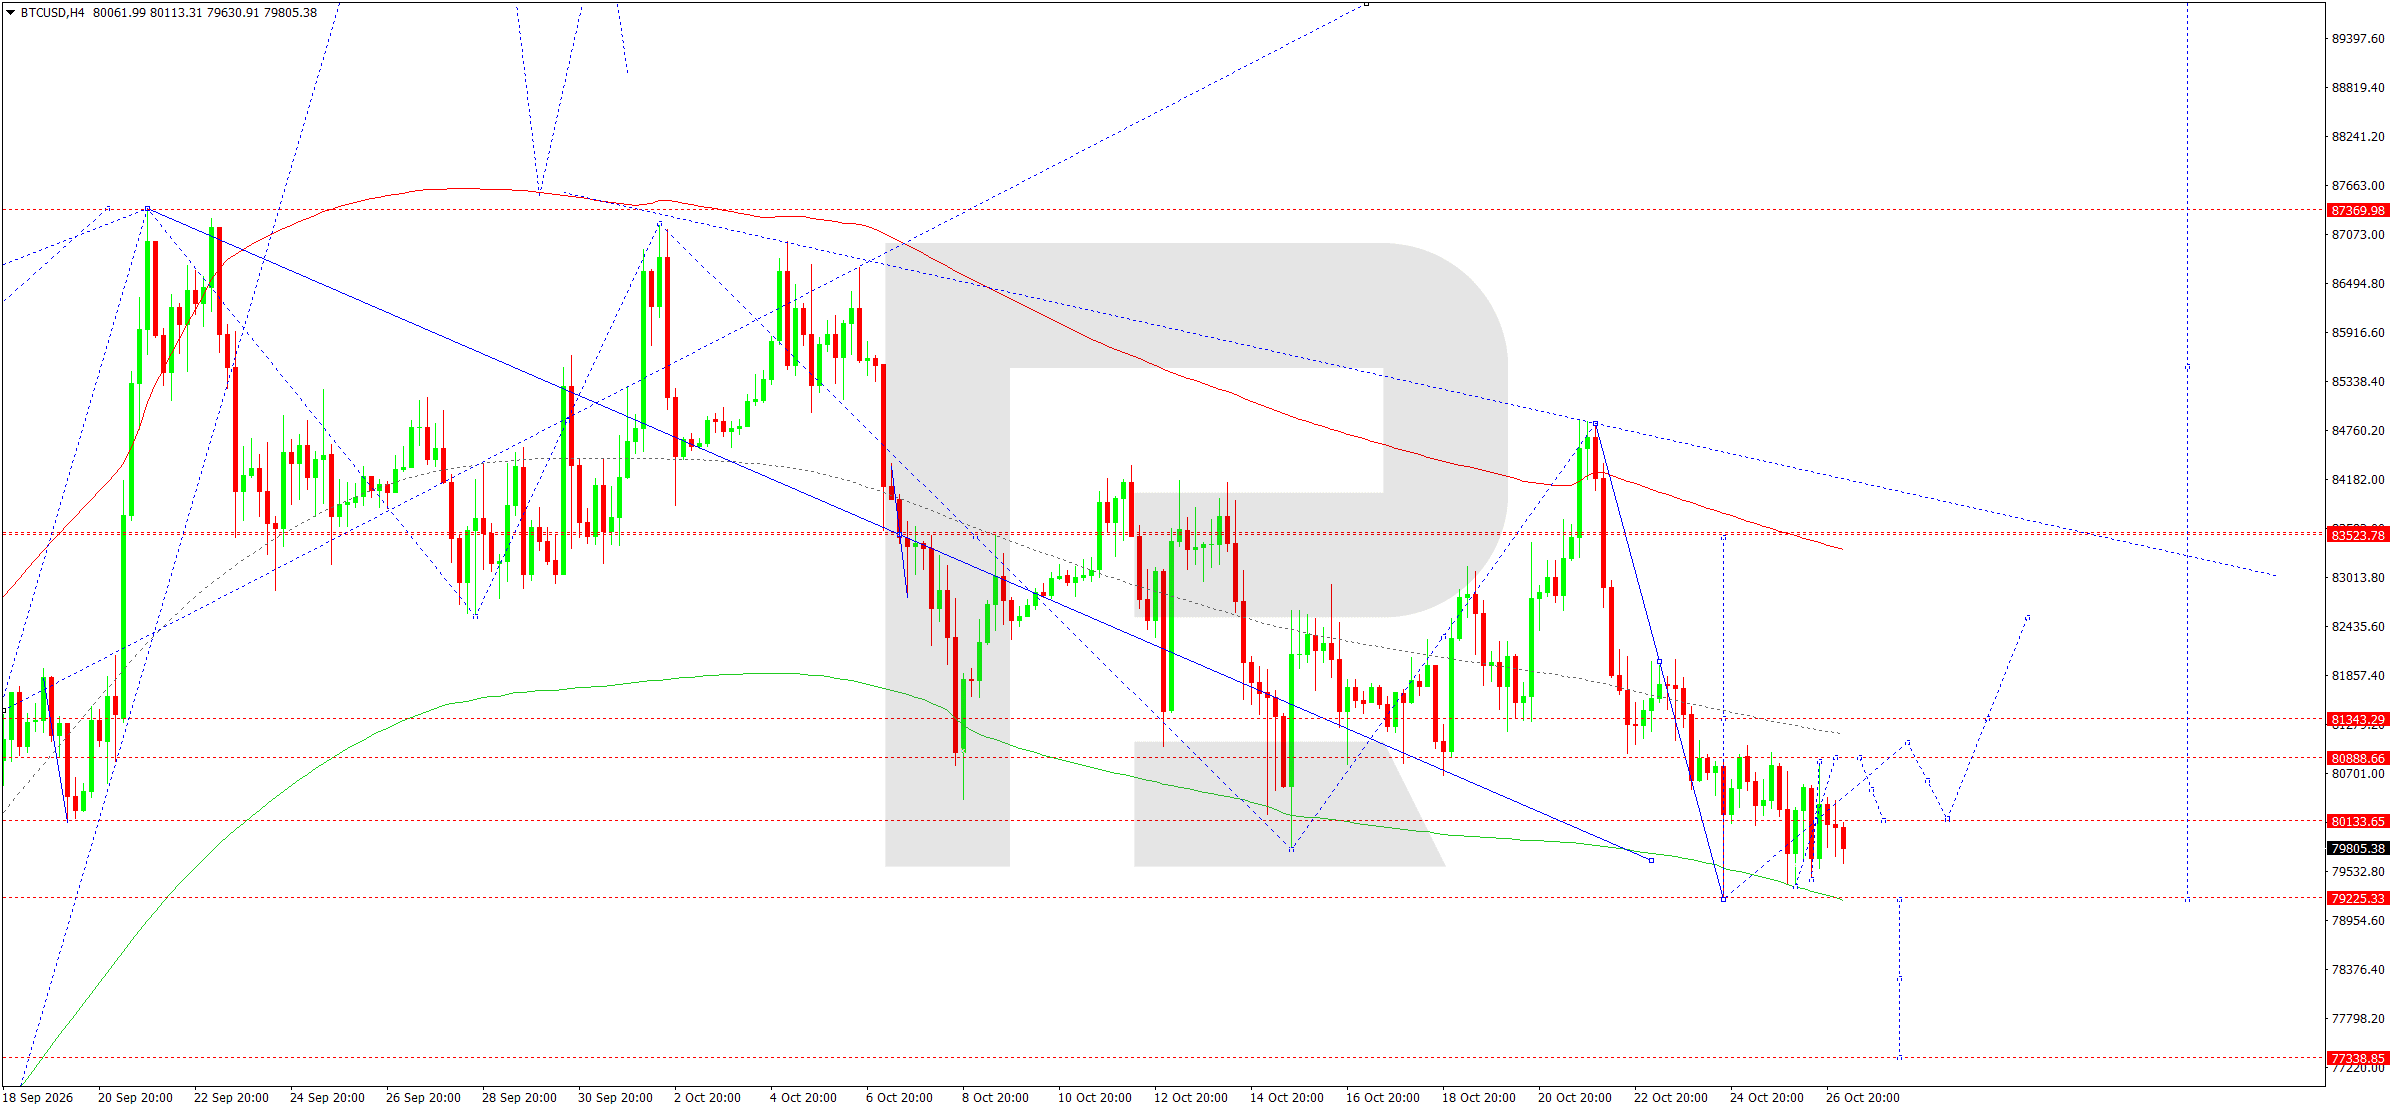
On the H4 chart, BTCUSD formed a downward wave from the 84,760 area to support at 79,225. Consolidation began after the price reached the lower boundary of the Price Envelope.
Today, 27 October, another test of 79,225 from above is possible, followed by a recovery.
The downward wave matrix, with its pivot around 83,460, defines the key resistance area. While prices remain below this level, the medium-term structure retains signs of a downward correction.
The Elliott wave model allows for the end of the local downward impulse and the formation of a corrective upward wave. The nearest resistance is at 80,888.
Breaking above this level would open the way for growth towards 81,343. Further buying strength would open the way towards 83,534, corresponding to the upper area of the current Price Envelope.
A breakout below support at 79,225 would invalidate the recovery scenario and increase the likelihood of a decline towards 77,339.
The primary scenario suggests that support at 79,225 will hold, allowing for a corrective rise towards 83,534. Consolidation above 80,888 would confirm the scenario.
BTCUSD forecast scenario
Editors’ picks


EURUSD forecast 2026–2027: technical analysis, price levels & predictions
The EURUSD outlook for 2026 and 2027: key levels on the daily chart, three trading scenarios and the policy gap between the Fed and the ECB that drives the pair.

Gold (XAUUSD) forecast 2026: technical analysis, price levels & predictions
Where gold could trade in 2026: key levels, three trading scenarios with entry triggers and the forecasts from J.P. Morgan, Deutsche Bank and Goldman Sachs.
Forecasts presented in this section only reflect the author’s private opinion and should not be considered as guidance for trading. RoboForex bears no responsibility for trading results based on trading recommendations described in these analytical reviews.