
Daily technical analysis and forecast for 30 October 2026
Daily technical analysis and forecast for EURUSD, USDJPY, GBPUSD, AUDUSD, USDCAD, XAUUSD, US 500, and BTCUSD for 30 October 2026.
Each scenario on this page reflects the market structure on the H4 chart as of 10:00 AM UTC+3 on 30 October 2026. The assessment considers the current H4 chart structure, key support and resistance levels, the direction of the medium-term movement, and the prevailing fundamental backdrop.
EURUSD forecast
The EURUSD pair is ending October influenced by diverging expectations for monetary policy in the US and eurozone. The main factor remains the outlook for interest rates set by the Federal Reserve and the European Central Bank. US inflation, consumer spending, and government bond yields are particularly important for the dollar. Persistently elevated yields support the US currency and limit the euro's recovery potential.
In the eurozone, market participants are focusing on inflation figures, industrial conditions, and economic growth prospects. Weak business activity could strengthen expectations of a more accommodative ECB stance. Other factors exerting influence include energy prices, trade relations with the US, and geopolitical risks.
On Friday, investors' month-end positioning could become an important factor. Demand for the dollar amid caution towards risk assets could sustain EURUSD's downward momentum. However, declining US bond yields could trigger a short-term corrective rise in the euro.
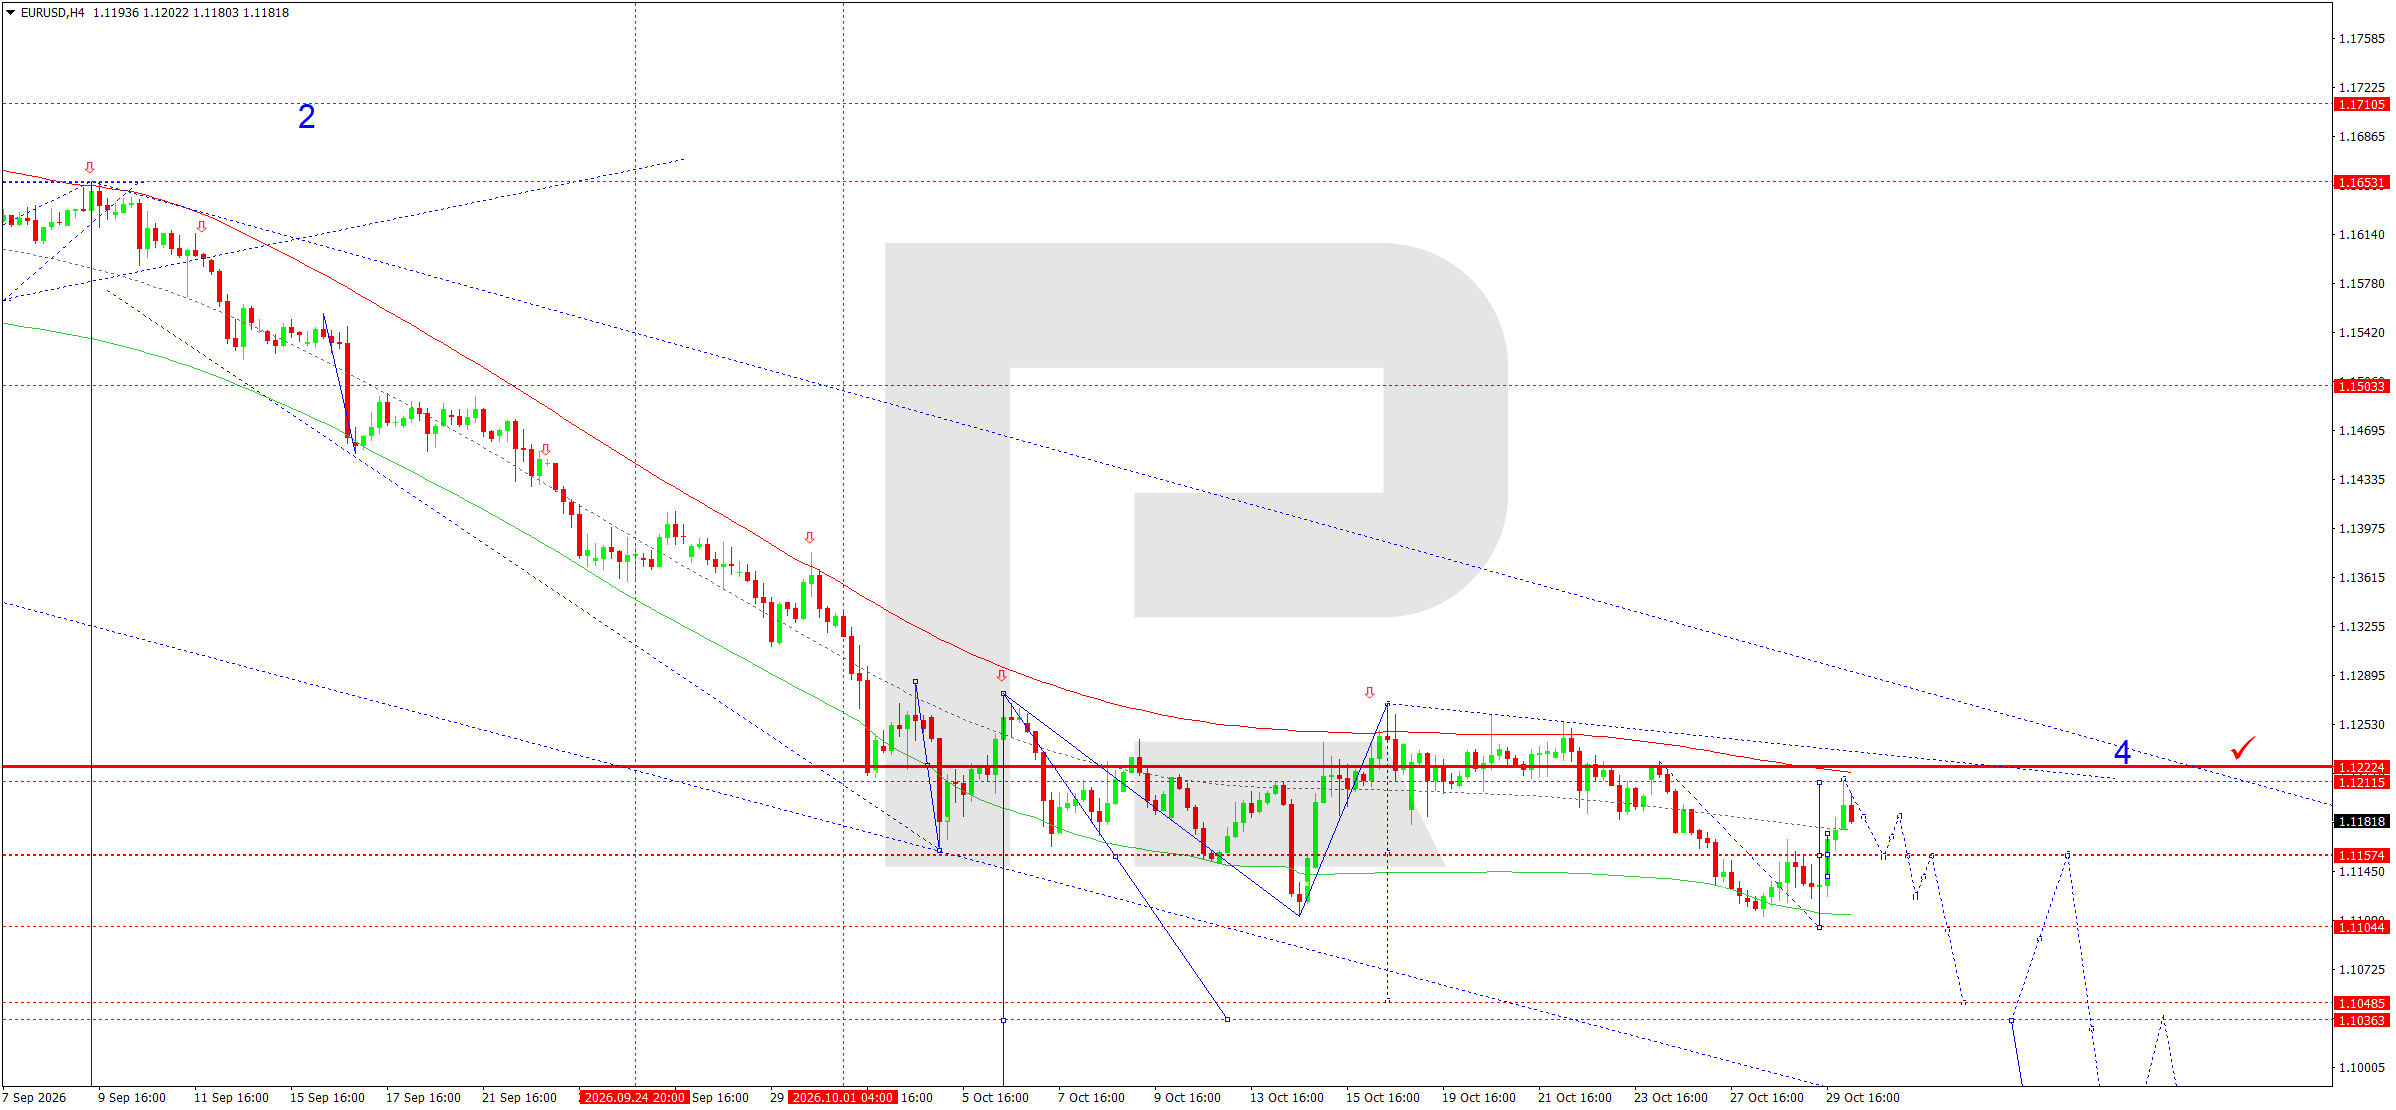
On the H4 chart, EURUSD completed a decline towards 1.1112 and formed a corrective recovery towards 1.1211. The main trend remains bearish. Consolidation is taking place below key resistance at 1.1222, the pivot of the downward wave matrix.
The Elliott wave structure allows for another downward impulse once the correction ends. A breakout below support at 1.1157 would open the way towards 1.1104, with further targets at 1.1070 and 1.1048. Over a longer horizon, a decline towards 1.0793 remains possible.
Sellers retain the advantage while prices remain below 1.1222. Consolidation above this resistance level would weaken the current scenario.
EURUSD forecast scenario
USDJPY forecast
USDJPY movements are determined by the spread between US and Japanese government bond yields and expectations for future central bank decisions. Dollar resilience is linked to assessments of US inflation and the prospects for relatively tight financial conditions. Higher US bond yields traditionally increase the appeal of dollar assets relative to the Japanese yen.
The Bank of Japan's policy is crucial for the Japanese currency. Market participants are assessing persistent inflation, wage developments, and the likelihood of further interest rate normalisation. Any indication of faster policy tightening could support the yen.
The Japanese authorities' sensitivity to sharp currency movements is another factor. As the exchange rate approaches psychologically important levels, attention to possible warnings from Japan's Ministry of Finance increases.
Institutional investors may adjust their currency positions at the end of October. With the yield differential continuing to favour the dollar, USDJPY retains medium-term upside potential. However, heightened global uncertainty could temporarily increase demand for the yen as a safe-haven currency.
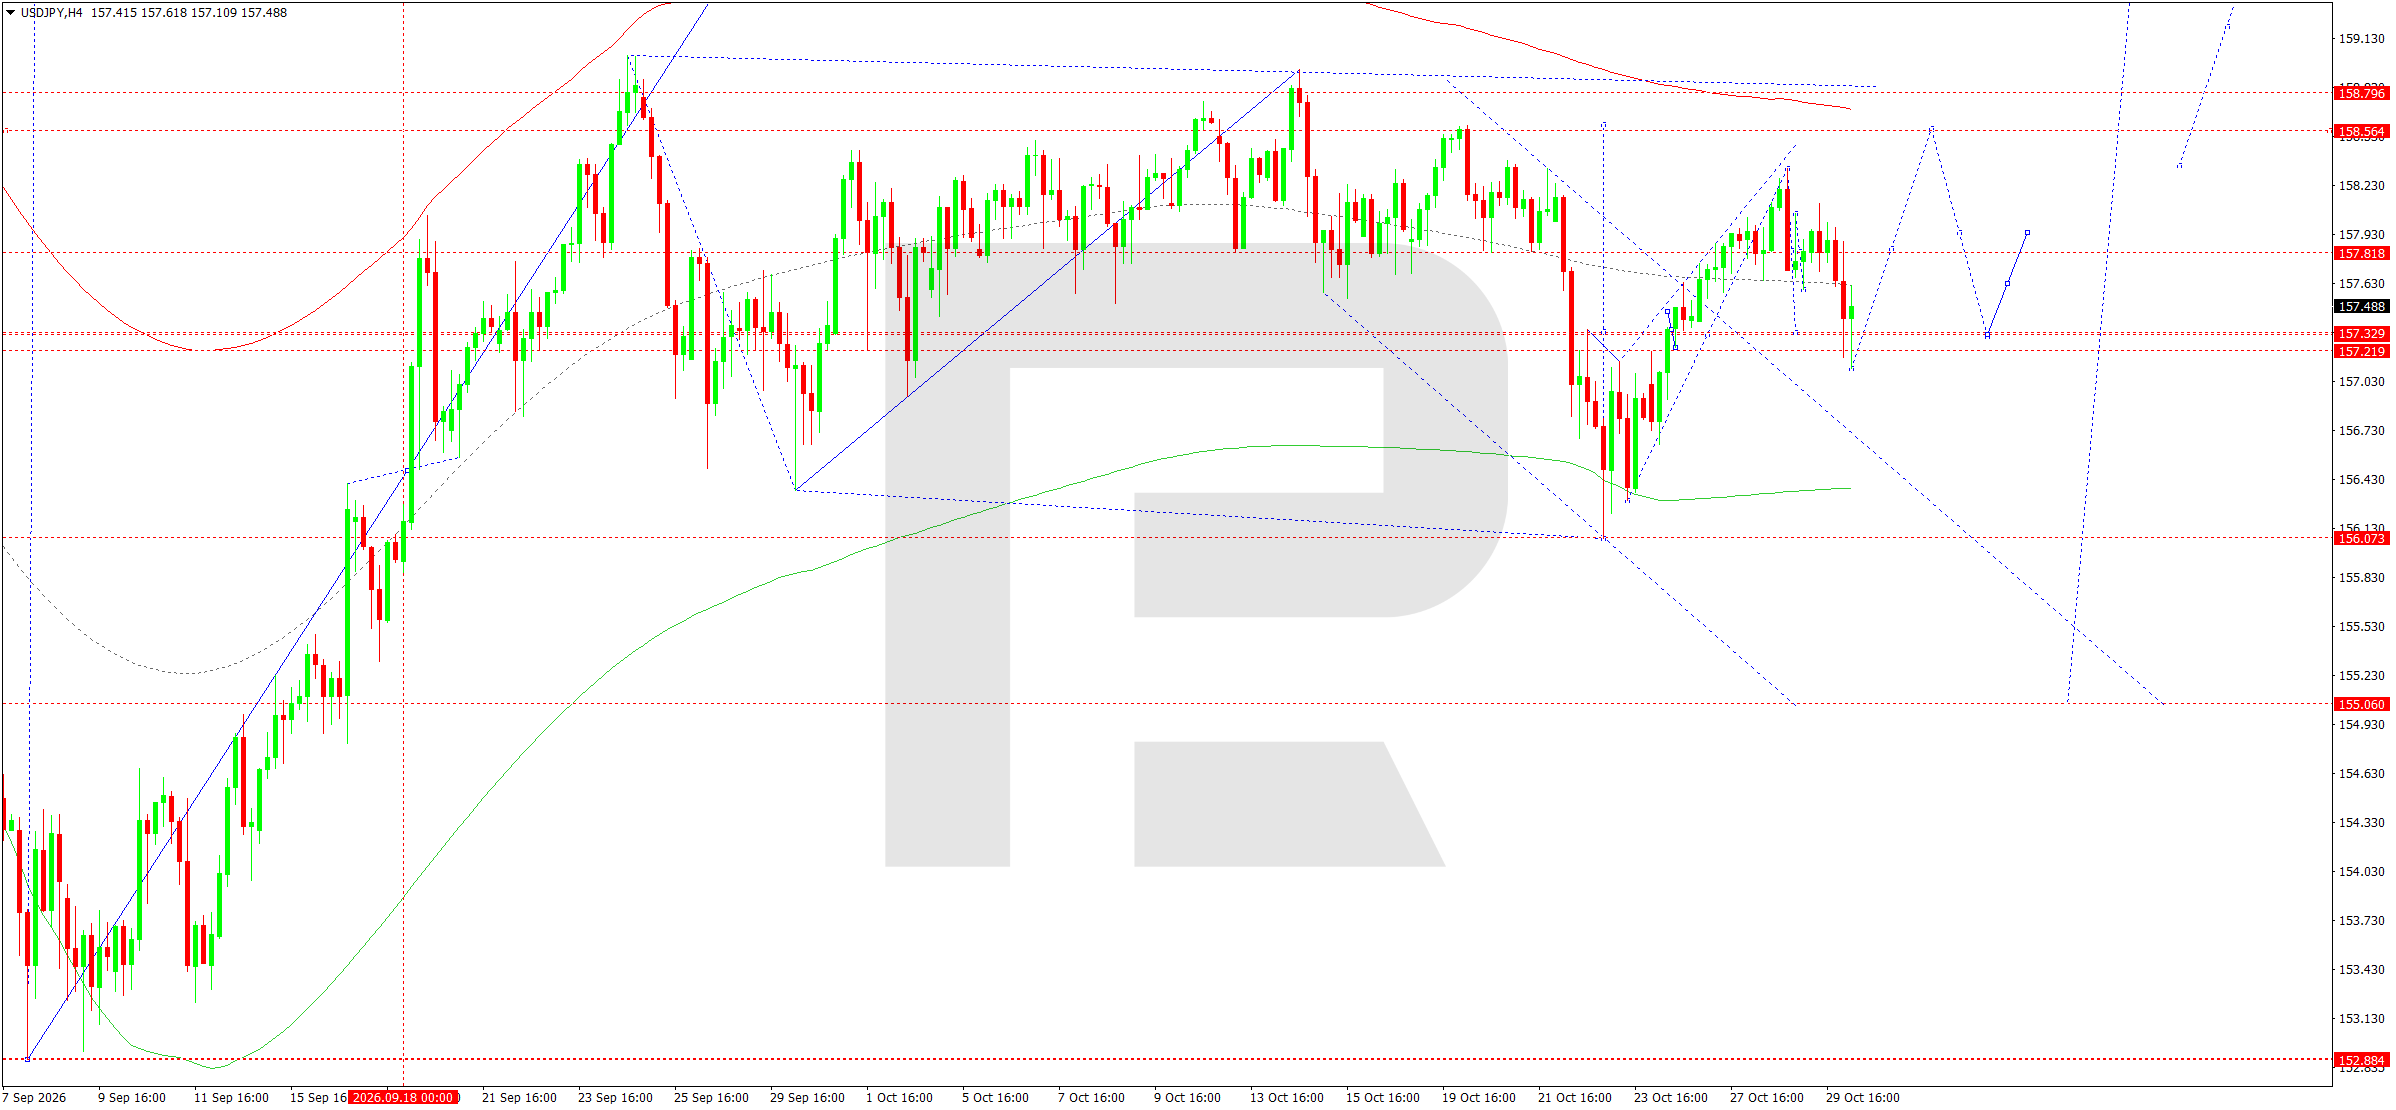
On the H4 chart, USDJPY formed a bullish structure with a local peak around 158.33. The subsequent correction brought prices towards the central area of the Price Envelope, near 157.14.
The upward wave matrix retains its pivot at 157.14. As long as prices remain above this level, a resumption of the upward movement is the main scenario.
The nearest resistance levels are 157.82 and 158.56. Breaking above them would create conditions for a test of 158.96. After an interim correction towards 158.03, growth could continue towards 160.06.
The Elliott wave model allows for the corrective leg to end and another upward impulse to develop. A decline below 157.14 would significantly weaken this scenario.
USDJPY forecast scenario
GBPUSD forecast
Sterling is ending October amid heightened sensitivity to domestic economic indicators and changing monetary policy expectations. Market participants are primarily focused on Bank of England policy, UK labour market conditions, inflation, and economic growth prospects.
Weak consumer demand and business activity limit the potential for sustained appreciation of the national currency. At the same time, persistent inflationary pressure calls for caution in determining the future path of interest rates. This combination creates conditions for heightened GBPUSD volatility.
The US dollar is supported by relatively high interest rates and resilience in parts of the US economy. Following the Fed's October meeting, market participants continue to assess the likelihood of further monetary tightening. US inflation and Treasury yields remain important factors.
UK fiscal policy also influences sterling, as changes in taxation and public spending affect growth expectations. Corrective movements are possible in the short term, but a sustained GBPUSD recovery requires an improvement in fundamental conditions.
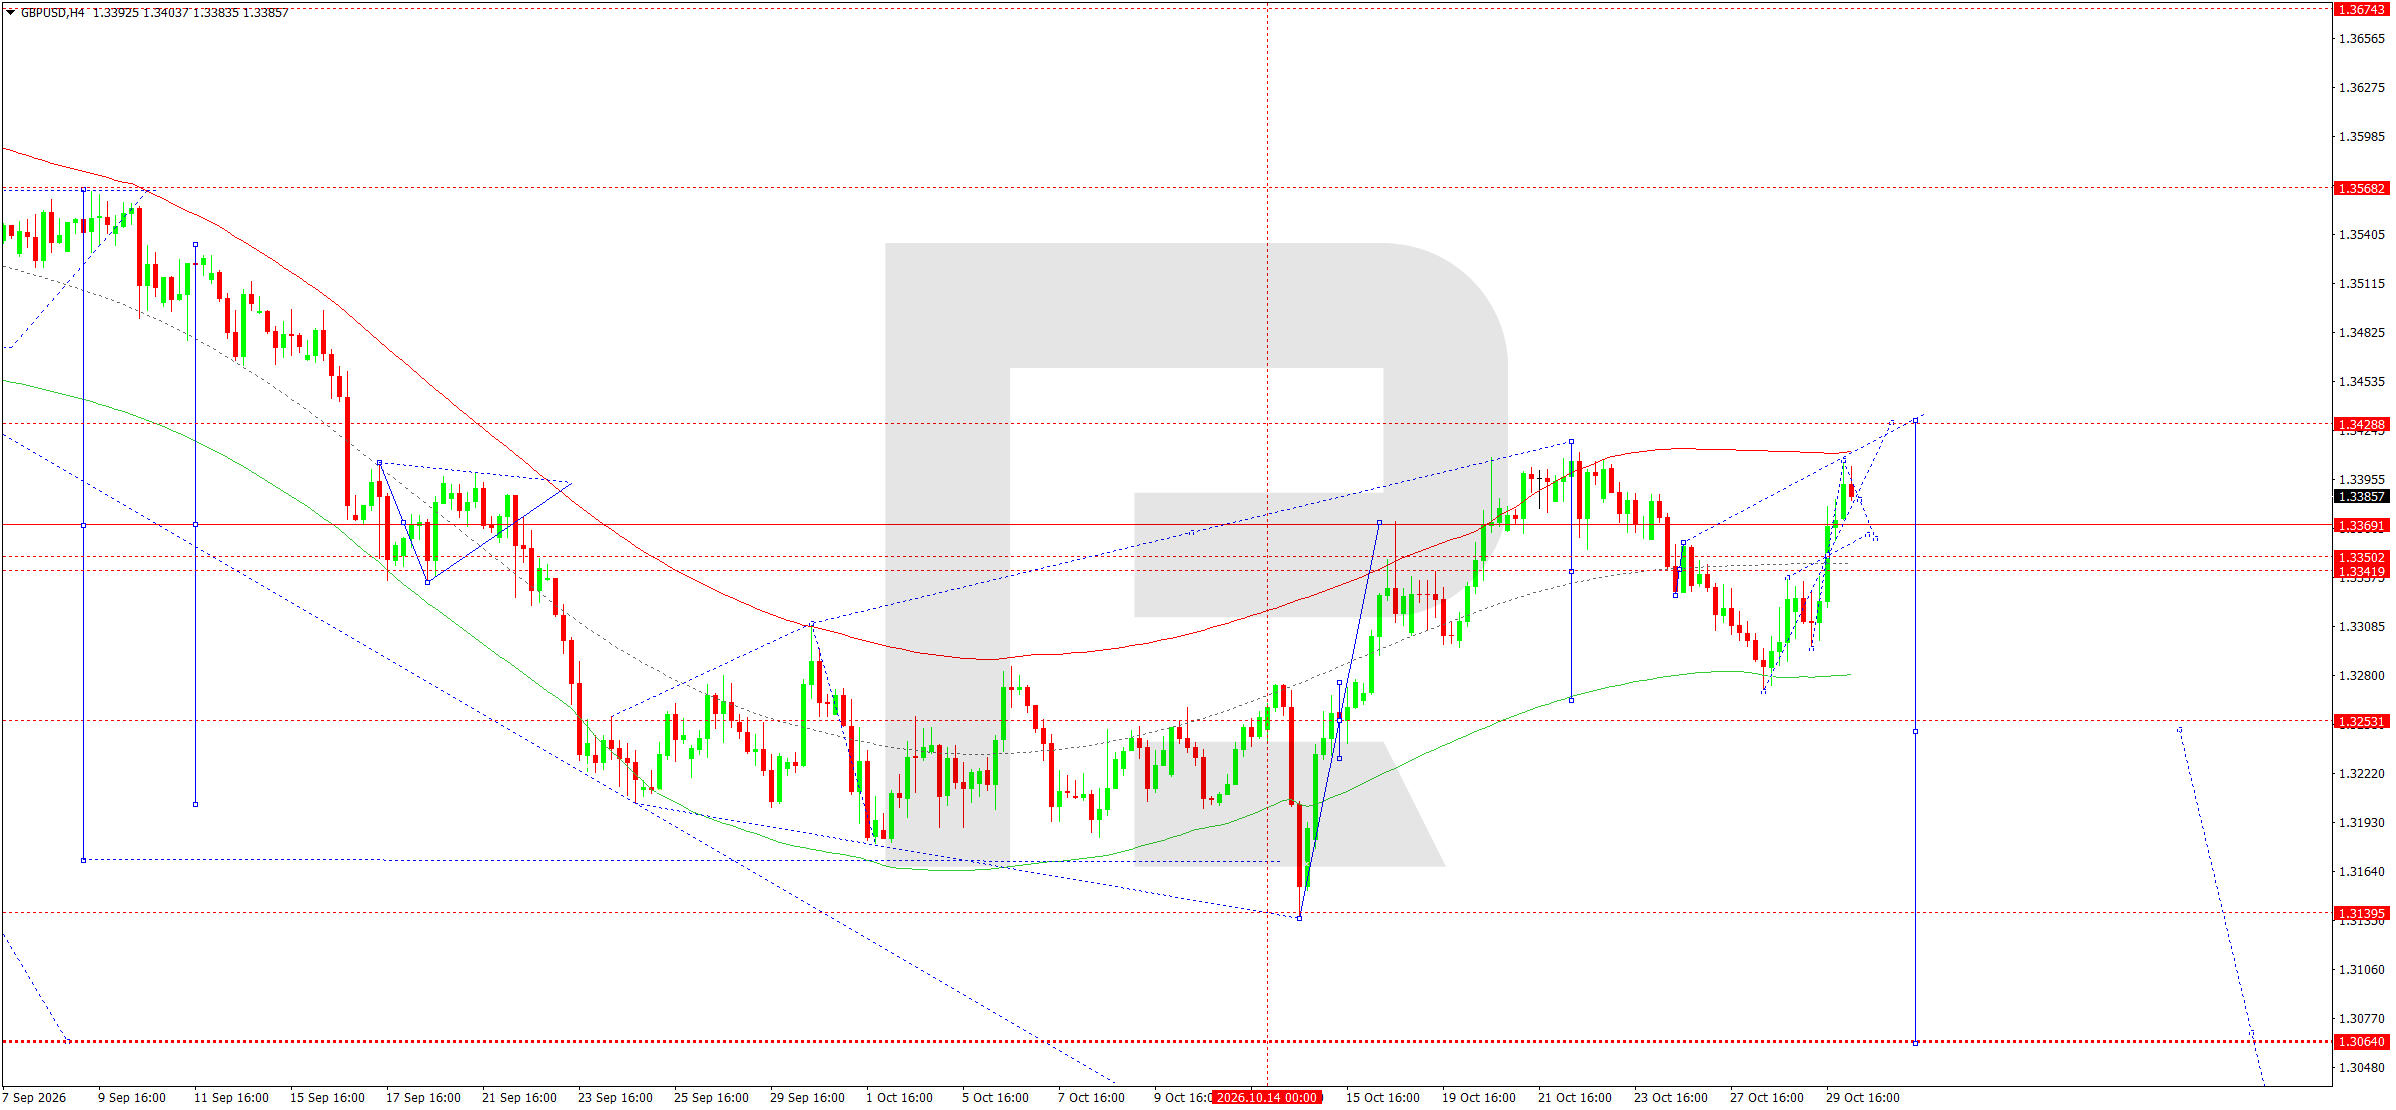
On the H4 chart, GBPUSD completed a decline towards 1.3272 before forming an upward correction to the 1.3404 area. The movement is developing within a broader corrective structure following the preceding downward impulse.
The downward wave matrix retains its pivot around 1.3344. A rise towards the upper boundary of the Price Envelope near 1.3414 creates conditions for renewed selling.
The nearest downside target is 1.3350. Consolidation below this level would open the way towards 1.3253. The Elliott wave model suggests an additional rise towards 1.3428 before the next downward impulse develops.
The main medium-term target is near 1.3065. A breakout above resistance at 1.3428 would require a reassessment of the current bearish structure.
GBPUSD forecast scenario
AUDUSD forecast
The Australian dollar remains dependent on the Chinese economy, commodity market movements, and international demand for risk assets. At the end of October, expectations for the Reserve Bank of Australia's future policy are especially important as the regulator assesses persistent inflation and domestic growth prospects.
Australian inflation figures released during the week remain an important reference point for revising interest rate expectations. Persistent price pressures could limit the scope for monetary easing and support the national currency.
The external backdrop is mixed. Slower Chinese industrial demand could put pressure on prices of commodities exported by Australia. Meanwhile, changes in US–China trade policy increase uncertainty surrounding the regional economic outlook.
Fed policy is another factor. Relatively high US interest rates reduce the Australian dollar's appeal. When sentiment deteriorates on global equity markets, AUDUSD generally becomes more vulnerable to selling.
Short-term corrective movements are possible at month-end, although sustained appreciation requires stronger external demand and a recovery in global risk appetite.
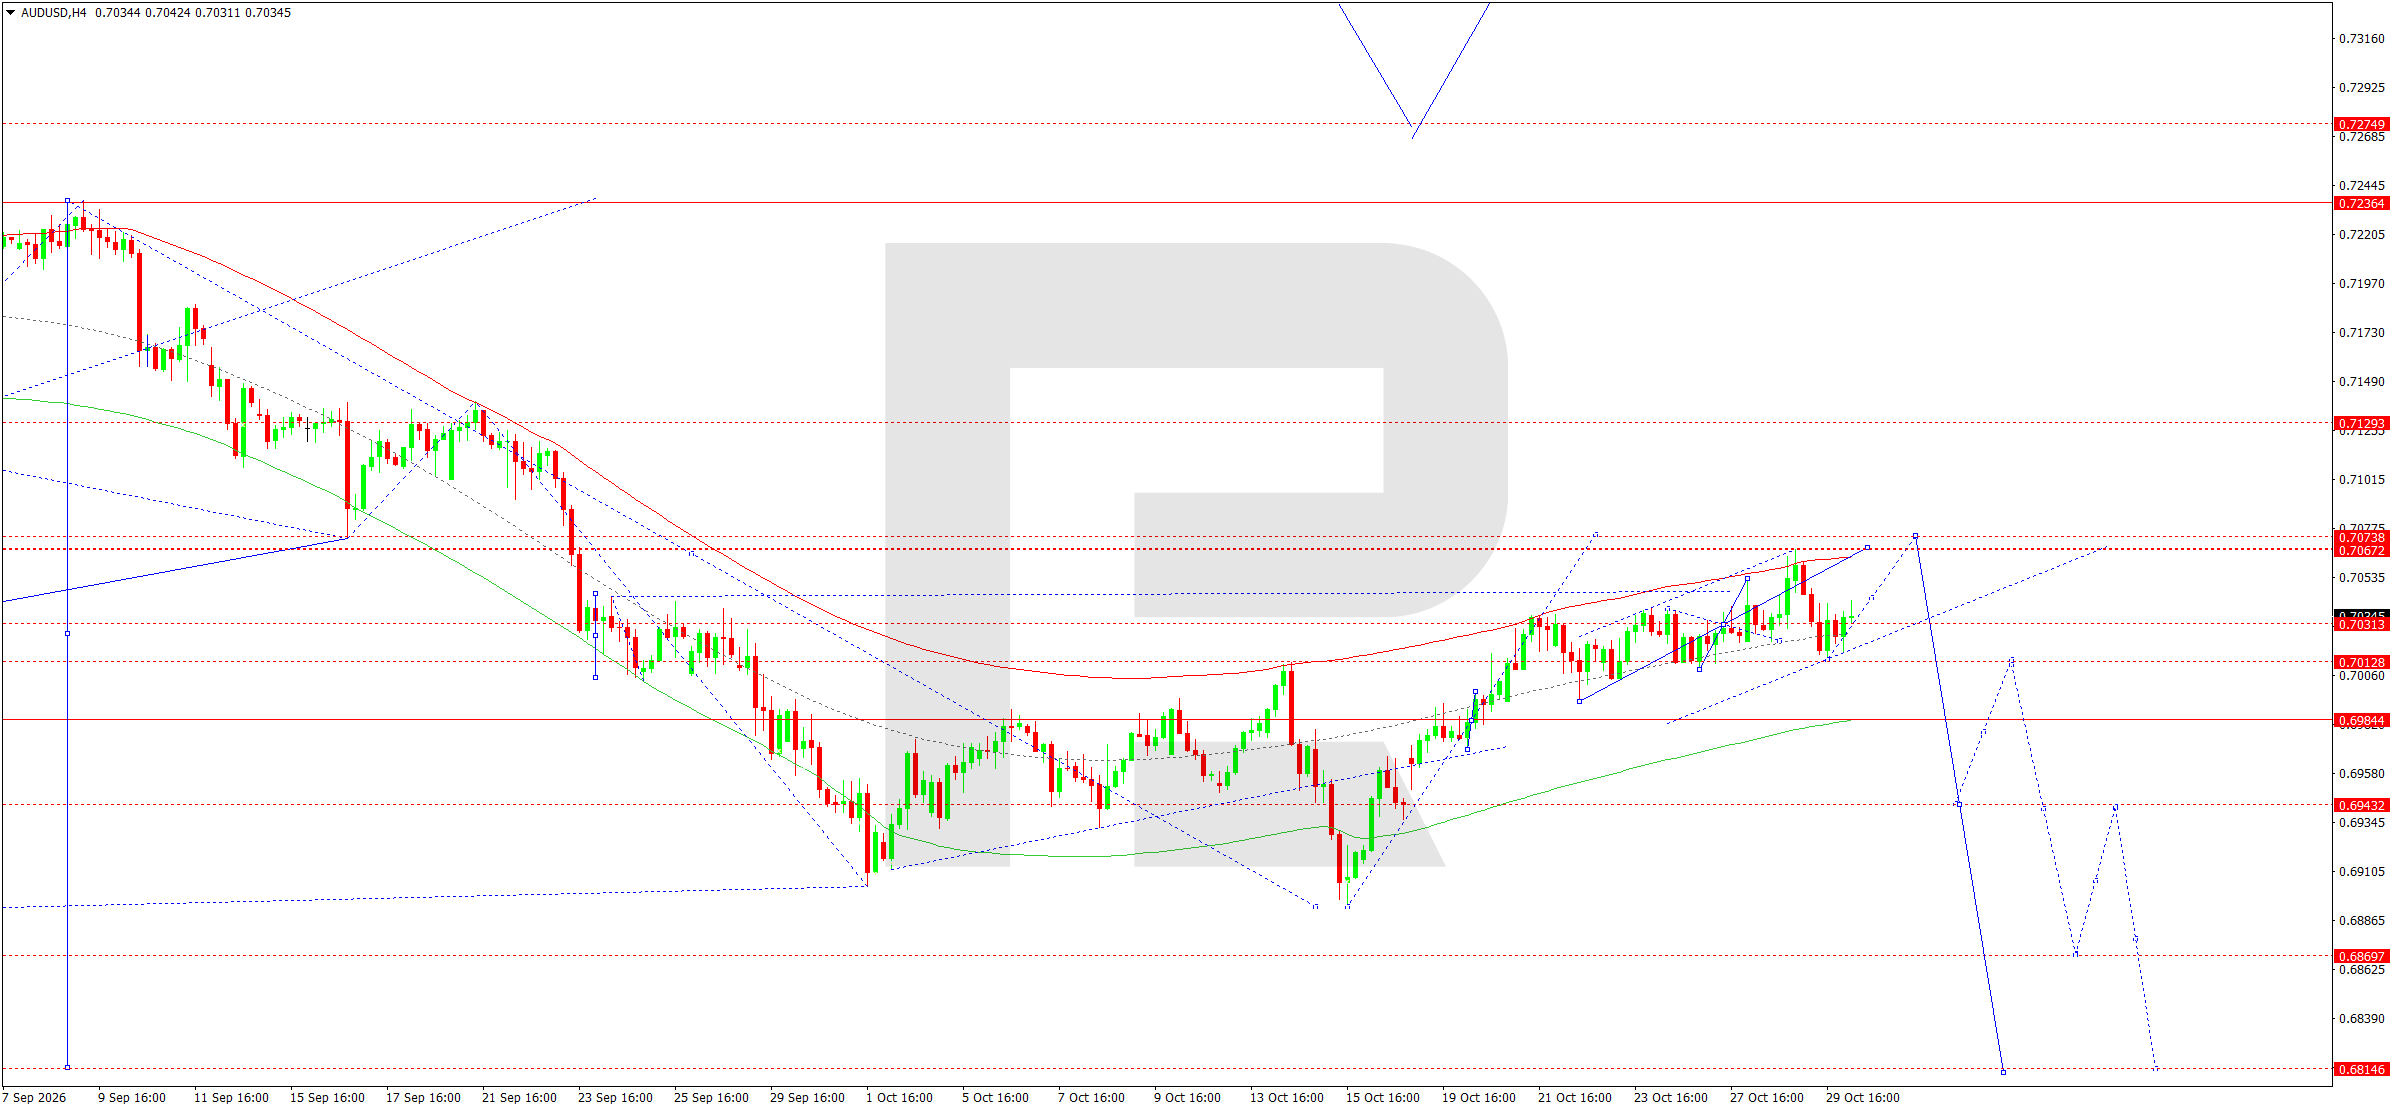
On the H4 chart, AUDUSD completed a decline and formed a corrective recovery towards 0.7067. The current structure is consolidating near the upper boundary of the local ascending channel.
The downward wave matrix retains its pivot at 0.6984, a key level for assessing the next direction of movement.
The Elliott wave structure allows for the corrective rise to end and another downward impulse to develop. The nearest resistance is at 0.7073. While prices remain below it, they may decline towards 0.7013 before testing the 0.6984 level from above.
A breakout below 0.6984 would open the way towards 0.6943 and then 0.6870, with the main target of the bearish structure around 0.6815. Consolidation above 0.7073 would temporarily weaken this scenario.
AUDUSD forecast scenario
USDCAD forecast
The Canadian dollar is ending October under the influence of monetary policy, oil market conditions, and changes in the US economic environment. Bank of Canada decisions and the outlook for inflation and economic growth remain in focus.
Following the BoC's October meeting, market participants are assessing the future path of interest rates. Weakness in certain sectors of the Canadian economy could strengthen expectations of more accommodative financial conditions, while persistent inflationary pressure limits the scope for rate cuts.
Oil prices have a significant impact on USDCAD. Canada remains a major energy exporter, so rising oil prices generally create favourable conditions for its currency. Geopolitical risks in the Middle East and potential supply disruptions could support the oil market.
The US side is driven by Fed policy, consumer spending trends, and government bond yields. Dollar resilience may limit gains in the Canadian currency.
Friday's release of Canadian gross domestic product data is another significant factor. Deviations from forecasts could increase volatility in the pair and accelerate a breakout from technical consolidation.
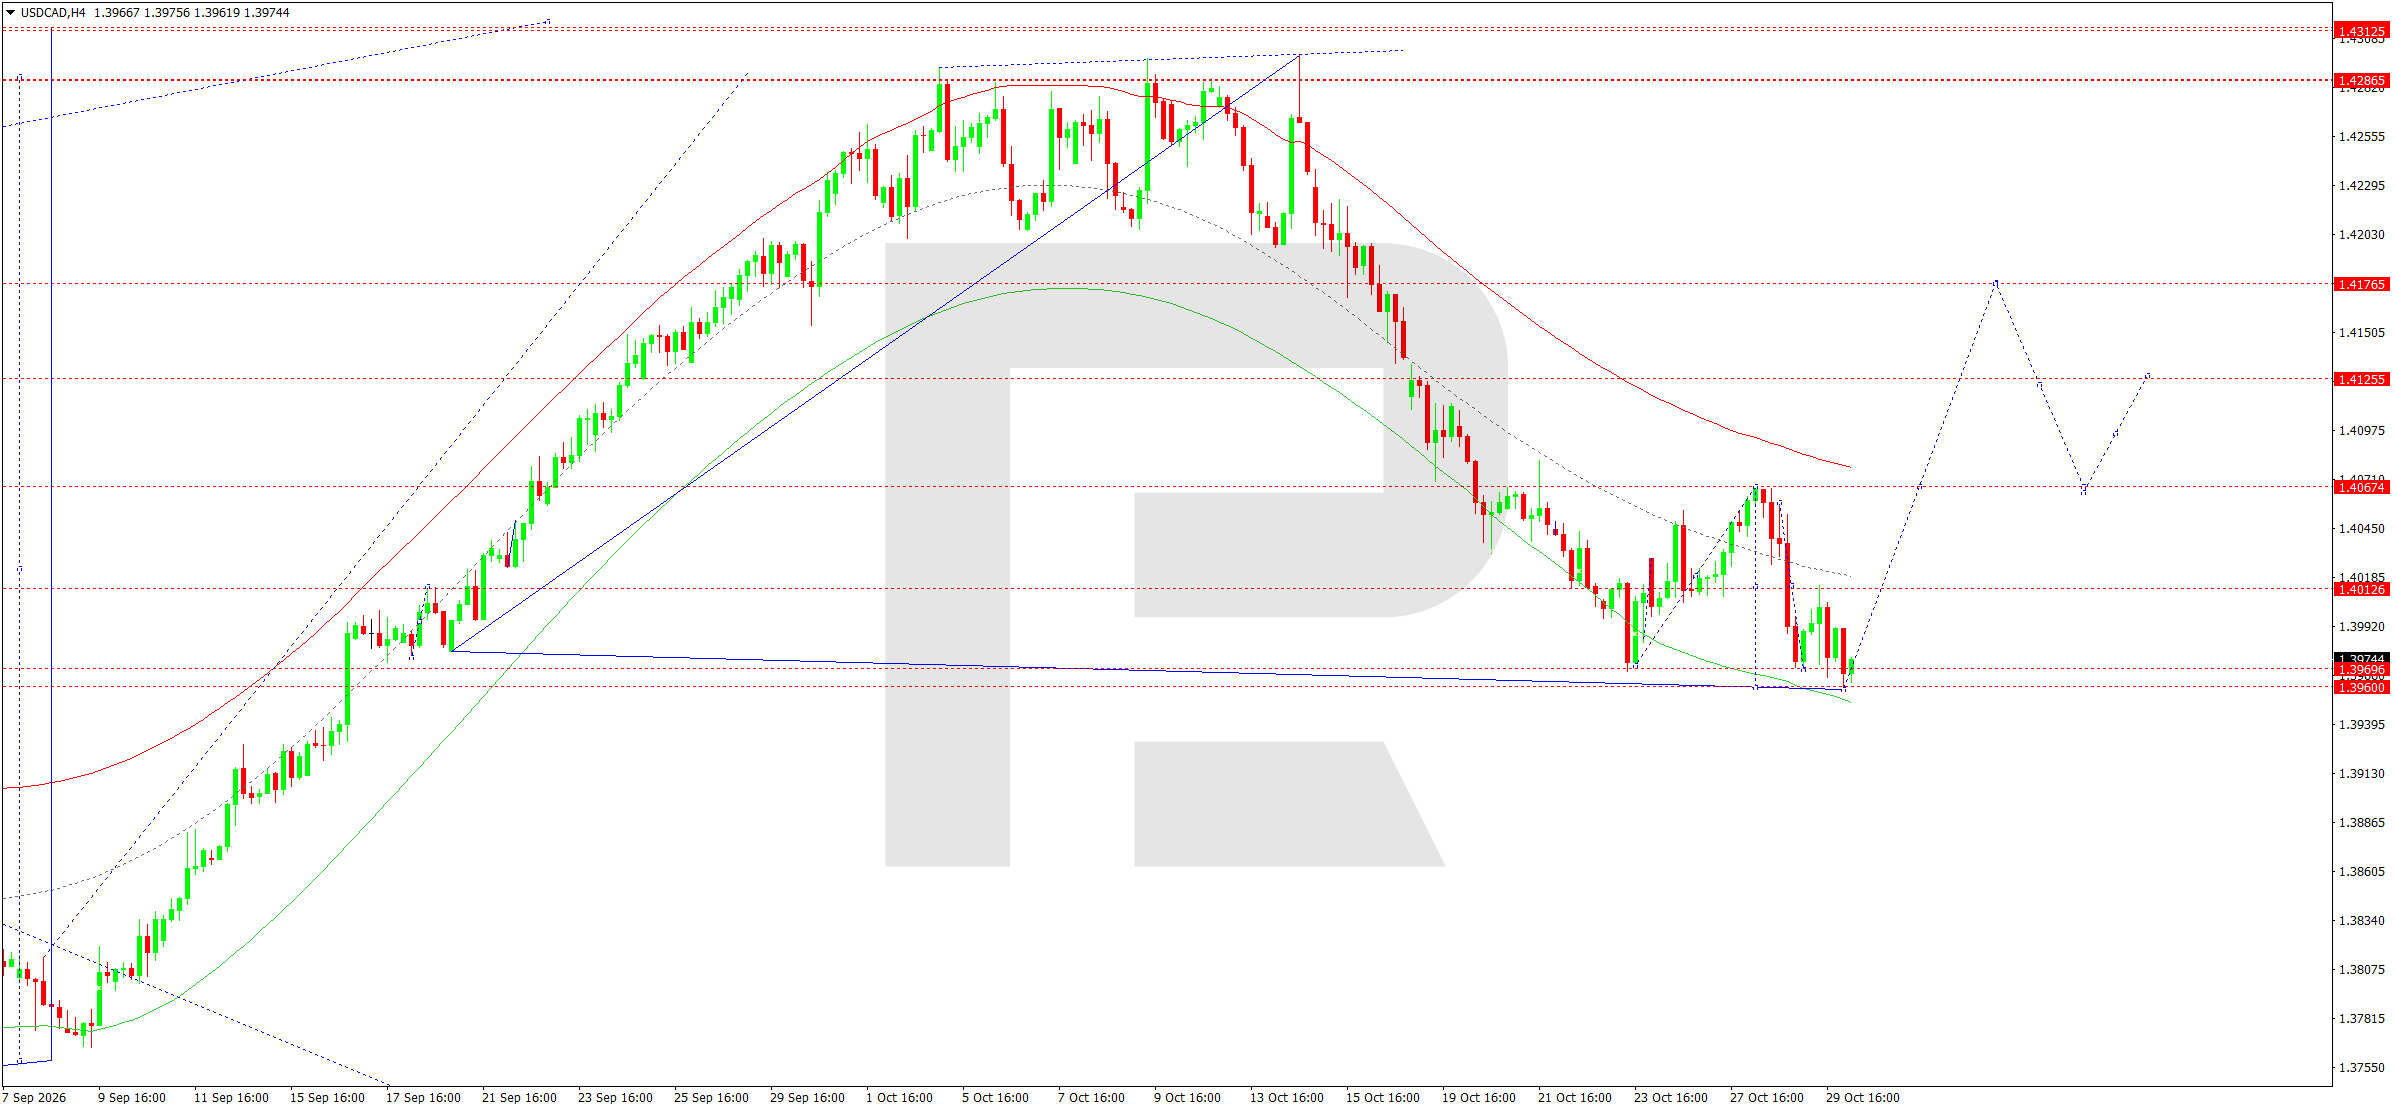
On the H4 chart, USDCAD completed an extended downward wave from the 1.4286 area to support at 1.3960. A sequence of lower highs accompanied the movement, confirming the prevailing downtrend.
The Elliott wave model allows for the local impulse to end and a corrective recovery to begin. The downward wave matrix retains its pivot around 1.4156.
The price is near the lower boundary of the Price Envelope. Consolidation above 1.3960 would set the stage for an upward correction.
A breakout above 1.3990 would open the way towards 1.4013 and then 1.4067, with the next target at 1.4125. Over a longer horizon, a recovery towards 1.4177–1.4181 is possible.
Initially, the 1.4067 area is viewed as resistance and a potential zone for a test from below. Firm consolidation below 1.3960 would invalidate the immediate recovery scenario.
USDCAD forecast scenario
XAUUSD forecast
Gold is ending October under pressure from expectations that US financial conditions will remain tight. Fed policy remains the main factor: following its October meeting, the regulator continues to consider persistent inflation and the state of the US economy. Strong US economic data and increased expectations of further monetary tightening limit the appeal of non-interest-bearing gold.
US dollar movements and government bond yields add pressure. Higher real yields increase the opportunity cost of holding the precious metal. Meanwhile, falling stock indices could prompt investors to reduce positions in commodity markets as well.
Geopolitical tensions in the Middle East remain a potential source of support for safe-haven assets. However, rising oil prices fuel inflation concerns, potentially contributing to interest rates remaining high.
On Friday, gold is trading near the psychologically important 4,000 USD level. Further movements will depend on the balance between safe-haven demand and US monetary policy expectations. Month-end also increases the likelihood that major market participants will lock in their positions.
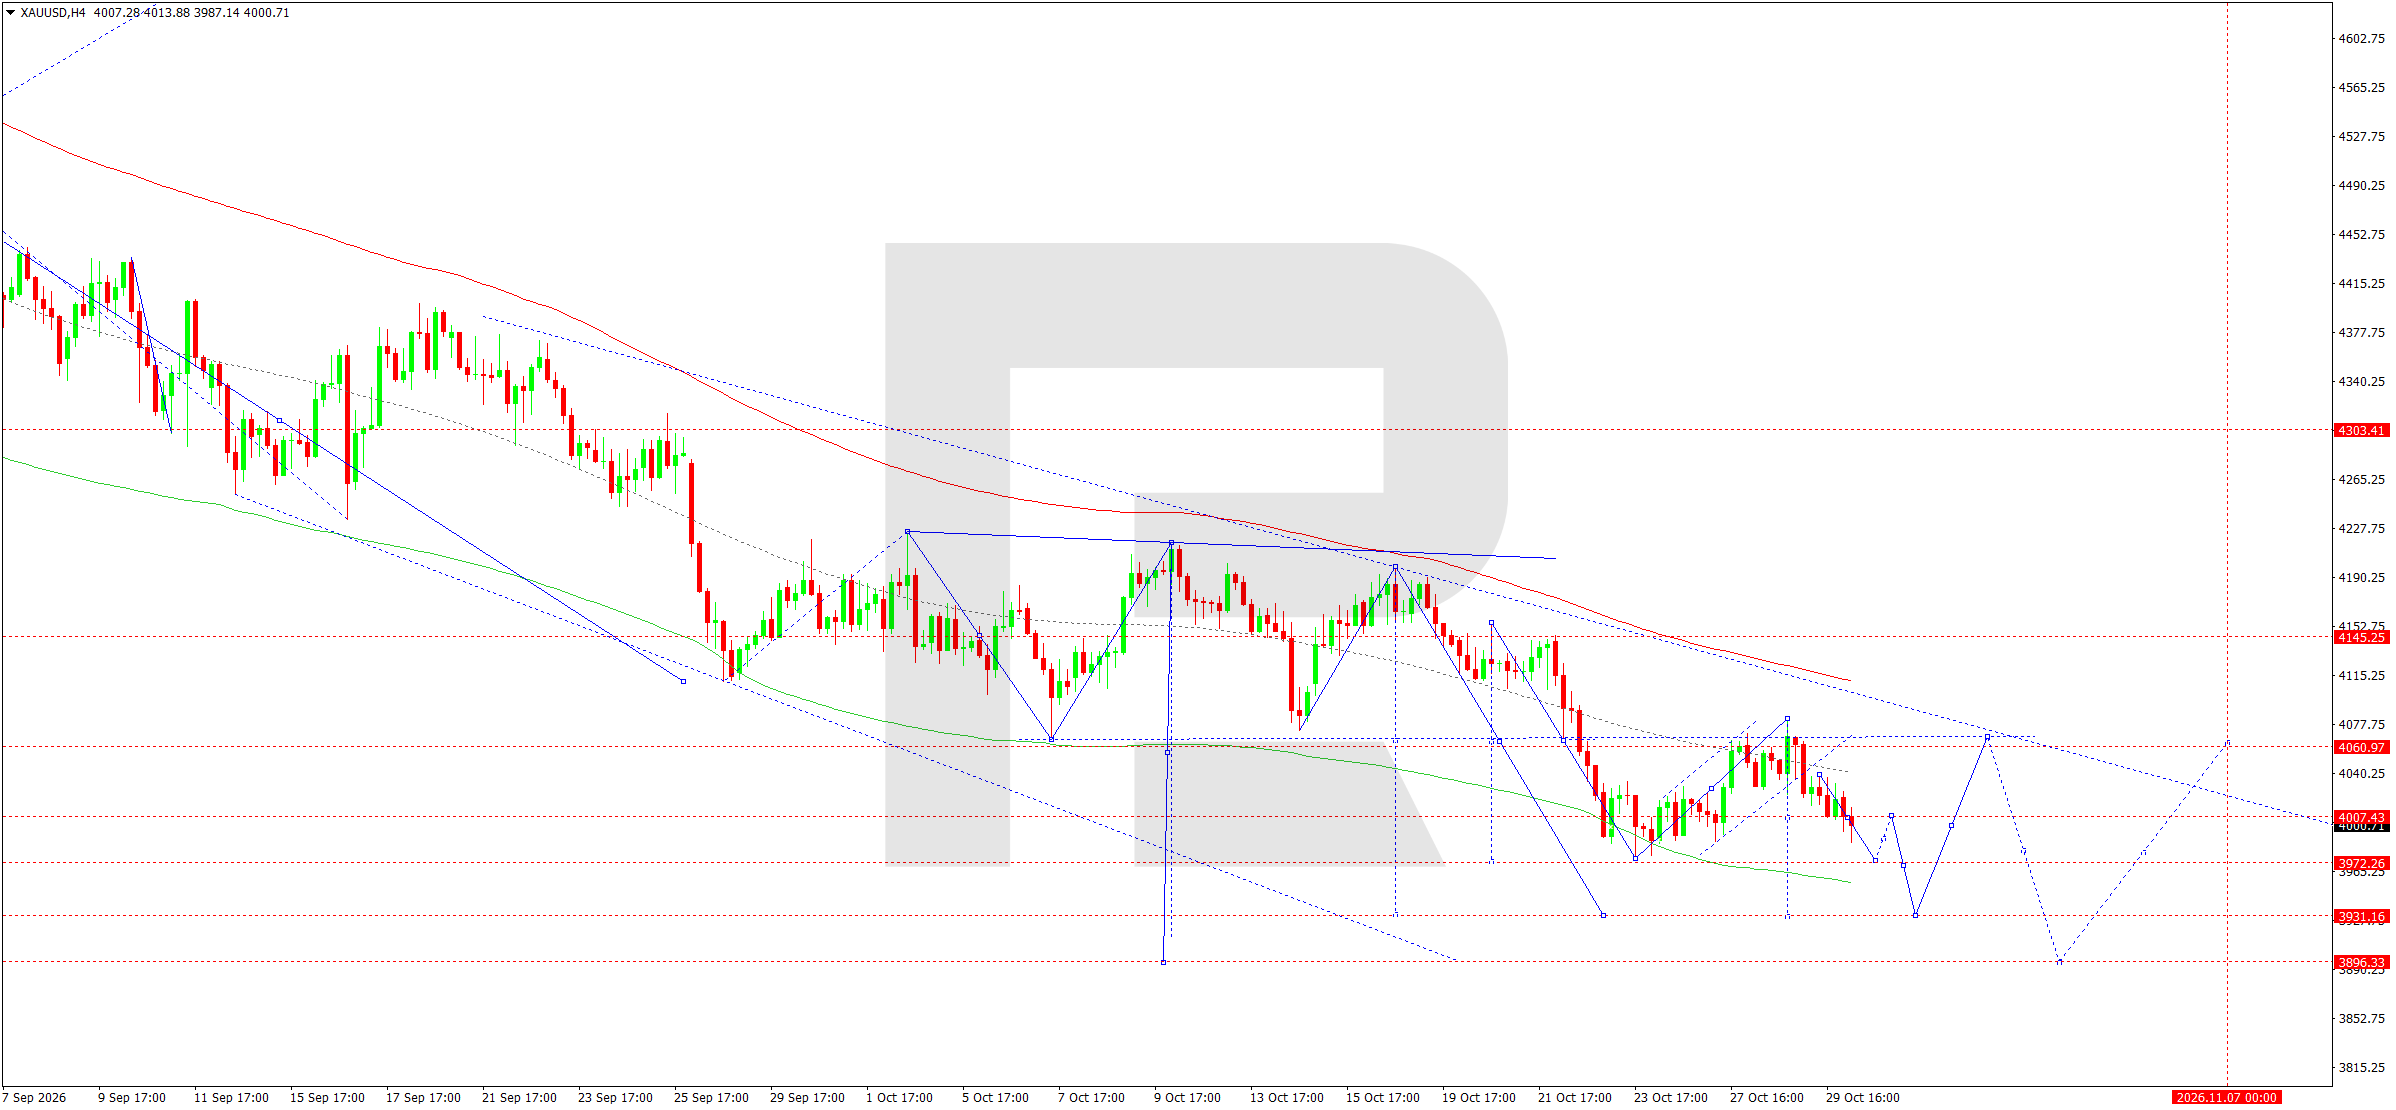
On the H4 chart, XAUUSD retains a pronounced downward structure. After a corrective recovery, the market resumed its decline and reached the 4,007 area. A sequence of lower highs confirms persistent selling pressure.
The downward wave matrix has its pivot at 4,145. As long as prices remain below this level, the main direction is bearish.
The Elliott wave structure allows for the impulse to continue after a short consolidation. The nearest target is support at 3,972. A breakout below it would open the way towards 3,931 and then 3,890.
The Price Envelope's lower boundary lies near 3,931. Reaching this level may trigger a temporary correction without changing the main trend.
The nearest resistance level is located at 4,007, followed by 4,061. A return above 4,061 would weaken the prospects for an immediate continuation of the decline.
XAUUSD forecast scenario
US 500 forecast
The US stock market is ending October amid heightened sensitivity to corporate earnings, interest rates, and economic growth prospects. Following the Fed meeting, investors continue to assess the likelihood of restrictive financial conditions persisting and their impact on corporate borrowing costs.
Published US gross domestic product figures demonstrated resilient economic activity. However, strong macroeconomic data also support expectations that high interest rates will be maintained for longer.
Financial results from major technology companies remain another source of uncertainty. Elevated capital spending on artificial intelligence raises questions about investment payback periods. In the previous session, the S&P 500 fell by approximately 0.3%, while the technology-heavy Nasdaq lost around 1.4%.
The high concentration of index market capitalisation in the largest technology companies amplifies the effect of individual corporate announcements on overall market movements.
Friday may bring additional volatility due to month-end portfolio rebalancing. Stabilising US bond yields could encourage renewed demand for equities. However, weaker corporate outlooks could limit the scale of an upward correction.
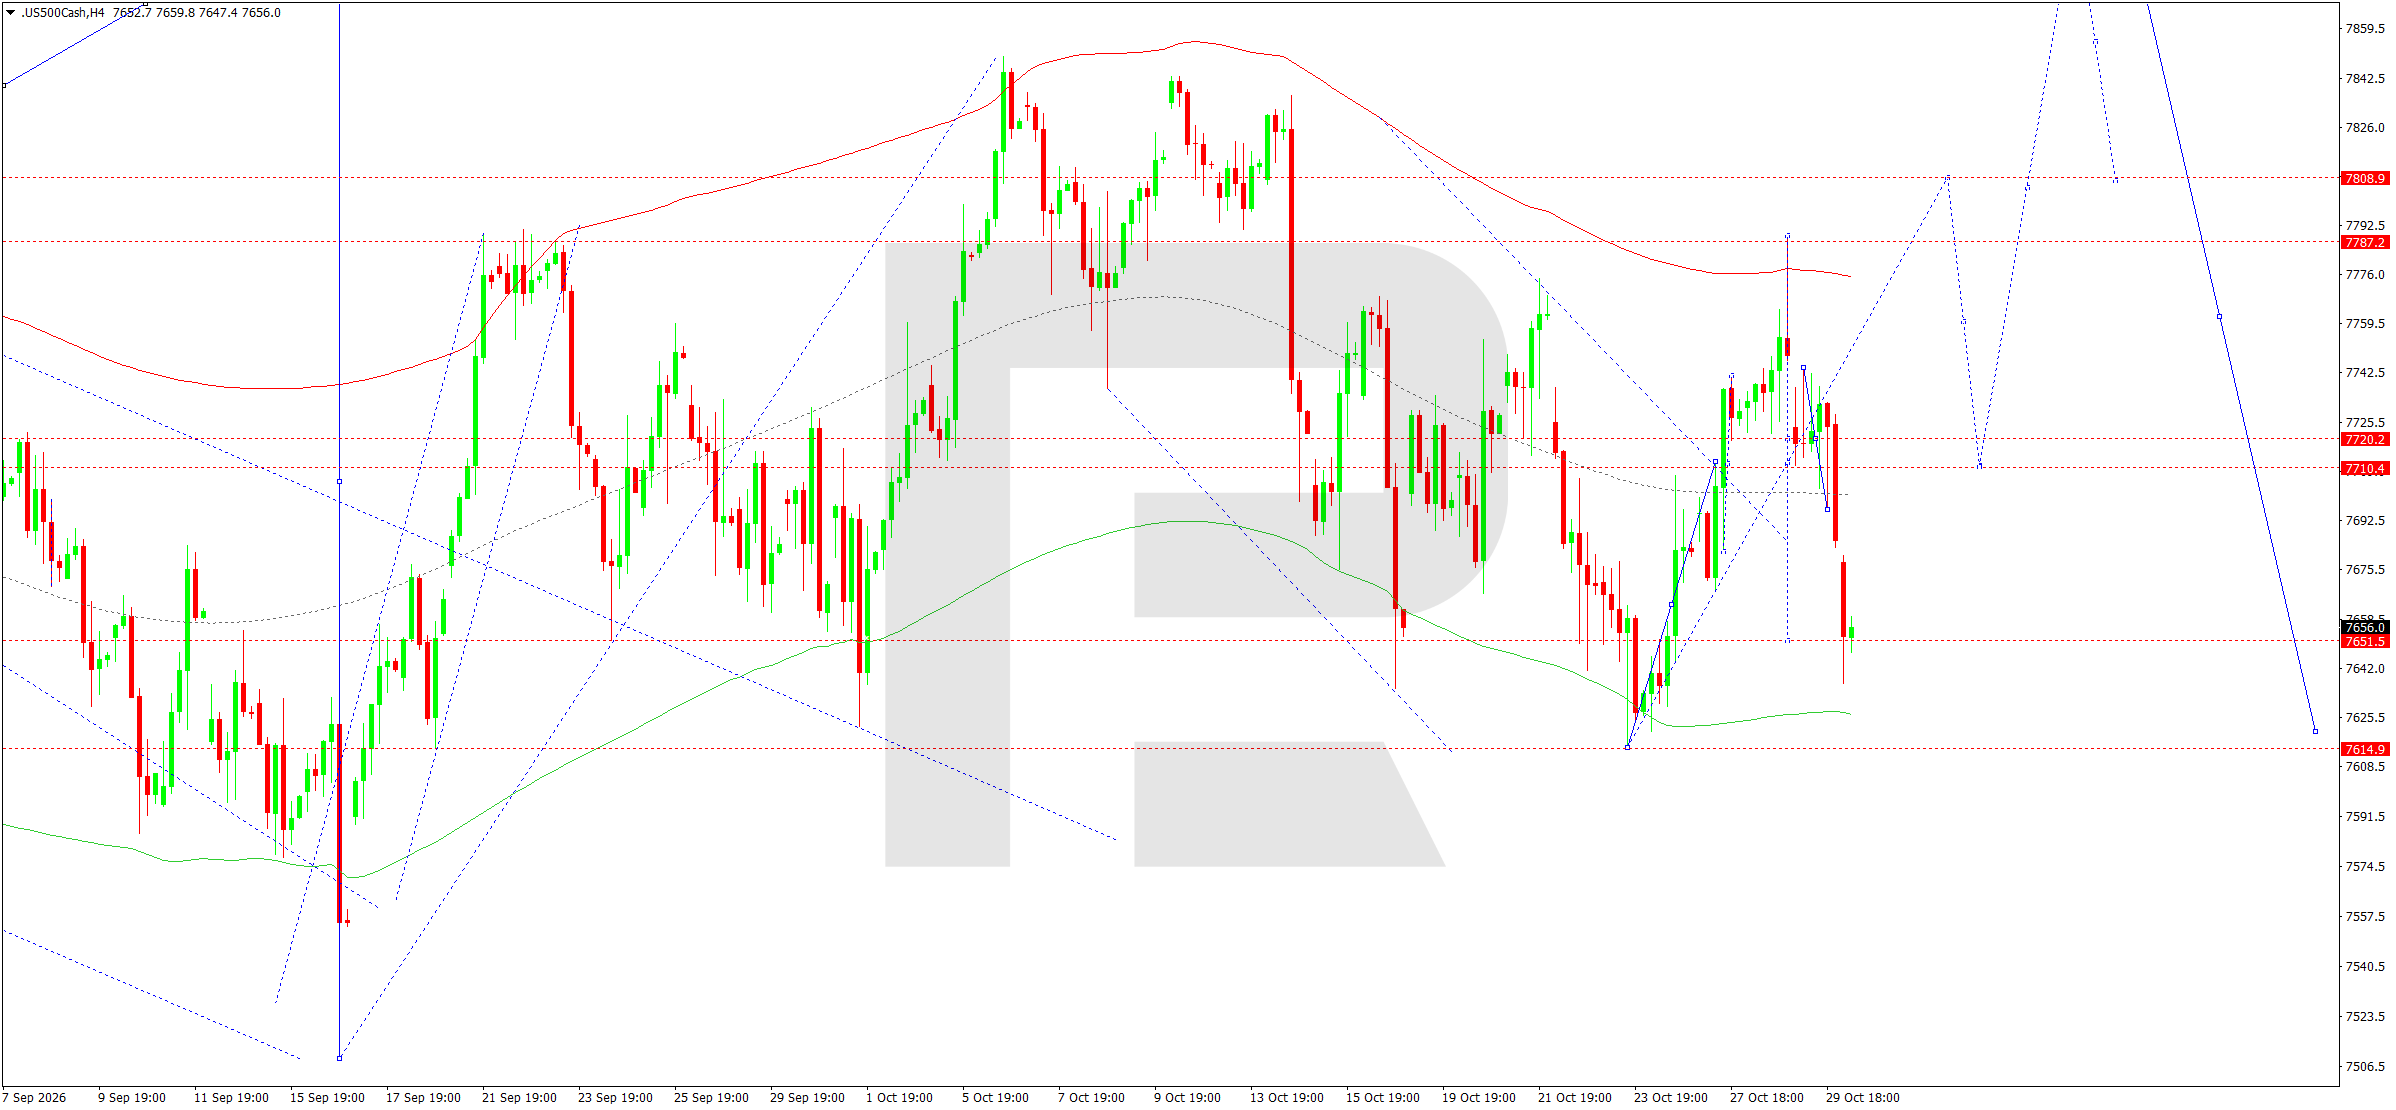
On the H4 chart, the US 500 completed an upward impulse towards 7,787 before correcting downwards to the 7,651 area. The current structure allows for the local correction to end and the upward movement to resume.
The upward wave matrix retains its pivot at 7,712. This level acts as intermediate resistance and an important reference point for confirming another upward impulse.
The Elliott wave model suggests a new upward leg after a test of the Price Envelope's lower boundary. The support level lies at 7,615; as long as this level holds, the recovery scenario remains intact.
The nearest targets are 7,712 and 7,720. Consolidation above them would open the way towards 7,778 and then 7,808.
Reaching 7,808 would test the strength of buying demand. A breakout below support at 7,615 would require a reassessment of the bullish scenario.
US 500 forecast scenario
BTCUSD forecast
Bitcoin is ending October amid heightened volatility linked to changes in global risk appetite and expectations for US monetary policy. The main macroeconomic factors remain Fed interest rates and US government bond yields.
Relatively high rates reduce the appeal of speculative assets because investors can allocate capital to instruments offering more predictable returns. Dollar appreciation and shrinking liquidity create additional pressure on the cryptocurrency market.
US stock index performance remains important. Declining shares in major technology companies and revised expectations for artificial intelligence investment could coincide with reductions in Bitcoin positions.
Market participants are paying particular attention to institutional demand, capital flows through exchange-traded investment products, and liquidity on cryptocurrency trading venues. Stronger spot-market selling can trigger liquidations of leveraged positions, amplifying short-term price movements.
A technical recovery following the sharp decline remains possible at the end of the month. However, its sustainability will depend on stabilising global financial conditions and renewed demand for risk assets.
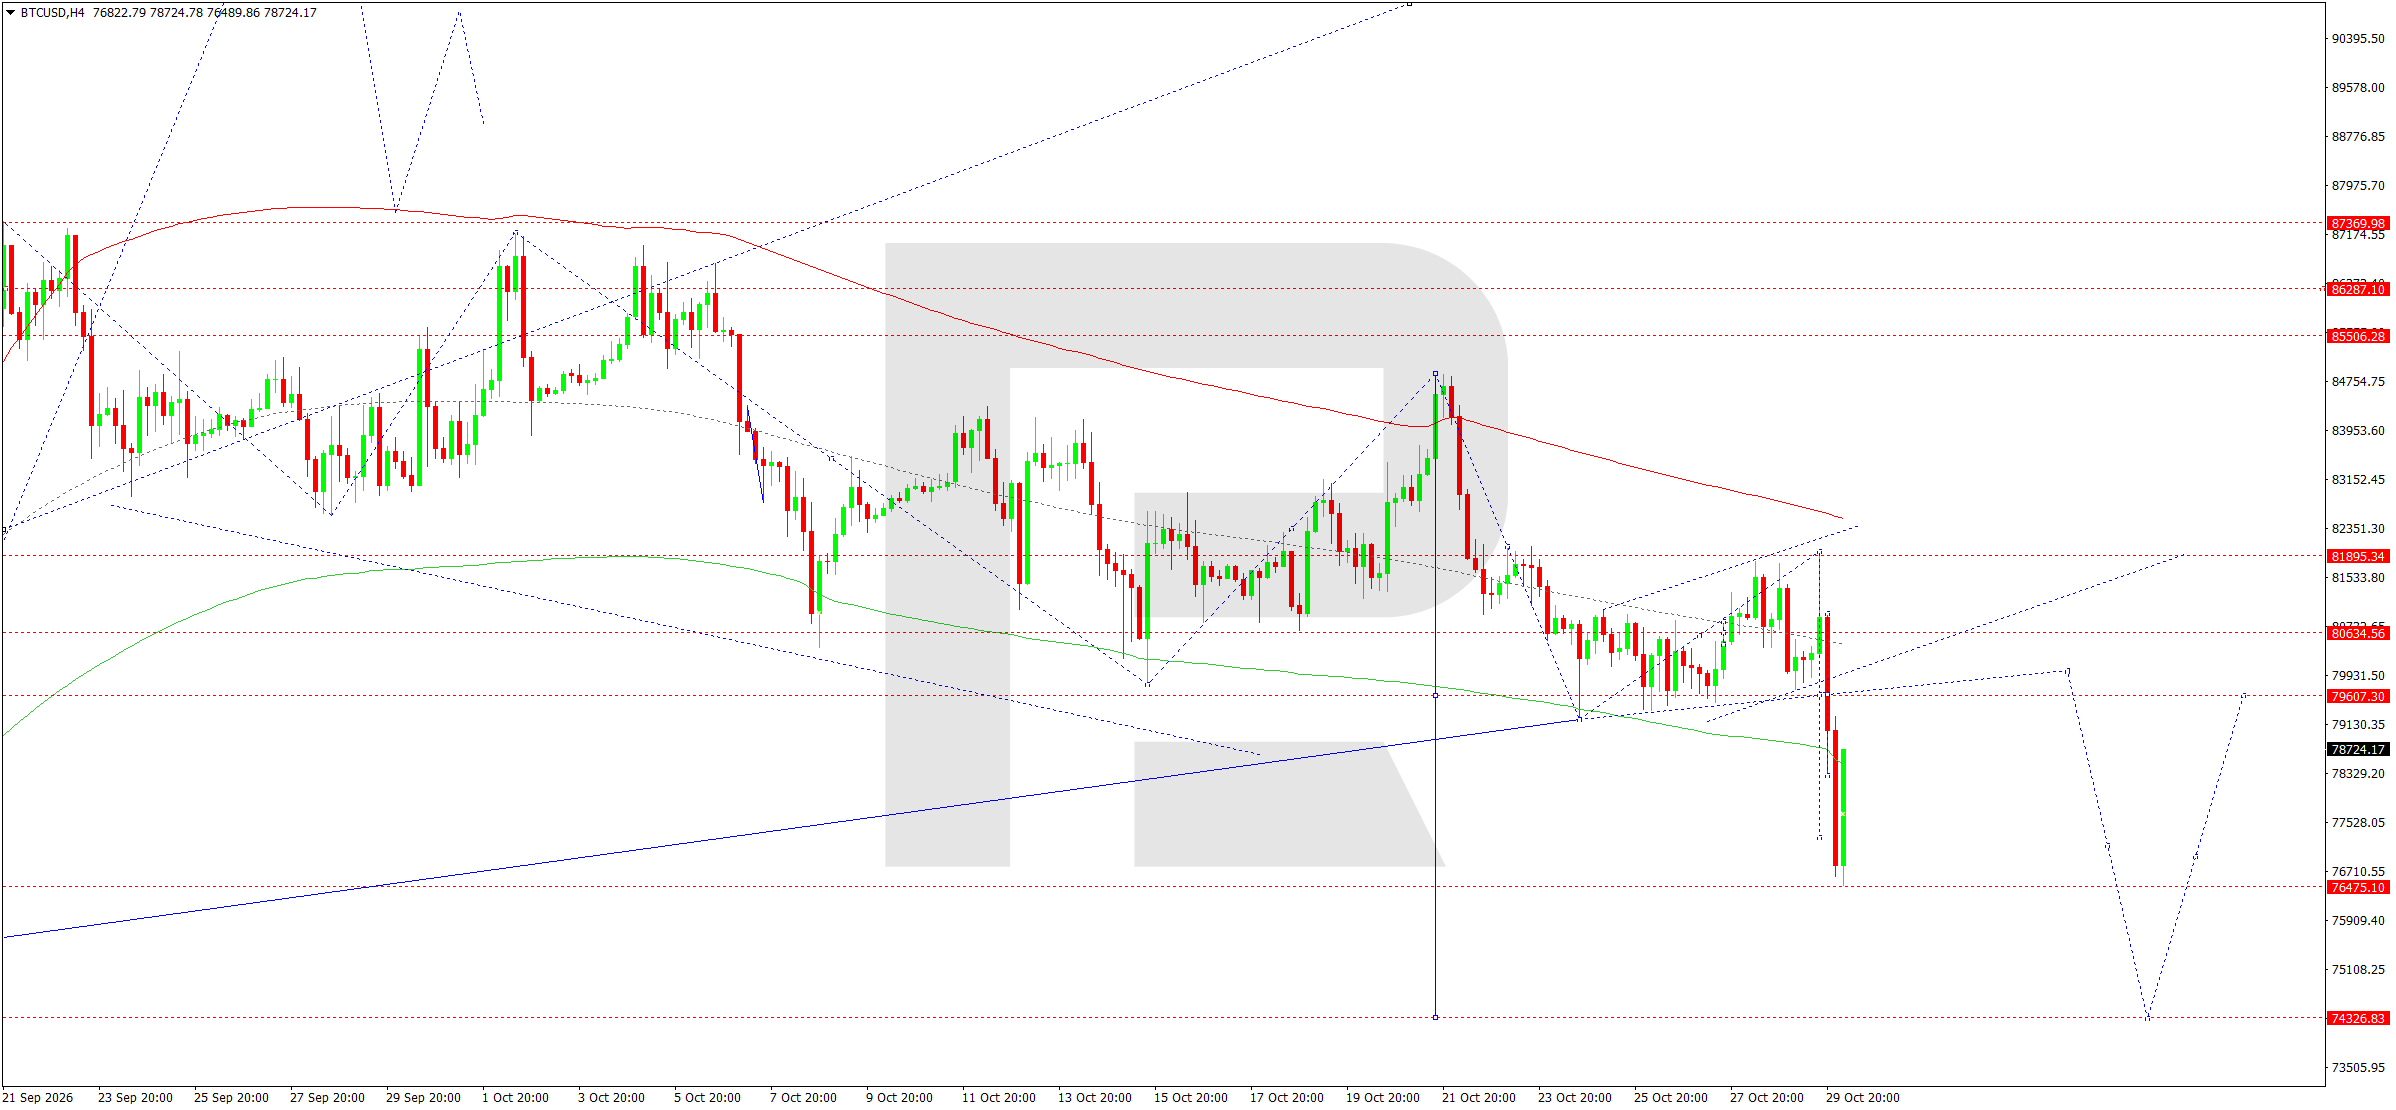
On the H4 chart, BTCUSD formed a downward structure after reaching local highs around 84,755. The ensuing decline broke several intermediate supports and reached the 76,476 area.
The downward wave matrix retains its pivot around 83,540. Prices significantly below this level confirm the prevailing bearish trend.
The Elliott wave model allows for the local downward impulse to end and a corrective recovery to develop. The Price Envelope's lower boundary lies around 76,476, potentially providing short-term support.
The nearest recovery target is 79,607. Breaking above this resistance level would open the way towards 80,635, with the next target at 81,695.
However, the rise is primarily viewed as a correction within a broader bearish structure. Renewed selling and a breakout below 76,476 would open the door for a decline towards 74,327.
To confirm the recovery scenario, quotes must remain above the local support level.
BTCUSD forecast scenario
Editors’ picks


EURUSD forecast 2026–2027: technical analysis, price levels & predictions
The EURUSD outlook for 2026 and 2027: key levels on the daily chart, three trading scenarios and the policy gap between the Fed and the ECB that drives the pair.

Gold (XAUUSD) forecast 2026: technical analysis, price levels & predictions
Where gold could trade in 2026: key levels, three trading scenarios with entry triggers and the forecasts from J.P. Morgan, Deutsche Bank and Goldman Sachs.
Forecasts presented in this section only reflect the author’s private opinion and should not be considered as guidance for trading. RoboForex bears no responsibility for trading results based on trading recommendations described in these analytical reviews.