
Daily technical analysis and forecast for 2 November 2026
Daily technical analysis and forecast for EURUSD, USDJPY, GBPUSD, AUDUSD, USDCAD, XAUUSD, US 500, and BTCUSD for 2 November 2026.
Each scenario on this page reflects the market structure on the H4 chart as of 10:00 AM UTC+3 on 2 November 2026. The assessment considers the current H4 chart structure, key support and resistance levels, the direction of the medium-term movement, and the prevailing fundamental backdrop.
EURUSD forecast
The euro begins November amid diverging expectations for monetary policy in the US and eurozone. Following its October meeting, the Federal Reserve left interest rates unchanged and highlighted persistent inflation risks. The European Central Bank also maintained its policy settings. However, the prospect of further US rate increases supports the dollar and limits the euro's recovery potential.
Today, market participants are focusing on US manufacturing activity indices, including the ISM. Stronger readings could bolster the dollar, while signs of an industrial slowdown may trigger a corrective recovery in EURUSD. Changes in US government bond yields are another factor.
Throughout the week, investors will assess eurozone inflation, US labour market data, and political risks surrounding the US midterm elections. A cautious ECB stance combined with hawkish Fed rhetoric creates a predominantly negative fundamental backdrop for the euro.
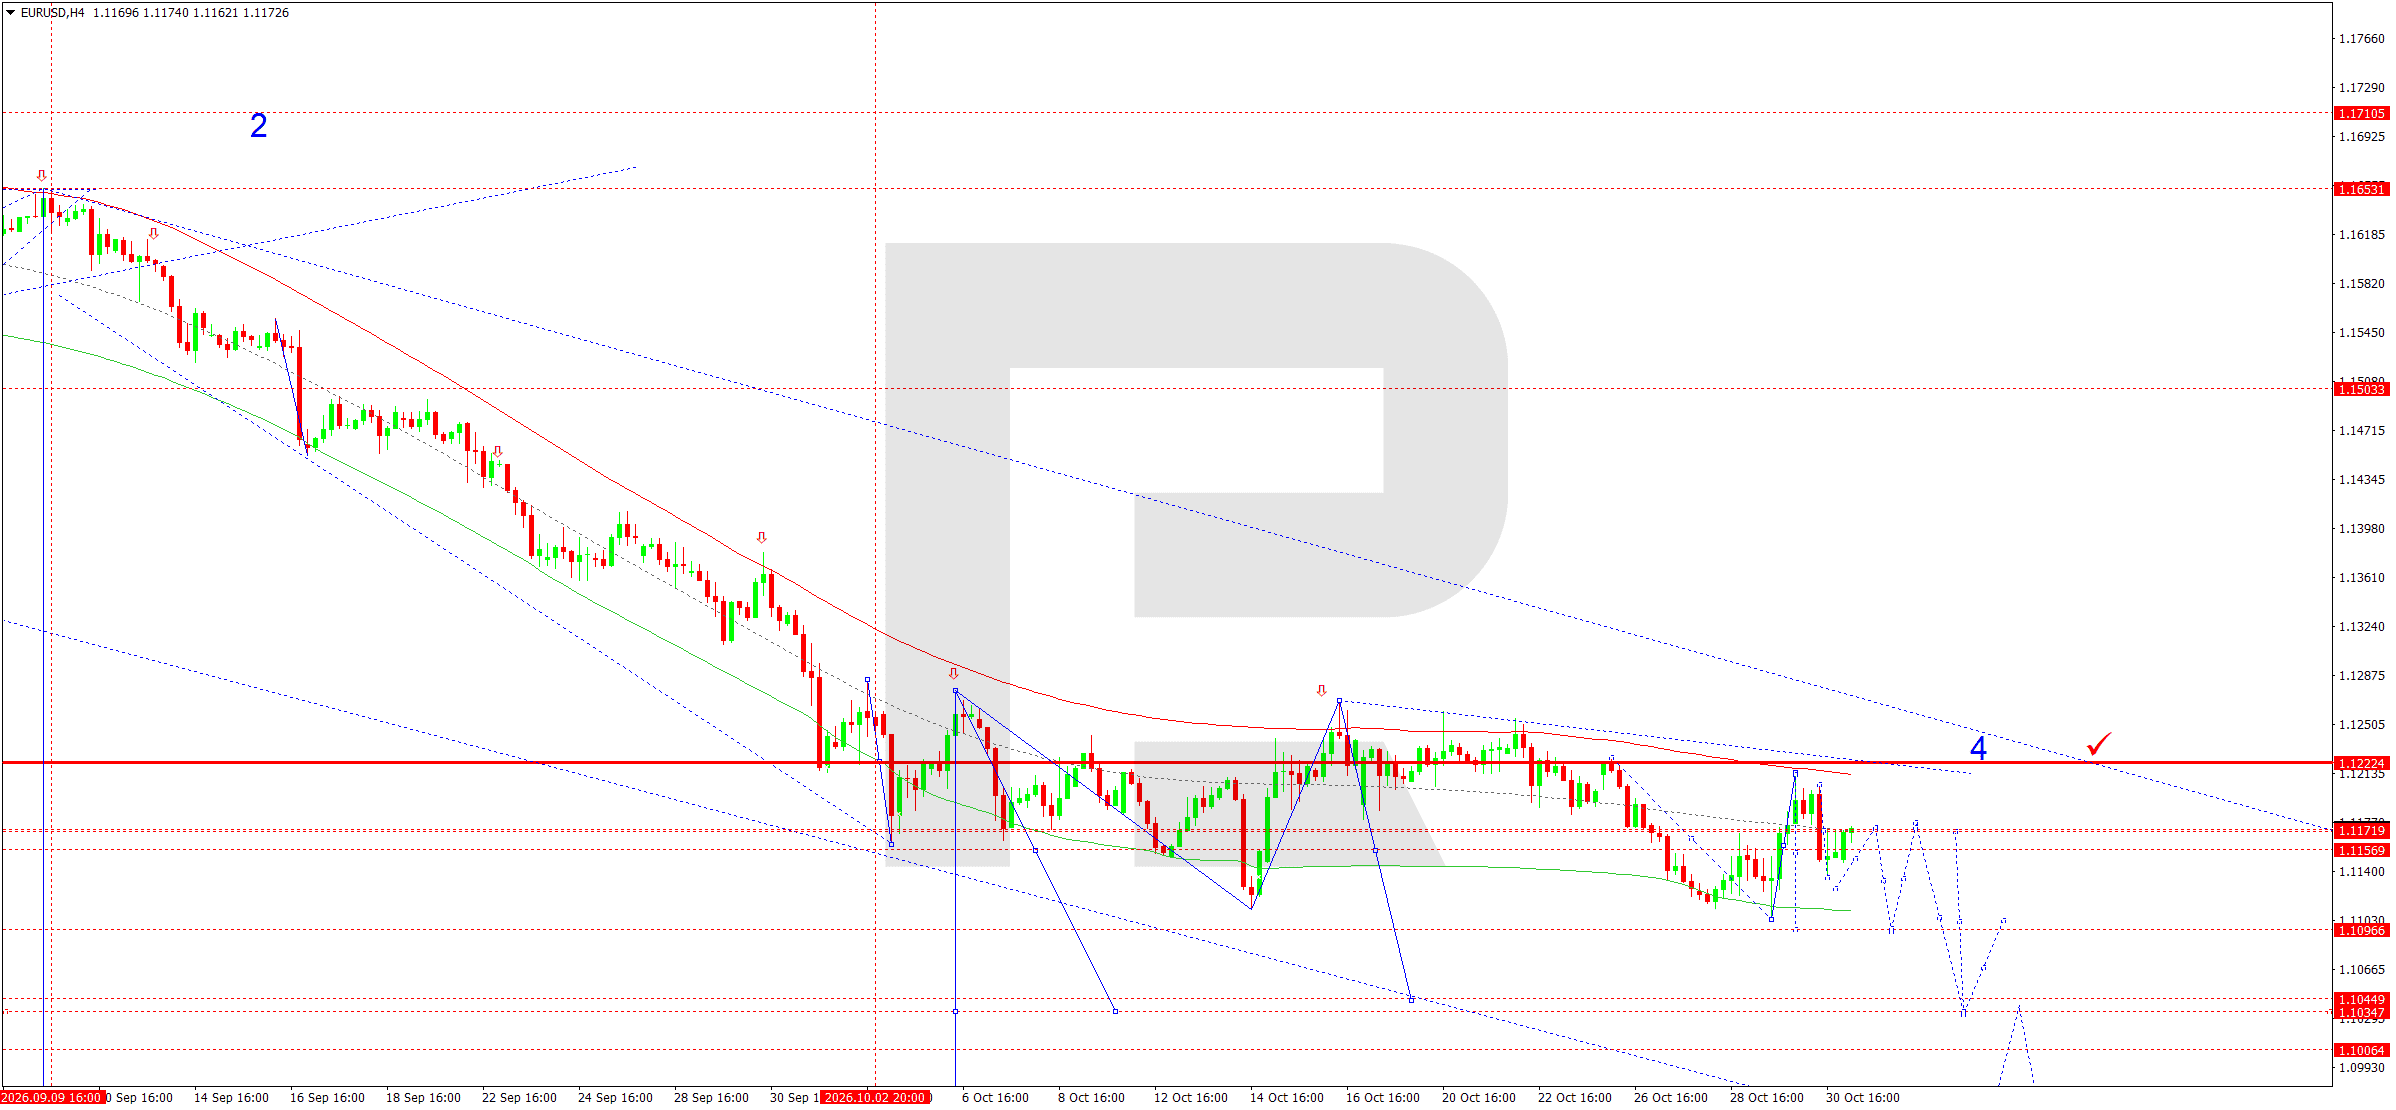
On the H4 chart, EURUSD completed another downward leg around 1.1135 before staging a corrective rise towards 1.1170. Consolidation around this level is expected today. A breakout above 1.1170 would open the door for a further correction towards 1.1222 and 1.1237.
The Elliott wave structure and the downward wave matrix, with its pivot at 1.1222, indicate that the main downtrend remains intact. The Price Envelope's upper boundary is seen as an area where the corrective rise is likely to end.
Following a test of this resistance, a renewed decline towards 1.1097 is expected. A breakout below this support would open the way towards 1.1045 and 1.1034. The main scenario envisages persistent selling pressure despite a possible short-term strengthening of the euro. Consolidation above 1.1237 would require a reassessment of the current bearish wave count.
EURUSD forecast scenario
USDJPY forecast
The Japanese yen remains sensitive to changes in US interest rates and government bond yields. Following their October meetings, the Fed and Bank of Japan kept their monetary policy settings unchanged. However, yield differentials between US and Japanese assets continue to support demand for the dollar against the yen.
Market participants are primarily focused on the outlook for further normalisation of Japanese monetary policy. Inflation trends, wage growth, and the resilience of domestic demand remain decisive factors for future BoJ decisions. Meanwhile, USDJPY's approach to the psychologically important 160.00 area increases the likelihood of stronger warnings from Japan's financial authorities.
US manufacturing activity figures will also influence the pair today. Strong data could support the US currency, while falling Treasury yields would create conditions for yen appreciation. Geopolitical uncertainty remains important for safe-haven currencies.
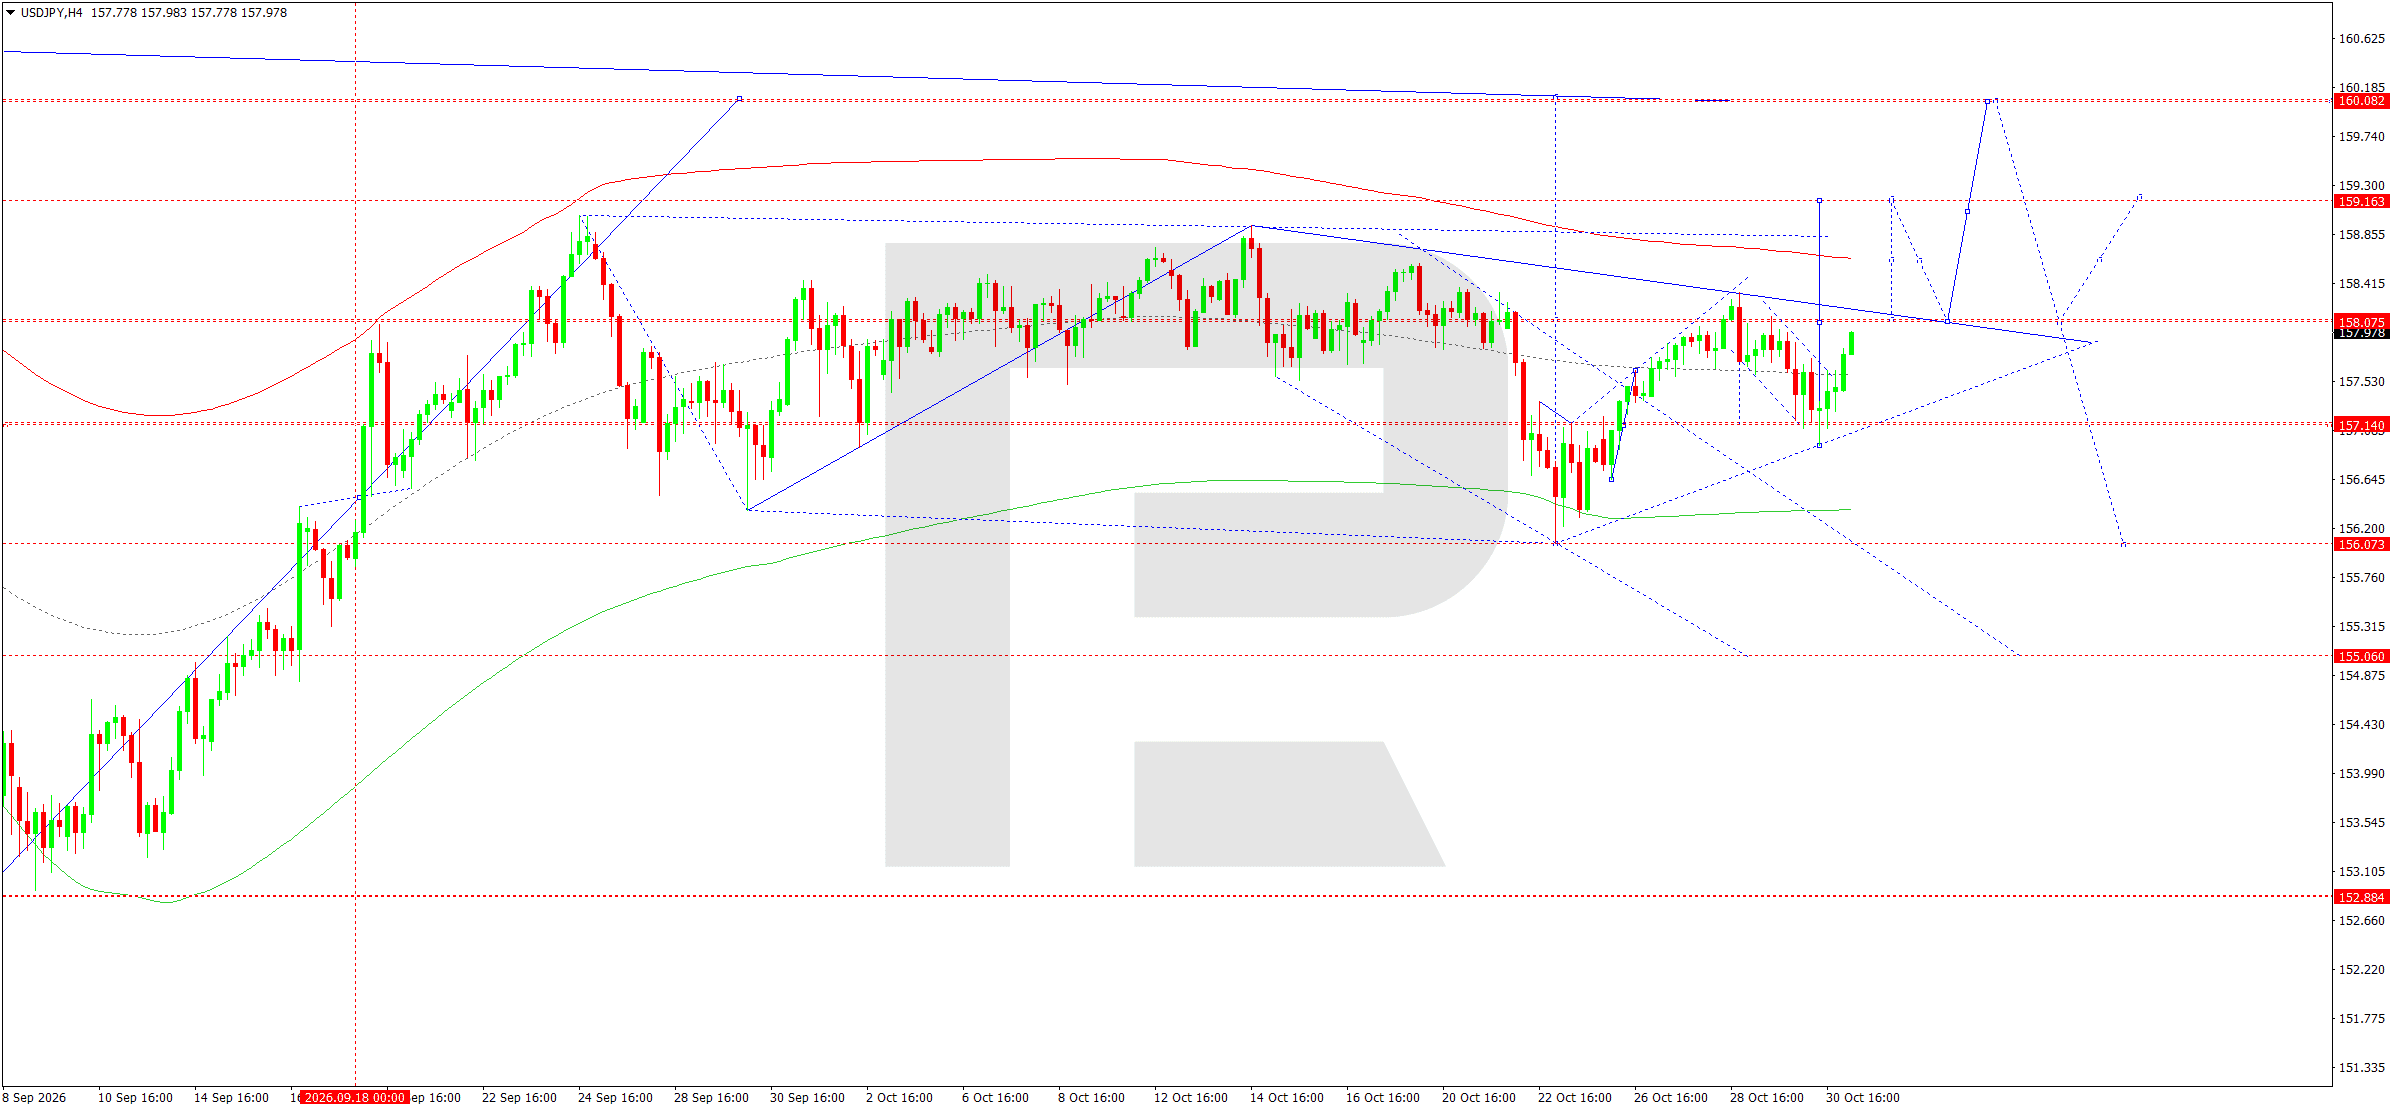
On the H4 chart, USDJPY formed an upward structure with a local high around 157.97. The market is currently consolidating below resistance at 158.08, with scope for an initial decline towards support at 157.40.
The Elliott wave model and the upward wave matrix, with its pivot at 157.14, confirm buyers' advantage within the medium-term structure. The 157.40 level is viewed as the nearest area where the local correction may end.
After testing this support, growth is expected to resume towards 158.08, followed by advances towards 158.65 and 159.16. Consolidation above these levels would bring the next target at 160.08 into focus.
The Price Envelope retains a bullish outlook provided the 157.14–157.40 area holds. A breakout below 157.14 would weaken the current upward structure and increase the likelihood of a correction towards 156.07. The main daily forecast envisages a short-term pullback followed by renewed buying activity.
USDJPY forecast scenario
GBPUSD forecast
Sterling begins the trading week ahead of the Bank of England's next decision, scheduled for 5 November. Market participants are assessing the outlook for interest rates amid persistent inflationary pressure and mixed developments in the UK economy.
An important factor is the tension between the need to contain consumer price growth and the risk of a further slowdown in business activity. The BoE's expected decision and the distribution of committee members' votes could significantly alter near-term expectations for sterling.
Today, investors will focus on the UK manufacturing PMI and the US ISM index. Weak UK readings combined with resilient US data could increase pressure on GBPUSD.
Government bond yields, dollar movements, and uncertainty ahead of the US midterm elections are additional influences. Until new signals emerge from the BoE, the fundamental backdrop suggests heightened volatility and a cautious approach to buying sterling.
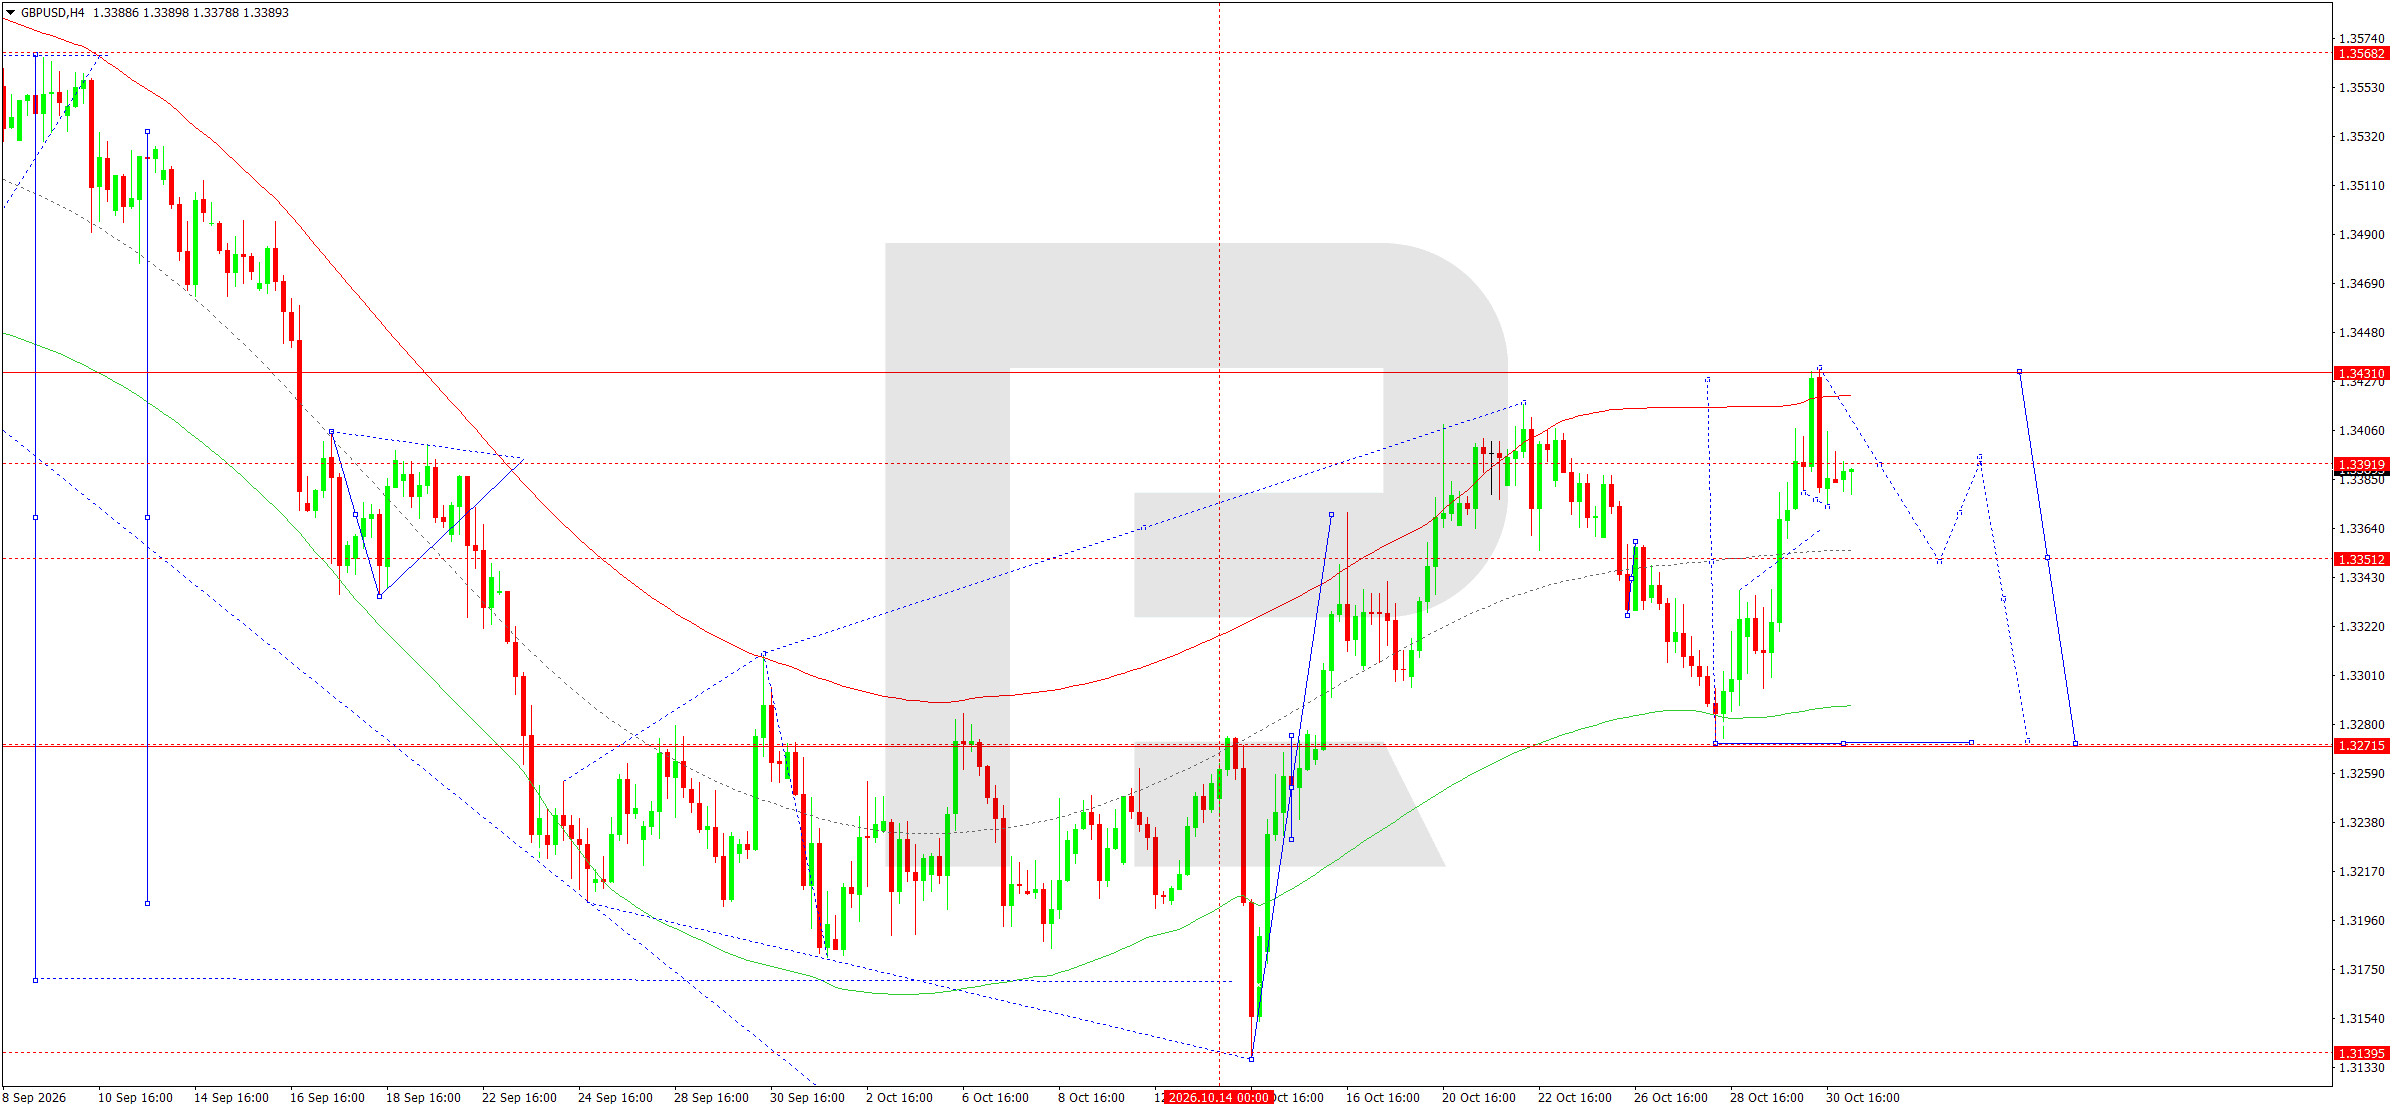
On the H4 chart, GBPUSD completed a local decline towards 1.3374 before recovering towards 1.3405. The pair is currently consolidating below this resistance.
The Elliott wave structure and the downward wave matrix, with its pivot at 1.3344, confirm the risk of another downward wave. The market previously tested the Price Envelope's upper boundary near 1.3430, after which signs of weakening buying activity emerged.
Today, a decline towards 1.3350 is preferred. A breakout below this level would pave the way for a move towards 1.3272 and 1.3265.
An additional corrective upward leg towards 1.3428–1.3431 before selling resumes cannot be ruled out. This area is regarded as key resistance within the current structure.
Consolidation above 1.3431 would weaken the bearish scenario. While prices remain below this level, sellers retain the advantage, with the Price Envelope's lower boundary serving as the main target.
GBPUSD forecast scenario
AUDUSD forecast
The Australian dollar begins the week with heightened attention on the Reserve Bank of Australia's monetary policy. The central bank's next meeting is scheduled for 3 November, prompting investors to assess the likelihood of an interest rate change and comments on inflation.
Australia's economy remains dependent on Chinese demand, industrial production trends, and commodity prices. Changes in China's growth outlook directly affect expectations for Australian exports and the national currency.
Fed policy is another important factor. The US central bank's continued hawkish stance limits the appeal of currencies sensitive to global risk appetite.
Today's release of the US ISM index could trigger notable AUDUSD fluctuations. Strong data would support the dollar, whereas signs of weakening US manufacturing could contribute to a corrective recovery in the Australian currency.
Ahead of the RBA decision, caution is likely to prevail, with short-term movements determined by technical factors and changing interest rate expectations.
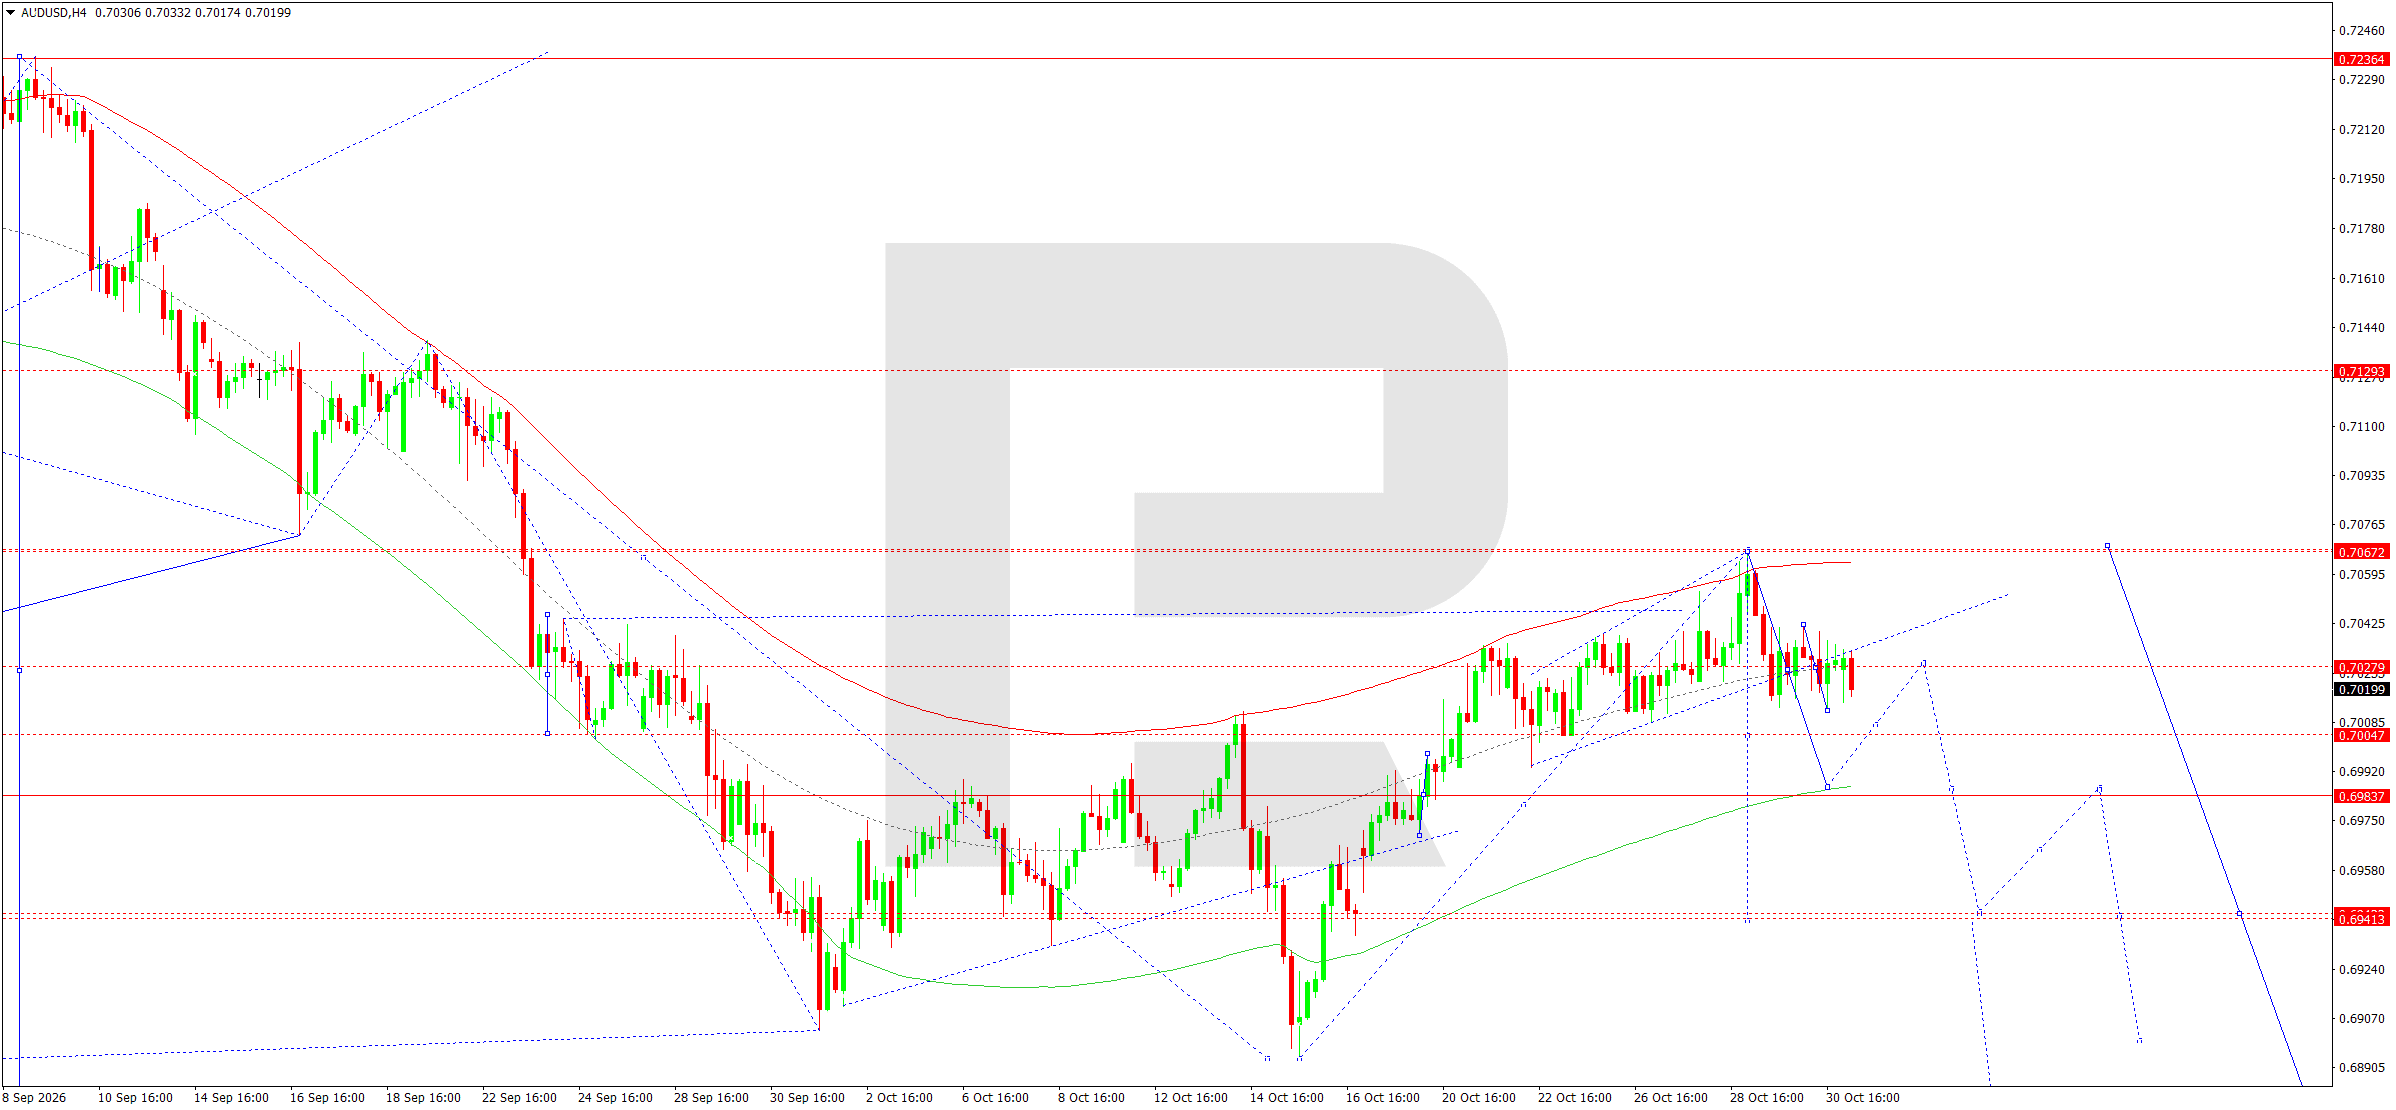
On the H4 chart, AUDUSD completed an upward correction near resistance at 0.7067 before falling towards the 0.7014 area. Consolidation is currently taking place around 0.7027.
The Elliott wave structure and the downward wave matrix, with its pivot at 0.6984, point to the potential formation of another downward impulse. The Price Envelope's upper boundary lies near 0.7067 and remains the main resistance.
A decline towards 0.7005 is expected today, followed by a test of the 0.6984 area. A breakout below this support would open the way towards 0.6941.
An initial corrective rise towards 0.7067–0.7073 cannot be ruled out, but consolidation below this area preserves sellers' advantage.
The main scenario envisages a decline after the current consolidation ends. The 0.6890 area could become a subsequent target. Sustained consolidation below 0.6941 would be required to confirm a deeper downward move.
AUDUSD forecast scenario
USDCAD forecast
The Canadian dollar begins November influenced by central bank decisions, oil market movements, and changing expectations for North American economic growth. Both the Bank of Canada and the Fed kept interest rates unchanged at their October meetings. Further USDCAD movements will depend on differences in inflation prospects and the resilience of the two economies.
Oil prices are particularly important for the Canadian currency. Early in the week, oil prices are under pressure following reports of renewed diplomatic contacts in the Middle East. Lower energy prices could reduce support for the Canadian dollar, although the immediate currency market response also depends on overall demand for the US dollar.
Investors are awaiting today's US ISM manufacturing index. Strong figures could support the dollar and set the stage for a USDCAD recovery.
Later in the week, attention will turn to US and Canadian employment figures scheduled for Friday. These releases could substantially change expectations for both central banks' future policies.
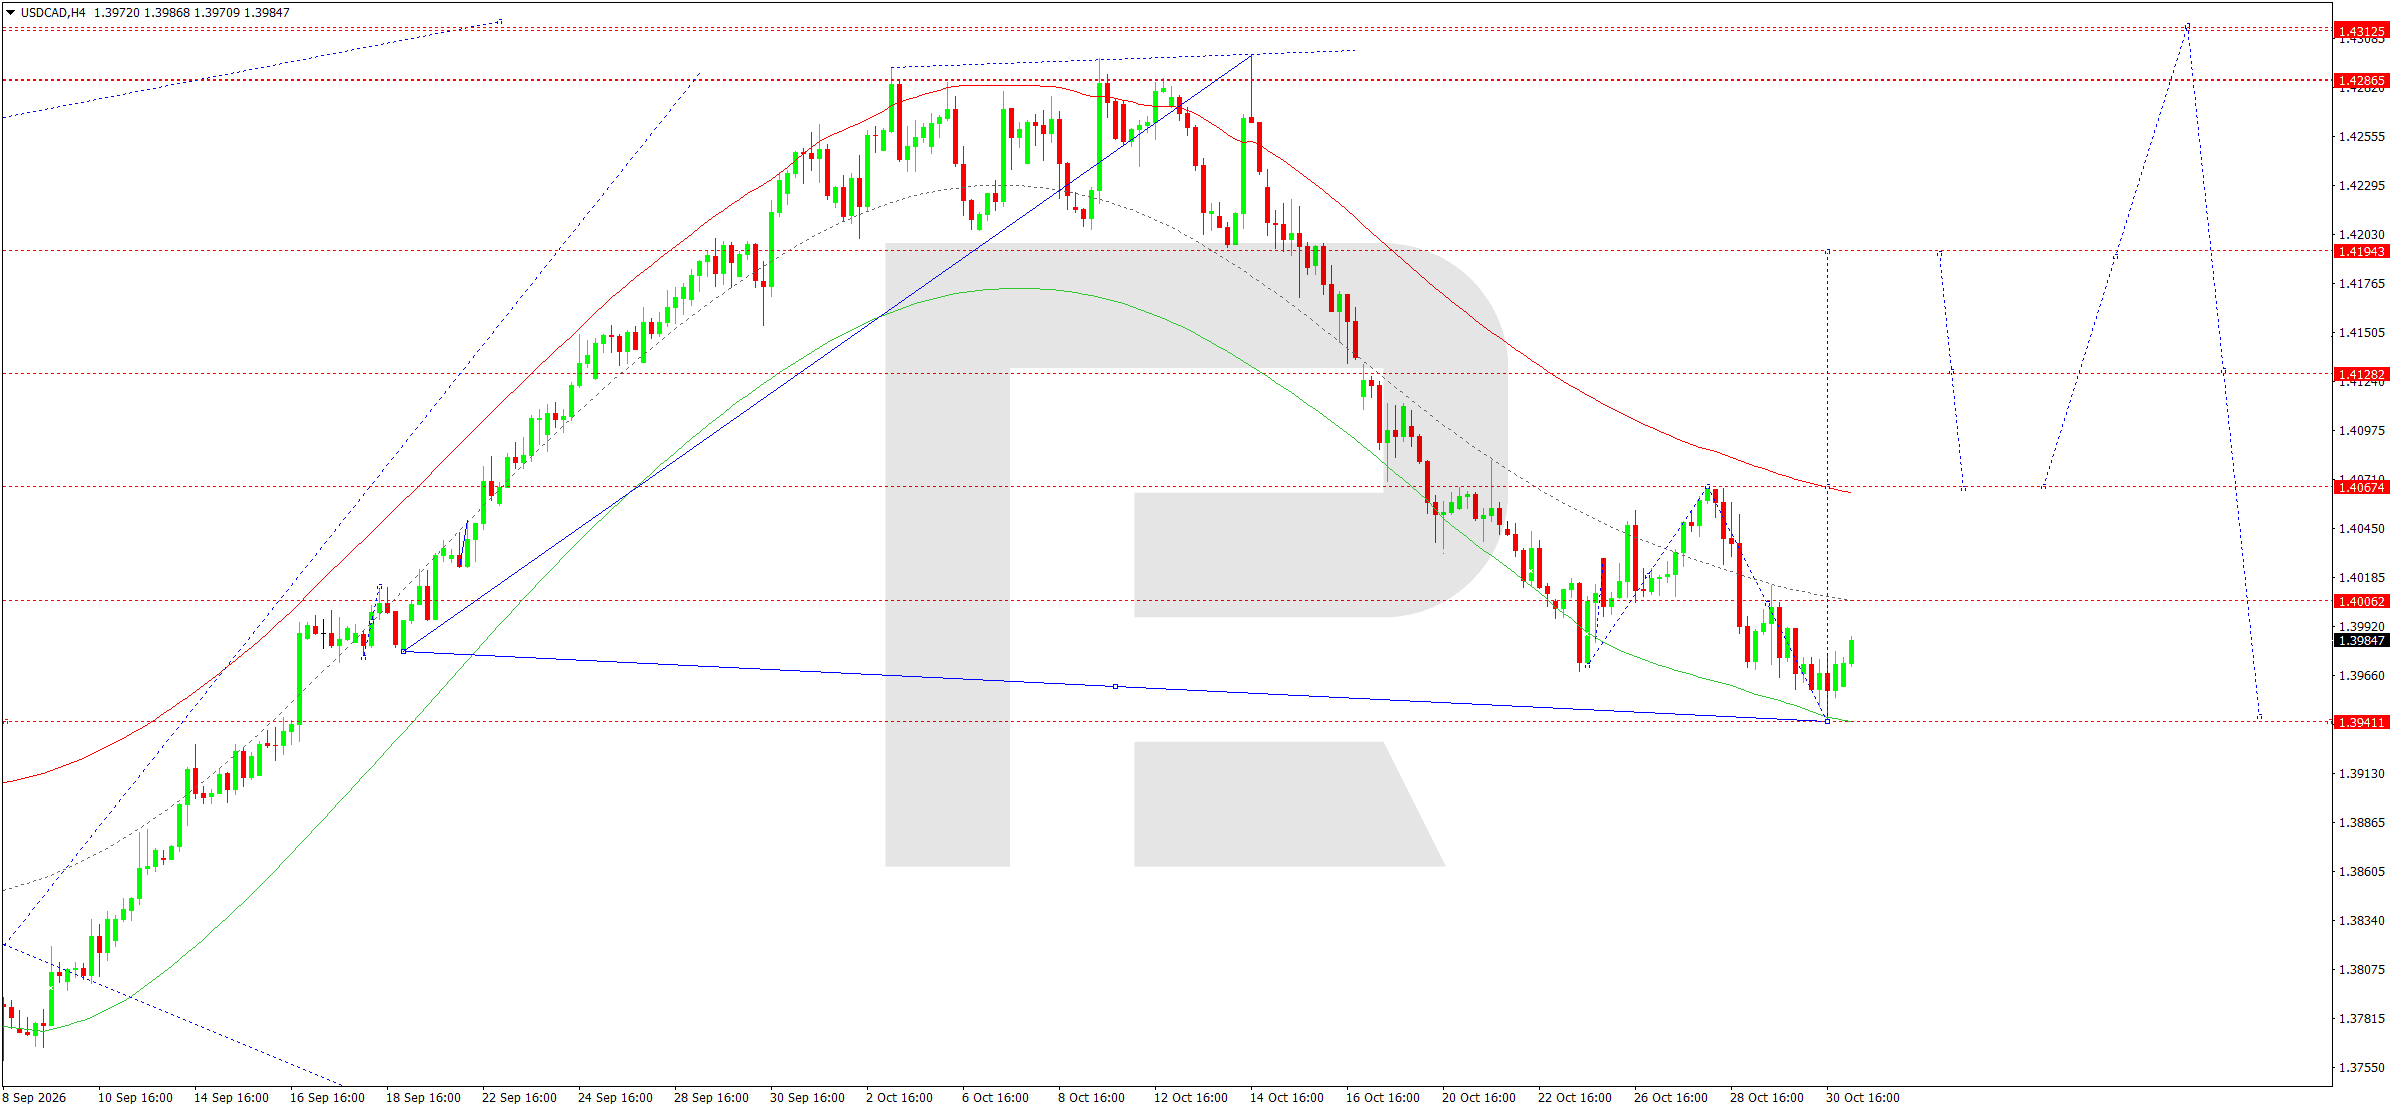
On the H4 chart, USDCAD formed an extended downward wave reaching support at 1.3941. After testing this level, the market began developing a compact consolidation range accompanied by recovery attempts.
The Elliott wave structure and the downward wave matrix, with its pivot at 1.4156, confirm that another local impulse ended near the Price Envelope's lower boundary.
A corrective rise towards 1.4006 is expected today. Consolidation above this resistance would open the way for a further recovery towards 1.4067, an important area of dynamic resistance.
If buying activity persists, the next targets will be 1.4128 and 1.4194. The latter is regarded as an extended corrective target.
The main scenario envisages a recovery after the downward wave ends. However, consolidation below 1.3941 would invalidate the near-term recovery prospects and point to continuation of the main decline.
USDCAD forecast scenario
XAUUSD forecast
Gold begins November following a substantial price decline caused by a stronger US dollar, changing interest rate expectations, and a reduction in investors’ positions. The Fed's October decision to leave rates unchanged was accompanied by indications of persistent inflation risks, limiting the precious metal's appeal.
Early on Monday, gold is attempting to recover from Friday's sharp fall. Lower oil prices provide additional support, potentially easing inflationary pressure and weakening expectations of further US rate increases.
The geopolitical backdrop remains mixed. Continued diplomatic talks in the Middle East could reduce demand for safe-haven assets, while political uncertainty ahead of the US midterm elections may support interest in gold.
Today's US ISM manufacturing data will be an important factor. A weaker dollar and lower government bond yields would create favourable conditions for a corrective rise in XAUUSD.
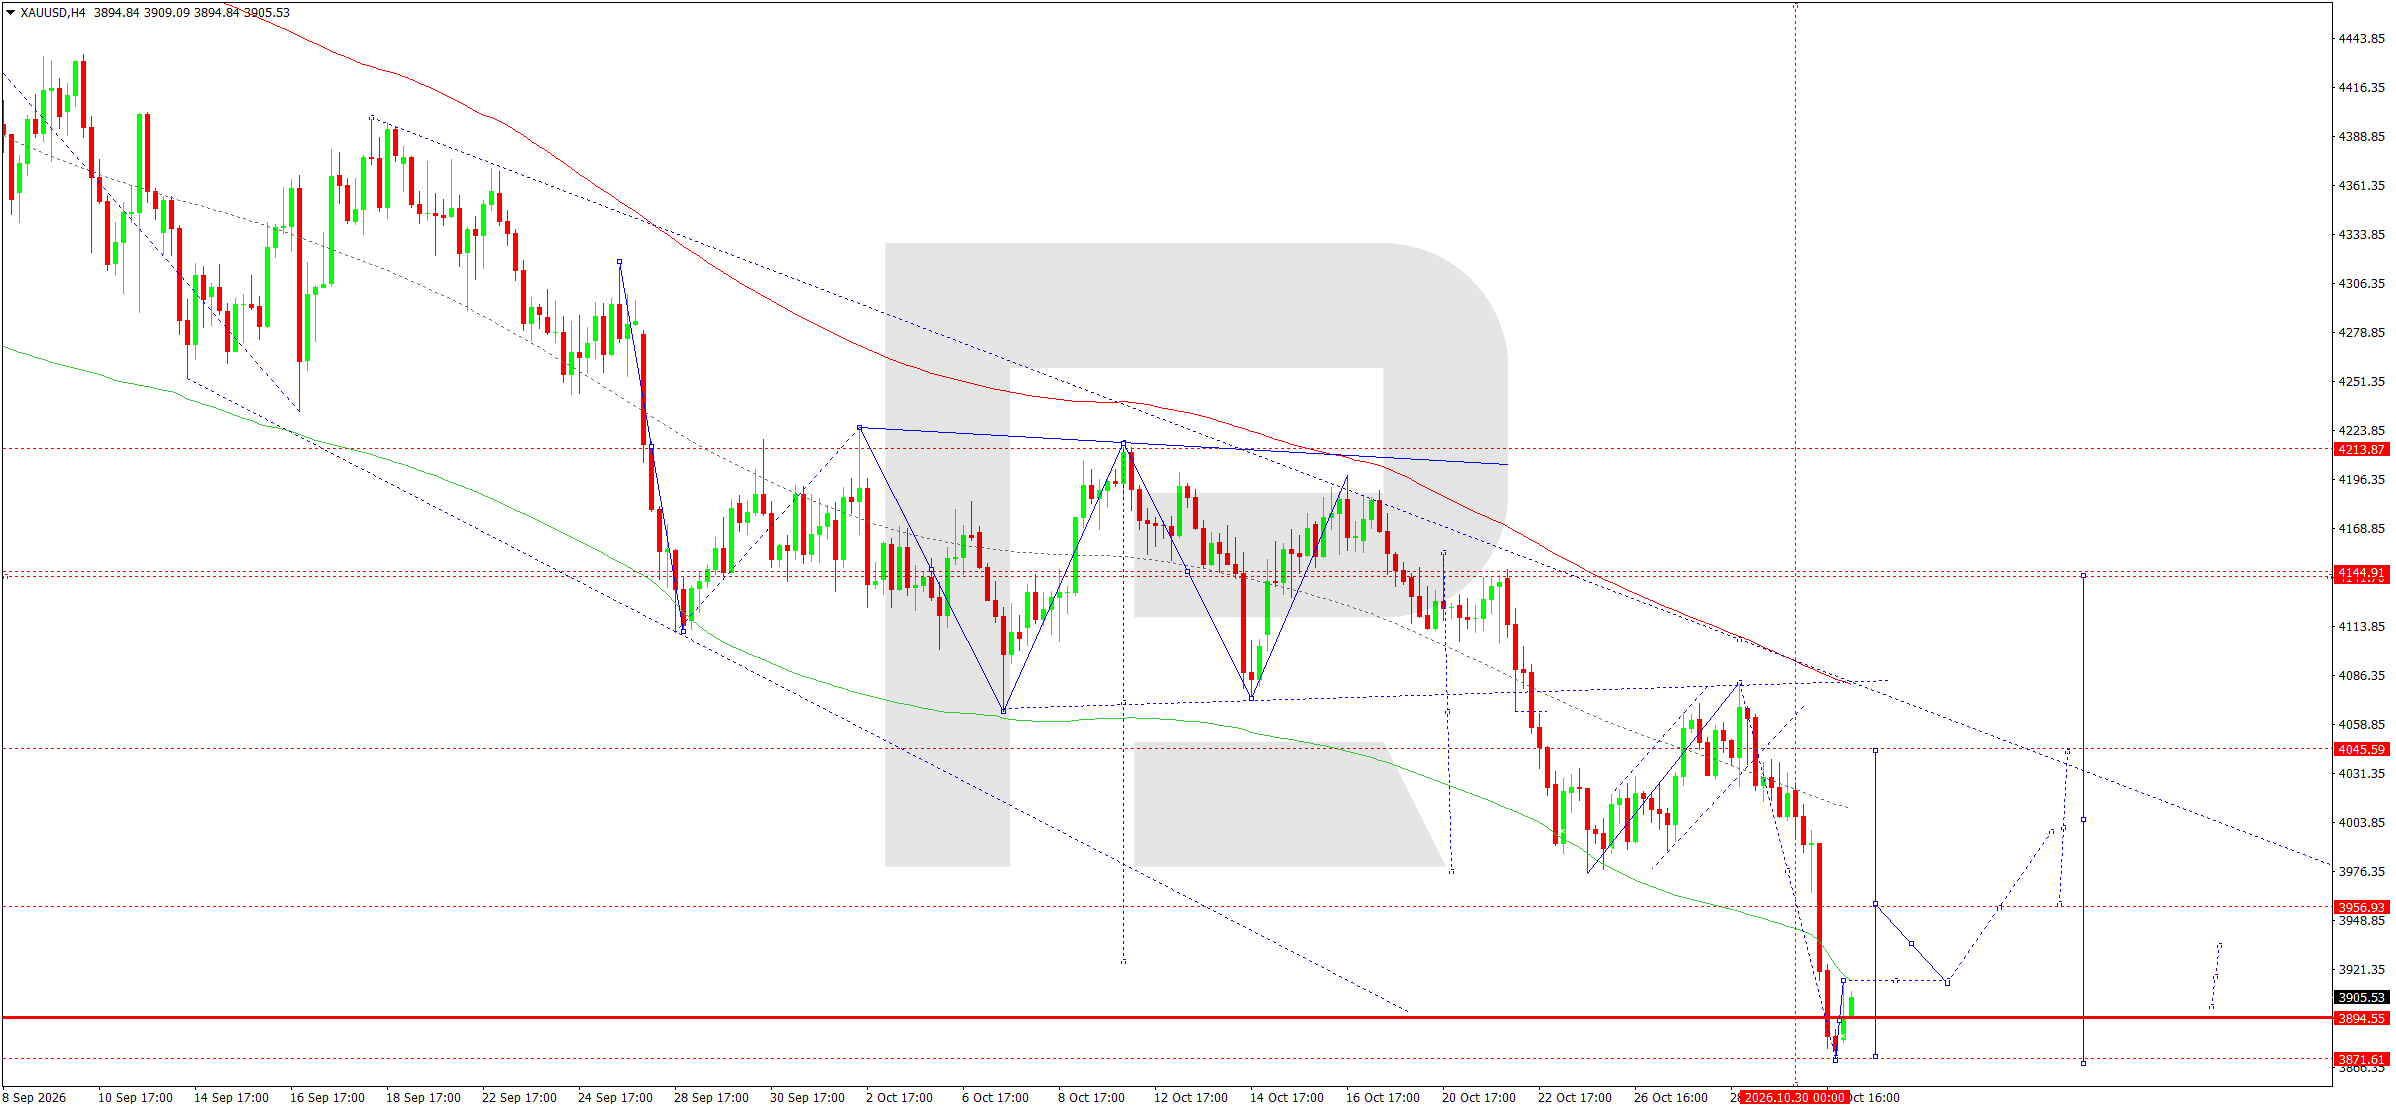
On the H4 chart, XAUUSD formed an extended downward wave reaching support at 3,871. After testing this level, the market began recovering, laying the groundwork for a technical correction.
The Elliott wave structure and the downward wave matrix, with its pivot at 4,145, confirm that the main bearish trend remains intact. However, reaching the Price Envelope's lower boundary suggests that selling pressure could ease temporarily.
Consolidation above 3,871 is expected today, followed by a rise towards 3,956. Consolidation above this resistance would open the way for further recovery towards 4,045.
If buying strengthens further, the next target will be the 4,145 area, coinciding with the downward wave matrix's central level.
The main scenario envisages a corrective rise after the local downward impulse ends. A breakout below support at 3,871 would invalidate the near-term recovery prospects and create conditions for a new low. Until a reversal is confirmed, any upward movement should be viewed solely as a correction within the prevailing downtrend.
XAUUSD forecast scenario
US 500 forecast
The US stock market begins November amid heightened uncertainty over interest rates, corporate earnings, and economic growth prospects. The Fed's October decision to leave monetary policy unchanged was accompanied by continued cautious rhetoric on inflation.
A reassessment of the technology sector outlook is putting additional pressure on stock indices. Investors are closely examining major companies' spending on artificial intelligence and the ability of these investments to deliver sustained earnings growth.
Key events in the coming week include corporate earnings releases, ISM business activity figures, and US labour market data. Today's manufacturing index will provide insight into industrial conditions and the economic outlook.
The US midterm elections scheduled for 3 November remain a significant source of volatility. Their outcome could change expectations for fiscal, tax, and trade policy.
Together, these factors create a cautious fundamental backdrop in which short-term stock market recoveries may be met with active selling.
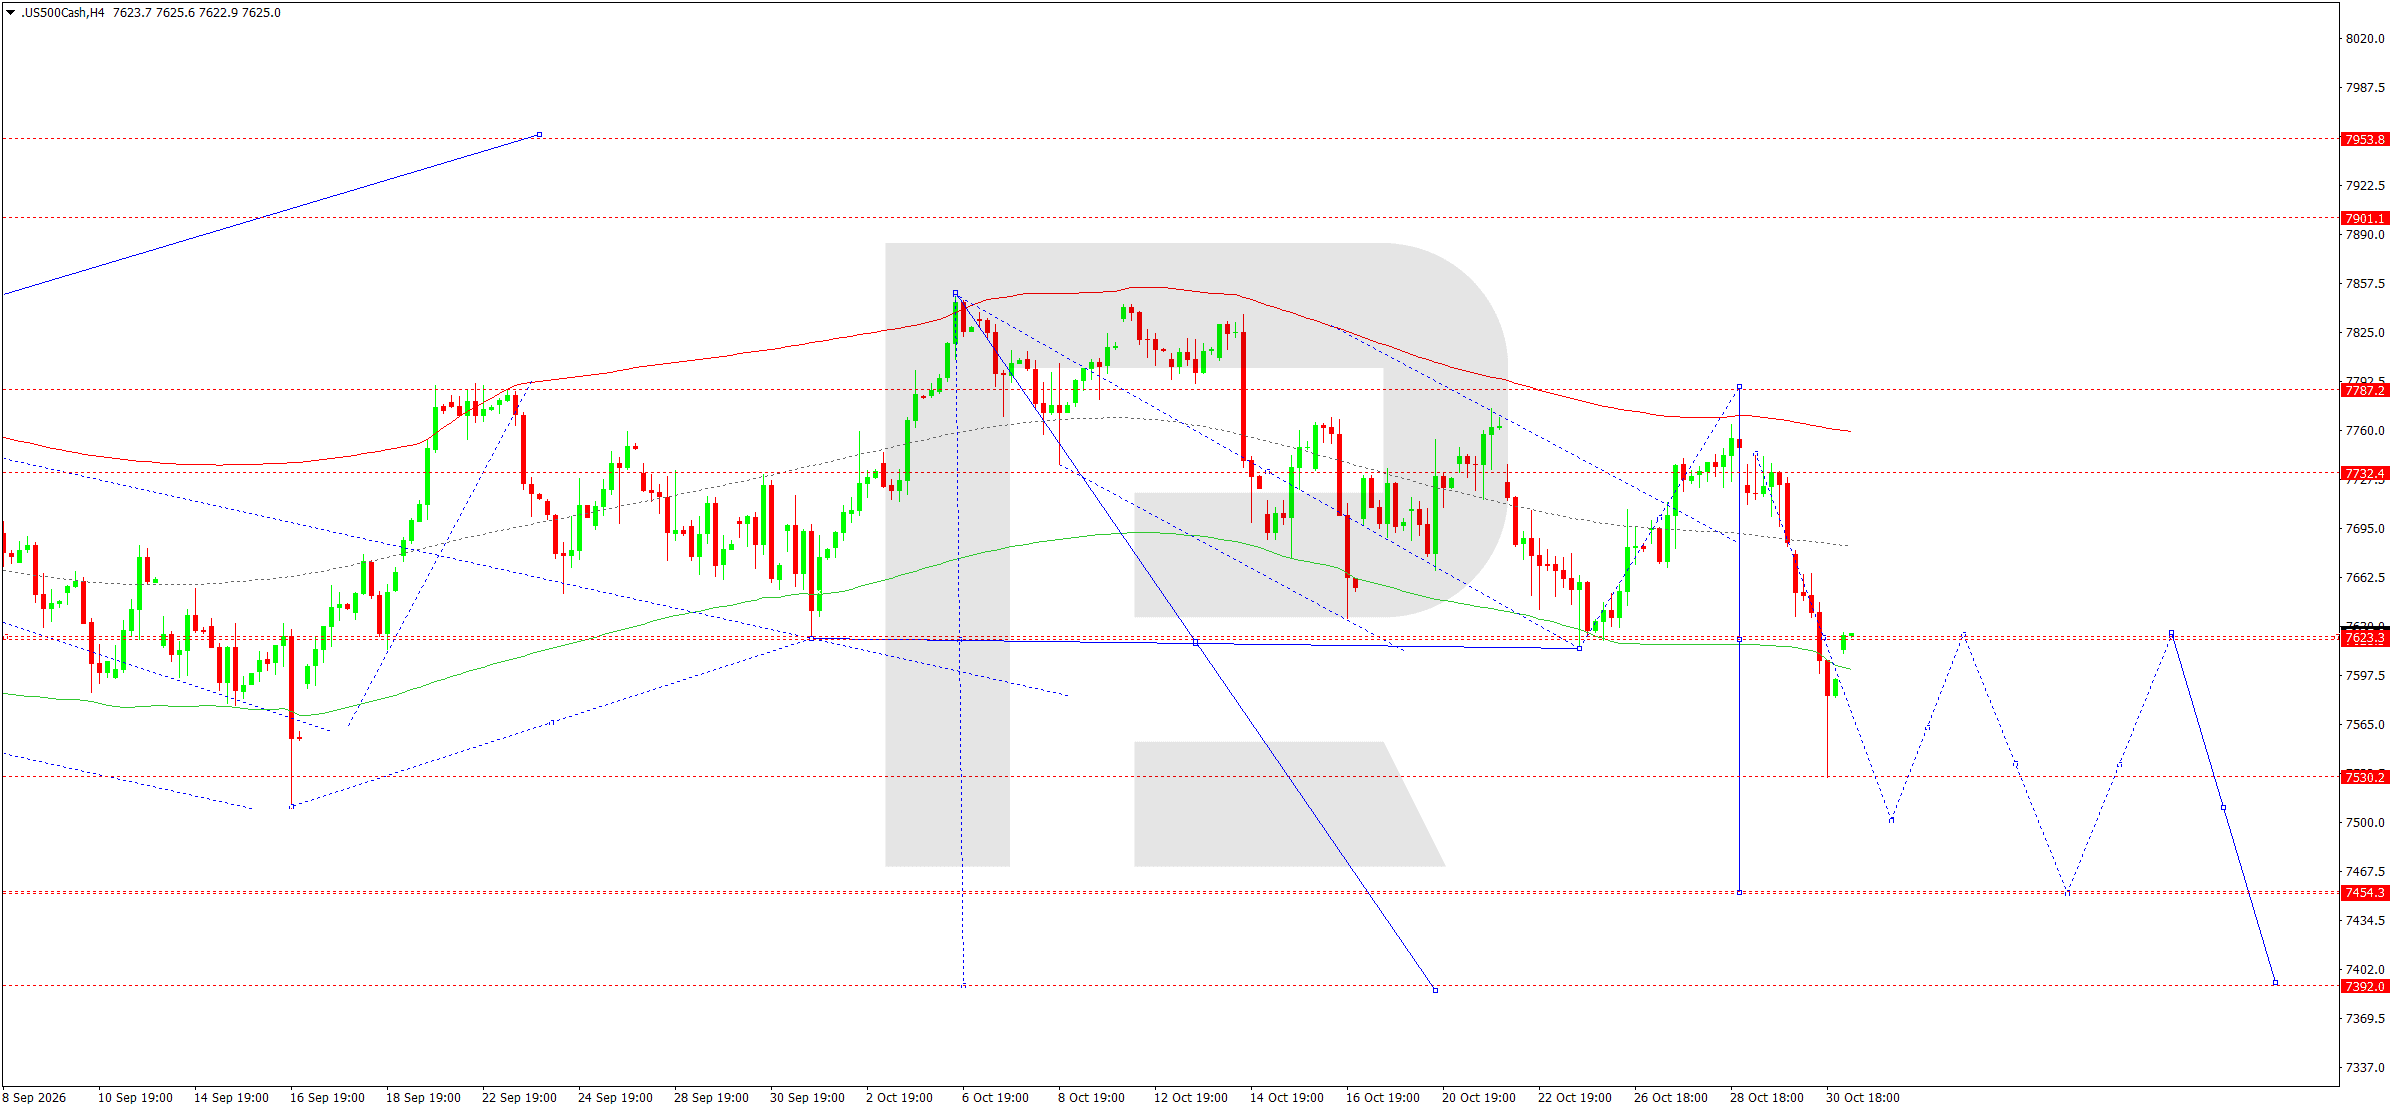
On the H4 chart, US 500 formed a bearish structure with a succession of lower local highs. After reaching support at 7,530, the market staged a corrective rise towards the 7,623 area.
The Elliott wave structure and the downward wave matrix, with its pivot at 7,623, confirm persistent selling pressure. The current correction is regarded as a retest from below of previously broken support.
The Price Envelope retains its downward slope. Prices remain below dynamic resistance levels, limiting the potential for a sustained recovery.
Consolidation around 7,623 is expected to end today, followed by a decline towards 7,530. A breakout below this support would open the way for continued downward momentum towards 7,454.
The next target is the 7,392 area, corresponding to an extension of the current wave structure. A deeper decline remains possible thereafter.
The main scenario envisages renewed selling after the local correction ends. Consolidation above 7,732 would weaken the bearish structure and set the stage for a retest of the 7,787 level.
US 500 forecast scenario
BTCUSD forecast
The Bitcoin market begins November following a period of heightened volatility and waning investor appetite for risk assets. October ended with negative cryptocurrency market performance, making traders more cautious and prices more sensitive to macroeconomic events.
Fed monetary policy remains the main external factor. Persistently high interest rates and the possibility of further tightening in financial conditions limit the appeal of speculative instruments, including cryptocurrencies.
US stock index movements are another influence. Weakness in the technology sector and declining risk appetite could increase pressure on BTCUSD.
Today, market participants will assess the US ISM manufacturing index and changes in government bond yields. Strong data could support the dollar and limit Bitcoin's recovery.
Later in the week, the US midterm elections and employment data releases will add sources of volatility. Against this backdrop, fundamentals remain mixed, with a high likelihood of sharp short-term price fluctuations.
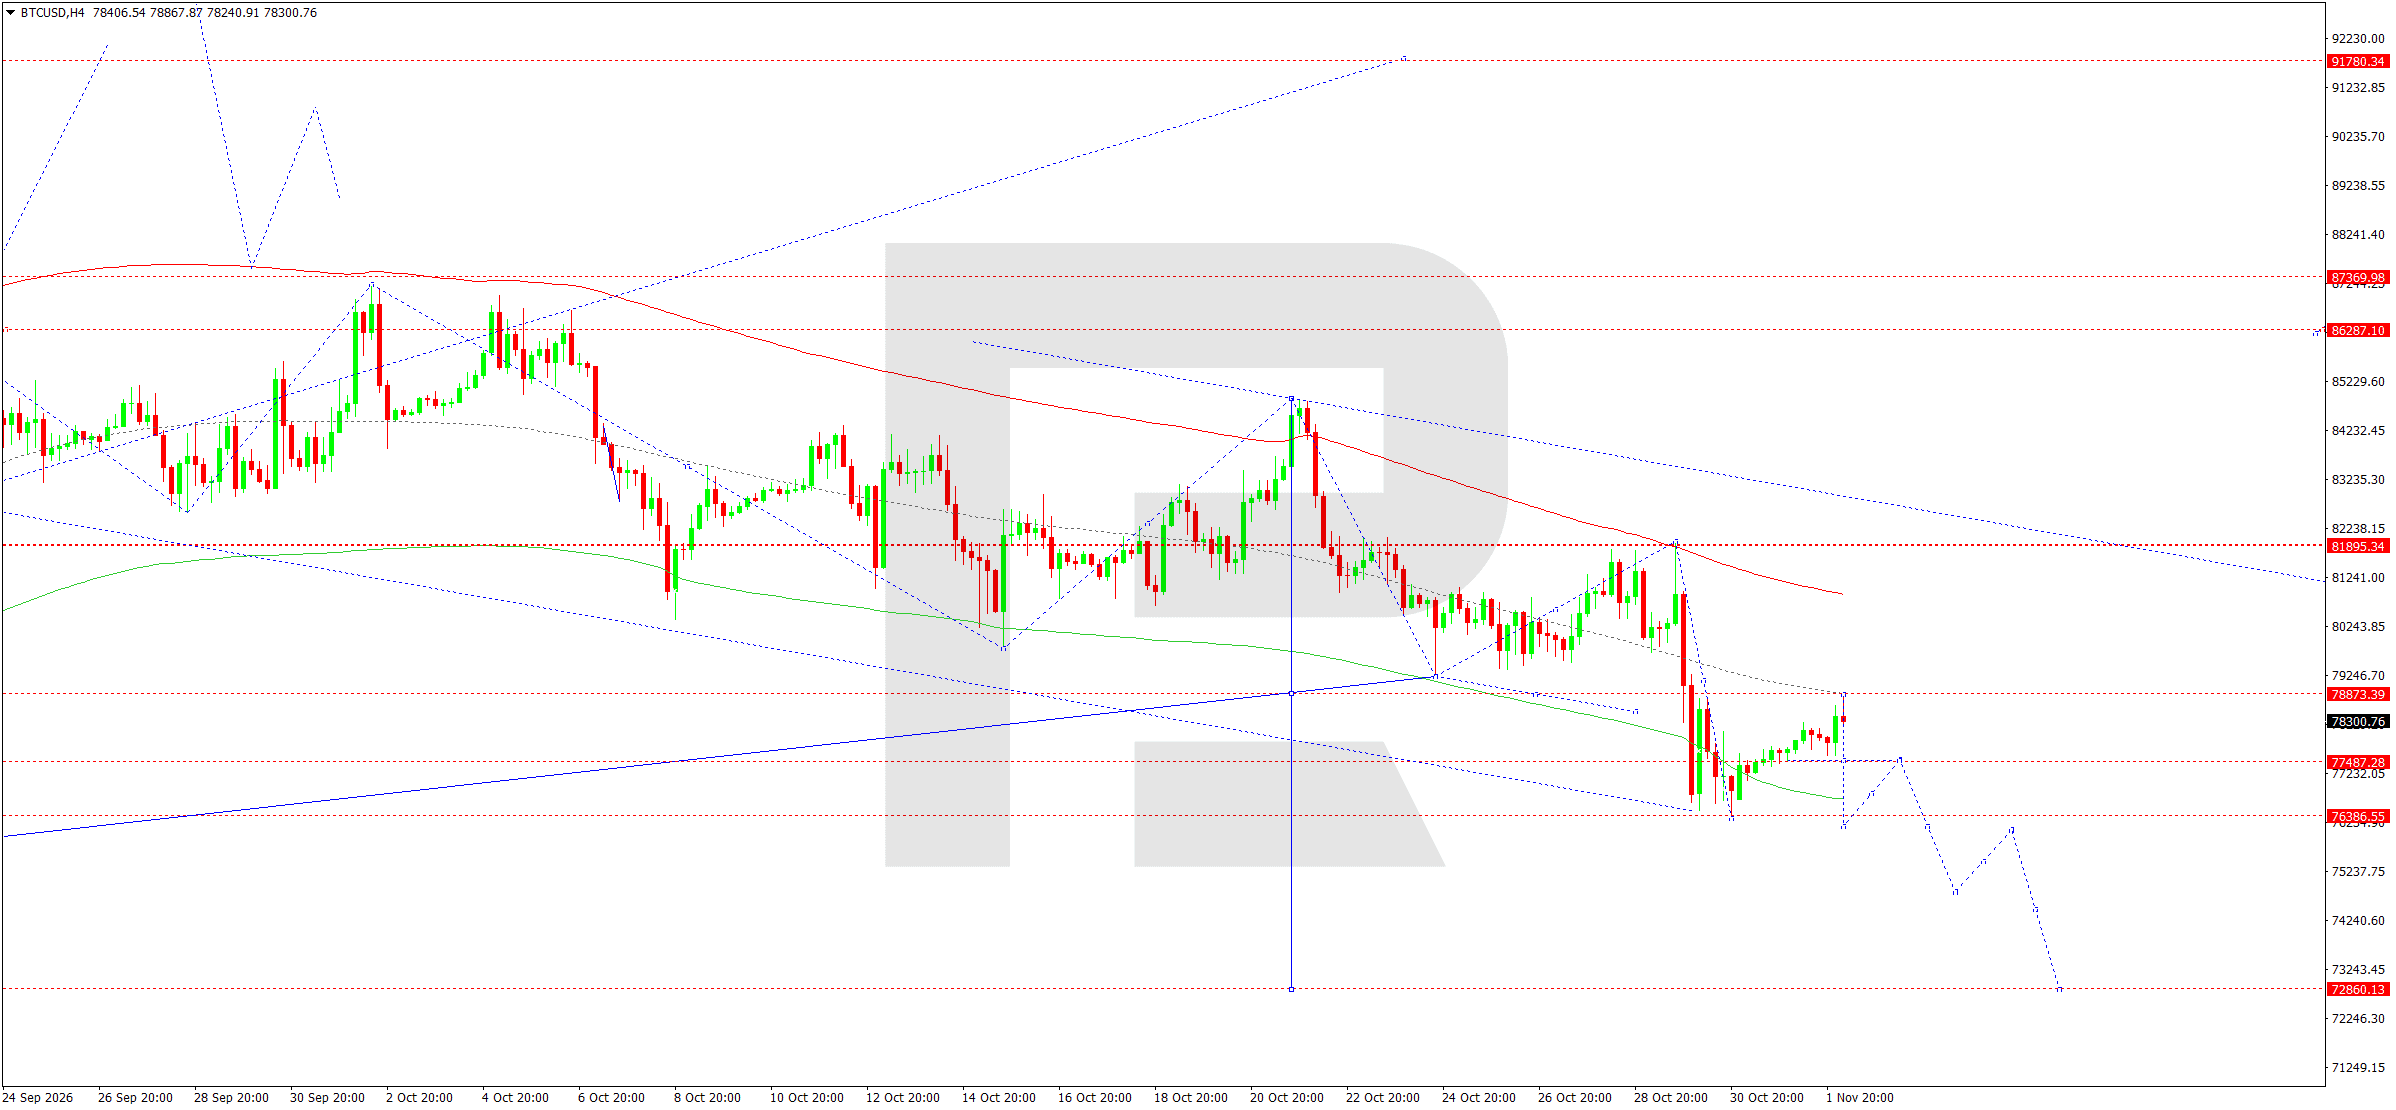
On the H4 chart, BTCUSD completed another downward wave around 76,345 before forming a corrective recovery towards resistance at 78,873.
The Elliott wave structure and the downward wave matrix, with its pivot at 78,873, indicate that the market retains a predominantly bearish bias.
The current rise is viewed as a correction after prices reached the Price Envelope's lower boundary. The 78,873 area is key resistance limiting further recovery.
A retest of this level is possible today, followed by a new downward wave towards 77,487. A breakout below this support would open the way towards 76,387 and then 75,754.
If selling intensifies, the next extended target will be 72,860.
The main scenario envisages the corrective recovery ending and the downtrend resuming. Consolidation above 78,873 would ease short-term selling pressure, but changing the main trend would require a breakout above resistance at 81,895.
BTCUSD forecast scenario
Editors’ picks


EURUSD forecast 2026–2027: technical analysis, price levels & predictions
The EURUSD outlook for 2026 and 2027: key levels on the daily chart, three trading scenarios and the policy gap between the Fed and the ECB that drives the pair.

Gold (XAUUSD) forecast 2026: technical analysis, price levels & predictions
Where gold could trade in 2026: key levels, three trading scenarios with entry triggers and the forecasts from J.P. Morgan, Deutsche Bank and Goldman Sachs.
Forecasts presented in this section only reflect the author’s private opinion and should not be considered as guidance for trading. RoboForex bears no responsibility for trading results based on trading recommendations described in these analytical reviews.