
Daily technical analysis and forecast for 4 November 2026
Daily technical analysis and forecast for EURUSD, USDJPY, GBPUSD, AUDUSD, USDCAD, XAUUSD, US 500, and BTCUSD for 4 November 2026.
Each scenario on this page reflects the market structure on the H4 chart as of 10:00 AM UTC+3 on 4 November 2026. The assessment considers the current H4 chart structure, key support and resistance levels, the direction of the medium-term movement, and the prevailing fundamental backdrop.
EURUSD forecast
On Wednesday, 4 November, EURUSD movements are driven by expectations surrounding preliminary eurozone inflation figures and US labour market data. The European Central Bank still needs to balance inflationary pressure against economic growth prospects. Higher inflation could support expectations of tight monetary policy, although weak business activity limits the euro's appreciation potential.
The Federal Reserve continues to assess the persistence of inflation and employment conditions. Today, investors are awaiting the ADP report, the ISM services index, and US trade balance figures. Strong readings could support the dollar by pushing up US bond yields. Weak data, by contrast, would create conditions for a corrective rise in EURUSD.
Changes in global risk appetite following the US midterm elections are another factor. Political uncertainty could amplify short-term dollar fluctuations. Market participants are therefore focusing primarily on how prices respond to economic data releases.
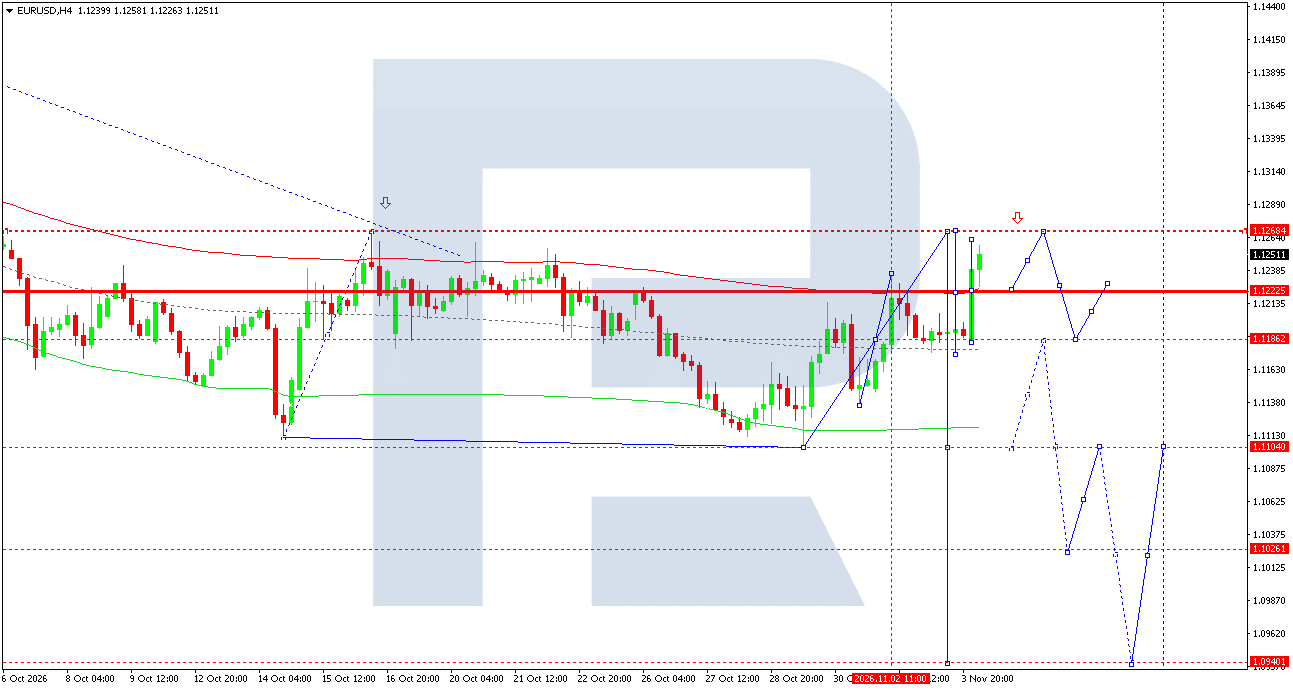
On the EURUSD H4 chart, the market completed a downward wave to 1.1175 and is forming a correction towards 1.1268. Consolidation below this resistance level appears likely today.
The broad range formed around 1.1185 is viewed as a potential continuation pattern for the downtrend. A breakout below support at 1.1180 would open the way towards 1.1040. If selling intensifies further, the next target will be 1.0940.
The Elliott wave structure and the downward wave matrix, with a pivot at 1.1222, confirm that the bearish scenario remains predominant. This level is a key reference point for the current movement.
Prices previously reached the Price Envelope's lower boundary at 1.1104. A correction towards the upper boundary at 1.1268 is now developing. Once the recovery ends, a decline towards the central line at 1.1180 is expected.
The main forecast favours selling in anticipation of a continuation of the downtrend. Consolidation above 1.1268 would weaken this scenario.
EURUSD forecast scenario
USDJPY forecast
On Wednesday, 4 November, USDJPY is influenced by changes in US government bond yields, expectations for central bank action, and demand for safe-haven assets.
The Bank of Japan continues to consider inflation trends, wage developments, and the resilience of domestic demand when determining its future monetary policy. The possibility of a gradual tightening of financial conditions remains a source of support for the Japanese currency.
At the same time, relatively high US bond yields maintain the dollar's appeal. Today, investors are focusing on the US ADP report and ISM services index. Positive results could reinforce expectations that the Fed will maintain tight monetary policy and support USDJPY.
Political uncertainty in the US is another factor, encouraging increased demand for the yen as a safe-haven currency. If risk aversion intensifies, short-term selling of the dollar against the yen is possible.
As prices approach the psychologically important 160.00 area, market participants also become increasingly attentive to a possible response from Japan's financial authorities. This limits confidence in a sustained upward movement.
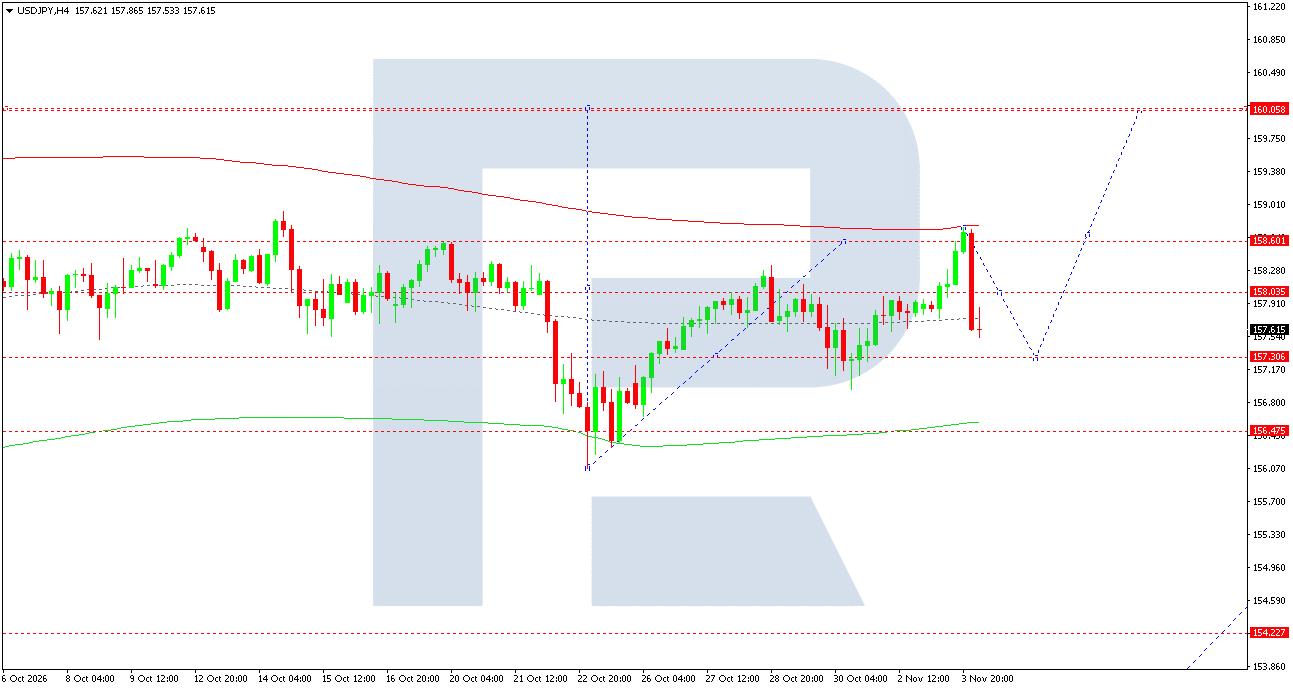
On the USDJPY H4 chart, the market formed an upward wave reaching 158.74. The subsequent consolidation ended with a corrective decline towards 157.40.
A recovery towards resistance at 158.80 is expected today. A breakout above this level would open the door for further growth towards 160.06.
The Elliott wave structure and the upward wave matrix, with a pivot at 157.50, confirm that upside potential remains. This level serves a key support level and a reference point for the current market structure.
Prices previously consolidated around the Price Envelope's central line at 157.40. The main scenario envisages a rise towards the upper boundary at 158.80, followed by a correction to 158.08 and a possible advance towards 160.06.
However, consolidation below 157.40 would cast doubt on the development of the upward impulse. Until such a signal appears, buying remains preferable.
USDJPY forecast scenario
GBPUSD forecast
On Wednesday, 4 November, sterling is influenced by expectations ahead of the Bank of England meeting scheduled for 5 November. Investors are primarily focused on interest rate prospects, inflation trends, and the state of the UK economy.
Persistent inflationary pressure calls for caution when adjusting monetary policy. At the same time, modest economic growth and signs of weakening consumer demand create conditions for a more accommodative stance from the central bank.
Final business activity figures for the UK services sector will provide another reference point today. Deviations from expectations could change the near-term assessment of sterling's prospects.
For the dollar, the main factors are the US ADP employment figures and ISM services index. Strong US data could increase pressure on GBPUSD, while weak results would create conditions for a corrective recovery.
Political uncertainty and changes in global risk appetite could also increase volatility. Ahead of the BoE meeting, market participants may limit their positions, increasing the likelihood of sharp movements within the established range.
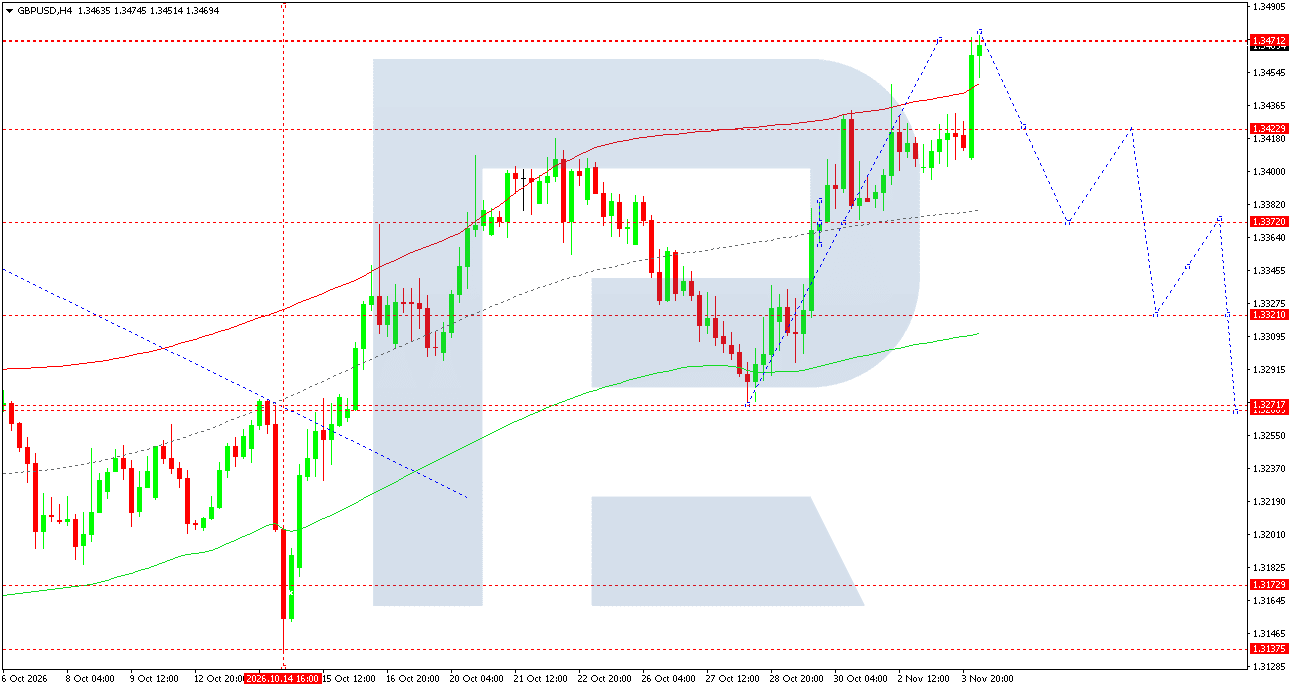
On the GBPUSD H4 chart, the market formed an upward wave towards resistance at 1.3476. A consolidation range is forming below this level and is seen as a potential area where the corrective rise may end.
A downward breakout from the range is expected today, initially targeting 1.3372. Consolidation below this level would open the way for a further decline towards 1.3272.
The Elliott wave structure and the downward wave matrix, with a pivot at 1.3372, confirm the likelihood of a developing downtrend.
Prices previously reached the Price Envelope's upper boundary at 1.3476. An additional corrective move towards the 1.3428 area is possible, but the main scenario remains a decline towards 1.3370.
If selling pressure intensifies, the next target will be the Envelope's lower boundary at 1.3272. Consolidation above 1.3476 would invalidate the preference for selling and indicate a continued recovery.
GBPUSD forecast scenario
AUDUSD forecast
On Wednesday, 4 November, the Australian dollar is influenced by expectations for Reserve Bank of Australia monetary policy, developments in the Chinese economy, and changes in global demand for risk assets.
Following the RBA's November meeting, market participants continue to assess the interest rate outlook in light of inflation, consumer spending, and labour market conditions. The yield differential between Australia and the US is particularly important for the Australian currency.
Chinese business activity figures are another factor. China's economy remains an important source of demand for Australian commodities, so changes in manufacturing activity and domestic consumption could directly affect AUDUSD.
Today, investors are also awaiting US ADP and ISM figures. Strong US data could support the dollar and increase pressure on the Australian currency.
Political uncertainty in the US and a potential decline in investors' risk appetite create additional obstacles to sustained AUDUSD gains. Stabilisation in equity markets could prompt corrective buying, but the fundamental backdrop still points to heightened volatility.
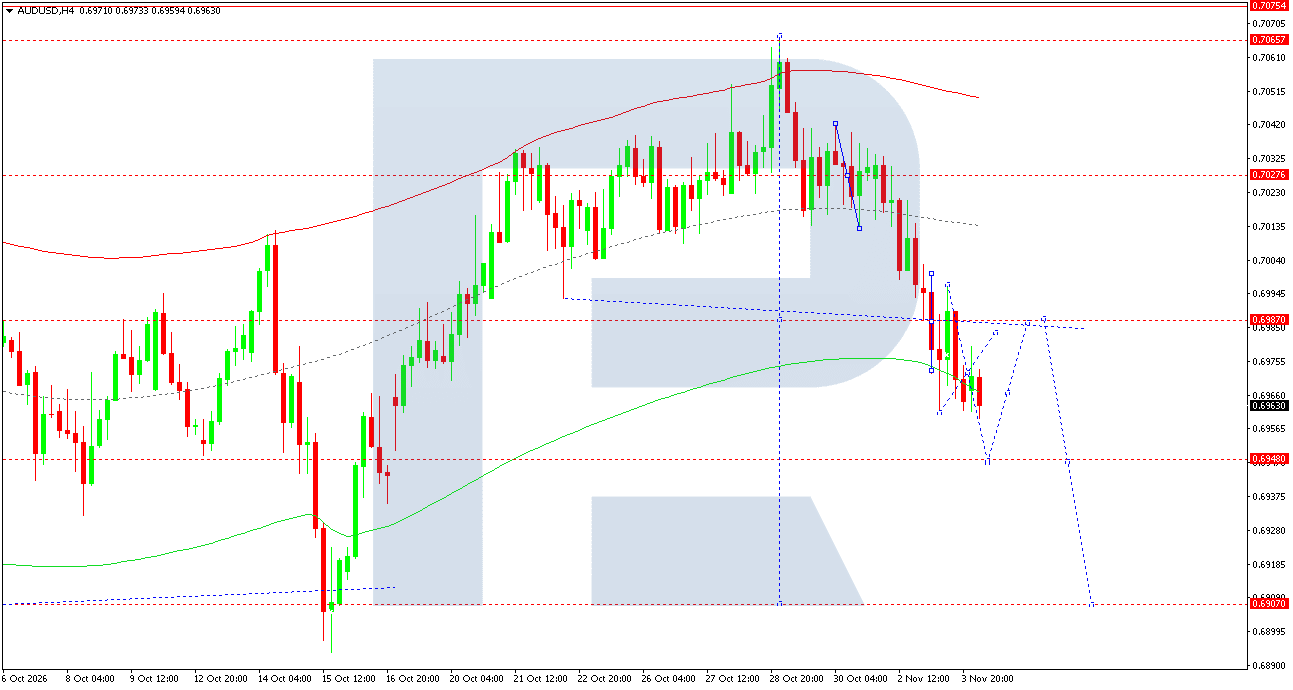
On the AUDUSD H4 chart, the market formed an upward wave towards 0.6987. A consolidation range is currently developing around 0.6950, indicating uncertainty over the near-term direction.
A downward move towards 0.6940 is expected today, followed by a test of this level from above. An additional correction towards the psychological resistance level at 0.7000 cannot be ruled out.
The Elliott wave structure and the downward wave matrix, with a pivot at 0.6978, confirm the predominantly bearish scenario.
Prices previously reached the Price Envelope's central line at 0.6985. Once the corrective recovery ends, a move towards the lower boundary at 0.6907 is expected.
The main forecast envisages a decline with successive tests of support at 0.6940 and 0.6907. Sustained consolidation above 0.7000 would reduce the likelihood of the downward wave continuing.
AUDUSD forecast scenario
USDCAD forecast
On Wednesday, 4 November, USDCAD movements are determined by the balance between US and Canadian monetary policy expectations, oil market conditions, and prospects for the North American economy.
The Bank of Canada continues to consider inflation, employment, and consumer activity when assessing the future path of interest rates. Signs of weakening domestic demand could limit the Canadian currency's appeal.
Changes in global oil prices remain an important factor. Canada is a major energy exporter, so falling oil prices generally put pressure on the Canadian dollar. Conversely, a recovery in commodity prices could support the national currency.
Canadian and US trade balance figures are due today. US ADP employment data and the ISM business activity index will also have an influence.
Investors are also assessing geopolitical risks, prospects for oil supply, and global trade conditions. Political uncertainty in the US could alter demand for the dollar and cause short-term USDCAD fluctuations.
Together, these factors suggest that the pair will remain sensitive to US economic data and energy market developments.
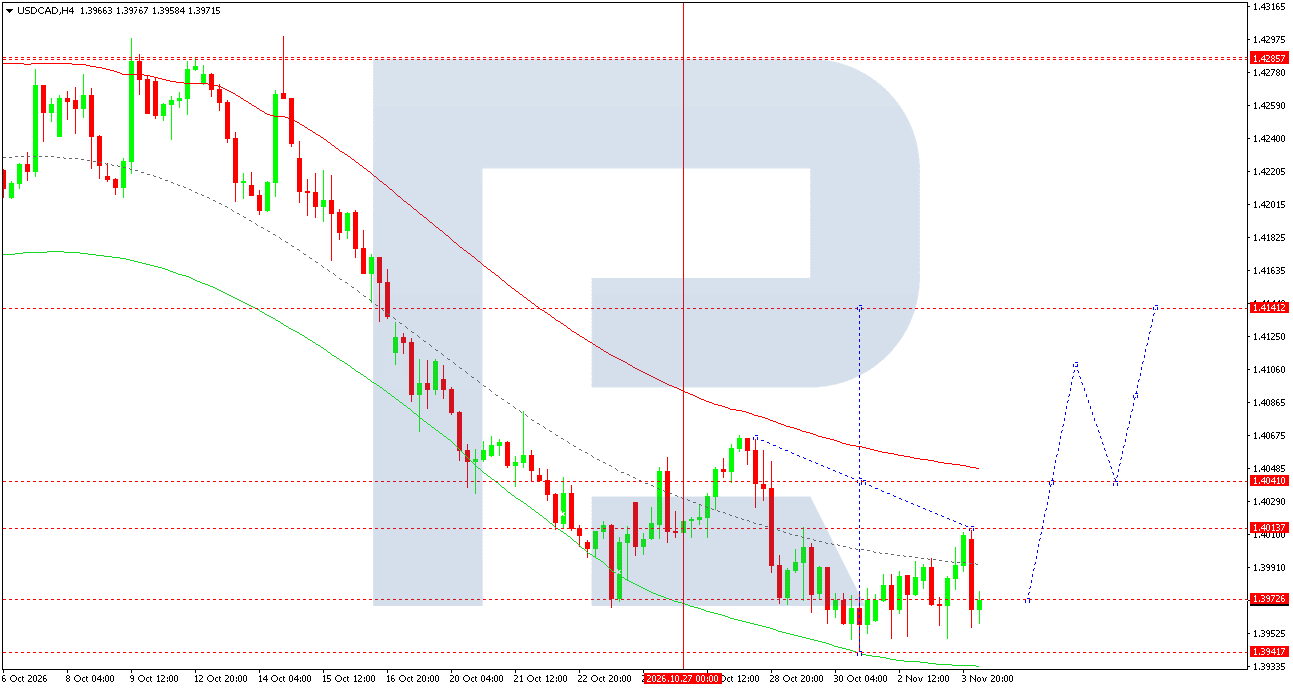
On the USDCAD H4 chart, the market completed a corrective decline towards 1.3956. A compact consolidation range is expected to form above this support level today.
If growth resumes and psychological resistance at 1.4000 is broken, a move towards 1.4040 could follow, with the next upside target at 1.4141.
The Elliott wave structure and the wave matrix, with a pivot at 1.4014, identify the current area as an important threshold for a change in short-term direction.
Prices previously reached the Price Envelope's lower boundary at 1.3941. A recovery towards its upper boundary at 1.4070 is expected from this area.
The main scenario favours buying in anticipation of further corrective growth. Consolidation below 1.3941 would signal weakening upside potential and increase the likelihood of further declines.
USDCAD forecast scenario
XAUUSD forecast
On Wednesday, 4 November, gold is influenced by US dollar movements, US government bond yields, and changes in demand for safe-haven assets.
Investors are primarily focused on the outlook for Fed policy. Persistently high real interest rates increase the opportunity cost of holding gold, as the metal does not generate interest income.
The US ADP report and ISM services index are due today. Weak readings could reinforce expectations of monetary easing and support gold. Strong data, by contrast, could help the dollar recover and limit XAUUSD gains.
Political uncertainty following the US midterm elections provides additional support for demand for the metal. Capital moving into safe-haven assets could increase interest in gold.
Geopolitical risks, including tensions in the Middle East and ongoing international conflicts, also remain important pricing factors.
In the short term, the direction will depend on a combination of US economic data, bond yields, and dollar movements. A decline in yields would increase the likelihood of a corrective recovery in gold.
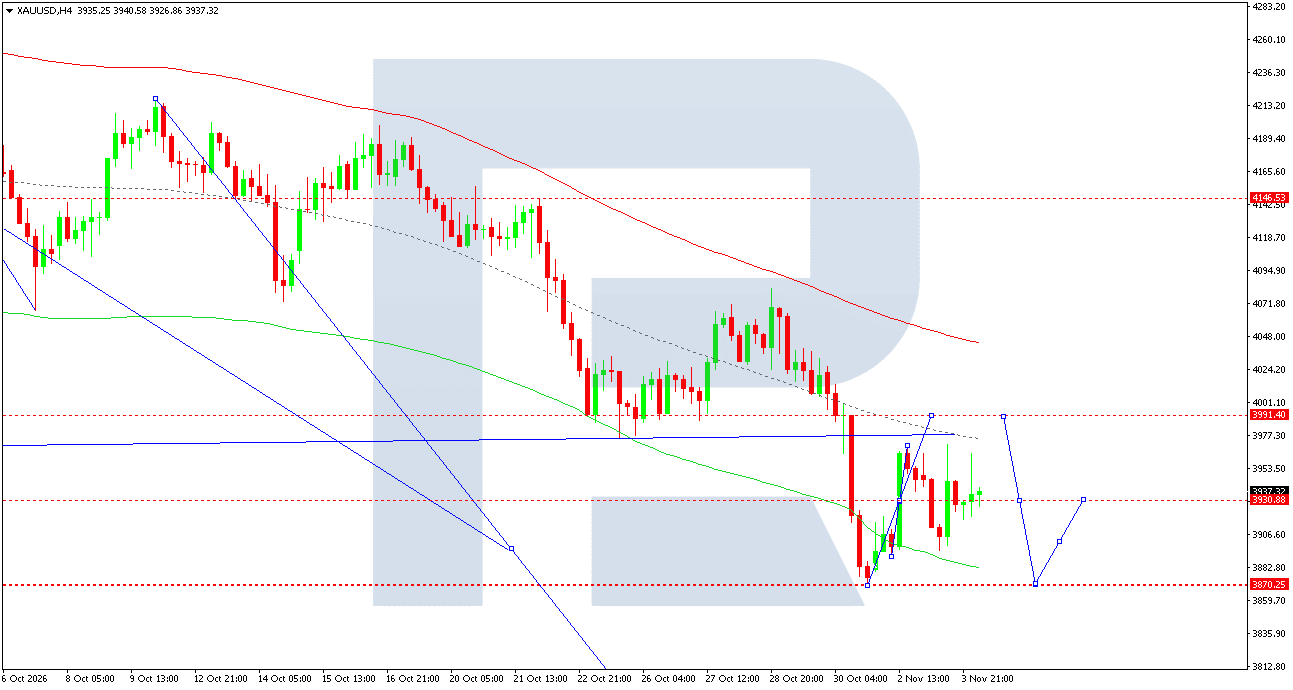
On the XAUUSD H4 chart, the market formed a downward wave reaching 3,898. The current structure allows for a corrective recovery after a substantial decline.
A potential upward wave towards resistance at 4,045 is possible today. Consolidation above this level would bring the next target at 4,070 into focus.
The Elliott wave structure and the downward wave matrix, with a pivot at 4,145, indicate that the broader downtrend remains intact. The anticipated rise is therefore still regarded primarily as a corrective move.
Prices previously approached the Price Envelope's lower boundary at 3,871. A recovery wave could develop from this area, followed by a test of 4,070.
The main short-term scenario favours buying to capture a correction. A renewed decline below 3,898 would substantially weaken the prospects for an upward move.
XAUUSD forecast scenario
US 500 forecast
On Wednesday, 4 November, the US 500 stock index is influenced by political uncertainty, expectations for Fed interest rates, and the corporate earnings outlook.
Following the US midterm elections, investors are reassessing expectations for fiscal policy, tax regulation, and future developments in the technology sector. Potential changes in legislative priorities could affect valuations of major US companies.
Concerns about future spending on artificial intelligence and data centre construction are creating additional pressure. If expectations for returns on these investments deteriorate, technology stocks could experience heightened volatility.
Today, market participants are awaiting the ADP report and ISM services index. Strong figures could support expectations of resilient economic growth but also intensify concerns that interest rates will remain high for an extended period.
Falling bond yields generally support equity valuations, although this effect could be limited if concerns about an economic slowdown increase.
Overall, the fundamental backdrop points to cautious investor risk appetite. The combination of political factors, economic data, and corporate forecasts remains the main source of short-term volatility.
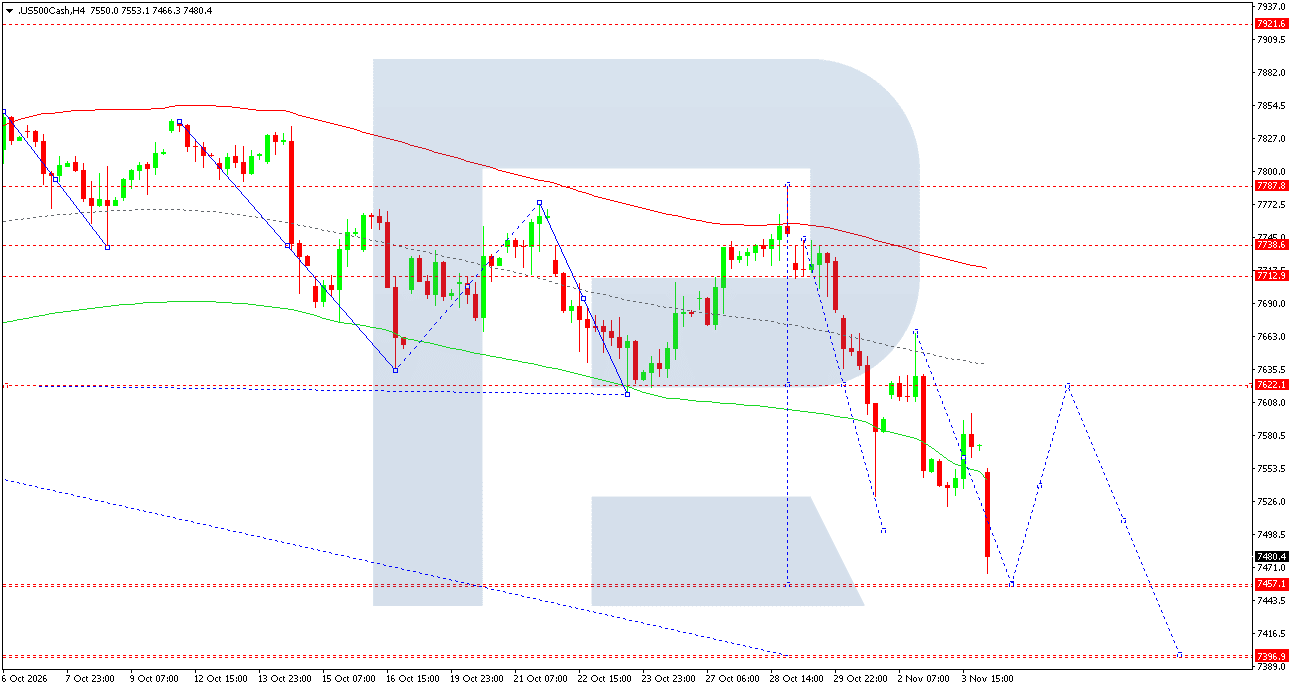
On the US 500 H4 chart, a downward wave structure has formed, reaching support at 7,466. A consolidation range is developing above this level.
A corrective rise towards resistance at 7,623 is possible today. Once the recovery ends, a renewed decline towards 7,396 is expected.
The Elliott wave structure and the downward wave matrix, with a pivot at 7,623, confirm that the overall direction remains bearish. This level is regarded as key resistance in the current structure.
A corrective move towards the upper area of the range could set the stage for renewed selling. If selling pressure intensifies, the next target will be the Price Envelope's lower boundary at 7,396.
The main scenario envisages a decline after the correction ends. Consolidation above 7,623 would weaken the bearish outlook and indicate the possibility of a more prolonged recovery.
US 500 forecast scenario
BTCUSD forecast
On Wednesday, 4 November, Bitcoin is influenced by changes in global risk appetite, US dollar movements, and expectations for further Fed monetary policy.
Political uncertainty following the US midterm elections is increasing cryptocurrency market participants' focus on potential changes to digital asset regulation. A reassessment of legislative priorities could affect institutional investor sentiment.
US stock indices are another important factor. Bitcoin remains sensitive to liquidity conditions and demand for risk assets, so declines in the technology sector could coincide with pressure on cryptocurrencies.
Today, investors are awaiting US ADP and ISM data. Weak figures could support expectations of a more accommodative Fed policy and create conditions for a BTCUSD recovery.
However, strong data and rising bond yields could limit demand for speculative instruments.
Capital flows through investment products offering exposure to Bitcoin and the activity of major market participants also have a significant impact. Against a backdrop of heightened uncertainty, sharp short-term fluctuations remain possible.
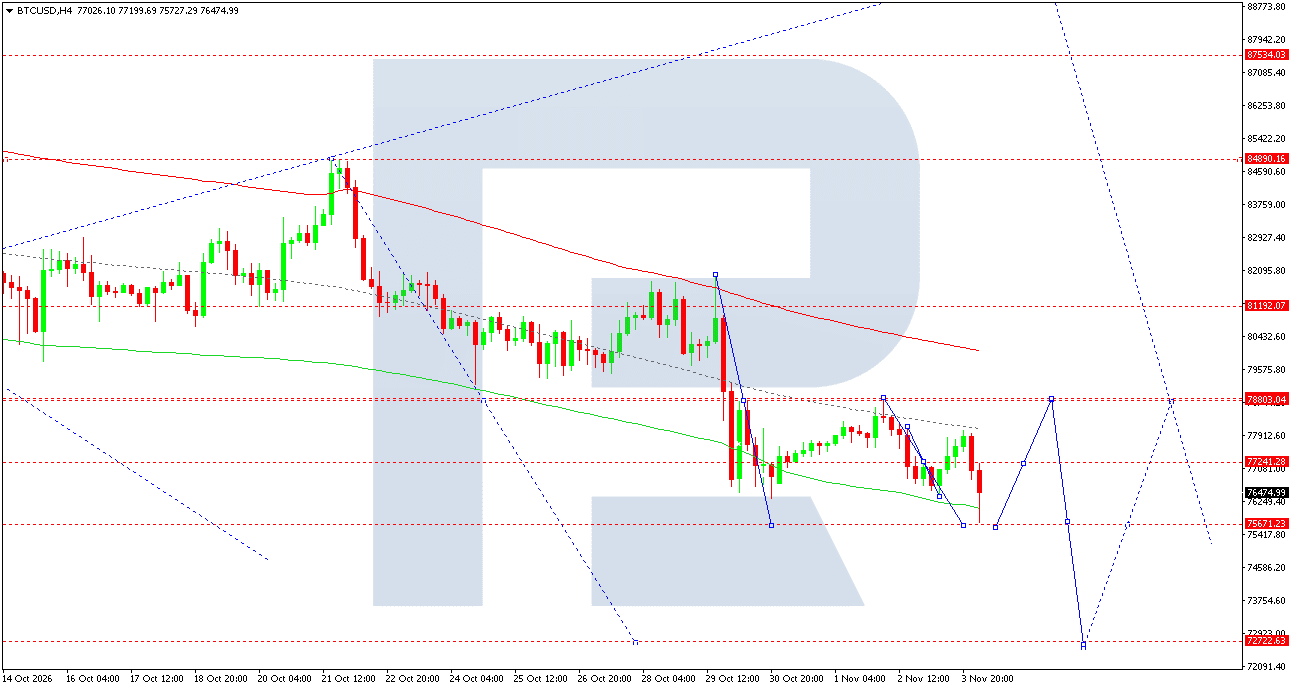
On the BTCUSD H4 chart, the market formed a bearish structure reaching the 75,735 area. The current wave configuration suggests corrective growth towards resistance at 78,800.
Once the recovery ends, a renewed decline towards 72,722 is expected.
The Elliott wave structure and the downward wave matrix, with a pivot at 78,800, confirm that the overall direction remains bearish. This level serves as key resistance and a potential area where the correction may end.
Prices previously approached the Price Envelope's lower boundary at 75,732. A recovery towards its central line at 78,800 could develop from this area.
After the central line is tested, another downward impulse towards the lower boundary at 72,722 is expected.
The main trading scenario favours selling within the prevailing bearish structure. Consolidation above 78,800 would weaken the prospects for further declines and require a reassessment of the short-term forecast.
BTCUSD forecast scenario
Editors’ picks


EURUSD forecast 2026–2027: technical analysis, price levels & predictions
The EURUSD outlook for 2026 and 2027: key levels on the daily chart, three trading scenarios and the policy gap between the Fed and the ECB that drives the pair.

Gold (XAUUSD) forecast 2026: technical analysis, price levels & predictions
Where gold could trade in 2026: key levels, three trading scenarios with entry triggers and the forecasts from J.P. Morgan, Deutsche Bank and Goldman Sachs.
Forecasts presented in this section only reflect the author’s private opinion and should not be considered as guidance for trading. RoboForex bears no responsibility for trading results based on trading recommendations described in these analytical reviews.