
Daily technical analysis and forecast for 5 November 2026
Daily technical analysis and forecast for EURUSD, USDJPY, GBPUSD, AUDUSD, USDCAD, XAUUSD, US 500, and BTCUSD for 5 November 2026.
Each scenario on this page reflects the market structure on the H4 chart as of 10:00 AM UTC+3 on 5 November 2026. The assessment considers the current H4 chart structure, key support and resistance levels, the direction of the medium-term movement, and the prevailing fundamental backdrop.
EURUSD forecast
On Thursday, the currency market remains influenced by the results of the US midterm elections, which have led to a weaker US dollar and lower government bond yields. Post-election capital reallocation is supporting the European currency. The monetary policy outlook for the US Federal Reserve and the European Central Bank is also important. Despite persistent inflation risks, investors are revising their expectations for further US interest rate increases. Eurozone inflation data published the previous day also remain an important factor in assessing the ECB's outlook. US employment figures due on Friday could change the dollar's short-term direction.
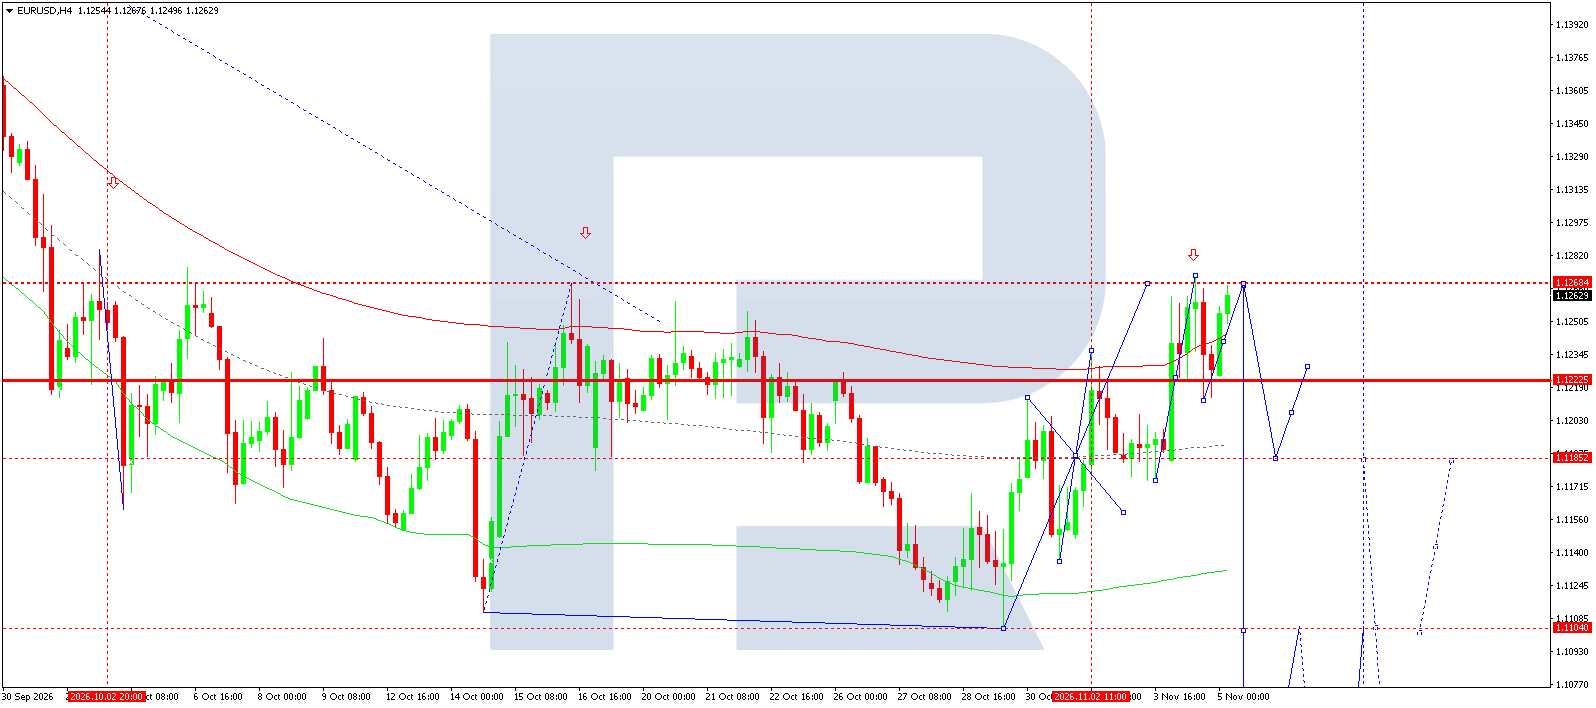
The technical picture for EURUSD on the H4 chart indicates an upward correction within a longer-term bearish structure. After forming a local low around 1.1143, buyers regained ground and pushed prices towards resistance at 1.1260. The move was accompanied by successively higher local lows and the formation of a short-term ascending channel.
The price is currently around 1.1243, just above the key horizontal level at 1.1222. This level is the nearest pivot point, separating scenarios of continued recovery and a renewed decline. Resistance at 1.1260 coincides with the upper boundary of the local corrective structure and the descending trendline.
From an Elliott wave perspective, the latest rise can be viewed as the final stage of a corrective move. The chart shows a potential fourth wave, after which a new downward impulse could form. However, confirmation of this scenario would require not merely a test of resistance but a subsequent H4 candlestick close below 1.1222.
If this scenario develops, the sellers' nearest target will be 1.1175. The next support area lies at 1.1143. A breakout below it would open the way towards 1.1045–1.1035. As long as prices remain above 1.1222, a retest of 1.1260 remains possible, so opening short positions prematurely carries additional risk.
The main forecast for the coming day envisages the corrective rise ending near the channel's upper boundary, followed by a gradual return of selling pressure. A sustained breakout above 1.1260 would invalidate the immediate reversal signal and require a reassessment of the bearish scenario.
EURUSD forecast scenario
USDJPY forecast
The Japanese yen continues to respond to changes in US government bond yields and expectations for monetary policy at major central banks. The dollar's weakness following the US midterm elections creates conditions for the Japanese currency to strengthen. At the same time, the Federal Reserve remains cautious about further interest rate changes amid inflation risks. At its latest meeting, the Bank of Japan kept its interest rate at 1.25% while raising its core inflation forecast for the next fiscal year. This combination of factors limits the potential for sustained yen weakness.
Another source of uncertainty is the possibility of foreign exchange intervention by the Japanese authorities as USDJPY approaches the psychologically important 160.00 area. Market participants are also awaiting Friday's US labour market figures, which could significantly alter expectations for the Fed's next steps.
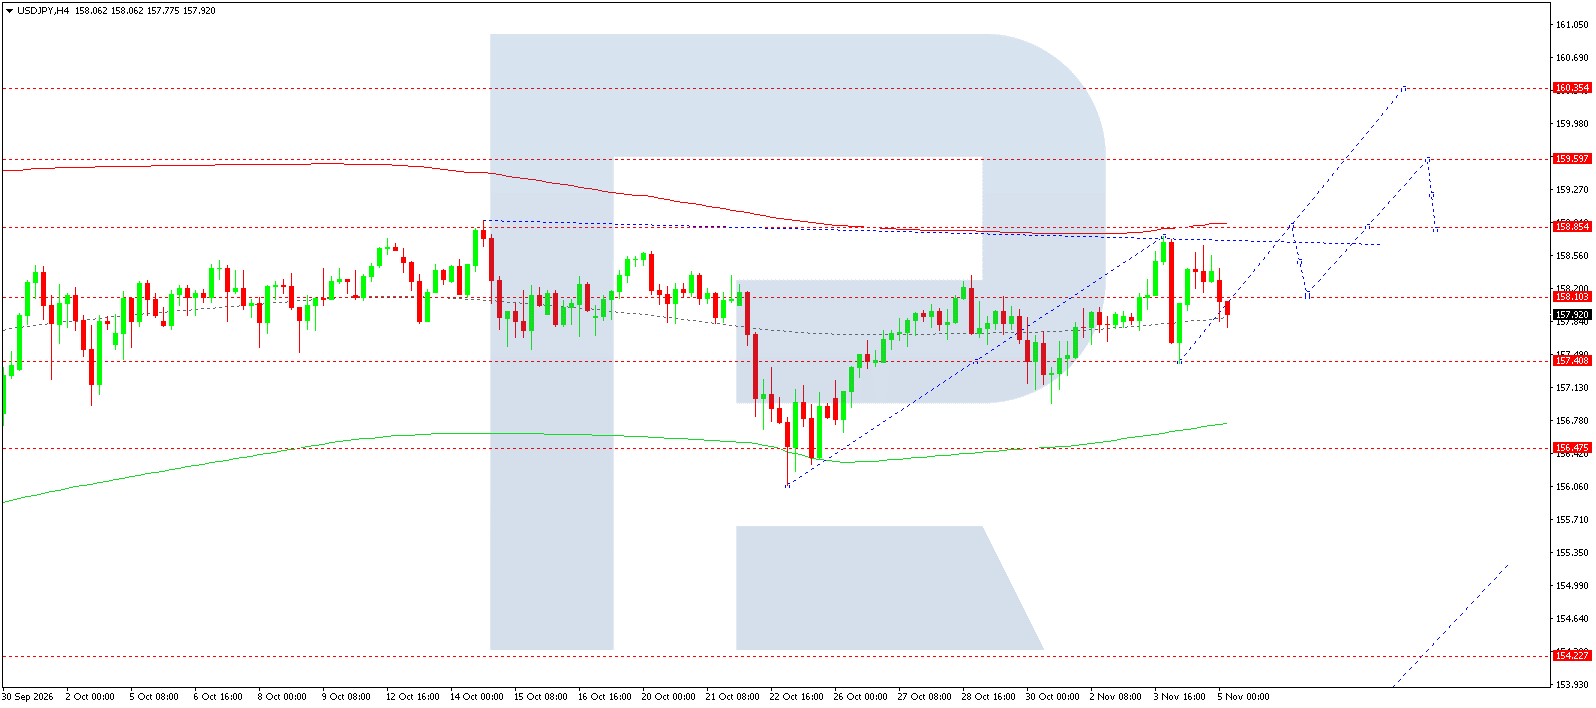
On the USDJPY H4 chart, a complex corrective structure is developing following a decline towards 156.07. Buyers staged a recovery from this low, taking prices to the 158.80 area. The subsequent decline brought the price back towards 158.00, where a descending trendline that previously restricted upward moves is located.
The current price, around 158.19, is above the nearest resistance at 158.09, which could act as support following the breakout. Holding above 157.97 and subsequently consolidating above 158.50 will be important technical conditions for further growth. This would create an opportunity to retest 158.80 and advance towards 159.67.
The wave structure allows for another upward leg after the local correction ends. The chart shows an ascending support line connecting the late-October lows. Holding this line increases the likelihood of a continued recovery.
Conversely, a return below 157.97 would weaken buyers' positions and create conditions for a decline towards 157.38 and 157.14. In the event of a deeper correction, the main target will be 156.07.
The main forecast for the upcoming session envisages a gradual USDJPY recovery after a test of nearby support levels. Buying remains the priority, although an approach towards 159.67 will require particular caution due to the risk of increased volatility.
USDJPY forecast scenario
GBPUSD forecast
Sterling is in the spotlight in the currency market ahead of today's Bank of England interest rate decision. Market participants expect the benchmark rate to rise from 3.75% to 4.00% amid persistent inflationary pressure. UK inflation reached 3.5% in September, significantly exceeding the central bank's target. Rising energy costs and the effects of geopolitical tensions are also creating additional risks for the economy.
Sterling's reaction will depend not only on the decision itself but also on the voting split, updated inflation forecasts, and comments from the Bank of England's leadership. More hawkish rhetoric could support the British currency, while cautious assessments of further tightening could trigger profit-taking following GBPUSD's recent rise. US dollar weakness is providing additional support for buyers.
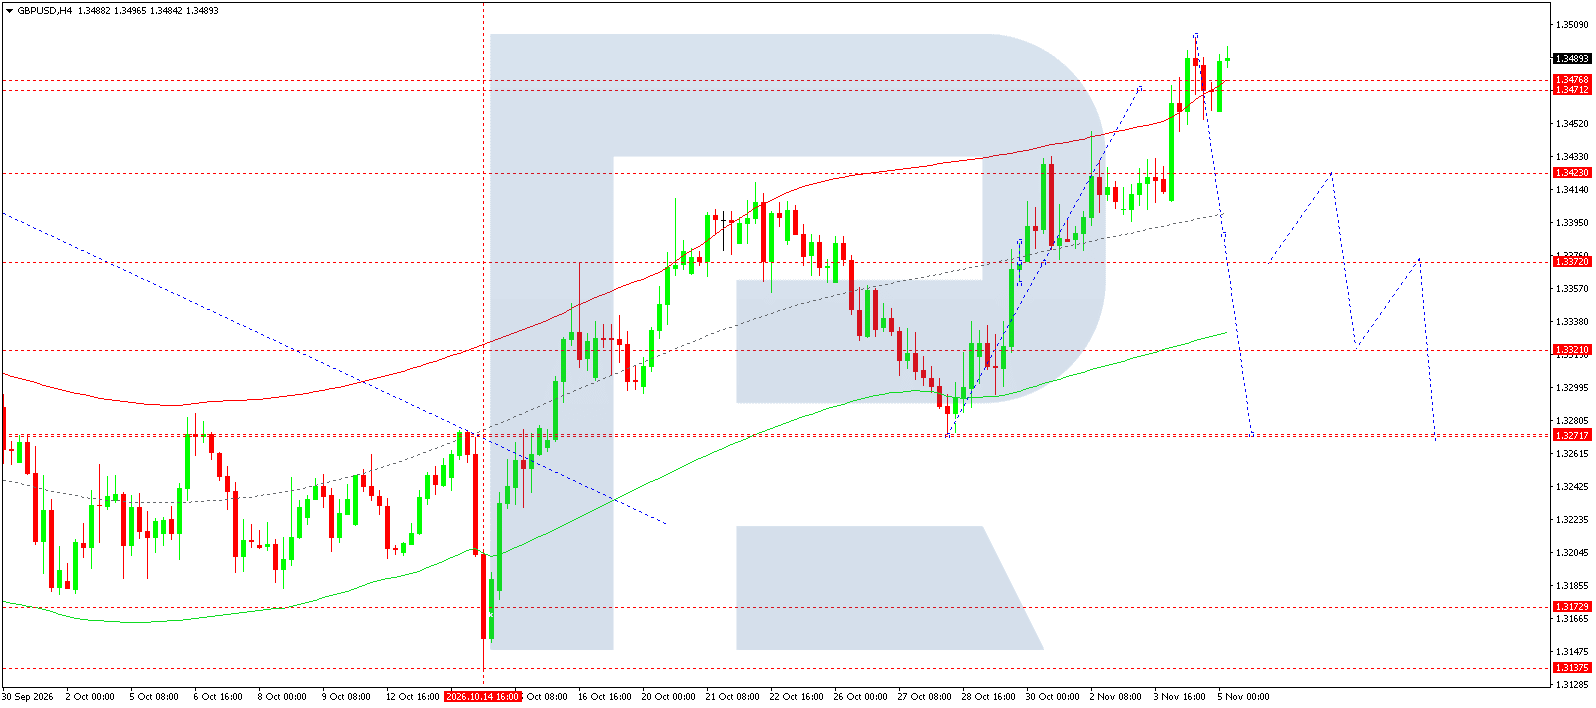
The GBPUSD H4 chart retains an upward structure formed after the reversal from October's low at 1.3140. Successively higher local highs enabled prices to break through resistance at 1.3272, 1.3375, and 1.3440.
The latest upward impulse ended with a test of the 1.3500 area, followed by signs of profit-taking. The current price, around 1.3472, remains above the important 1.3431–1.3440 area, which previously acted as resistance.
According to the Elliott wave count, the upward leg may be nearing completion. The chart shows a local high from which a corrective move towards 1.3440 and then 1.3375 is expected. A deeper correction could take prices to support at 1.3272.
The red moving average runs near 1.3440, adding significance to this area. As long as prices remain above it, the medium-term uptrend remains resilient. The anticipated decline should therefore initially be regarded as a correction rather than a definitive change in market direction.
The main forecast envisages increasing short-term selling pressure after the upward impulse ends. Confirmation will come from a breakout below 1.3431 followed by an H4 candlestick close beneath this level. However, the Bank of England's decision could trigger sharp moves in either direction, making strict trading risk management especially important.
GBPUSD forecast scenario
AUDUSD forecast
The Australian dollar continues to be influenced by the Reserve Bank of Australia decisions, US dollar movements, and the state of the global economy. At its 3 November meeting, the RBA raised its interest rate to 4.85%, reaffirming its priority of combating inflationary pressure. Tighter monetary policy supports the Australian currency, although its impact is partly offset by persistent uncertainty surrounding the outlook for China's economy and global demand for commodities.
US dollar weakness following the US midterm elections creates additional conditions for an AUDUSD recovery. Nevertheless, the pair remains sensitive to changes in investors' risk appetite. Lower energy prices could ease inflationary pressure in the global economy but also reflect changing demand expectations. Upcoming US employment figures could also affect the short-term direction.
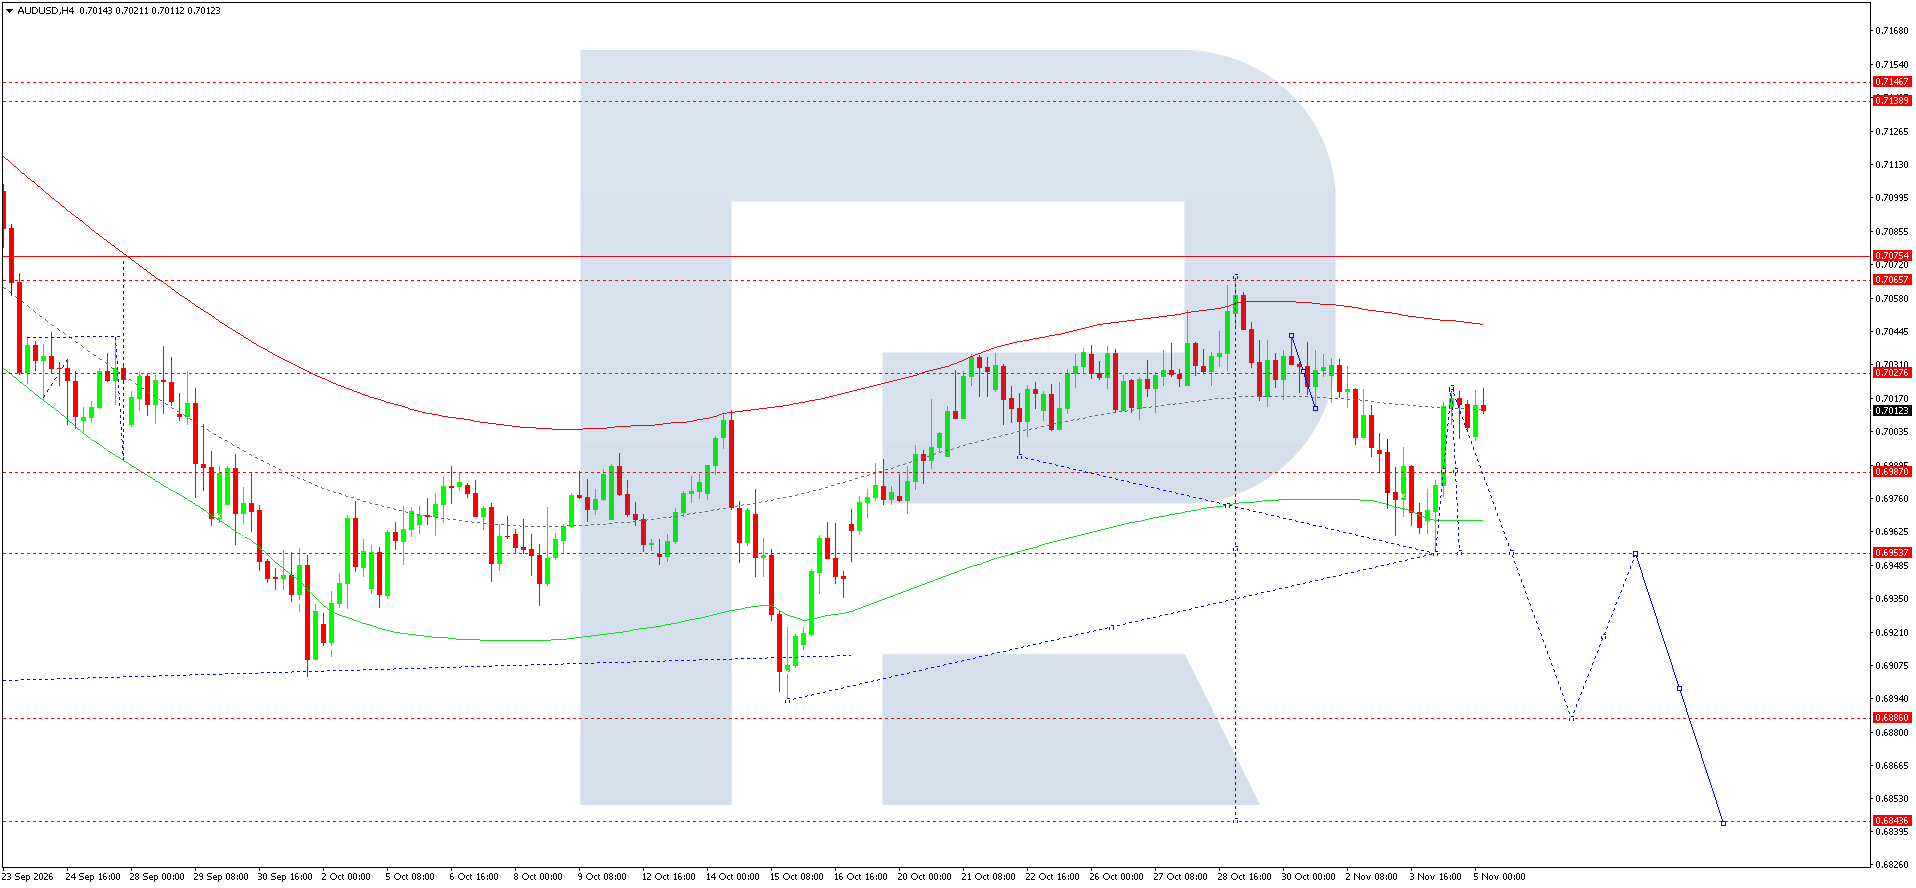
On the AUDUSD H4 chart, a corrective recovery is developing after a decline from the 0.7067 high. The initial downward impulse took prices towards 0.6963, where buyers managed to initiate a reversal. The subsequent rise brought the price back above the psychologically important 0.7000 level.
Prices are currently around 0.7014, between support at 0.7005 and resistance at 0.7028. This area represents a local consolidation range formed after the sharp recovery.
The wave structure indicates that the upward correction could end near 0.7028. The chart outlines a possible subsequent decline towards 0.6941 and, if selling pressure increases, towards 0.6908.
Additional technical resistance is forming near the red moving average, which lies above the current price. Its downward slope indicates continued constraints on sustained upward movement.
The nearest support lies at 0.7005. Consolidation below this level will provide the first confirmation that the downtrend is resuming. The next target is 0.6986, where buyers previously became more active.
The main forecast for the coming day envisages the local recovery ending and AUDUSD gradually declining. A sustained breakout above 0.7028 could change the short-term picture and open the way towards 0.7067, so the main scenario requires confirmation of a reversal.
AUDUSD forecast scenario
USDCAD forecast
The Canadian dollar continues to respond to changes in oil prices, US dollar movements, and the monetary policy outlook for the Bank of Canada. A substantial decline in oil prices following the US midterm elections is putting additional pressure on Canada's currency, given the economy's significant dependence on the energy sector. Meanwhile, US dollar weakness and falling government bond yields are limiting USDCAD's upside potential.
Prospects for global trade and commodity demand remain another source of uncertainty. OPEC+ decisions on oil production volumes could influence investors' expectations for the Canadian economy. Canadian and US employment data are due on Friday and could trigger considerable fluctuations in the pair.
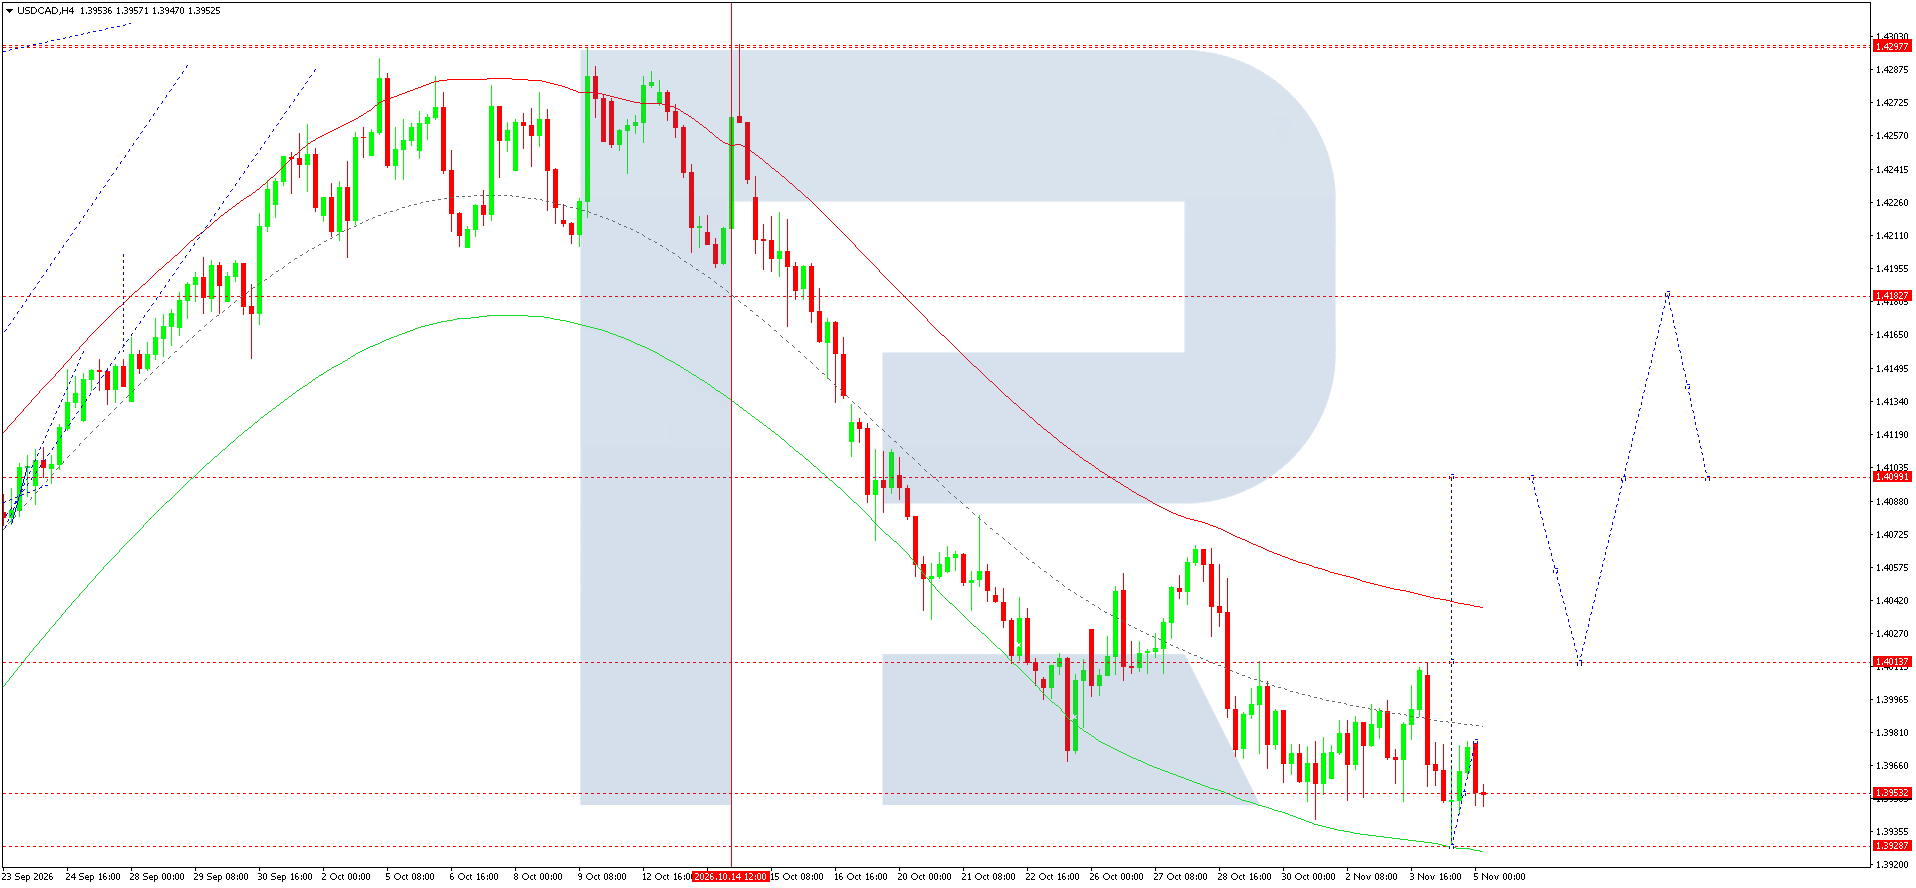
The USDCAD H4 chart retains a pronounced downward trend formed after prices reached an October high around 1.4287. The sustained decline was accompanied by lower highs and lower lows, confirming sellers' dominance.
In late October, prices reached the 1.3941 support level and then attempted a corrective recovery towards 1.4006. However, buyers failed to consolidate above this resistance, leading to another decline.
The current price is around 1.3952, just above horizontal support at 1.3941. This area coincides with the lower boundary of a long-term chart pattern and the green moving average.
According to the Elliott wave count, the latest decline may represent the final leg of the downward impulse. The chart suggests a potential reversal from support at 1.3941, followed by a recovery towards 1.4067. If a broader correction develops, the next reference levels will be 1.4128 and 1.4194.
Confirmation of the bullish scenario requires prices to consolidate above the nearest local resistance at 1.4006. Until then, any upward movement will remain corrective.
Conversely, a breakout below support at 1.3941 would signal a continuation of the downtrend and invalidate the initial recovery signal.
The main forecast for the coming day envisages the formation of a local base around 1.3941 and a gradual upward correction. Buying near support remains the preferred approach, although the prevailing downward structure calls for caution and strict risk limits.
USDCAD forecast scenario
XAUUSD forecast
The gold market is staging a substantial recovery amid US dollar weakness and declining US government bond yields. Following the US midterm elections, investors are reassessing expectations for fiscal and monetary policy. Lower bond yields increase gold's relative appeal as a non-interest-bearing asset.
Changing geopolitical expectations are providing additional support for prices. Falling oil prices are easing concerns about a further acceleration in inflation, potentially reducing the need for the US Federal Reserve to continue raising interest rates for an extended period. Against this backdrop, gold has recovered above the psychologically important 4,000 USD per troy ounce level. Market participants are awaiting Friday's US employment data, which could change the direction of the dollar and precious metals.
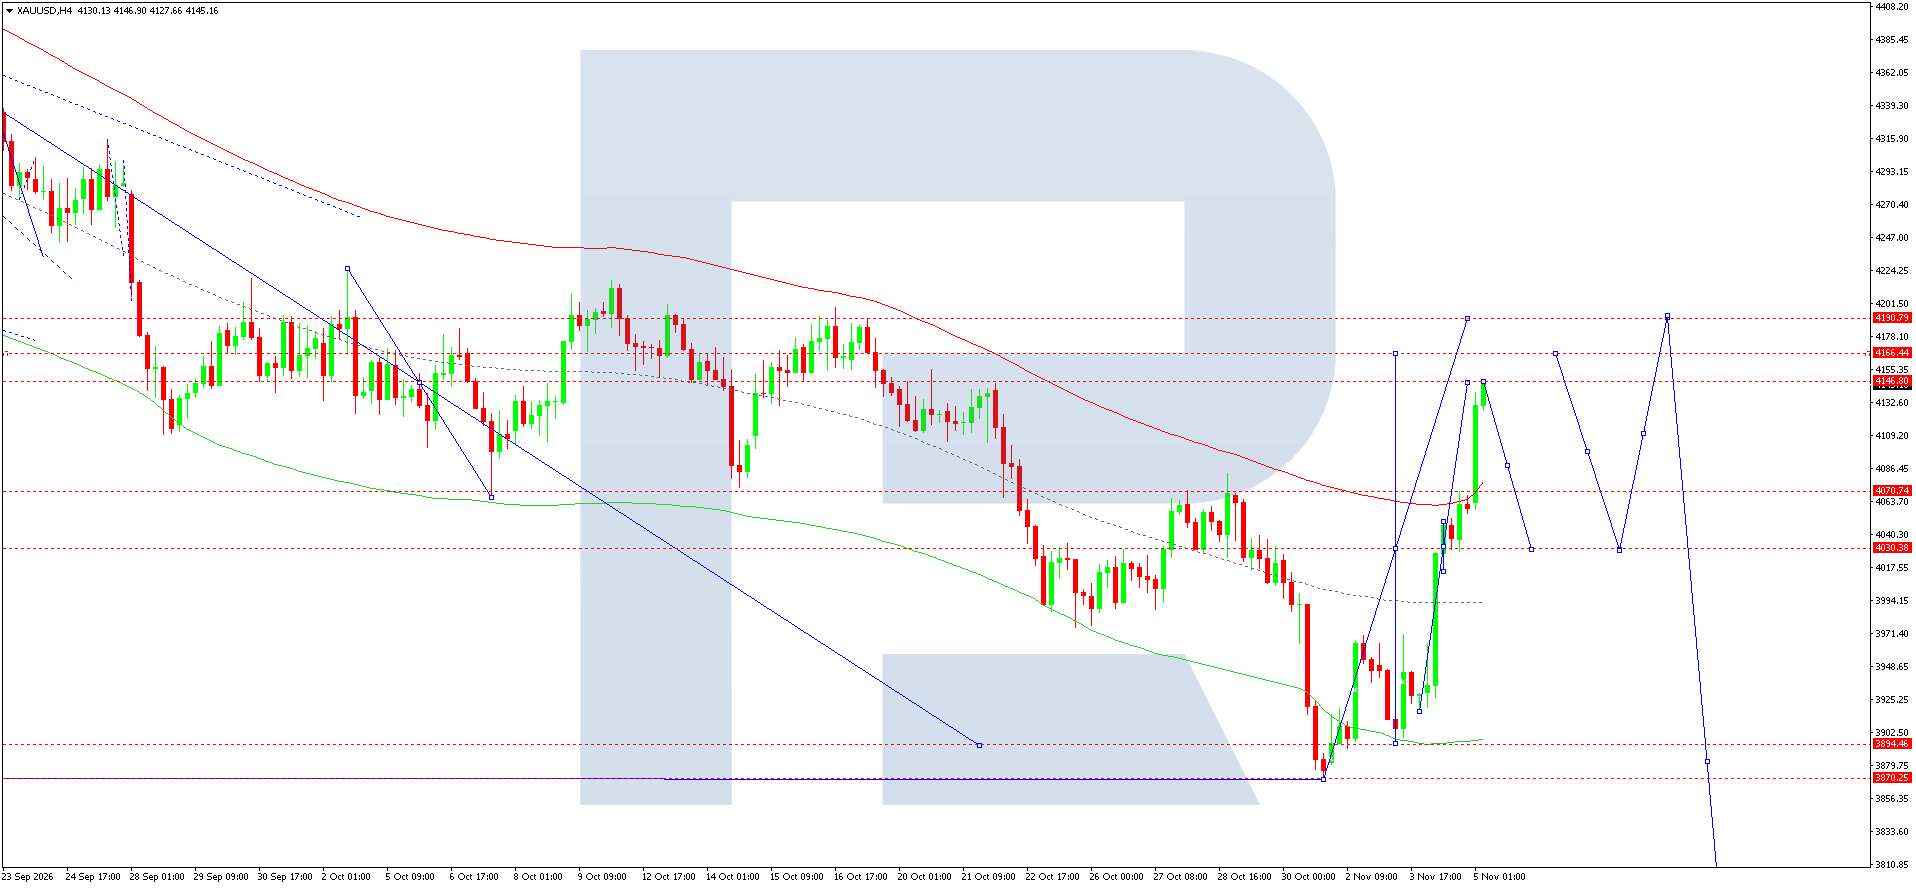
On the XAUUSD H4 chart, a strong upward impulse is forming after prices reached a low of 3,871. This level marked the starting point for a recovery accompanied by successive breakouts above resistance at 3,895, 3,929, 3,989, and 4,031.
As the upward movement accelerated, prices reached the 4,145 area before a minor correction began. Prices are currently hovering around 4,123 and remain above the previously broken descending trendline.
Technically, a significant development was the breakout from the descending channel that had formed in October. A break above the channel's upper boundary points to a possible end to the previous corrective structure.
The Elliott wave count allows for a new upward impulse, initially targeting 4,145 before a further advance towards 4,195. Reaching the latter level would test the recovery's resilience and determine the prospects for a larger move.
The nearest significant support is at 4,031. A return to this area could be regarded as a retest of previously broken resistance from above. The next support lies at 3,989.
The main forecast envisages further gains after the short-term correction ends. As long as prices remain above the broken descending trendline, buyers retain the advantage. However, a return below 4,031 would substantially weaken the positive technical picture and increase the likelihood of a deeper correction.
XAUUSD forecast scenario
US 500 forecast
The US stock market continues to respond to the results of the US midterm elections, changes in government bond yields, and oil price movements. In the previous trading session, the S&P 500 rose by approximately 1.6%. A substantial decline in oil prices provided additional support for equities by easing concerns about inflationary pressure and the prospect of further interest rate increases by the US Federal Reserve.
Positive performance was recorded in the financial sector, consumer companies, and some technology stocks. Nevertheless, uncertainty remains about future fiscal policy, corporate spending, and the sustainability of economic growth. Investors continue to assess the quarterly earnings of major companies and are also awaiting Friday's US labour market figures.
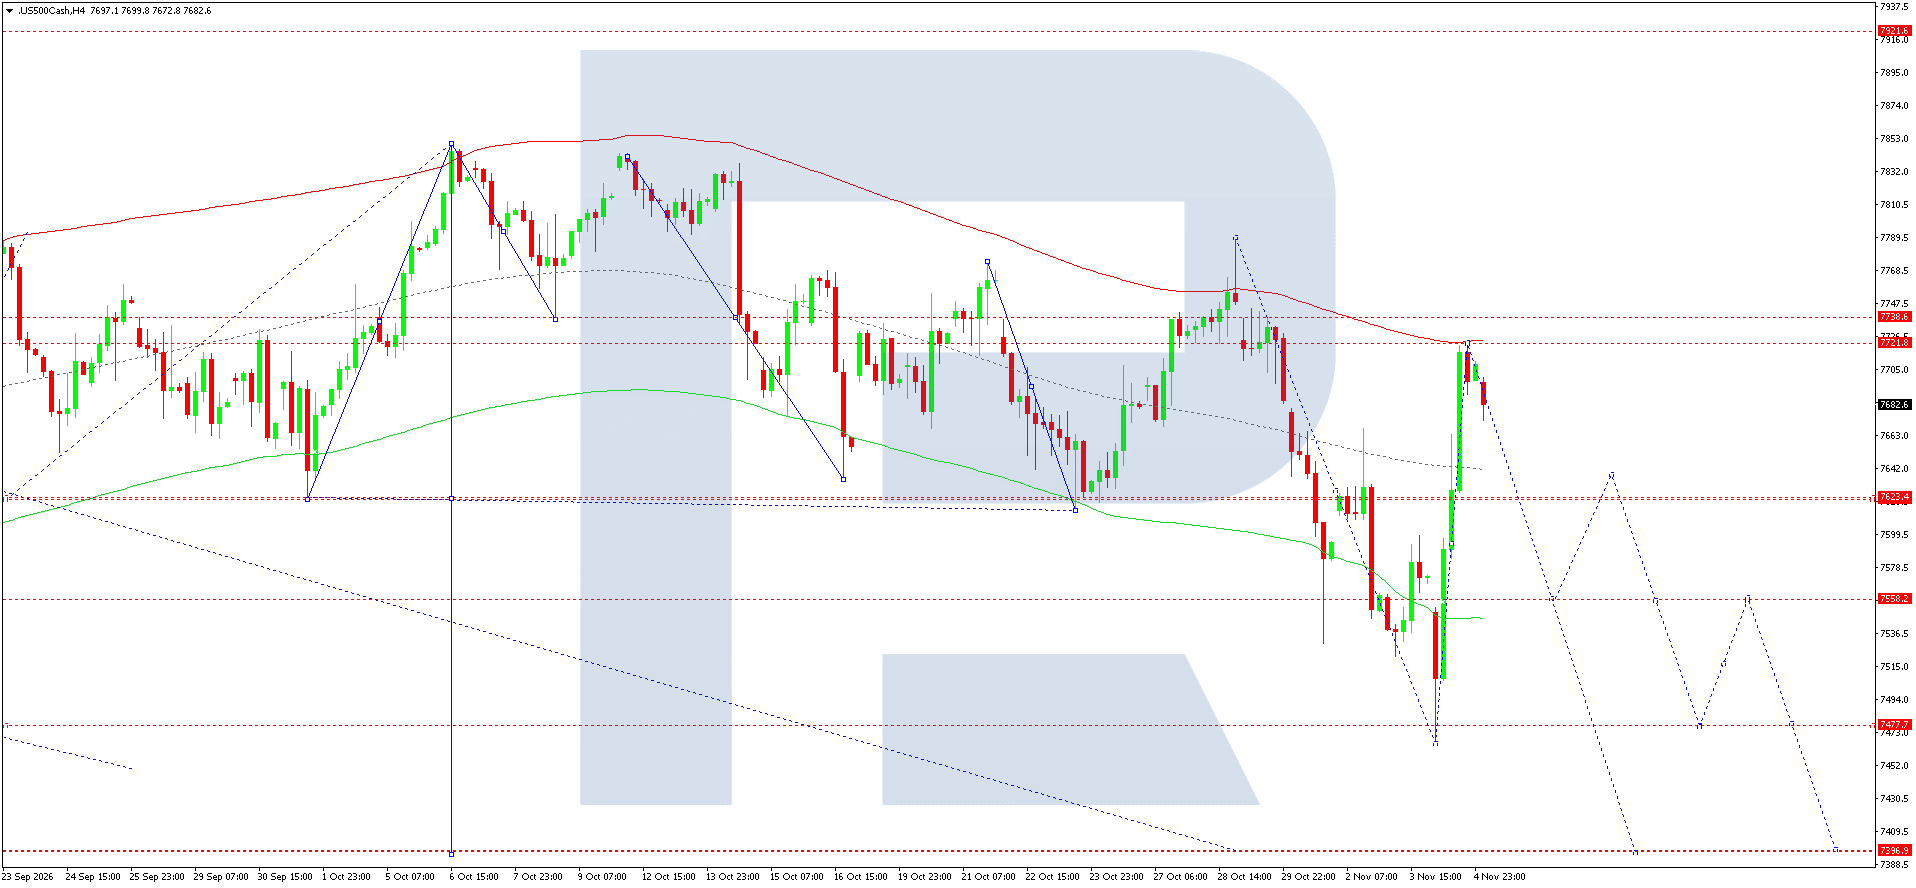
On the US 500 H4 chart, a corrective recovery is developing after a substantial decline from October's highs. The previous downward wave took prices towards 7,454, where a local reversal formed.
The subsequent upward impulse enabled the index to break through resistance at 7,564 and 7,623, reaching the 7,732 area. The price is currently hovering around 7,685, slightly below the red moving average, which continues to restrict further gains.
According to the Elliott wave count, the latest rise may be a corrective leg within a longer-term downward structure. The chart suggests the possibility of another downward impulse once the recovery ends.
The nearest resistance level is at 7,732. Sustained consolidation above this level would open the door for further growth towards 7,787. However, as long as prices remain below this area, renewed selling pressure remains possible.
The initial target of the anticipated decline is the 7,623 support level. A breakout below it would open the way towards 7,564 and then 7,503. If the downward momentum strengthens, the next levels to watch will be 7,454 and 7,392.
The main forecast for the coming day envisages the corrective recovery ending and the index gradually declining. Confirmation requires a reversal pattern to form below resistance at 7,732. However, the continuing positive fundamental backdrop could limit the depth of the correction, so short positions require strict adherence to risk parameters.
US 500 forecast scenario
BTCUSD forecast
The Bitcoin market continues to be influenced by changes in global investor risk appetite, US dollar movements, and liquidity conditions in financial markets. US dollar weakness following the midterm elections creates favourable conditions for a recovery in risk asset prices. Falling government bond yields are another significant factor, encouraging capital to shift towards alternative investment instruments.
At the same time, the cryptocurrency market remains highly sensitive to industry-specific risks. Reports of a major Binance hack in late October heightened concerns about the security of cryptocurrency infrastructure and coincided with a decline in Bitcoin towards 77,000 USD. Consequently, the recovery in prices does not yet signify a definitive return of sustained demand.
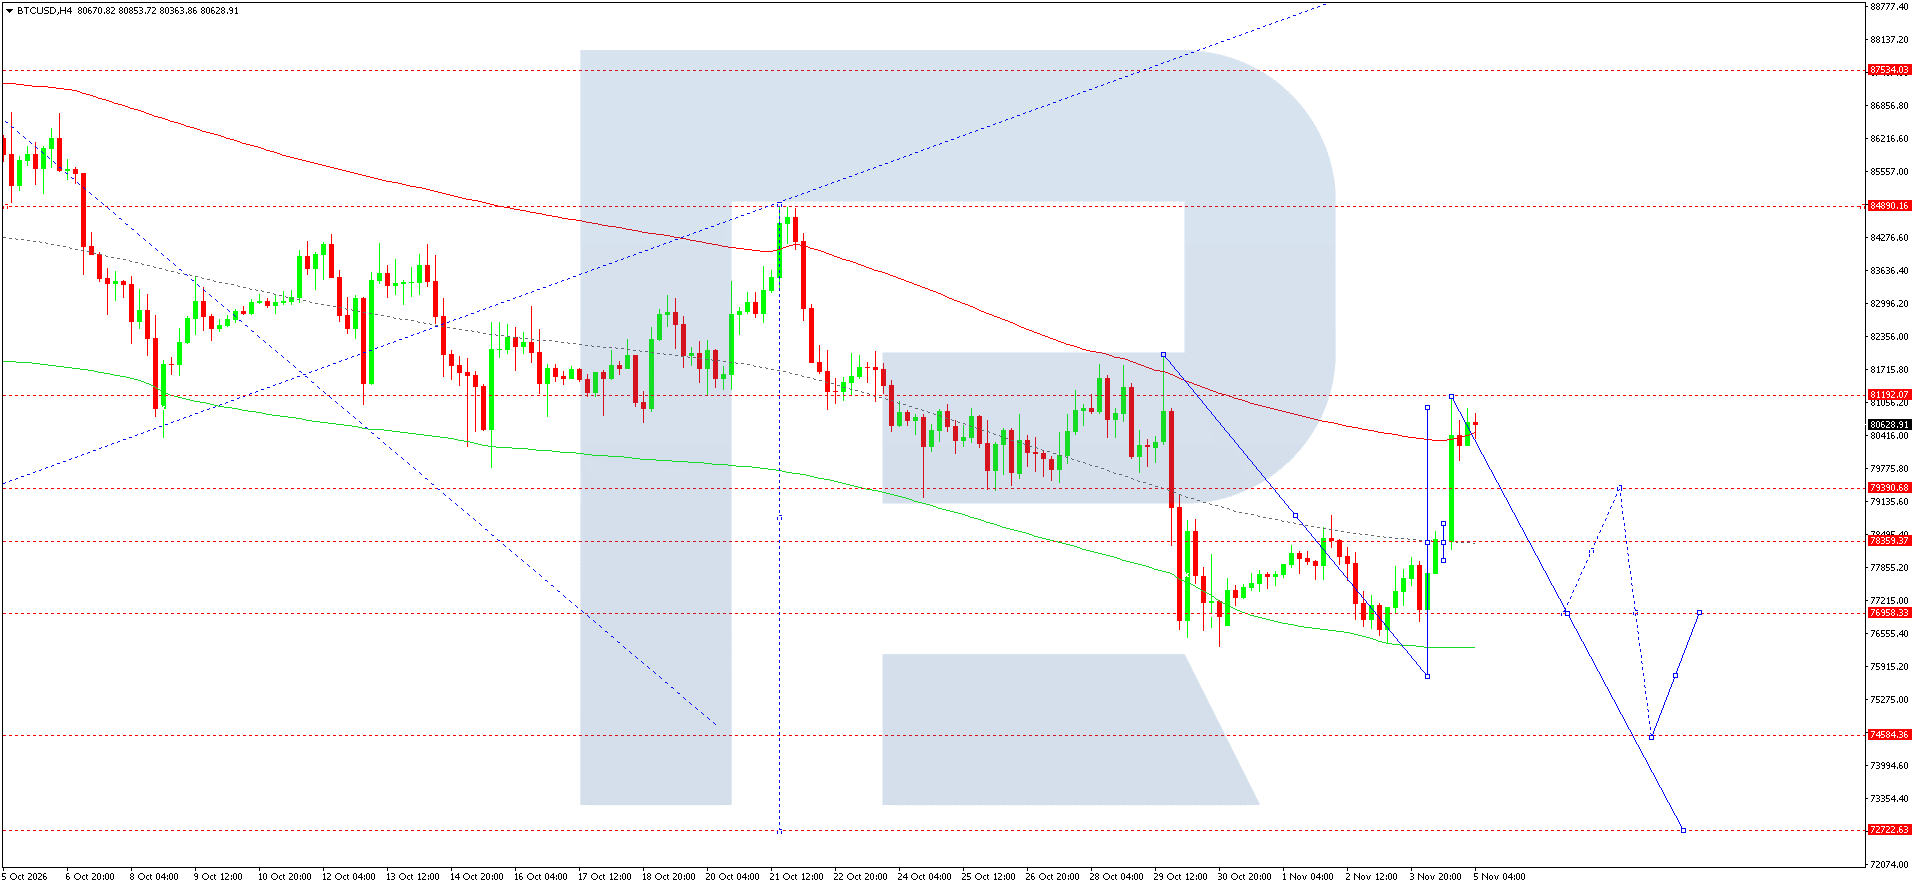
On the BTCUSD H4 chart, a corrective recovery is developing after prices formed a local low around 75,755. The preceding decline featured successive lower lows and a downward price structure.
In early November, buyers staged a recovery from support at 76,346, after which prices broke through resistance at 78,465 and reached the 80,700 area. The subsequent pullback indicates that sellers emerged near the upper boundary of the local corrective range.
The current price is around 80,371, below the nearest significant resistance at 81,895. This level coincides with the descending trendline that limits recovery potential.
According to the Elliott wave count, the latest rise can be viewed as a corrective wave within a broader downward movement. The chart outlines a potential subsequent decline, with interim targets at 78,465 and 76,346.
If the main scenario develops, the next support will be at 75,755. A breakout below this area would pave the way for a move towards 72,860, the main target of the anticipated downward impulse.
An alternative technical signal would be consolidation above 81,895, which would open the way for a continued recovery towards 86,287 and 87,370.
The main forecast for the coming day suggests that the downward movement could gradually resume following a local correction. Selling below 81,895 remains the priority. Confirmation would come from a breakout below the nearest support at 78,465, followed by an H4 candlestick close beneath that level.
BTCUSD forecast scenario
Editors’ picks


EURUSD forecast 2026–2027: technical analysis, price levels & predictions
The EURUSD outlook for 2026 and 2027: key levels on the daily chart, three trading scenarios and the policy gap between the Fed and the ECB that drives the pair.

Gold (XAUUSD) forecast 2026: technical analysis, price levels & predictions
Where gold could trade in 2026: key levels, three trading scenarios with entry triggers and the forecasts from J.P. Morgan, Deutsche Bank and Goldman Sachs.
Forecasts presented in this section only reflect the author’s private opinion and should not be considered as guidance for trading. RoboForex bears no responsibility for trading results based on trading recommendations described in these analytical reviews.