
Daily technical analysis and forecast for 6 November 2026
Daily technical analysis and forecast for EURUSD, USDJPY, GBPUSD, AUDUSD, USDCAD, XAUUSD, US 500, and BTCUSD for 6 November 2026.
Each scenario on this page reflects the market structure on the H4 chart as of 10:00 AM UTC+3 on 6 November 2026. The assessment considers the current H4 chart structure, key support and resistance levels, the direction of the medium-term movement, and the prevailing fundamental backdrop.
EURUSD forecast
By the morning of 6 November, the fundamental backdrop for the euro is being shaped by interest rate differentials and the consequences of the energy shock. On 28 October, the US Federal Reserve kept its interest rate range at 3.75–4.00%. On 29 October, the European Central Bank left its deposit rate at 2.50%. The US dollar retains its interest rate advantage, but this alone does not guarantee a decline in the pair. The ECB notes that high energy costs both increase inflation risks and constrain economic growth, complicating its future policy choices.
The main event of today's session will be the US employment report for October. Its results were not yet known at the time of the morning assessment. Sustained job growth and strong wage increases could support the dollar by reinforcing expectations that tight financial conditions will persist. Weak figures, by contrast, would create conditions for a euro recovery. Following the sell-off in US equities, demand for liquidity is also important: an increase in such demand could limit purchases of the European currency even if bond yields decline.
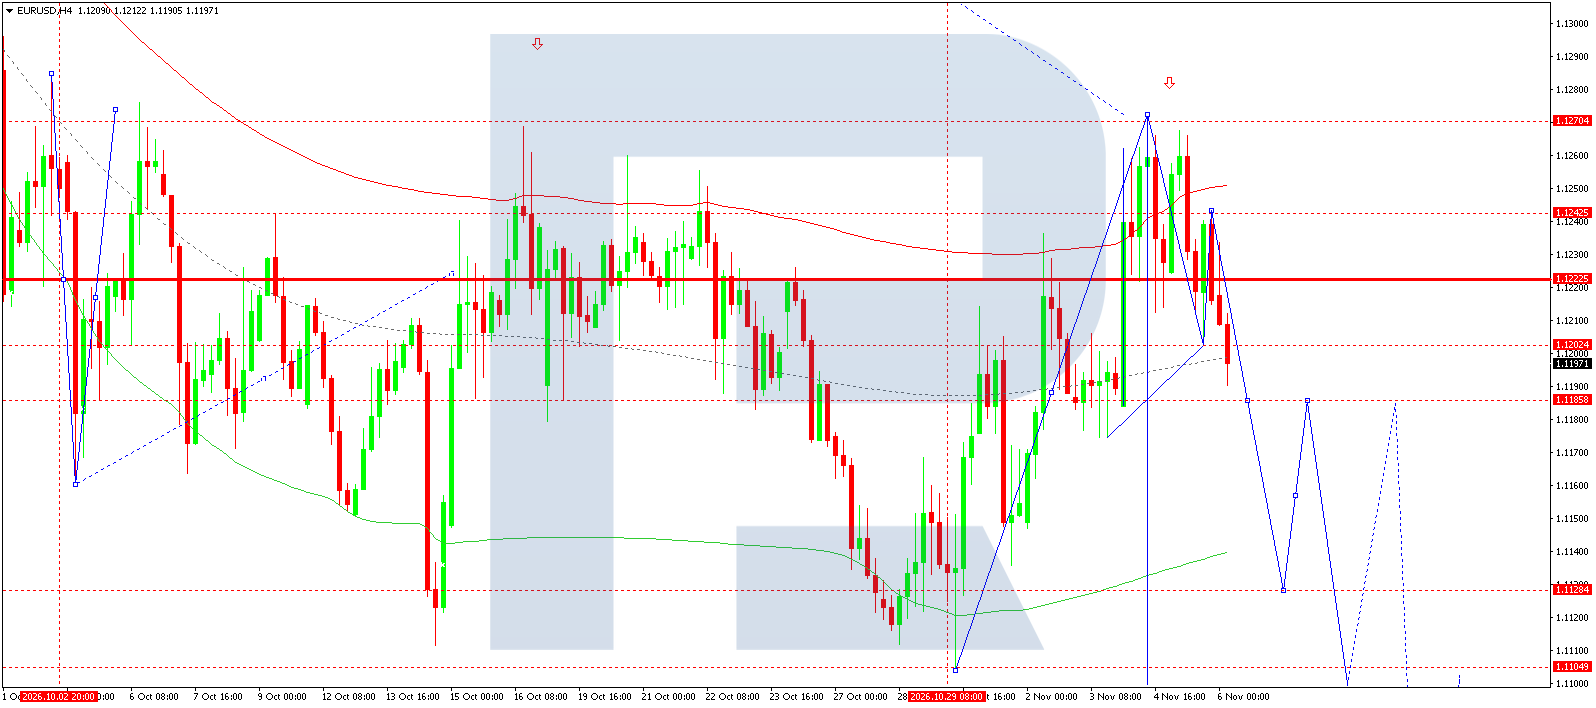
On the H4 chart, the latest price is 1.1197. After a rise towards 1.1270, buyers lost the initiative, and the return below 1.1222 indicates weakening upward momentum. The nearest support level is at 1.1186. A decisive breakout below it would create conditions for a move towards 1.1128. The 1.1177 level can serve as additional confirmation that the decline is continuing, although it is not marked as a separate horizontal boundary on the chart. Resistance levels are at 1.1202, 1.1222, and 1.1243.
The main scenario for the day envisages selling after weakness below 1.1202 is confirmed, with an initial target at 1.1186 and a subsequent target at 1.1128. A return above 1.1222 would weaken this scenario and require the structure to be reassessed. The 1.1105 and 1.1050 levels relate to a continuation of the move beyond the nearest intraday target. The blue trajectory on the chart represents a conditional wave sequence, not a route the price must follow.
The Elliott wave interpretation is consistent with selling pressure, but price behaviour around the indicated support levels remains the independent confirmation. As long as the pair remains below this area, recovery moves should reasonably be viewed as corrective. The choice of direction following the US data should take account of candlestick closes and the resilience of subsequent retests of broken levels.
EURUSD forecast scenario
USDJPY forecast
The fundamental picture for USDJPY remains mixed. At its October meeting, the Bank of Japan kept its short-term interest rate at around 1.25%, while the Fed's rate is in the 3.75–4.00% range. The yield differential still favours the dollar, although that support may weaken if US bond yields decline. Expectations of further normalisation of Japanese monetary policy and changes in demand for safe-haven assets are significant factors for the yen. The interest rate differential should therefore be assessed alongside overall financial market conditions.
Following the sharp sell-off in US equities, positions financed with low-cost yen are increasingly likely to be reduced. This process could support the Japanese currency even if the dollar simultaneously strengthens against other currencies. The day's main scheduled event is the US employment report. Strong figures could revive demand for the dollar through rising yields, while weak data would strengthen the case for a decline in the pair. Directional impulses ahead of the release require confirmation, as moves within the range may reflect position adjustments rather than the emergence of a sustained trend.
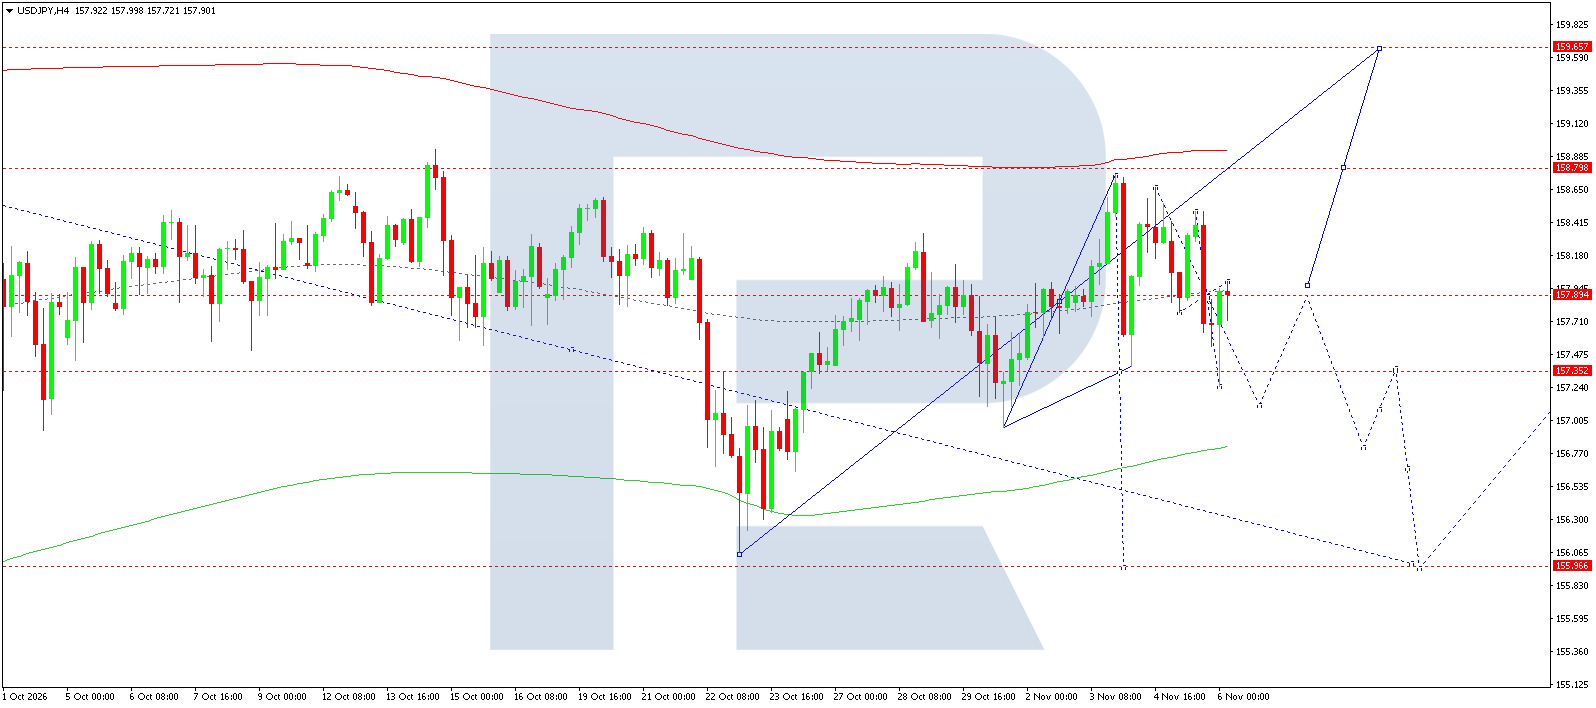
On the H4 chart, the current price is around 157.90. The recent rise stalled in the 158.80 area, followed by a series of sharp fluctuations and a return to the central area at 157.89. The upper boundary of the Price Envelope lies above the market, while its lower boundary runs near 156.80. The nearest horizontal support is marked at 157.35, with the next significant level at 155.97. The chart markings suggest both a continued downward correction and a recovery towards 158.80 after a breakout from the current range.
For the upcoming session, a conditional Sell scenario is preferred if prices remain below 158.00 and subsequently break below 157.35. The nearest target is around 156.80; the 155.97 level would only become relevant if a stronger downward impulse develops. Consolidation above 158.45 would weaken the short-term bearish structure. A return above 158.80 would shift attention to 159.66. The previously proposed unconditional forecast of growth therefore needs to be revised: the current configuration does not confirm a move towards the upper targets without first overcoming resistance and restoring a sequence of higher lows. When assessing breakouts, it is important to distinguish a brief touch of a level from sustained consolidation beyond it: volatility ahead of the US data could generate false signals and rapid returns into the range.
USDJPY forecast scenario
GBPUSD forecast
For sterling, the key event was the Bank of England's (BoE) decision on 5 November to raise its interest rate by 0.25 percentage points to 4.00%. The regulator attributes the need for tightening to the pass-through of high energy costs to consumer prices. Inflation has reached 3.5%, with its expected peak of around 5% occurring in mid-2027. These circumstances support sterling's interest rate appeal while simultaneously increasing risks to domestic demand, lending, and UK economic growth.
The BoE's decision cannot automatically be interpreted as a signal of further currency appreciation. If the increase was already priced in, subsequent movements will depend on expectations for the next policy step and the bond market's reaction. News concerning the Middle East conflict and energy costs remains important. The US employment report due today could change assessments of the Fed's outlook. Strong figures would support the dollar side of the pair, while cooling employment would create conditions for a sterling rebound. The morning forecast does not assume the results of the release are known in advance.
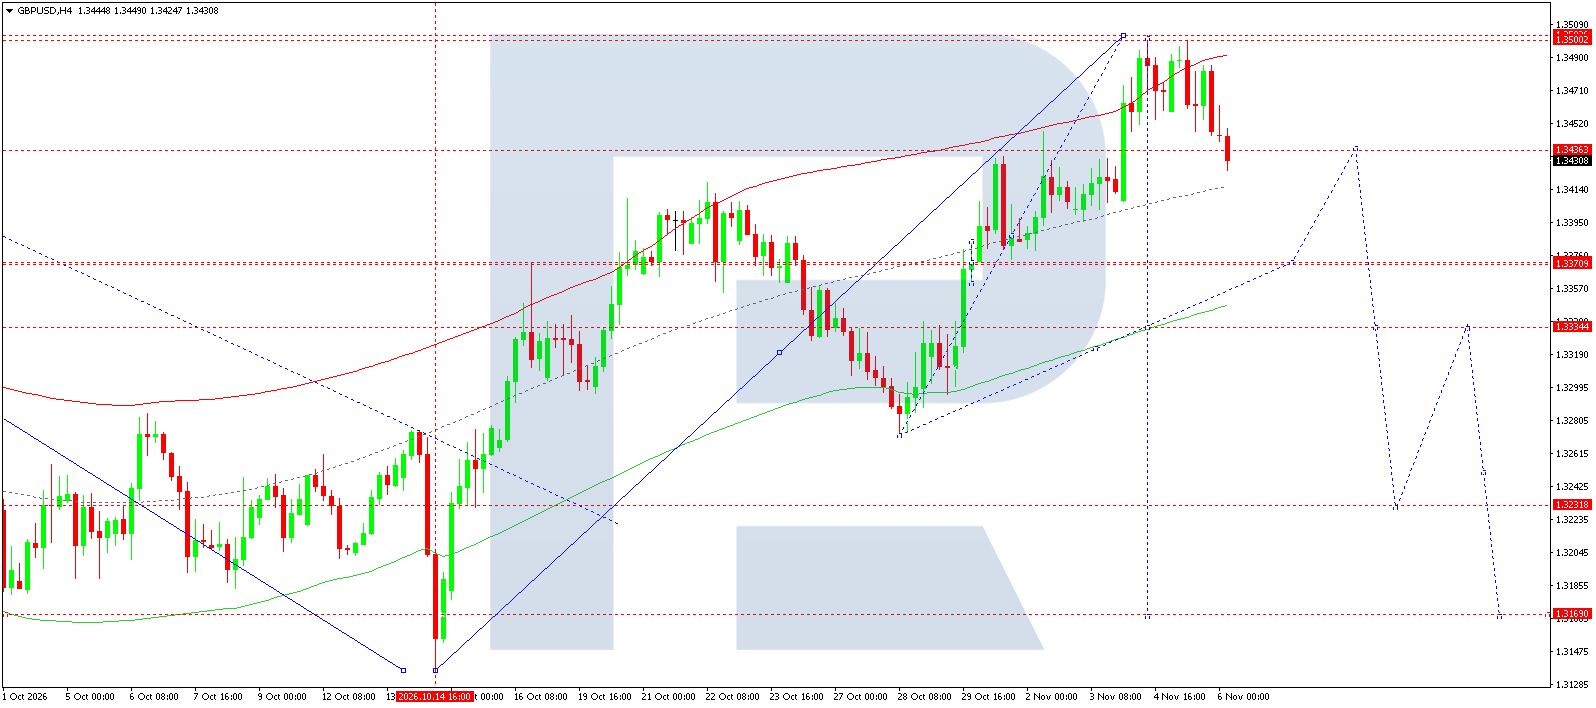
On the H4 chart, the latest price is 1.3431. After a rise towards the 1.3500–1.3502 area, the market reversed downwards and moved below the nearest horizontal level at 1.3436. At the same time, the middle and lower lines of the Price Envelope retain an upward slope. The current decline is therefore more accurately characterised as a correction of the preceding rise, rather than a definitively confirmed reversal of the entire uptrend. The nearest targets for sellers are at 1.3371 and 1.3334, followed by support levels at 1.3232 and 1.3169.
The main scenario for the day envisages a continued correction if prices fail to consolidate above 1.3436. Selling is considered after a break below the nearest local low, targeting 1.3334 with an interim reaction around 1.3371. The protective level is placed above the area of a short-term return of buyers. Consolidation above 1.3455 would invalidate the chosen entry strategy, although resistance at 1.3502 would remain significant.
The deeper targets at 1.3232 and 1.3169 require separate confirmation and may be reached later.
GBPUSD forecast scenario
AUDUSD forecast
On 3 November, the Reserve Bank of Australia raised its policy rate by 25 basis points to 4.85%. The decision came amid persistent inflationary pressure, with annual consumer price growth for September at 4.3%. In its November forecast, the RBA indicated that inflation would take longer to return to its target range than previously expected. High interest rates provide interest rate support for the Australian dollar, but also constrain lending, the housing market, and prospects for domestic demand.
For the current session, this factor needs to be weighed against deteriorating global risk appetite. The Australian currency is sensitive to revisions in global growth and commodity demand expectations, so a rate rise does not preclude depreciation if investors reduce risky positions. Energy-related uncertainty complicates assessments of inflation and terms of trade. US employment data are due. Resilient figures could support the dollar, while weak data could trigger an AUDUSD recovery. Technical rebounds are possible after an impulsive move ahead of the report, but they do not in themselves indicate a change of direction.
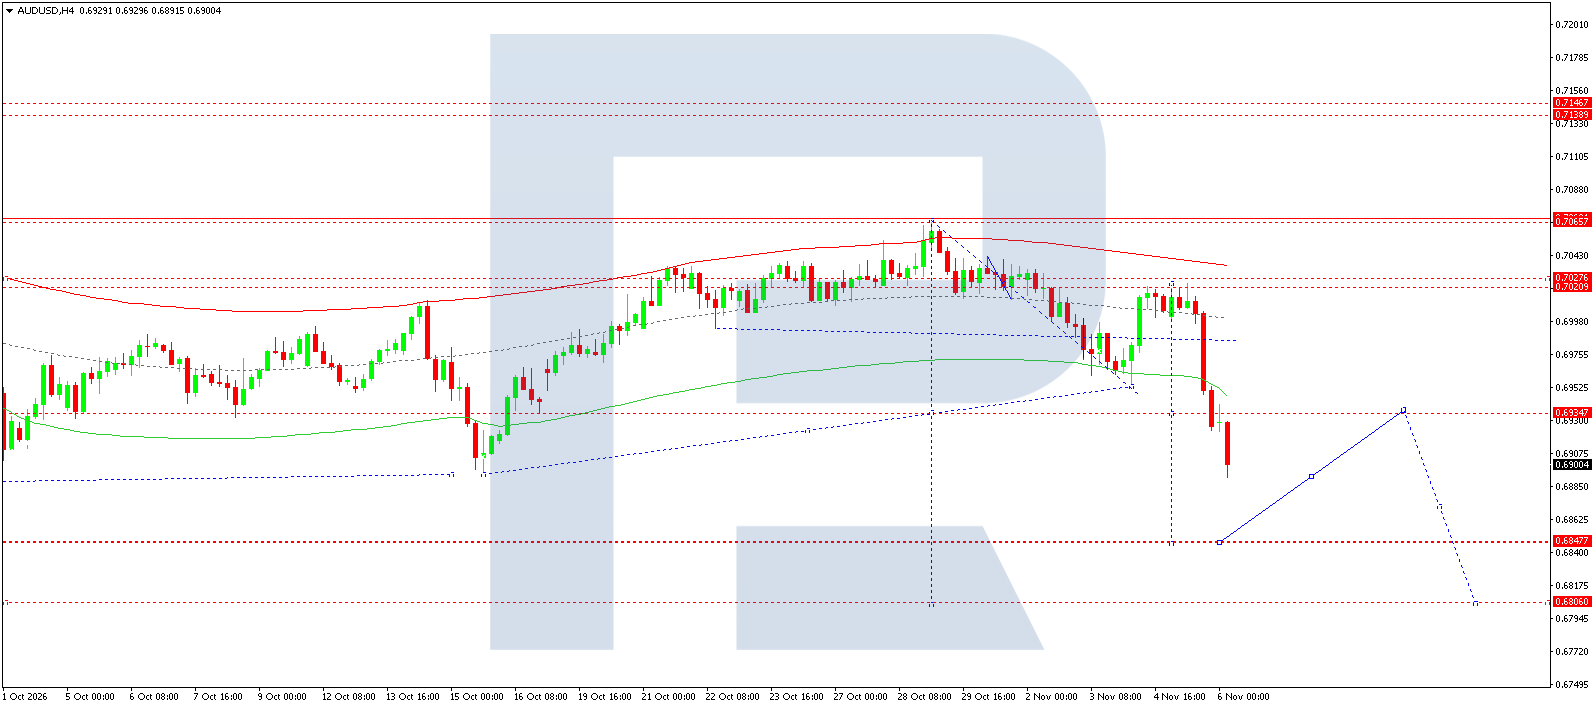
On the H4 chart, the price is 0.6900. After an unsuccessful attempt to consolidate above 0.7020–0.7028, the market's decline accelerated, breaking below the lower Price Envelope line and support at 0.6935. A breakout below the ascending line connecting the previous lows further indicates a deterioration in the structure. The nearest target for sellers is 0.6848, with the next horizontal support at 0.6806. The 0.6935 area now acts as the nearest resistance, while the 0.6967 area could become a target only in the event of a deeper recovery.
The main scenario for the day suggests a continued decline while prices remain below 0.6935. A conditional Sell entry is slightly below the current price and requires confirmation of another downward impulse. The protective level is placed above the broken support, and the first target is 0.6848. Once it is reached, a return to 0.6935 is possible, as shown by the original chart markings.
A move towards 0.6806 is regarded as the next stage, rather than an inevitable outcome of a single session. A decisive recovery above 0.6935 would weaken the selling scenario and increase the likelihood of a correction towards the middle of the Price Envelope. Ahead of the US release, it is important to assess breakout quality: a rapid return above support would raise the probability of a false signal and temporary price stabilisation within the range.
AUDUSD forecast scenario
USDCAD forecast
On 28 October, the Bank of Canada raised its policy rate by 25 basis points to 2.50%. With the Fed's rate range at 3.75–4.00%, the US dollar retains an interest rate advantage, although the BoC's latest decision has narrowed the gap somewhat. Oil price movements are also important for the Canadian currency: changes in export revenues affect the terms of trade and economic growth expectations. The direction of USDCAD therefore cannot be inferred solely from a comparison of the two countries' interest rates.
Attention today is focused on the US and Canadian employment reports. Their simultaneous release increases the importance of the relative strength of the figures. A resilient US labour market combined with weak Canadian data could support a rise in the pair; the opposite combination would create conditions for a decline. The actual results are not known before publication. Oil price fluctuations against the backdrop of the Middle East conflict remain an additional source of uncertainty. Rising commodity prices may support the Canadian dollar, although pronounced risk aversion could cause that effect to be outweighed by demand for US dollar liquidity. A confirmed price reaction is more important to the morning scenario than assumptions about the direction of the news.
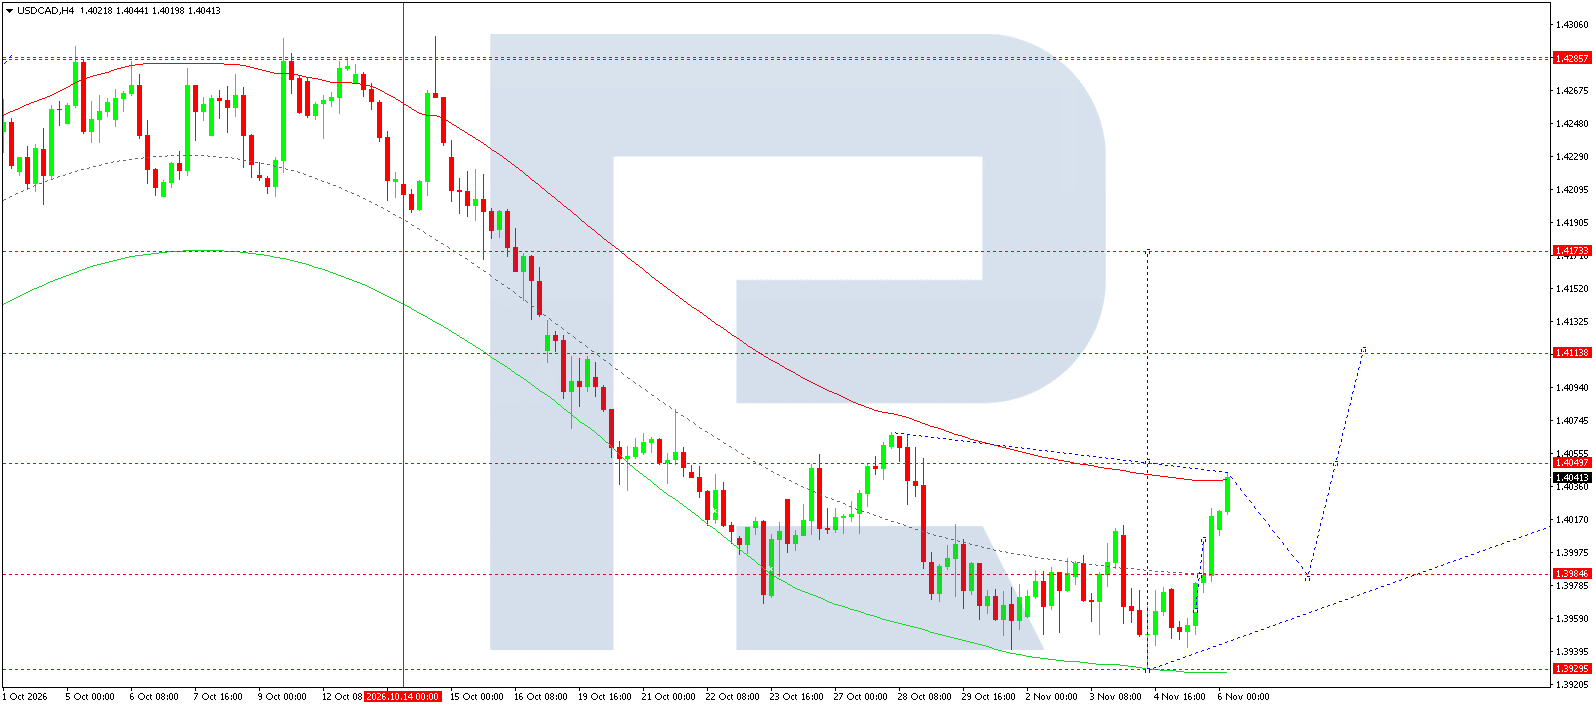
On the H4 chart, the latest price is 1.4041. An upward impulse is developing from a low around 1.3930 and has approached the upper Price Envelope line and resistance at 1.4050. However, the overall slope of the Envelope remains downward: the current rise is still a correction within a more prolonged decline. The nearest support is at 1.3985, with the key lower reference level at 1.3930. If 1.4050 is overcome, the next target is 1.4113, followed by resistance at 1.4173.
For the upcoming session, a conditional Buy scenario is preferred, provided that bullish momentum continues and prices subsequently consolidate above 1.4050. The protective level limits the risk of a return into the latest upward leg, while the target is 1.4113. A failure to break above resistance could lead to a pullback towards 1.3985, making purchases without confirmation of strength vulnerable.
A return below the protective level would invalidate the specific trading strategy. The more distant target at 1.4173 becomes relevant only after the price has overcome the 1.4113 level. The blue trajectory allows for an interim correction, so a straight-line rise is not a requirement for the overall recovery scenario to materialise. Execution during sharp news-driven fluctuations may differ from the calculated parameters.
USDCAD forecast scenario
XAUUSD forecast
The morning fundamental backdrop for gold is shaped by a combination of interest rate expectations, geopolitics, and investors' need for liquidity. The Fed has kept its rate in the 3.75–4.00% range, so the cost of holding a non-interest-bearing asset remains a significant constraint. However, a high nominal rate does not automatically determine direction: real yields, inflation expectations, and dollar movements matter for gold. The energy-related consequences of the Middle East conflict simultaneously reinforce inflation concerns and generate demand for safe-haven instruments.
The sharp sell-off in US equities is adding to uncertainty. During periods of risk reduction, gold may attract safe-haven demand, but the need to cover losses and meet margin requirements can also lead to selling of the metal. Falling equity indices therefore do not guarantee that gold will rise. The day's main scheduled event remains the US employment report. Strong figures could lift yields and support the dollar, worsening conditions for gold. Weak data could have the opposite effect.
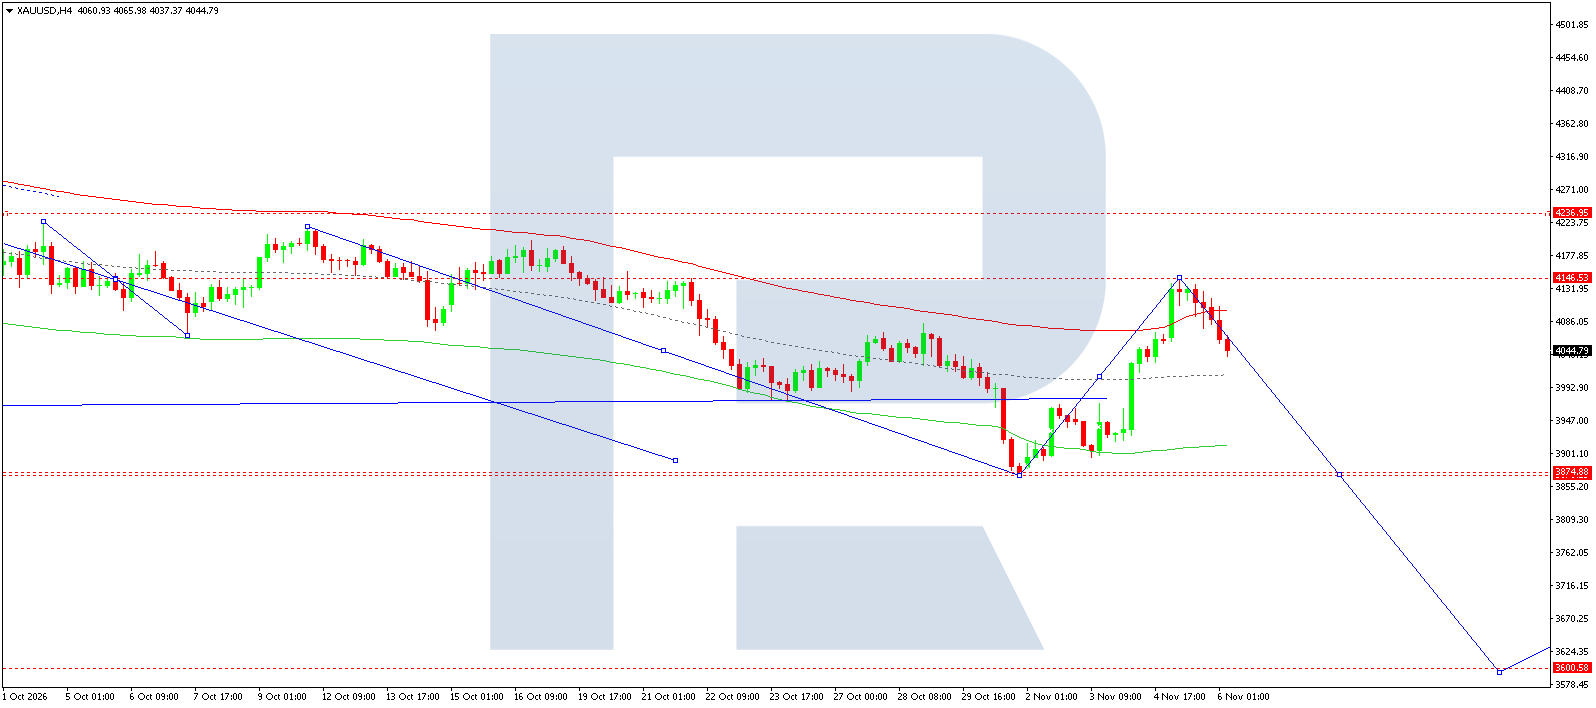
On the H4 chart, the latest price is 4,045. The recovery from the 3,875 area ended with a test of resistance at 4,147, after which prices reversed downwards and returned below the upper Price Envelope line. The Envelope's overall slope remains downward, maintaining sellers' advantage over the period under review. The nearest area where a reaction may occur is around 4,000, with a horizontal zone near 3,980 below it. The next significant support is around 3,875. The 3,601 level relates to a further development of the downward structure.
The main scenario for the day envisages a continued decline as long as prices remain below 4,100 and do not make a sustained return to 4,147. A conditional Sell entry is considered after selling pressure below current prices is confirmed. The nearest targets are 4,000 and 3,980; reaching the 3,875 target would require the impulse to persist and could take several sessions.
A recovery above 4,100 would invalidate the selected short-term strategy. An upward breakout through 4,147 would require the entire bearish interpretation to be reassessed. The marked move towards 3,601 is an extended projection, not a justified mandatory target for today. The continued downward slope of the Price Envelope reinforces this preference but does not rule out sharp upward corrections.
XAUUSD forecast scenario
US 500 forecast
The US stock market is approaching the start of Friday's session following a sharp deterioration in sentiment. On 5 November, the S&P 500 fell by 4.4%, led by companies involved in building artificial intelligence infrastructure. This suggests investors are reassessing their willingness to pay high valuations for future growth. For the US 500, it means greater sensitivity to corporate forecasts, financing conditions, and further position reductions in the market's most popular segments.
The Fed's rate remains within the 3.75–4.00% range, while inflation uncertainty limits confidence in rapid policy easing. The US employment report is due today. Excessively strong figures could heighten concerns about the cost of capital, while a pronounced deterioration in employment might raise concerns about future earnings. Equity market reactions will therefore depend on the combination of employment, wages, and bond yields. Energy price volatility adds risks to corporate costs. The data results were not known at the time of the morning assessment, and a recovery following the sell-off should be judged by the sustainability of demand, not merely the size of the initial rebound.
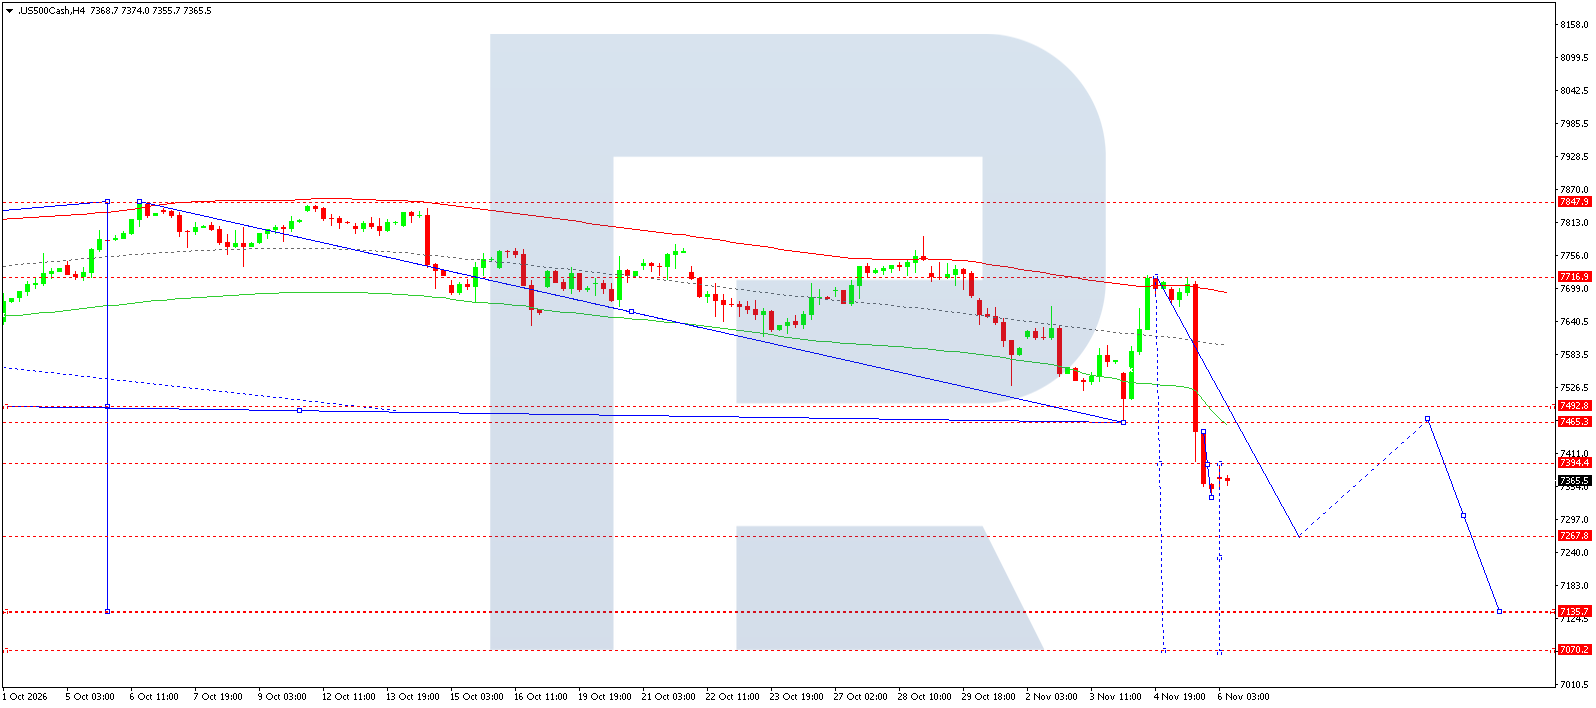
On the H4 chart, the instrument's latest price is 7,366. This figure refers to the broker's instrument shown and should not automatically be equated with the official cash index level. Prices fell sharply from 7,717, broke below the lower Price Envelope line, and moved beneath the horizontal level at 7,394. The sequence of lower highs supports the bearish interpretation. The nearest support is at 7,268, followed by 7,136 and 7,070. Resistance levels for a possible recovery are at 7,394 and in the 7,465–7,493 area.
The main scenario for the day envisages continued pressure while prices remain below 7,394. Selling is considered after another break below a local low is confirmed, with the nearest target at 7,268. The protective level is located above the current consolidation area. If the market recovers above 7,405, the chosen strategy will no longer be valid, and a correction towards 7,465–7,493 will become more likely. A further decline towards 7,136 and 7,070 requires separate confirmation following a breakout below 7,268. The wave projection allows for an interim rebound, so the sequence of targets should not be treated as a guaranteed route within a single trading session. Stabilisation above support would reduce the likelihood of an immediate continuation of the decline.
US 500 forecast scenario
BTCUSD forecast
By the morning of 6 November, Bitcoin's fundamental backdrop remains closely tied to global risk appetite and the availability of US dollar liquidity. US equities suffered a sharp sell-off the previous day, particularly in the technology sector. This creates an unfavourable external environment for cryptocurrencies, as reductions in risky positions can spread across asset classes. However, movements in the same direction do not establish a permanent causal relationship, and crypto-specific flows may either amplify or mitigate the influence of equity market performance.
The Fed's decision to keep its rate in the 3.75–4.00% range maintains the importance of financing costs. Today's US employment report could change expectations about future policy. Strong figures could bolster the dollar and limit a recovery in risky assets; weak data could support expectations of easing, although a marked deterioration in the economy would also pose a risk to demand. The materials used do not contain sufficient reliable information about today's exchange-traded fund flows or the scale of liquidations, so it would be inappropriate to explain the move using specific figures for such flows. The morning forecast is based on the broader macroeconomic backdrop and the observable price structure.
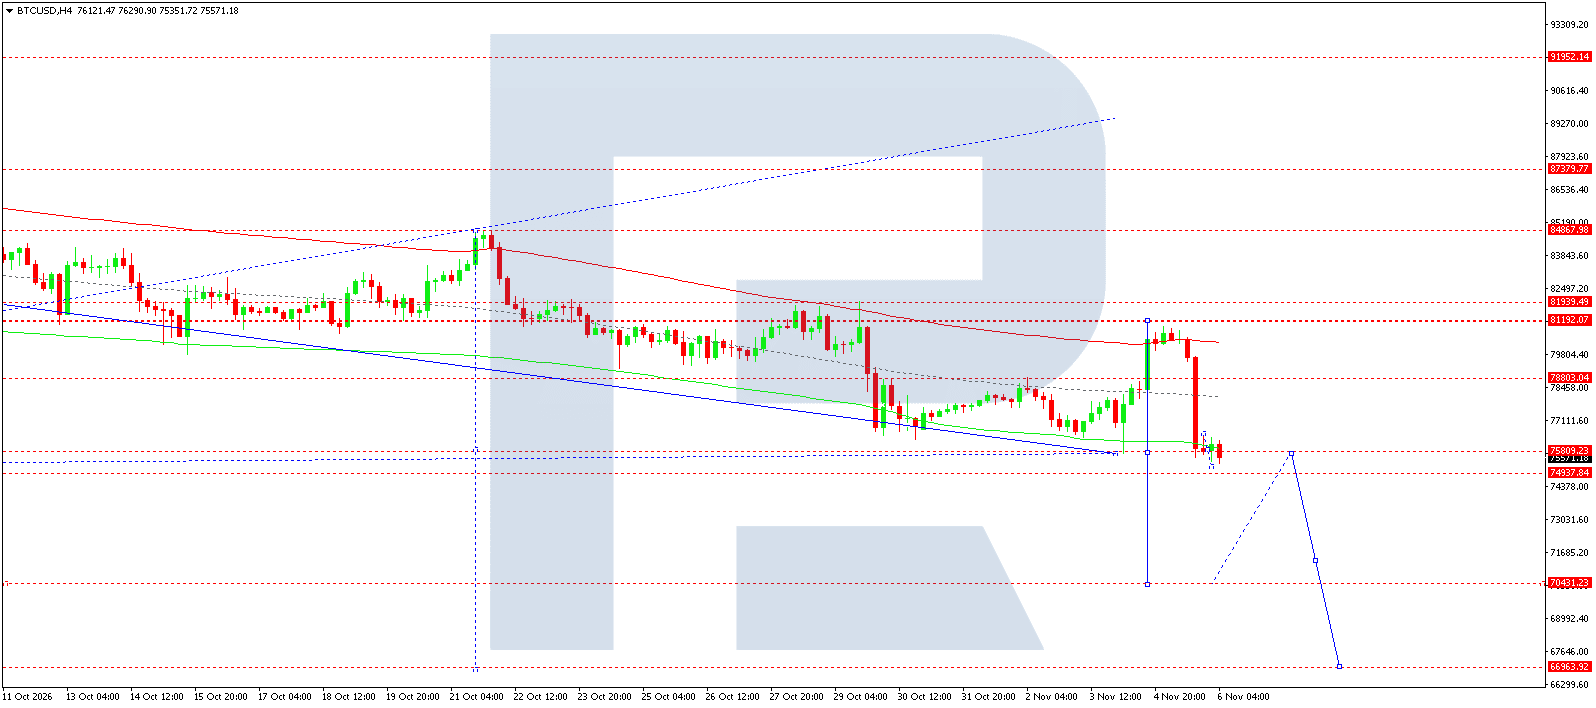
On the H4 chart, the latest price is 75,571. The recovery towards the 81,192 area ended with a new downward impulse, after which the market returned to support at 75,809 and consolidated slightly below it. The Price Envelope lines slope downwards, and the sequence of lower highs maintains a bearish bias. The nearest lower horizontal level is around 74,938, with the next significant target at 70,431 and a more distant target at 66,964.
The main scenario for the day suggests a continued decline if prices fail to recover above 75,809. A conditional Sell entry requires confirmation of selling pressure and a breakout below the nearest support level. A return above 78,300 would invalidate the chosen trading strategy and increase the likelihood of a recovery towards 81,192. The 70,431 target relates to the development of the current wave and may take several sessions to reach; the 66,964 level is considered only after a breakout below it.
BTCUSD forecast scenario
Editors’ picks


EURUSD forecast 2026–2027: technical analysis, price levels & predictions
The EURUSD outlook for 2026 and 2027: key levels on the daily chart, three trading scenarios and the policy gap between the Fed and the ECB that drives the pair.

Gold (XAUUSD) forecast 2026: technical analysis, price levels & predictions
Where gold could trade in 2026: key levels, three trading scenarios with entry triggers and the forecasts from J.P. Morgan, Deutsche Bank and Goldman Sachs.
Forecasts presented in this section only reflect the author’s private opinion and should not be considered as guidance for trading. RoboForex bears no responsibility for trading results based on trading recommendations described in these analytical reviews.