
Daily technical analysis and forecast for 9 November 2026
Daily technical analysis and forecast for EURUSD, USDJPY, GBPUSD, AUDUSD, USDCAD, XAUUSD, US 500, and BTCUSD for 9 November 2026.
Each scenario on this page reflects the market structure on the H4 chart as of 10:00 AM UTC+3 on 9 November 2026. The assessment considers the current H4 chart structure, key support and resistance levels, the direction of the medium-term movement, and the prevailing fundamental backdrop.
EURUSD forecast
At the start of 9 November, the fundamental outlook for the euro is shaped by interest rate differentials and the consequences of the energy shock. On 29 October, the European Central Bank kept its deposit rate at 2.50%, noting the simultaneous risks of accelerating inflation and slowing growth due to expensive energy. On 28 October, the US Federal Reserve maintained its policy rate range at 3.75–4.00%. The US dollar retains its yield advantage, although this alone does not determine the direction of every trading session.
The US employment report published on 6 November showed an increase of 165,000 jobs and an unemployment rate of 4.1%. These data weaken expectations of imminent Fed policy easing. The European currency also remains constrained by the economy's sensitivity to the cost of imported energy. A geopolitical escalation could simultaneously worsen the outlook for European demand and increase the appeal of US dollar liquidity. A reversal in oil prices and a decline in US yields could support a euro recovery. The fundamental bias is therefore considered moderately negative, although a corrective rise before selling resumes remains possible. Its sustainability will depend on subsequent data and the bond market's reaction.
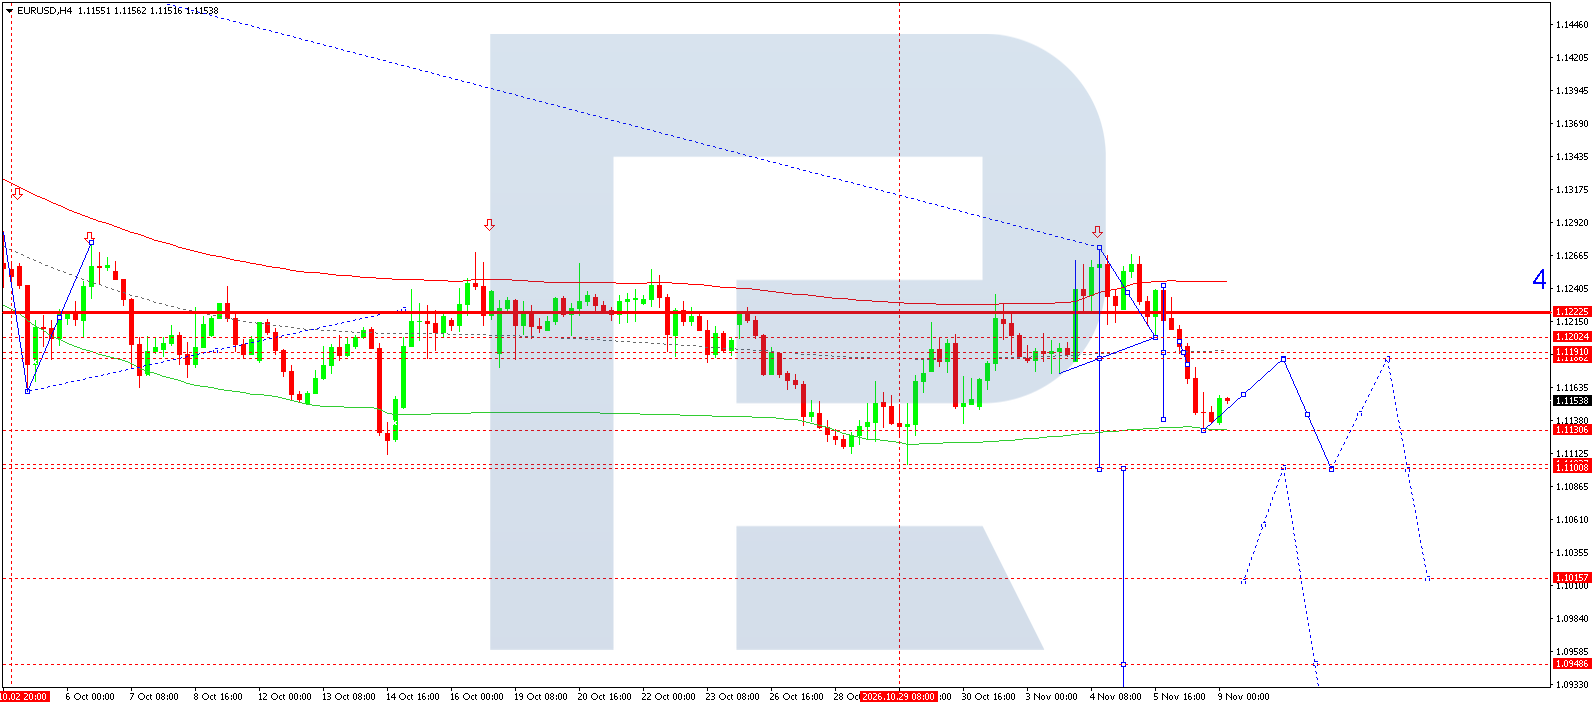
On the H4 chart shown, the latest price is 1.1154. The decline from November's high brought the pair to support at 1.1130, after which a rebound began. The price remains below the Price Envelope's centre line and the 1.1180–1.1202 resistance area. This structure preserves sellers' advantage despite the local recovery.
The main scenario for 9 November allows for a continuation of the correction towards 1.1180–1.1182, followed by a return to 1.1130. A breakout below that support would open the way towards 1.1100. The 1.1016 and 1.0949 levels are considered only as more distant objectives if the trend develops further. Reaching all targets in a single session is not expected.
The proposed Sell entry below the current price is intended to capture a resumption of the decline. The stop is above the nearest corrective target. An H4 consolidation above 1.1202 would weaken the bearish interpretation, while a recovery above 1.1223 would require the structure to be reassessed. The marked wave structure remains a working hypothesis: without the indicator's parameters, the Wave Matrix calculation cannot be independently verified. Intraday direction will be clarified by price reactions at nearby levels. Until a decisive breakout from the range, the likelihood of repeated tests of its boundaries remains elevated throughout the session.
EURUSD forecast scenario
USDJPY forecast
For USDJPY, the determining fundamental factor remains the gap between US and Japanese interest rates. On 30 October, the Bank of Japan kept its short-term policy rate target at around 1.25%. One voting member supported an increase to 1.50%, indicating that there are arguments in favour of further tightening. However, the current rate remains substantially below the Fed's range, sustaining the appeal of US dollar instruments.
October's US employment data do not indicate a sharp deterioration in the labour market. Buying the dollar on pullbacks therefore remains fundamentally justified. At the same time, continued normalisation of Japanese monetary policy could gradually limit gains in the pair. What matters is not only the current rate differential but also changing expectations about its future size.
Geopolitical risks have mixed effects. More expensive imported energy worsens Japan's terms of trade, while a reduction in risk positions may be accompanied by the unwinding of yen-funded carry trades. Safe-haven demand for the yen could therefore temporarily outweigh the interest rate factor. At the start of the day, the fundamental balance allows for USDJPY gains but does not rule out sharp counter-moves as market sentiment changes on Monday.
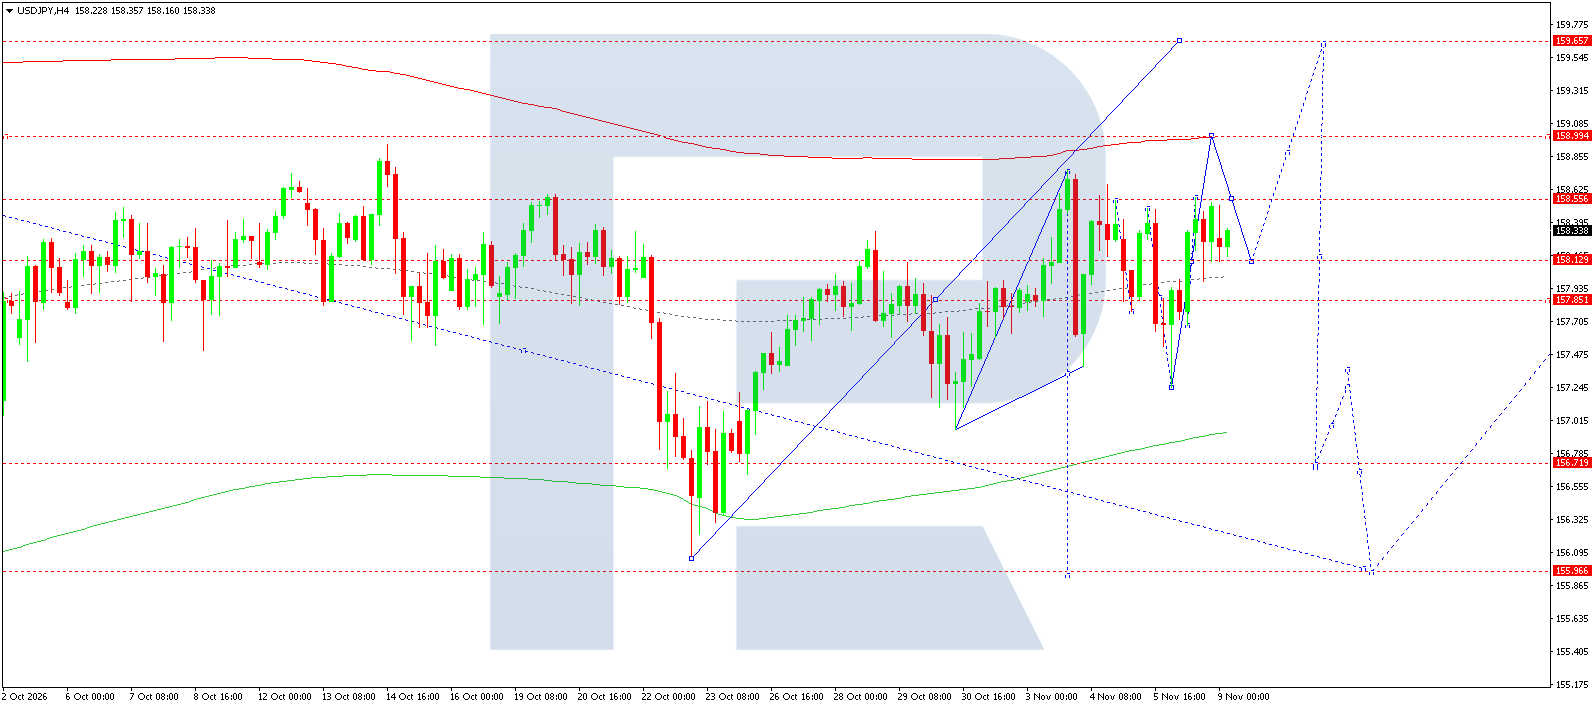
On the H4 chart, the latest price is around 158.34. Following a recovery from October's low, the market formed a broad consolidation range, with the nearest resistance at 158.55. Support levels are at 158.13 and 157.85. The Price Envelope's centre line is gradually turning upwards, although price movements remain uneven.
The main scenario for 9 November envisages holding above 158.13 and another attempt to break through 158.55. Consolidation above this resistance would open the way towards 158.99. The next target of the upward structure is 159.66, which may take several sessions to reach. After a test of 158.99, a return to 158.13 is possible before another rise.
A Buy entry above the latest price represents an early continuation of the recovery and does not imply that a breakout above 158.55 has already occurred. The stop is placed below support at 157.85. Losing this area would worsen the short-term picture and increase the likelihood of a decline towards 156.72. The 155.97 level remains a more distant support in the alternative scenario. The wave count is consistent with an attempted rise but does not, by itself, confirm that the correction has ended. An important confirmation would be the ability to hold above broken resistance on a retest while maintaining a sequence of higher local lows.
USDJPY forecast scenario
GBPUSD forecast
The fundamental backdrop for sterling combines support from tighter UK monetary policy with constraints arising from energy risks. On 5 November, the Bank of England raised its interest rate from 3.75% to 4.00%. The decision reflects concerns about persistent inflationary pressure. September inflation was 3.5%, and the November forecast allows for an increase to approximately 5% by the middle of next year.
For GBPUSD, the rate increase provides positive interest rate momentum. However, it simultaneously increases the burden on borrowers and restricts domestic demand. If expensive energy continues to erode households' real incomes, the yield-based support for sterling may prove insufficient. The BoE specifically links its future decisions to the pass-through of higher energy costs to wages and other prices.
On the US side, resilient employment supports the dollar and makes it more difficult for the pair to establish a convincing uptrend. Geopolitical de-escalation and a sustained decline in energy prices could improve the UK's outlook. For now, the fundamental picture remains mixed: sterling has grounds for a corrective recovery, but the dollar retains support if global risk appetite deteriorates during Monday's session.
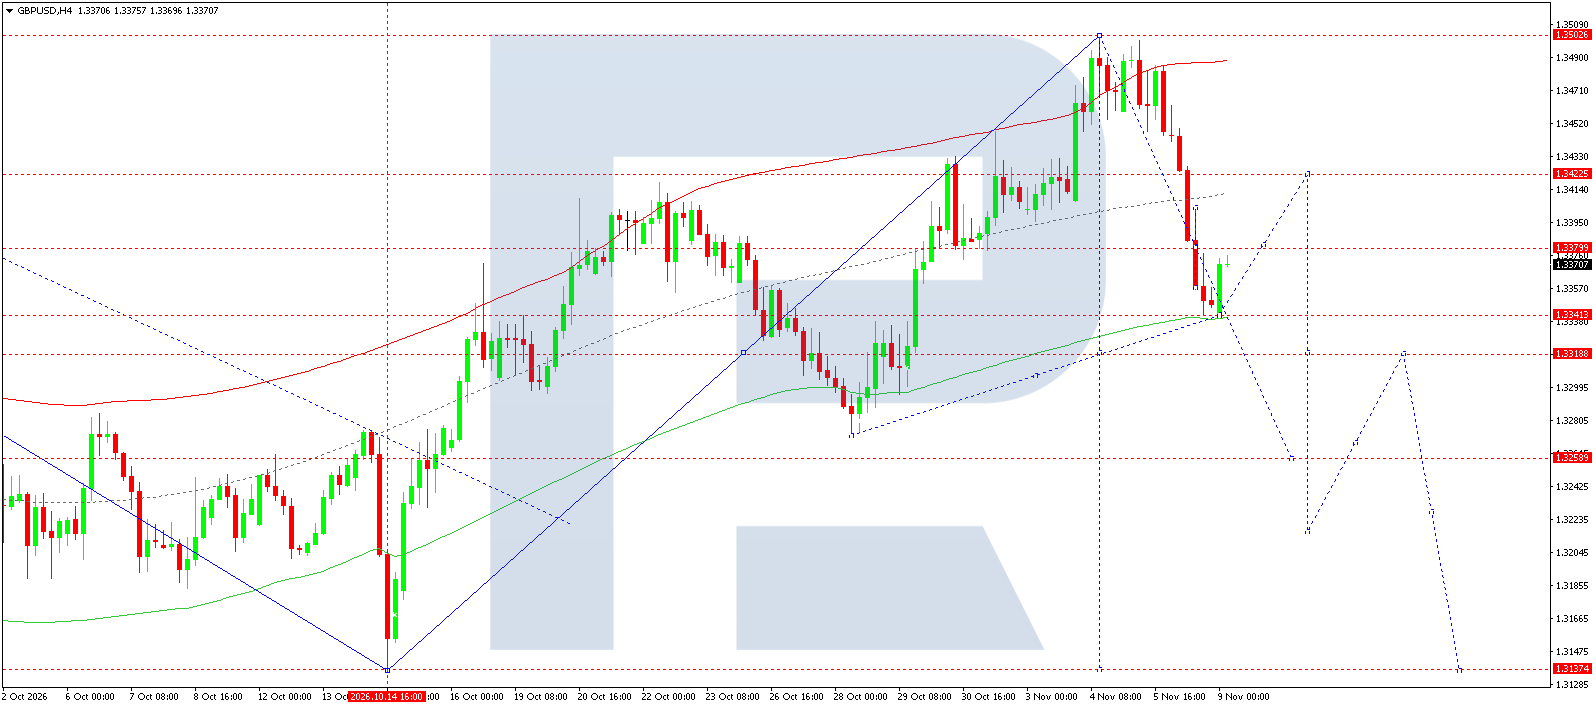
On the H4 chart, the latest price is 1.3371. The market fell sharply from 1.3503 to 1.3341 and began recovering above the Price Envelope's lower boundary. The previous ascending structure has been disrupted, and the nearest resistance lies at 1.3380. A more significant supply area extends across 1.3411–1.3423.
The base scenario for 9 November allows for a corrective rise towards this area, followed by a resumption of the decline. The nearest support is at 1.3341, followed by 1.3319. A breakout below the latter would open the way towards 1.3259. These horizontal levels are more clearly visible in the chart than the 1.3311 and 1.3233 targets given in the original example.
The proposed Sell entry below the latest price is aimed at an early return of sellers. The stop is placed above 1.3423 to allow for a preliminary rebound. An H4 consolidation above this area would weaken the bearish scenario and shift attention back to 1.3503. The trade target relates to a continuation of the wave and may not be reached intraday. The wave structure should be assessed alongside candlestick reactions to resistance and the nature of breakouts below nearby support levels. A weak rebound would provide further support for sellers' advantage today.
GBPUSD forecast scenario
AUDUSD forecast
On 3 November, the Reserve Bank of Australia raised its rate by 25 basis points to 4.85%. The regulator noted widespread inflationary pressure and revised its price forecast upwards. Inflation is now expected to return to the upper boundary of the target range only by the end of 2027. This supports the Australian dollar's interest rate appeal and weakens the case for rapid policy easing.
However, the rate increase comes against a backdrop of economic slowing, declining house prices, and rising unemployment. For AUDUSD, this means two opposing forces: higher yields support the currency, while worsening demand prospects limit investor interest. The RBA also points to risks related to energy supply disruptions and the duration of the Middle East conflict.
The external environment also remains important through Chinese demand, commodity markets, and global risk sentiment. A strong dollar and the reduction of speculative positions could outweigh the positive effect of Australia's interest rate. The fundamental balance therefore allows for a rebound after the decline but does not yet provide sufficient grounds to regard sustained AUDUSD appreciation as the base scenario for the current session.
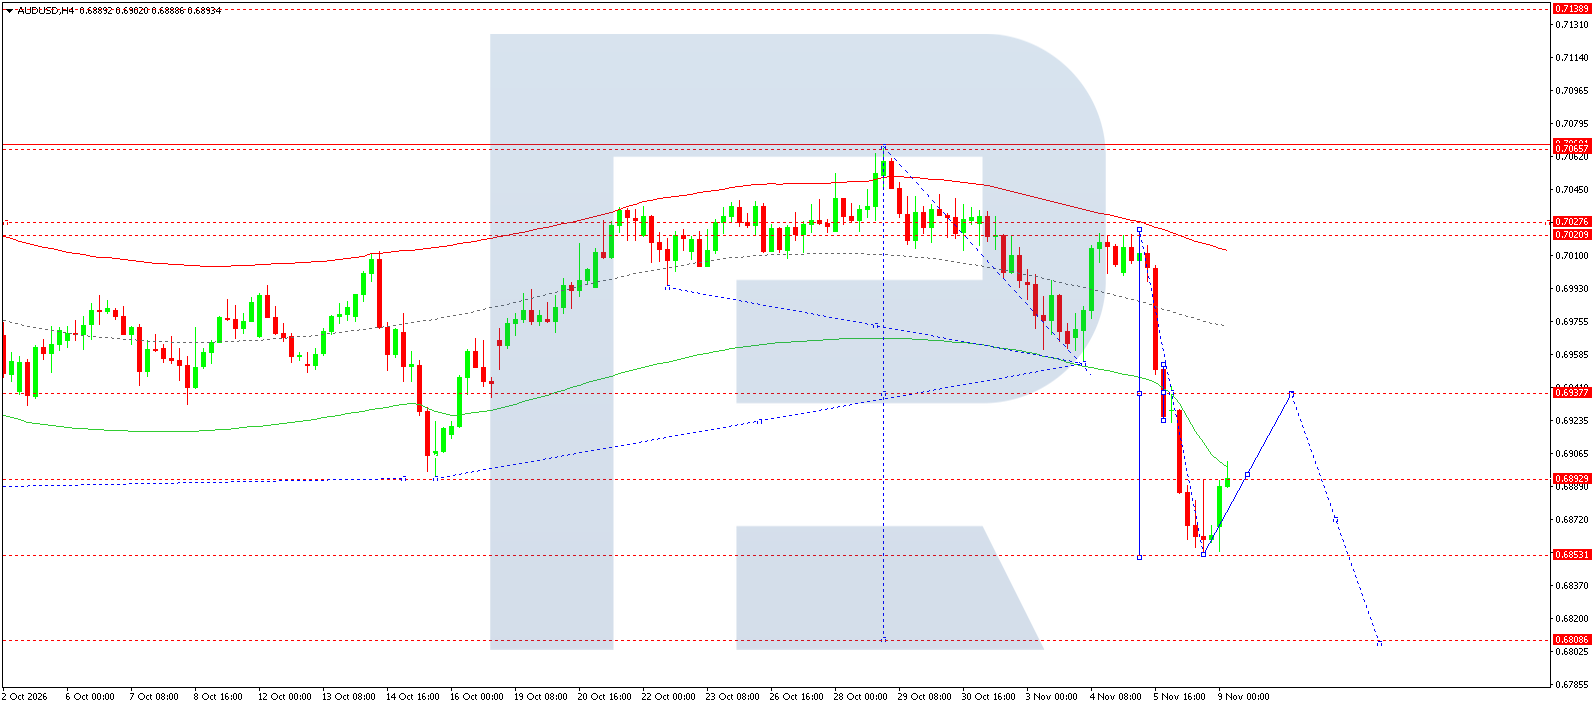
On the H4 chart, the latest price is 0.6893. After a breakout below 0.6937, sellers drove the market down to 0.6853, from which a recovery is developing. The price remains below the Price Envelope's centre line, and its lower boundary slopes downwards. This is consistent with the continuing downward impulse.
On 9 November, a corrective rise towards 0.6937 is likely, with a retest of the broken support from below. As long as prices remain below this level, the recovery is viewed as part of the bearish structure. Renewed selling would take the pair first towards 0.6853 and then towards 0.6808. The latter level is an extension of the scenario and is not a mandatory target for the current session.
The Sell entry below the latest price anticipates the nearest rebound ending before a full test of 0.6937. The stop is above this area, allowing for a substantial move against the position. A return and H4 consolidation above 0.6937 would warrant caution, while a move through 0.7021–0.7028 would materially change the trend assessment. A breakout below 0.6853 should preferably be confirmed by a candlestick close: a brief move below support could prove false. The wave count describes the sequence of impulse and correction, and the projected path remains conditional until the nearest breakout is confirmed.
AUDUSD forecast scenario
USDCAD forecast
On 28 October, the Bank of Canada raised its policy rate by 25 basis points to 2.50%. The decision was made against a backdrop of more resilient economic activity and increasing inflation risks. The regulator attributes a significant part of the pressure to expensive energy and the pass-through of production costs to consumer prices. Further rate increases remain possible, although decisions will be taken cautiously.
Tighter policy supports the Canadian dollar, but yields on US instruments remain higher. The resilience of the US labour market also limits expectations of rapid Fed rate cuts. This combination allows the US dollar to retain its advantage even after the Canadian increase.
Oil is an important counterweight. Higher energy export revenues usually improve fundamental conditions for the Canadian currency. However, the BoC also highlights trade uncertainty and the expected impact of new US tariffs on economic activity. Lower oil prices or weaker global demand could undermine the CAD. At the start of the day, the fundamental assessment remains moderately favourable for USDCAD, although further appreciation requires confirmation from dollar and commodity market movements during the session.
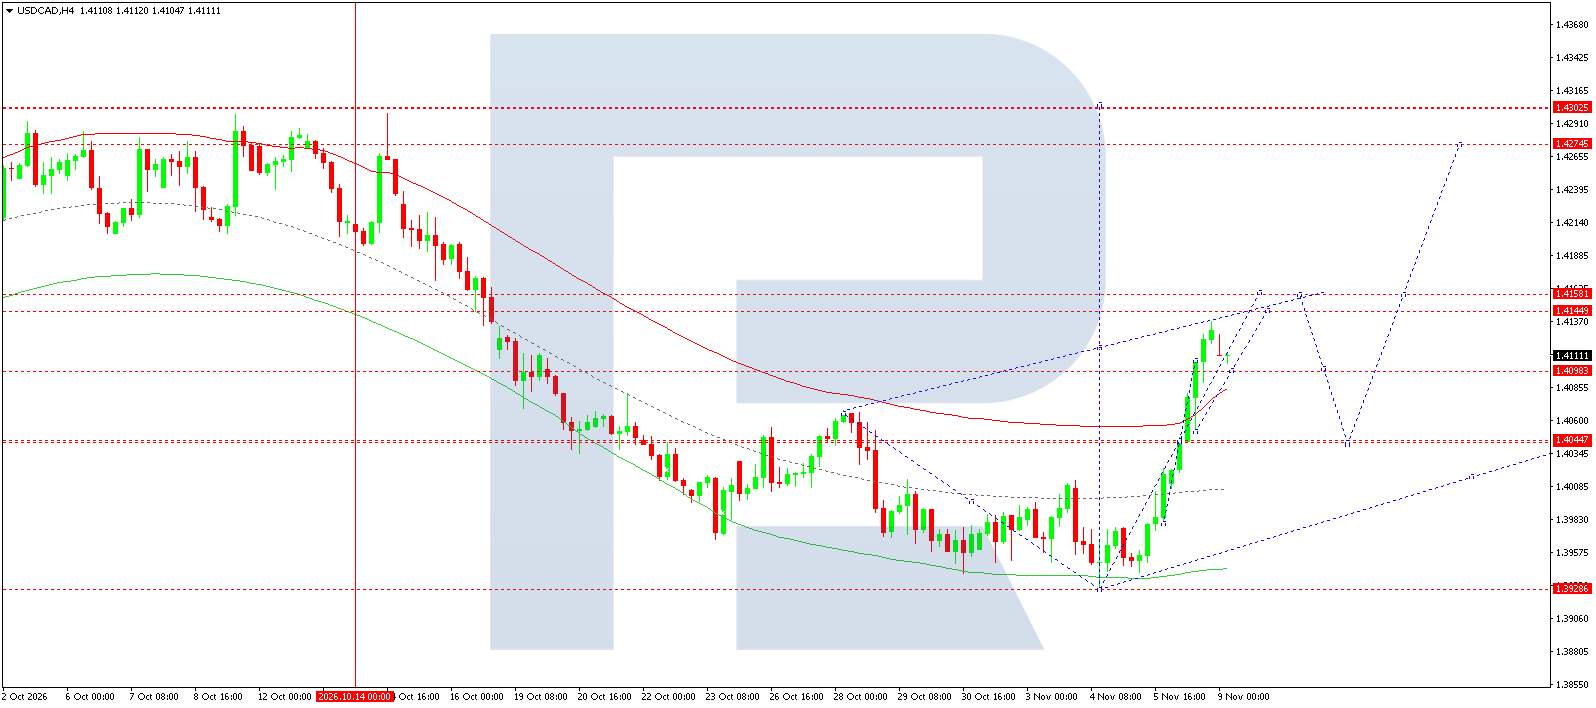
On the H4 chart, the latest price is 1.4111. After establishing a base near 1.3929, the pair rose sharply, broke through 1.4044, and moved above the Price Envelope's upper line. The recovery indicates a shift in the local impulse, although the previous prolonged downward structure still requires reassessment.
The main scenario for 9 November envisages consolidation above 1.4098 and an attempt to extend gains towards 1.4145–1.4158. This is the nearest resistance area marked on the chart. The 1.4177 target cited in the original example does not coincide with the nearest labelled horizontal levels.
The Buy entry above the latest price is aimed at a continuation of the impulse while support at 1.4098 holds. The stop is below this level. Once resistance has been reached, a deeper correction towards 1.4044 is possible; such a pullback should not be confused with an inevitable immediate reversal downwards. Consolidation below 1.4044 would weaken the bullish interpretation. The more distant target at 1.4275 is considered only after a sustained breakout above 1.4158. The wave structure allows for alternating rises and corrections, so buying requires monitoring nearby support and ensuring that there is no sharp return into the previous range at the start of the week.
USDCAD forecast scenario
XAUUSD forecast
Gold's fundamental picture is shaped by opposing forces from US dollar yields and safe-haven demand. Following the Fed's October decision, US interest rates remain elevated, while the latest employment statistics do not show a sharp weakening of the economy. This limits the appeal of the metal, which earns no interest. Stronger expectations of further tightening could create additional pressure.
At the same time, energy supply disruptions and uncertainty in the Middle East sustain demand for capital-protection instruments. Their impact on gold is mixed: rising inflation concerns support the metal, but higher expected real yields have the opposite effect. A geopolitical headline alone therefore does not guarantee rising prices.
The dollar's reaction and changes in US bond yields are important for assessing today's movement. A decline in both would improve conditions for a gold recovery. Dollar strength would make it harder to break through nearby resistance. As investors reduce risky positions, the metal may also be sold to raise liquidity. At the start of 9 November, the fundamental balance allows for a continued rebound, but a sustained uptrend requires confirmation. No advance assumptions are made here about new reserve purchases or current fund flows.
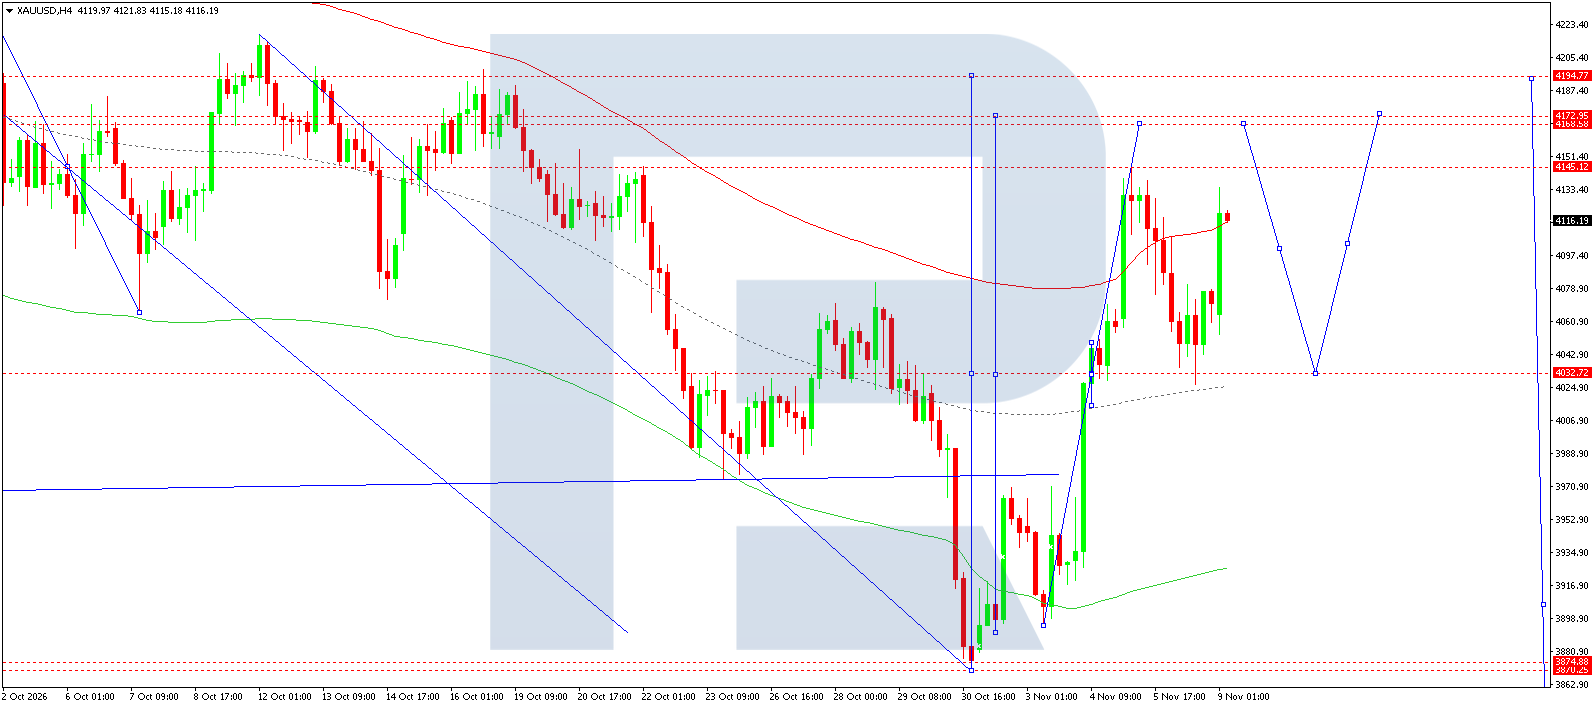
On the H4 chart, the latest rounded price is 4,116. The market recovered from the October low near 3,875, reached the 4,145 area, and subsequently corrected towards 4,033. The latest impulse has again brought prices back towards the Price Envelope's upper line. The local structure has improved, although the previous decline remains relevant.
The main scenario for 9 November envisages the nearest upward impulse holding and another test of 4,145. A breakout above this resistance would open the 4,169–4,173 area. The trading plan uses a target of 4,172, within that zone. The next reference level above is 4,195.
The Buy entry above the latest price seeks to capture a continuation of the recovery. The stop is located below the nearest pullback area following the impulse, rather than below the distant base of the entire structure. If buyers fail to sustain the move, the market could head back towards 4,033. A loss of that support would worsen the outlook for gains and bring the 3,975 area back into focus. After 4,172 has been reached, another correction towards 4,033 is possible; the full sequence of moves may take several sessions. The wave count remains a scenario model, with confirmation coming from the price reaction at 4,145.
XAUUSD forecast scenario
US 500 forecast
For US equities, the fundamental backdrop remains sensitive to the cost of capital and expectations for future earnings. The Fed's continued elevated interest rate limits the potential for market valuation multiples to expand. October's employment report showed resilient US labour demand, so the case for a rapid reduction in financing costs remains limited. At the same time, economic resilience supports corporate revenues.
Another factor is the reassessment of investment in artificial intelligence. In its October review, the Bank of Canada noted stock and credit market volatility arising from uncertainty about the sector's prospects. For the broad index, concentration in large technology companies amplifies the effect of such shifts in sentiment. Lower expectations for returns on capital expenditure could outweigh positive trends in current indicators.
Geopolitics affects the market through energy costs, inflation, and investors' willingness to hold risk. Sustained declines in energy prices could support the consumer sector, but renewed escalation would worsen the balance of risks. At the start of 9 November, the fundamental assessment remains cautious. A potential recovery after the sell-off requires confirmation from the breadth of demand, bond yield movements, and the resilience of corporate earnings expectations in the forthcoming reporting periods.
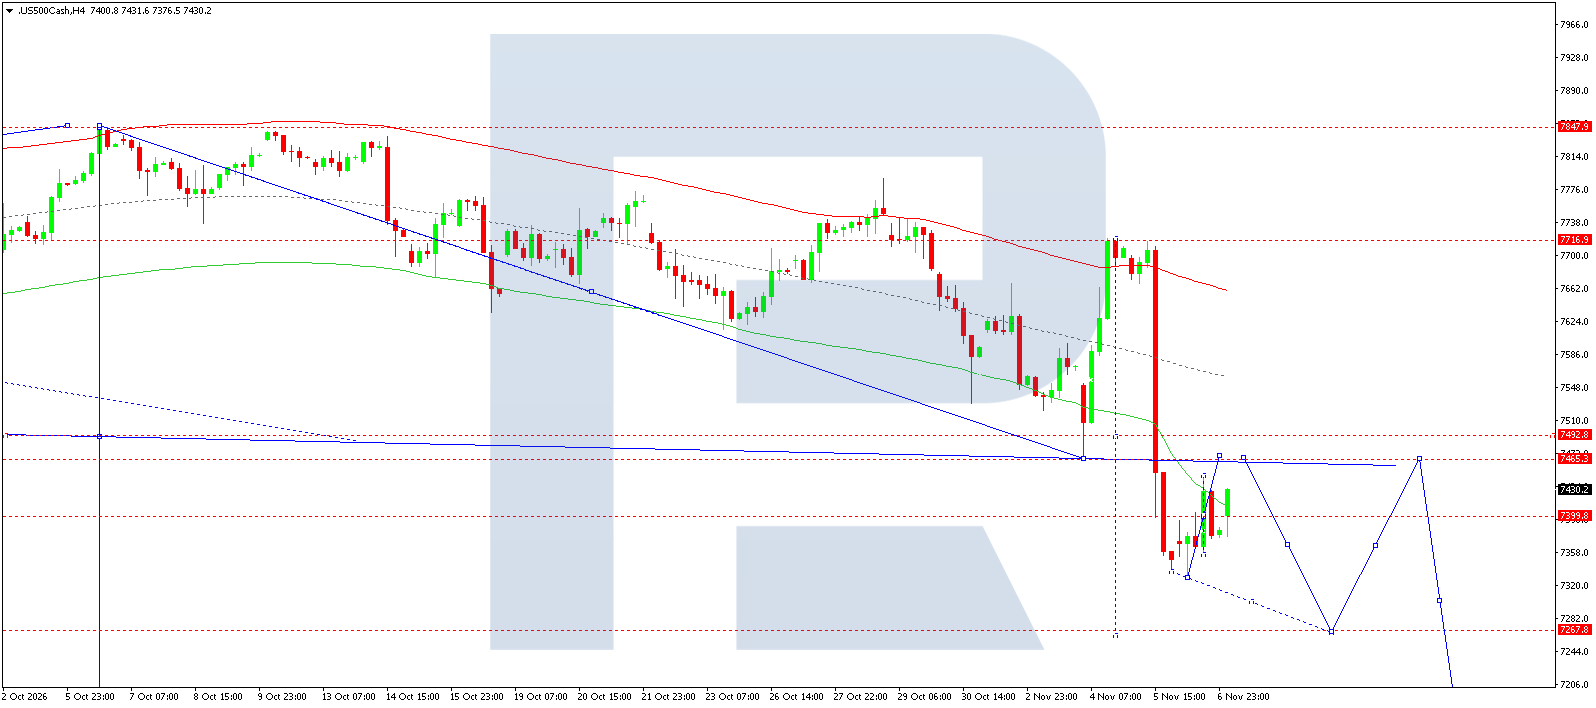
On the H4 chart, the latest rounded US 500 price is 7,430. Following a sharp decline from the 7,717 area, the market formed a low near 7,330 and began recovering. Prices remain below the Price Envelope's centre line, and the nearest resistance runs through the 7,465–7,493 area. The main local trend remains downward.
The base scenario for 9 November allows for the correction to end in this area, followed by a return of sellers. The nearest support is 7,399, after which attention will shift to 7,330 and 7,268. The 7,135 and 7,070 levels relate to an extended scenario of further declines and lie beyond the lower visible area of the chart.
The Sell entry below the latest price aims to capture an early resumption of the decline. The stop is placed above resistance at 7,465, so a deeper rise towards 7,493 would close the trade before the bearish structure is fully invalidated. This is a separate limitation of the trading plan. H4 consolidation above 7,493 would require the scenario to be reassessed. Reaching the 7,268 target may take several sessions.
US 500 forecast scenario
BTCUSD forecast
At the start of 9 November, Bitcoin's fundamental picture remains subdued because demand through US exchange-traded funds has weakened. According to Farside Investors, net outflows from spot funds over 2–6 November amounted to approximately 1,282 million USD. On Friday, net redemptions reached around 412 million USD. Four of the five trading days ended with negative flows.
This pattern indicates reduced investment through this channel, although it does not measure total Bitcoin demand. At the same time, resilient US employment and the elevated cost of dollar funding limit the appeal of risky assets. If investors continue reducing positions in the technology sector, the pressure could spread to cryptocurrencies as well.
A recovery would require global risk sentiment to stabilise and persistent fund redemptions to cease. New inflows could improve the demand balance, but the results of the US session on 9 November were not yet known in the morning. Geopolitical uncertainty could also increase demand for liquidity. The fundamental bias therefore remains moderately negative, although sharp rebounds are possible following the steep decline without definitively changing the market's main direction.
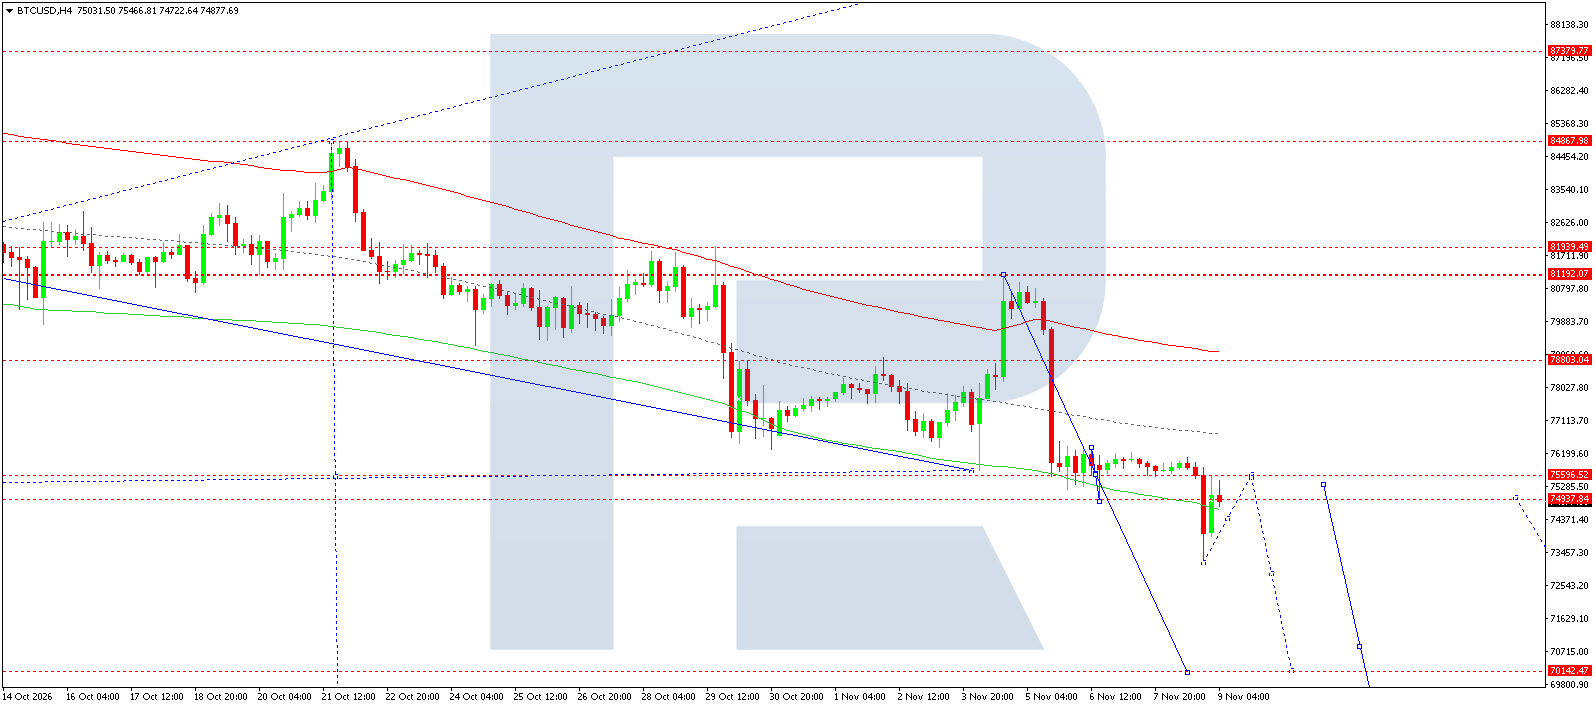
On the H4 chart, the latest rounded price is 74,878. The market continues to form a sequence of lower highs and lower lows. A rebound appeared after the decline towards the 73,213 area, but prices remain below the Price Envelope's centre line and resistance at 75,597. The nearest interim reference level is around 74,958.
The main scenario for 9 November allows for a continued recovery towards 75,597, followed by a return of sellers. Failure to consolidate above this level would preserve the likelihood of another test of 73,213. A breakout below the local low would open the way towards 70,142. This target relates to a continuation of the downward wave and may take several trading days to reach.
The Sell entry below the latest price is designed to capture an early resumption of the decline. The stop is above 75,597 to allow for a preliminary corrective move. A sustained H4 close above resistance would worsen conditions for selling and shift attention towards 78,803. The wave trajectory on the chart describes a possible sequence but does not specify exactly when the targets will be reached.
BTCUSD forecast scenario
Editors’ picks


EURUSD forecast 2026–2027: technical analysis, price levels & predictions
The EURUSD outlook for 2026 and 2027: key levels on the daily chart, three trading scenarios and the policy gap between the Fed and the ECB that drives the pair.

Gold (XAUUSD) forecast 2026: technical analysis, price levels & predictions
Where gold could trade in 2026: key levels, three trading scenarios with entry triggers and the forecasts from J.P. Morgan, Deutsche Bank and Goldman Sachs.
Forecasts presented in this section only reflect the author’s private opinion and should not be considered as guidance for trading. RoboForex bears no responsibility for trading results based on trading recommendations described in these analytical reviews.